1. Introduction
Glass wool is one of the best-known insulation materials, and its use is significant from the insulation of buildings to more special needs, such as industrial and appliance thermal and acoustic insulations. The invention can be dated back to 1929, and it is still an expanding industry [
1]. The manufacturing of glass wool uses mainly natural sand and waste glass, which is molten for fiber formulation and collection. The finishing steps are spraying an organic binder that helps to maintain the fibers together and the curation of the surface. The product can be cut into the desired size and shape afterward [
2].
Fresh analysis estimates that the mineral wool (it is also important to clarify that, in some literature sources, mineral wool includes both glass wool as well as rock and slag wool, whereas in some cases, the term mineral wool is used only to refer to rock wool [
2]) industry, including glass wool, will be worth USD 33.2 billion by 2030, with a CARG (compound annual rate of growth) of 5.4% from 2024 to 2030. The primary forces propelling this market include the rise in construction projects worldwide, the enforcement of strict governmental regulations, and the focus on energy efficiency in accordance with emission reduction initiatives [
3]. The expansion of this industry also means that an increasing amount of waste will be generated; in Europe, approximately 2.5 million tons of mineral wool waste is produced annually [
4].
The demand for recycling technologies has emerged in line with the UN 2030 Sustainable Development Goals (SDGs), which consist of 17 SDGs focusing on various approaches to creating a better world. Among these goals, number 12 specifically addresses waste management. Target 12.5 seeks to significantly decrease waste generation by emphasizing prevention, reduction, recycling, and reuse. Additionally, the EU’s waste policy promotes a circular economy to maximize resource extraction from waste, aligning with the Green Deal’s objective of achieving climate neutrality by 2050. As per the EU waste hierarchy, landfilling is considered the least favorable option and should be reduced to an essential minimum. The Landfill Directive imposes restrictions on landfilling any recyclable or energy-recoverable waste starting in 2030.
In addition to the aforementioned aims and directives, at the end of its life cycle, the landfilling of this material is not an acceptable solution in the original form of the waste because of the expensive transporting fees and considerable space requirement, as it has low bulk density. The recycling of glass wool in its original form is a fundamental issue, as it cannot be remelted due to the foaming caused by the thermosetting polymer coating, typically referred to as the binder. Another noted problem is clogging in the feed system of the furnace due to fine particle fibers [
4,
5]. Therefore, the removal of the binder makes the recycling of the glass itself viable.
The resins of the coating are mostly created by the condensation of aromatic hydroxy derivates and aldehydes, typically phenol and formaldehyde. Phenol-formaldehyde-urea is also a common binder, but some alternative binders are also known, such as sodium silicates, polyesters, melamine urea formaldehyde, polyamides, and furane-based resins. Various additives could be present in the matrix of the material [
6]. On the other hand, a distinction must be made between traditional and new-generation mineral wools because, since 1998, new-generation insulation materials must have biological solubility [
7].
A considerable amount of research focus was put on finding ways to reuse waste glass wool and mineral wool instead of dumping it in landfill. Most of the known methods are related to the construction industry, but there is also a growing interest in chemical methods, offering possible benefits from recovering the glass fibers. For example, Wurzer Umwelt GmbH Eitting submitted a patent for a compressing method that decreases the volume of waste for optimized recycling and transport [
8,
9]. Creating briquets could also decrease the size of the waste, and numerous investigations have been carried out on that topic. This solution could prevent clogging in the remelting process, but it can only be used on manufacturing waste as we need to know the composition of the waste for remelting. These patents use binders to create the briquets, adding more components to an already complex matrix [
10,
11].
As a recycling opportunity, it has been proven that AAMs (alkali-activated materials) can be made without removing the binder from the fibers. These products can be used as construction material in a sustainable future from glass and stone wool waste [
12,
13,
14,
15]. Other literature examples showed that geopolymers and building ceramics could be made using waste mineral wool in the proposed composites. The products had beneficial properties in some cases, such as better mechanical properties and lower energy requirements for sintering [
16,
17,
18,
19,
20,
21]. In contrast, others aiming to achieve a sustainable society examined the potential reprocessing of glass wool waste for automotive purposes by compressing it into boards that can be used in construction and have the same noise absorbance coefficient as an open-cell foam board formed by a hot-press foaming method [
22].
To avoid over-reuse in the construction field, chemical methods in waste glass wool valorization must be considered. Jacques et al. provide a patent for a thermochemical recycling route that aims to produce new mineral wools or cement materials using a special furnace to remelt the waste. The chemical composition and physical properties of the input are critical parameters in the technology, influencing the processing steps and chemical reactions of the material [
23]. Wajima et al. implemented a type of pyrolysis technology for decomposing the waste using sodium hydroxide. The products were gases originating from the binder (methane, hydrogen, etc.), while the fibers were transformed into soluble salts with a treatment above 400 °C for 1–6 h [
24].
These chemical methods are promising technologies for decomposing the waste, but in our method, we considered how to recover both the fibers and the binder component from the glass wool waste. To this end, we aim to develop a solvolysis process using flowing subcritical water. Hydrolysis of the binders can occur with sub- or supercritical water with acid or metal catalysis. Widely studied solvolysis processes other than hydrolysis include aminolysis and alcoholysis, but using the greenest solvent is beneficial from an environmental point of view [
25]. Water is safe, non-toxic, easily accessible, and cheap. Pressurized water with a temperature above its normal boiling point and supercritical water can also have significant uses. The critical properties of water are 374 °C and 22.1 MPa. Sub- and supercritical water solvolysis/hydrolysis, also called hydrothermal treatment, is a well-known method in plastic waste valorization. The invention can be dated back to the time when pyrolysis methods were also under investigation [
26]. High-temperature and -pressure water is also used in Wet Air Oxidation (WAO) and Supercritical Water Oxidation treatments. These are well-established technologies used on industrial scales to detoxify hazardous wastes and military armaments [
27].
Supercritical and subcritical fluids could offer advantages in solvolysis processes with excellent solvent properties such as high heat capacity, efficient heat transfer, and rapid mass transfer due to their unique physical properties compared to gas or liquid media. Supercritical solvents are favorable over traditional liquid solvents by allowing adjustment of properties through pressure changes without altering the composition. Above critical conditions, a single fluid phase eliminates mass transport limitations between phases, enabling higher reactant concentrations compared to liquid solvents [
28,
29]. Tagaya et al. started investigating phenolic resin hydrolysis in the 1990s and succeeded in decomposing the prepolymers and proved the role of water in the mechanism with deuterated sub- and supercritical water [
30,
31,
32].
Herein, we propose a robust method for end-of-life glass wool valorization using subcritical water.
3. Results and Discussion
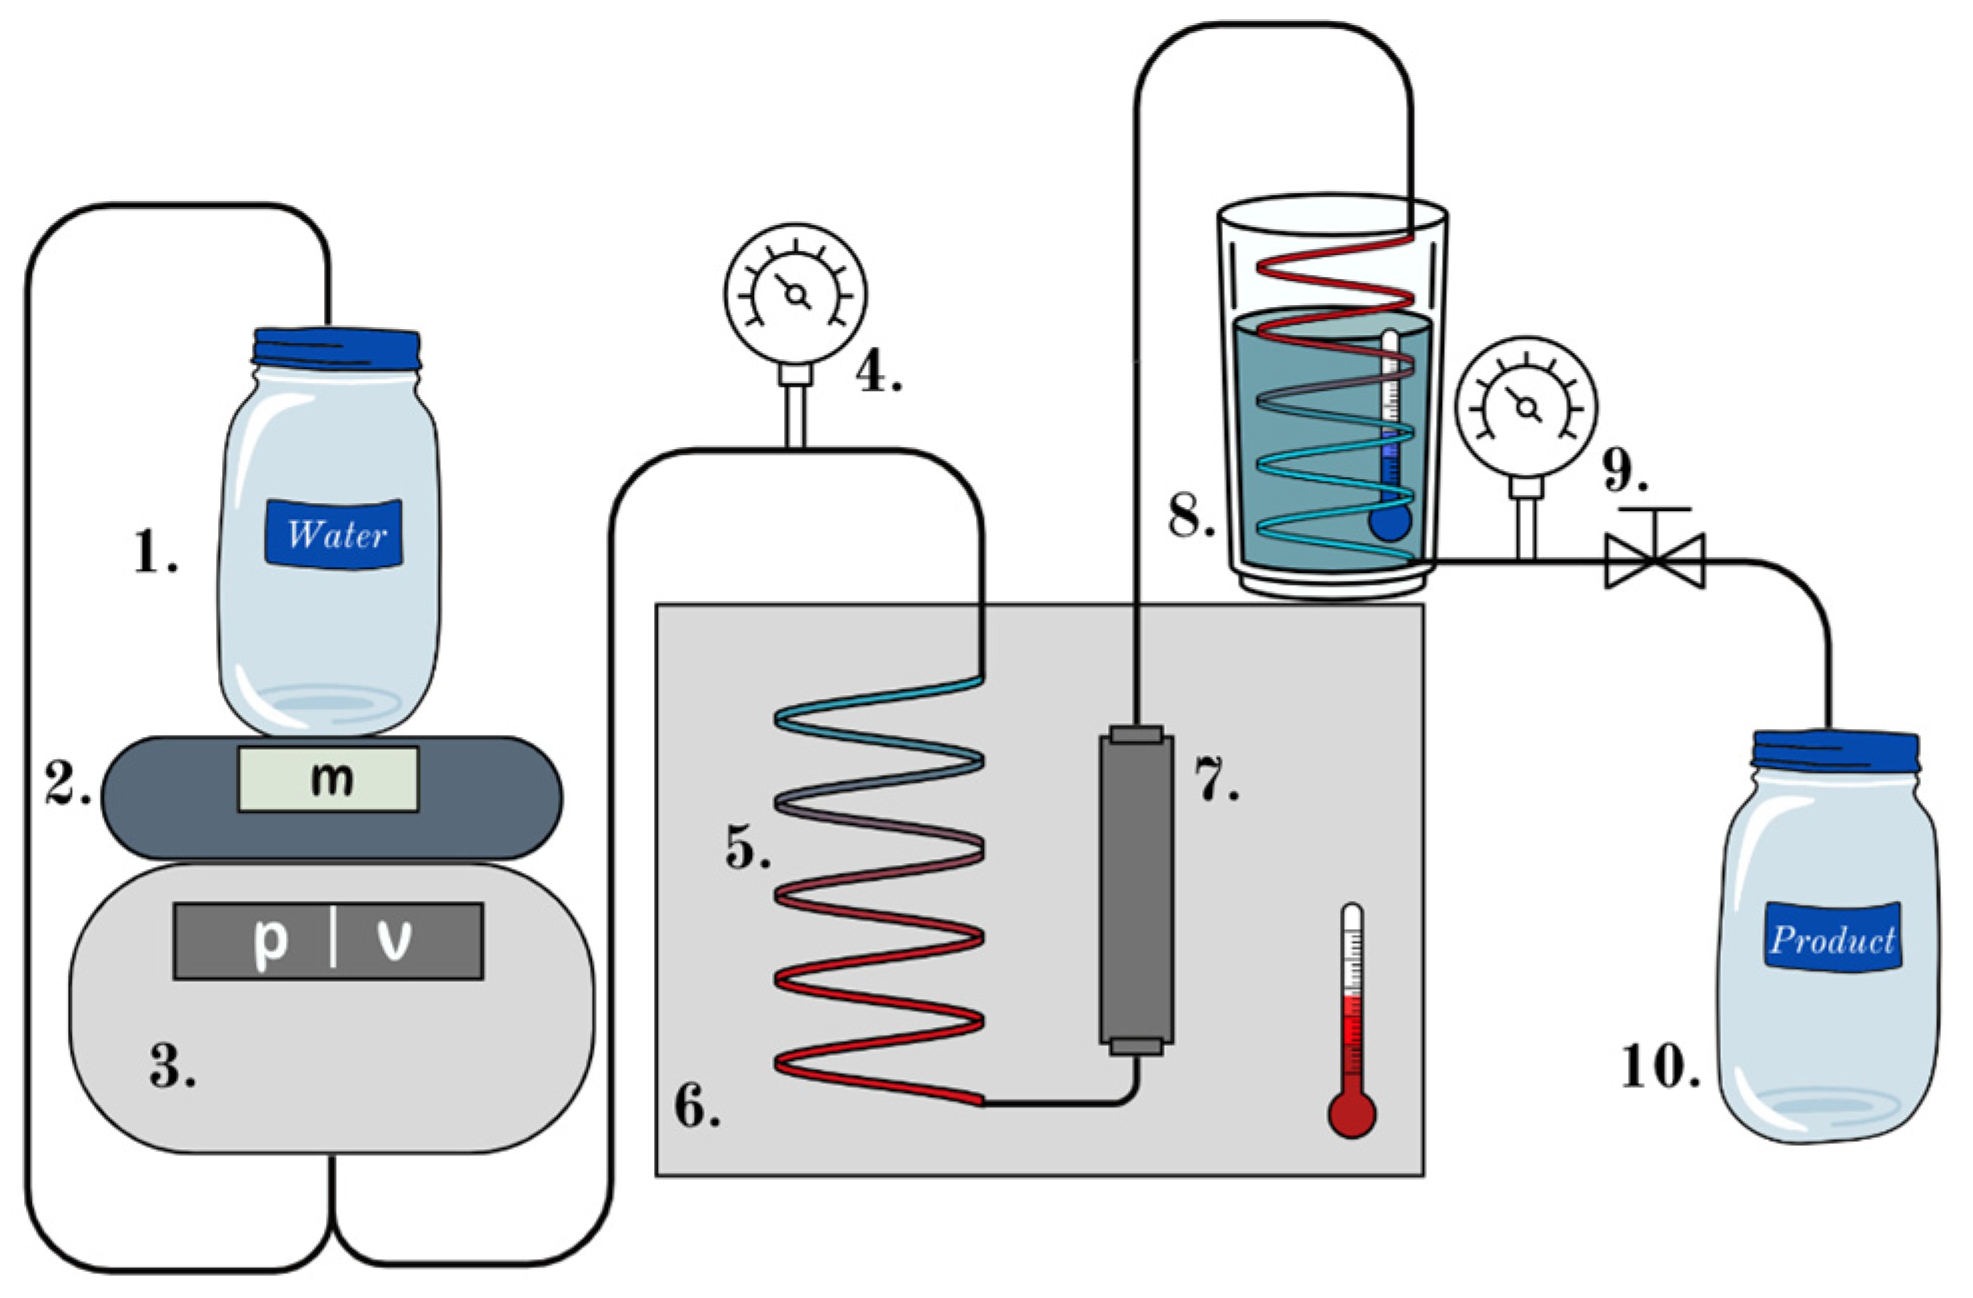
Our intention was to recover clean glass fibers that can be melted again without any binder on the fiber surfaces. To achieve this, we used subcritical water in a flow device to hydrolyze the resin to investigate the effects of temperature, the fluid ratio, and the effect of mass flow and to test our method on wastes of various origins. The method was developed on U wool.
Chemical analysis of the decomposition products of waste glass wool binders suggests that all were various phenolic resins containing as well bisphenol A. The light components identified by GC-MS are shown in
Figure 2.
1-phenoxy-propan-2-ol and acetone could also originate from certain bisphenol A epoxy resin components. Towards the latter part of the analysis, the spectrum is obscured by polyglycerol background noise due to the strong interaction of polyglycerols with the RTX-5 column, leading to inefficient separation. Although sporadically appearing in the spectrum, the presence of polyglycols is not surprising, given their common use as a lubricating ingredient in adhesives [
34]. The presence of siloxanes was also confirmed. Siloxanes may be formed during the degradation of the glass fiber itself. Silicone components are used for glueing the glass and creating a greater degree of adhesion between the fibers and may also appear in the original, untreated resin [
35]. Although formaldehyde is commonly employed to crosslink phenolic resins, it was not detected in the solution by the GC-MS analysis. However, a cyclamen test conducted on the initial 5 g of the liquid product collected during the measurement confirmed the presence of formaldehyde in 16.77 ppm concentration.
3.1. Timescale of the Binder Removal
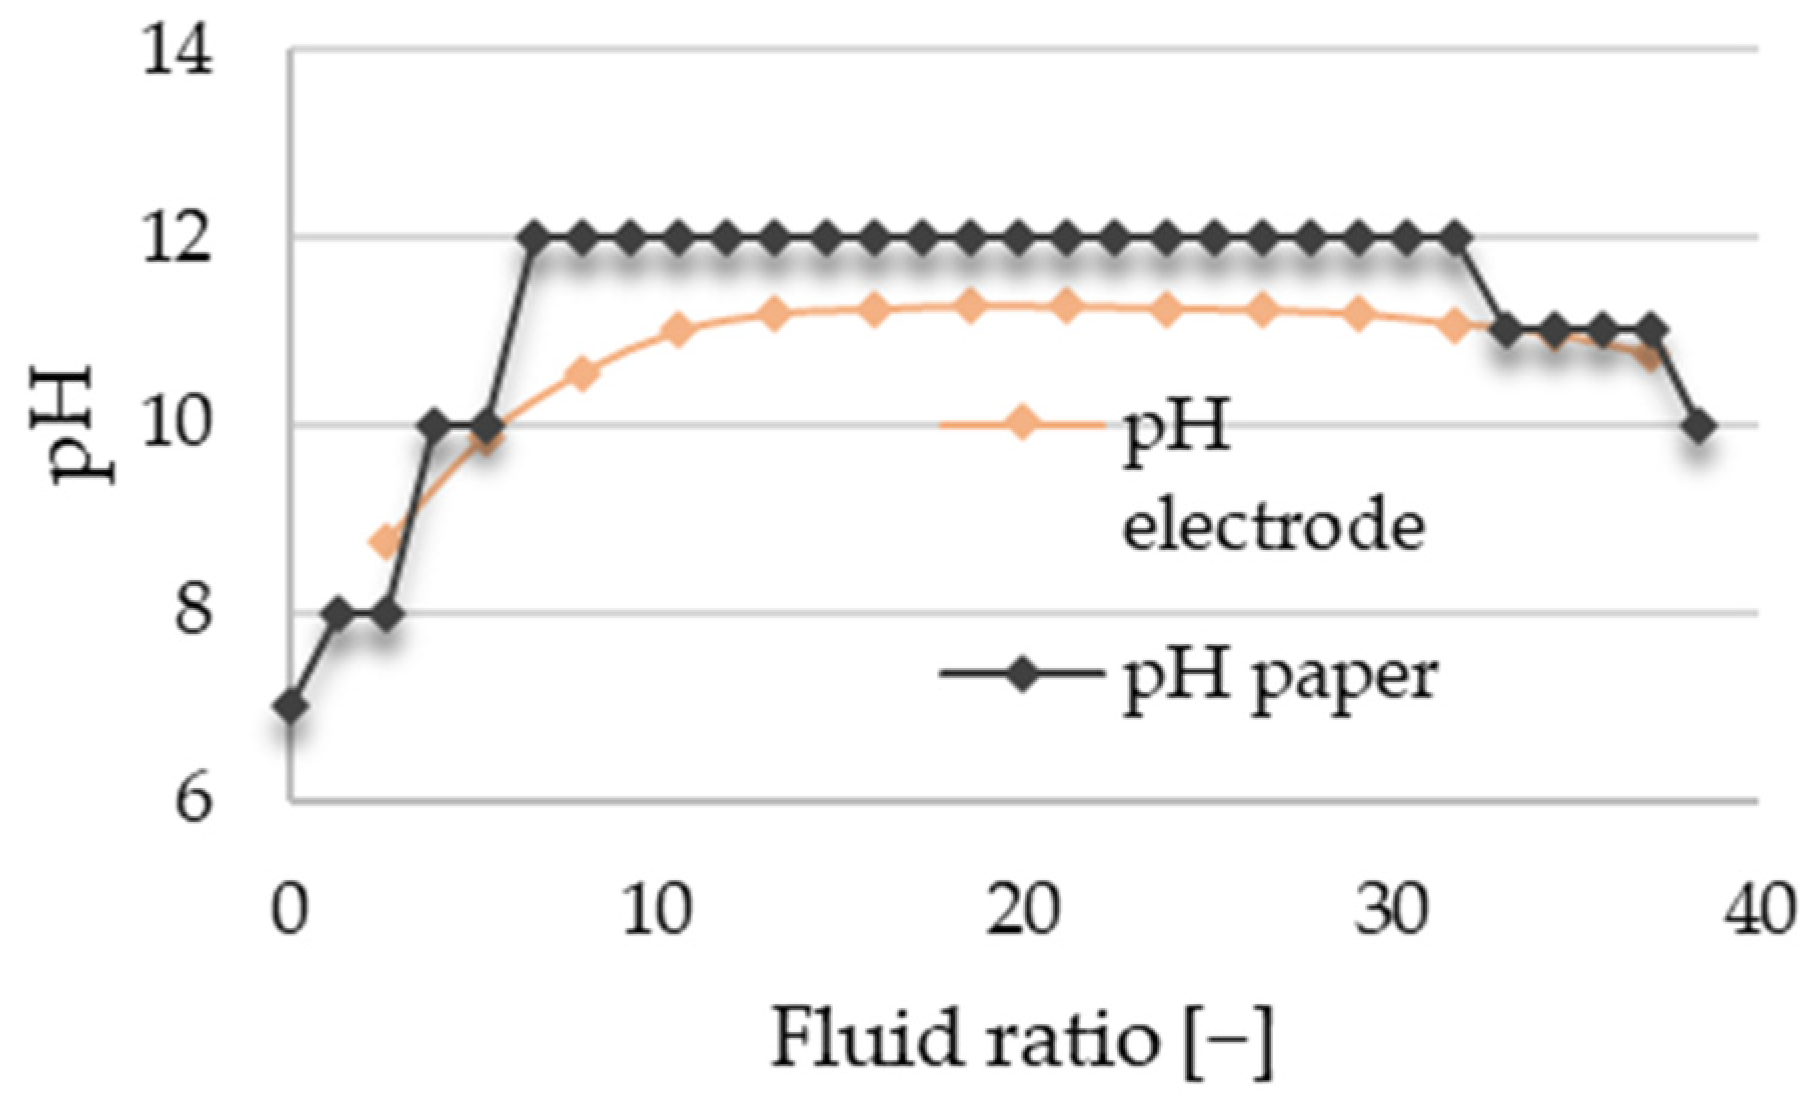
The progress of resin decomposition could be monitored through pH measurements. Initially, a significant rise in pH was noted, followed by reaching a maximum level and maintaining a relatively constant pH during the decomposition process (
Figure 3). Subsequently, a decrease in pH was observed. The pH decline coincided with visual observations of the fibers and solution (
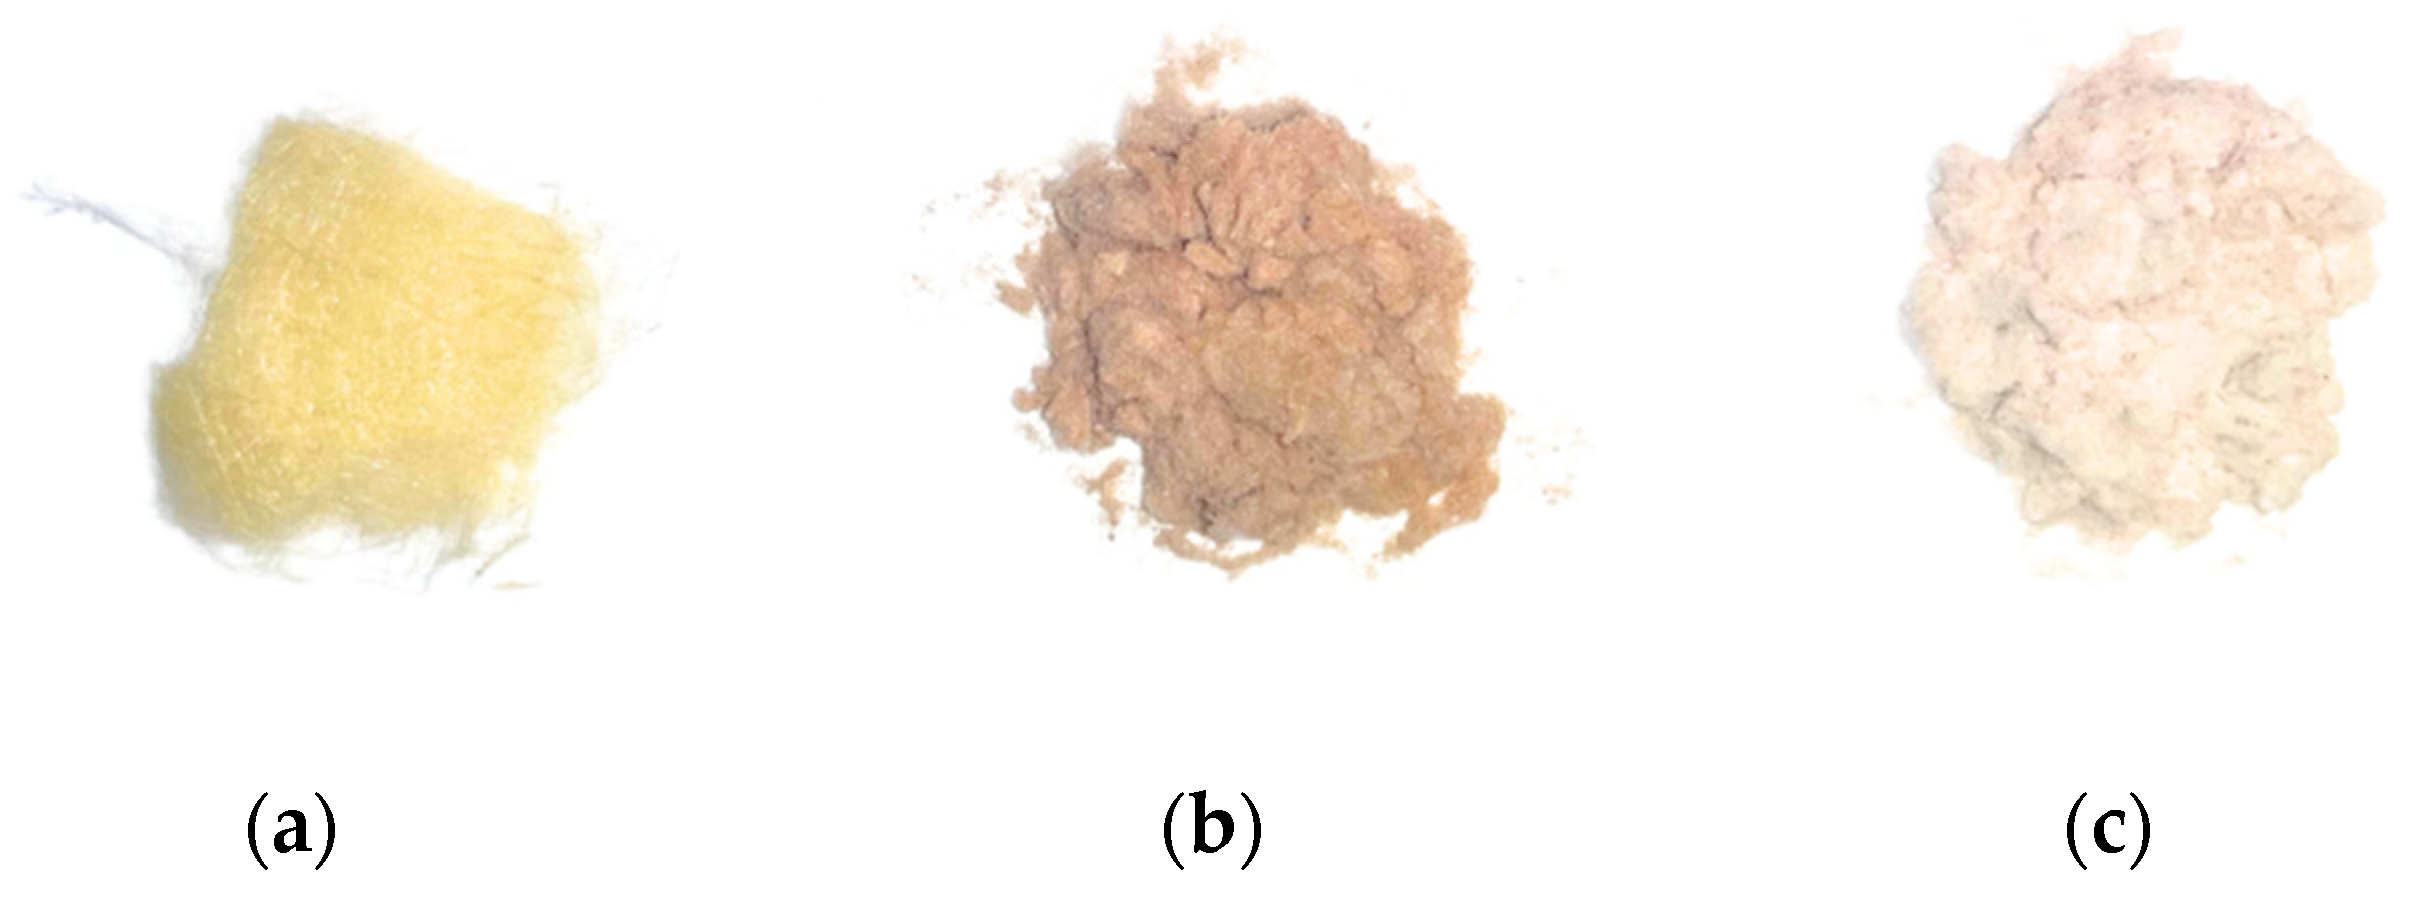
Figure 4), as both the liquid product and fibers in the reactor lost their originally intense yellowish color.
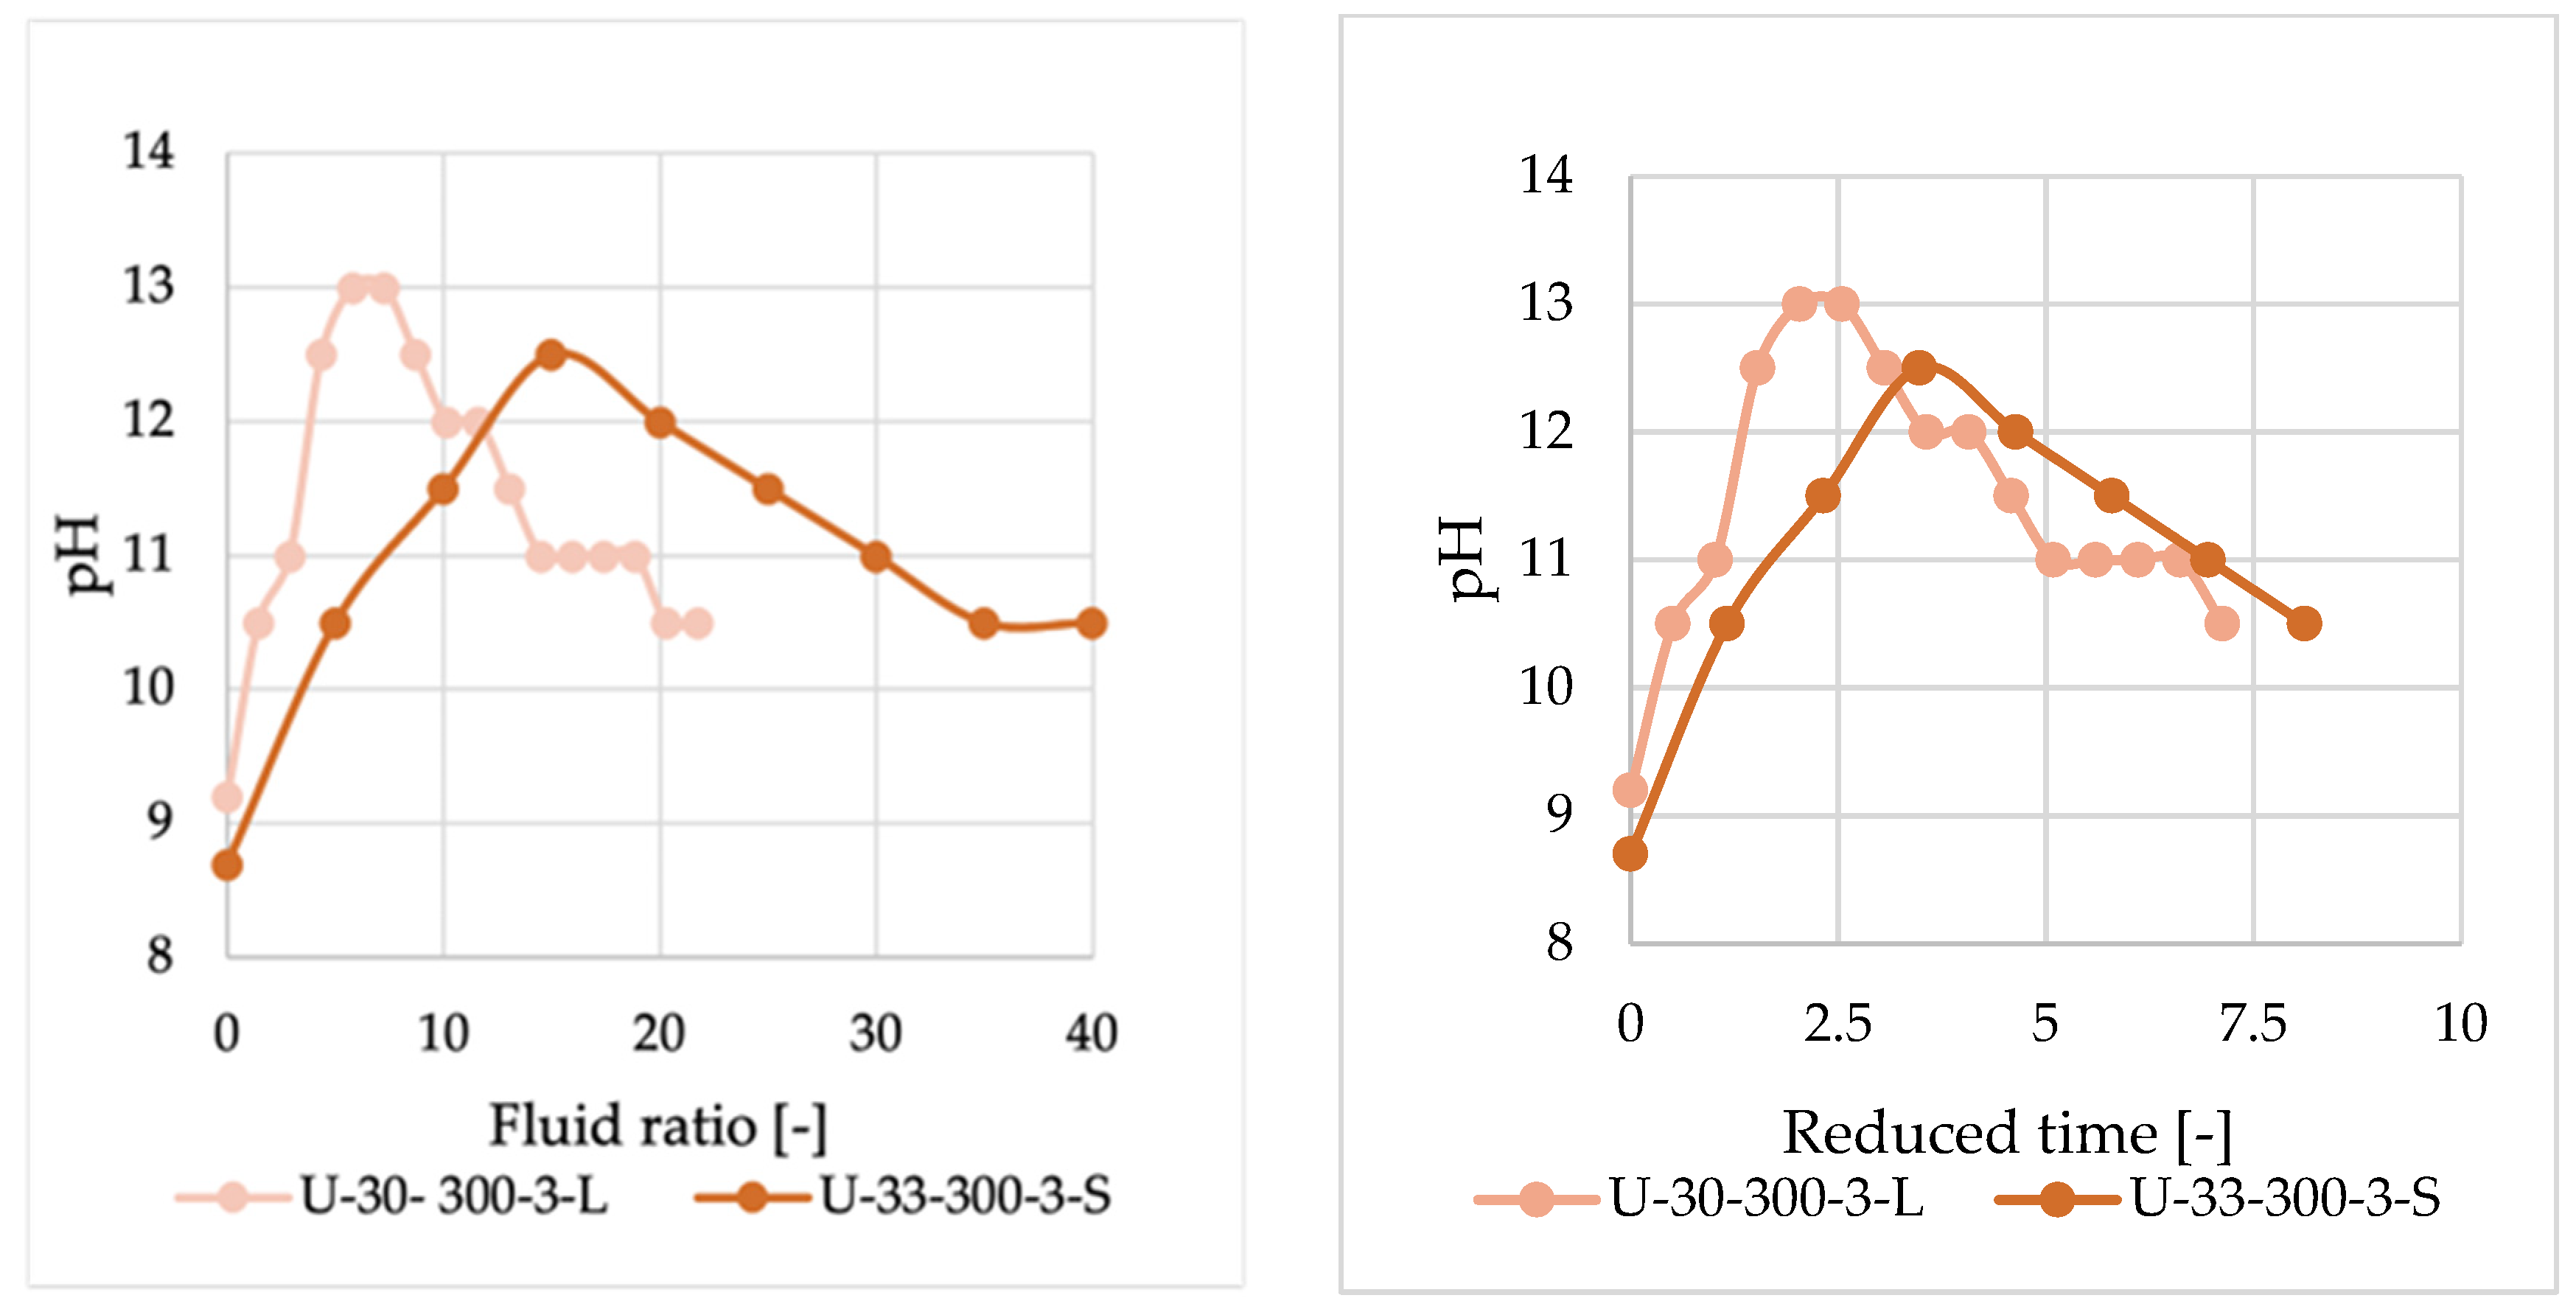
Despite extended measurements, reaching the pH of ultra-purified water was not achieved. This may be due to the glass dissolving in water under high pressure and temperature, leading to alkaline pH from dissolved silicates. A comparison of pH measurements obtained from two different methods can be observed in
Figure 3, where the horizontal axis, the fluid ratio, can be defined as the amount of water passed through the system divided by the initial mass of the glass wool in the reactor.
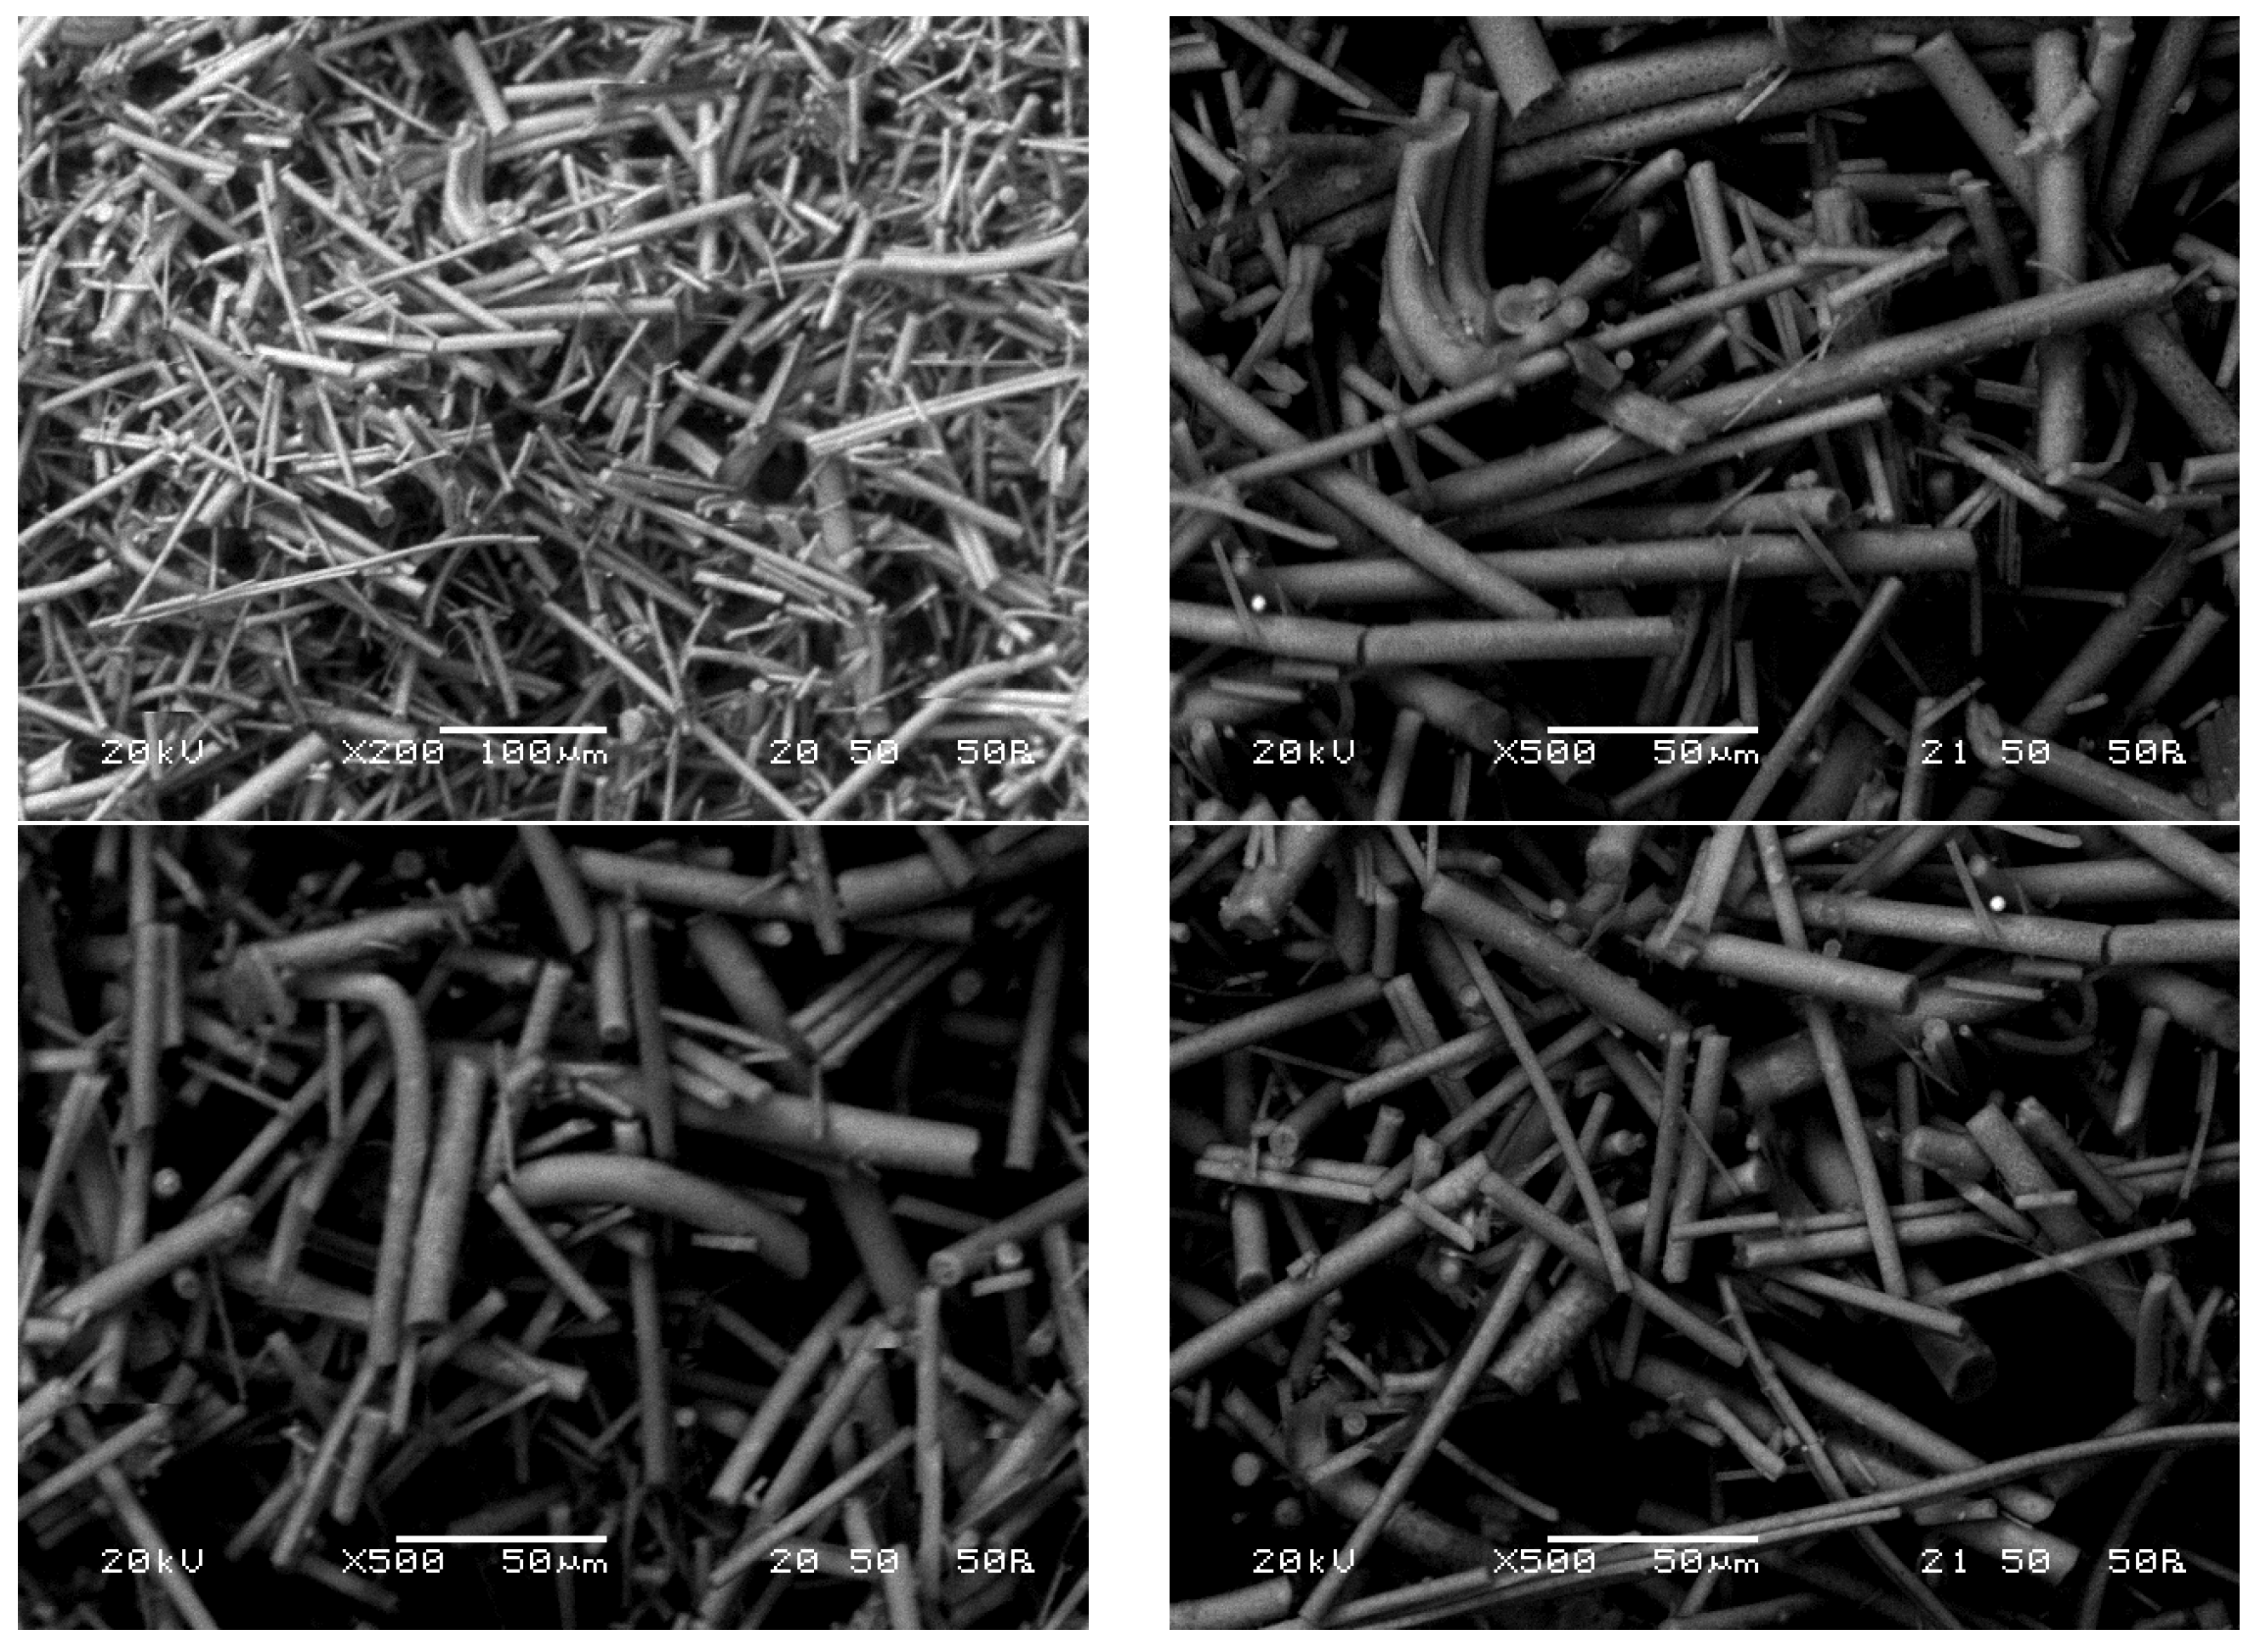
The pH electrode’s usage was challenging due to the unavailability of a flow device small enough for the mass flows (0.5–5 g/min) during the measurements. This led to our pH readings being influenced by the washout profile. In contrast, when using pH paper for measurements, we could determine the instantaneous pH, albeit with the possibility of a visual observation error. Ultimately, the manual method proved to be more accurate, with the endpoint chosen as a decrease of 2–2.5 units. However, in some cases, even with the optimized end point determination, small aggregates can be detected on the surfaces. Pictures of the U glass wool are shown in
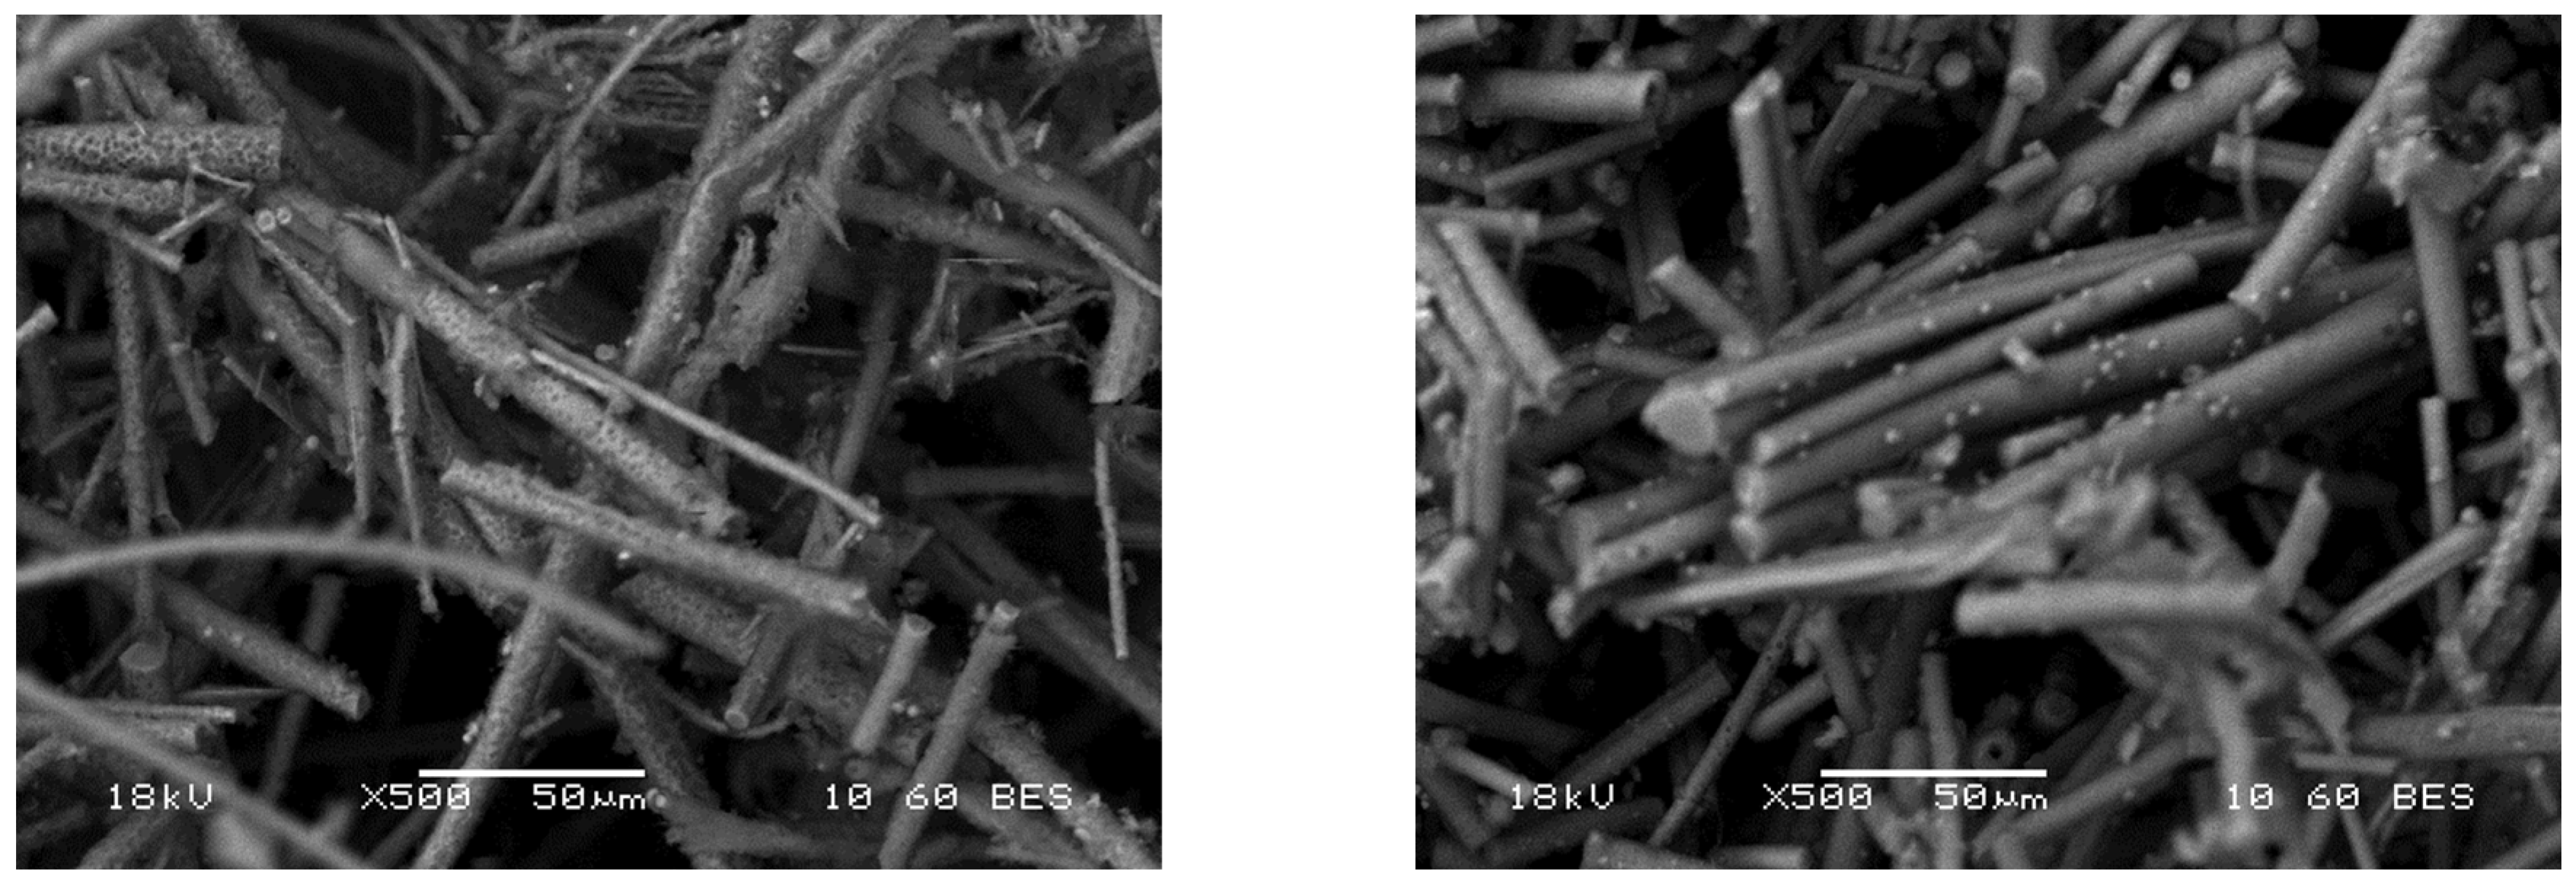
Figure 5, and SEM images in
Figure 6.
Five repeated measurements resulted in 88.92 ± 0.7% remaining mass of the solid phase at 250 °C, 140 bar.
3.2. Effect of Temperature
Through screening experiments, we found that the resin cannot be completely removed from fiber surfaces at temperatures below 250 °C. A product of measurement at 200 °C, resulting in uncleaned fiber, can be observed in
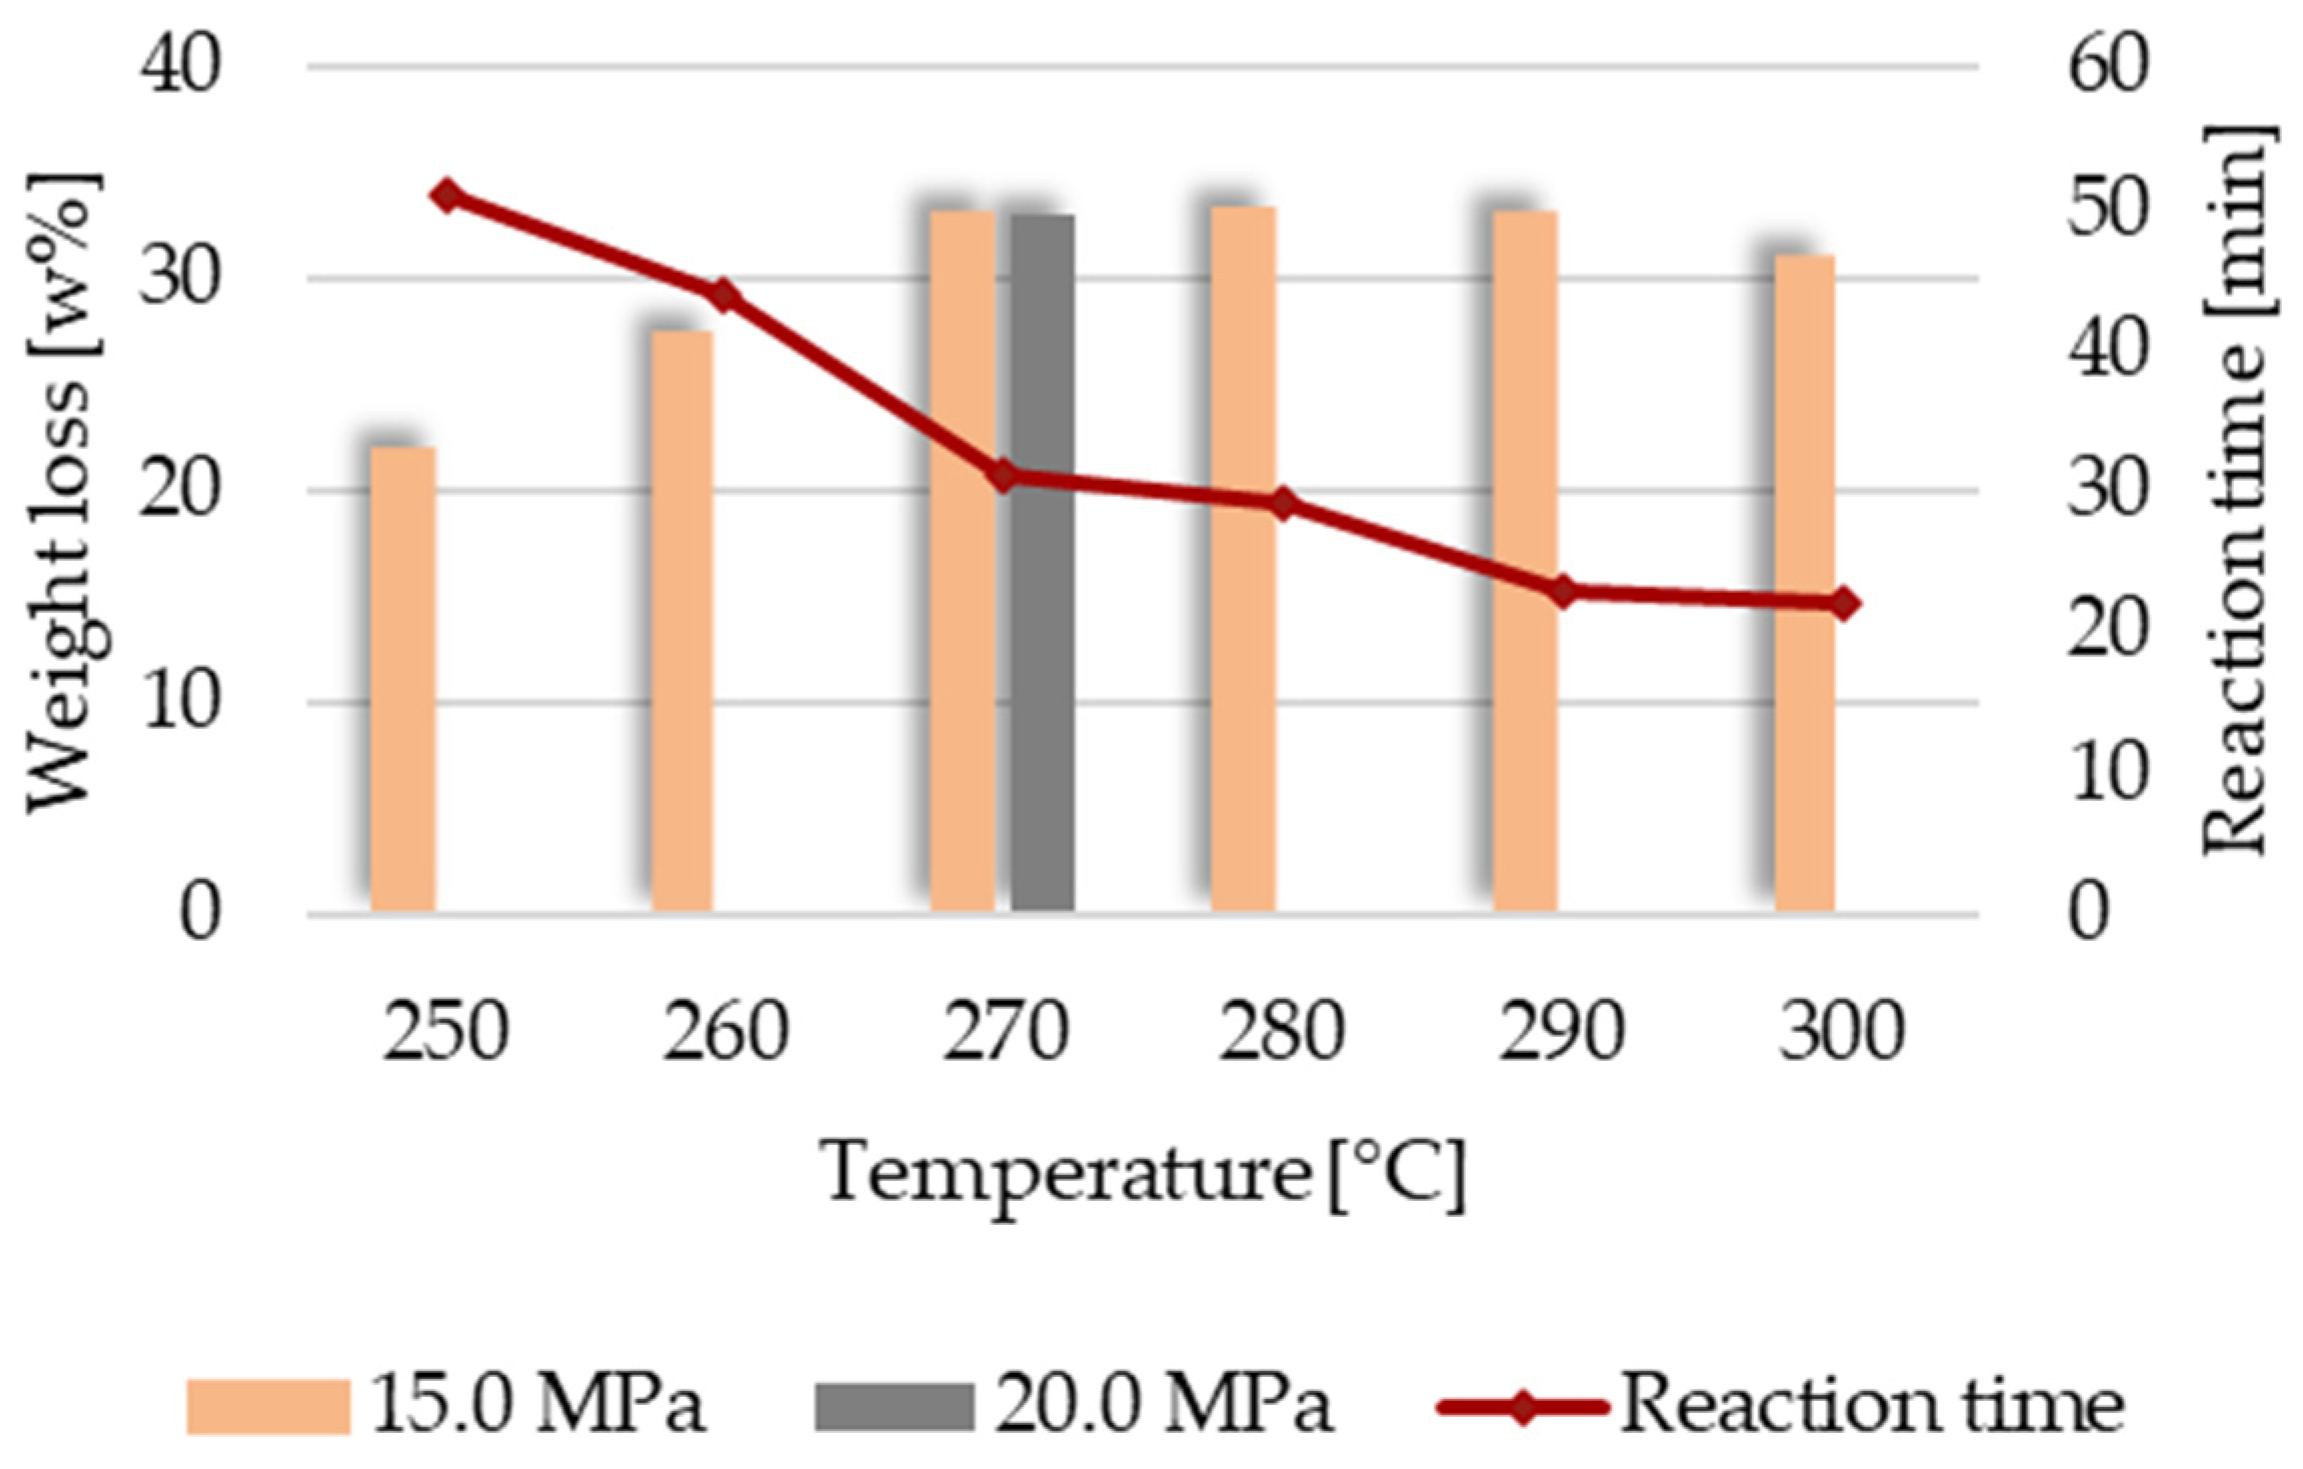
Figure 5b. However, once the temperature reaches 250 °C, the adhesive can be removed, albeit taking a notably longer time than at higher temperatures. The impact of temperature is crucial in these tests, as a 2-unit pH drop necessitates more than twice the fluid ratio at 250 °C than at 300 °C, thus also doubling treatment time. (see
Figure 7).
Based on the results obtained, it is recommended to adjust the conditions according to temperature. However, in terms of recovery, temperature has a contrasting impact because of the solubility of the glass in high-temperature water [
36]. As shown in
Figure 7, both weight loss via glass solubility and decomposition time are influenced by temperature.
We can divide the measurement results into three groups. At lower temperatures (250–260 °C), long reaction times are needed for resin decomposition (44–51 min), and the morphological changes (holes) are visible on the surfaces of the fibers (see
Figure 8 left). In the medium temperature range (270–280 °C), the time needed for decomposition decreases (29–32 min), but with the increase in the temperature, the weight loss is maximal in this group. At the highest temperature range (290–300 °C), fast reactions can be achieved (only 22–23 min), and the weight loss is also moderate compared to the medium temperature range due to the shorter treatment time.
In conclusion, the temperature is always the most important parameter affecting the binder solvolysis process, while the effect of pressure is negligible, as can be observed in
Figure 7.
3.3. Effects of Mass Flow and Fluid to Solid Ratio
The impact of mass flow rate was examined using two different reactor sizes, one with a volume of 5 mL and the other with 10 mL. The water’s mass flow rate varied between 1 and 5 g/min. When considering the same reactor size, there was no notable effect in altering the mass flow rates. Various mass flows required the same fluid ratio for decomposition at 300 °C. However, comparing results from the two different reactor sizes revealed a significant contrast (
Figure 9). In the larger reactor, a lower fluid ratio was sufficient to purify the fibers while reduced time (time over average residence time)-based curves are similar in the two sizes.
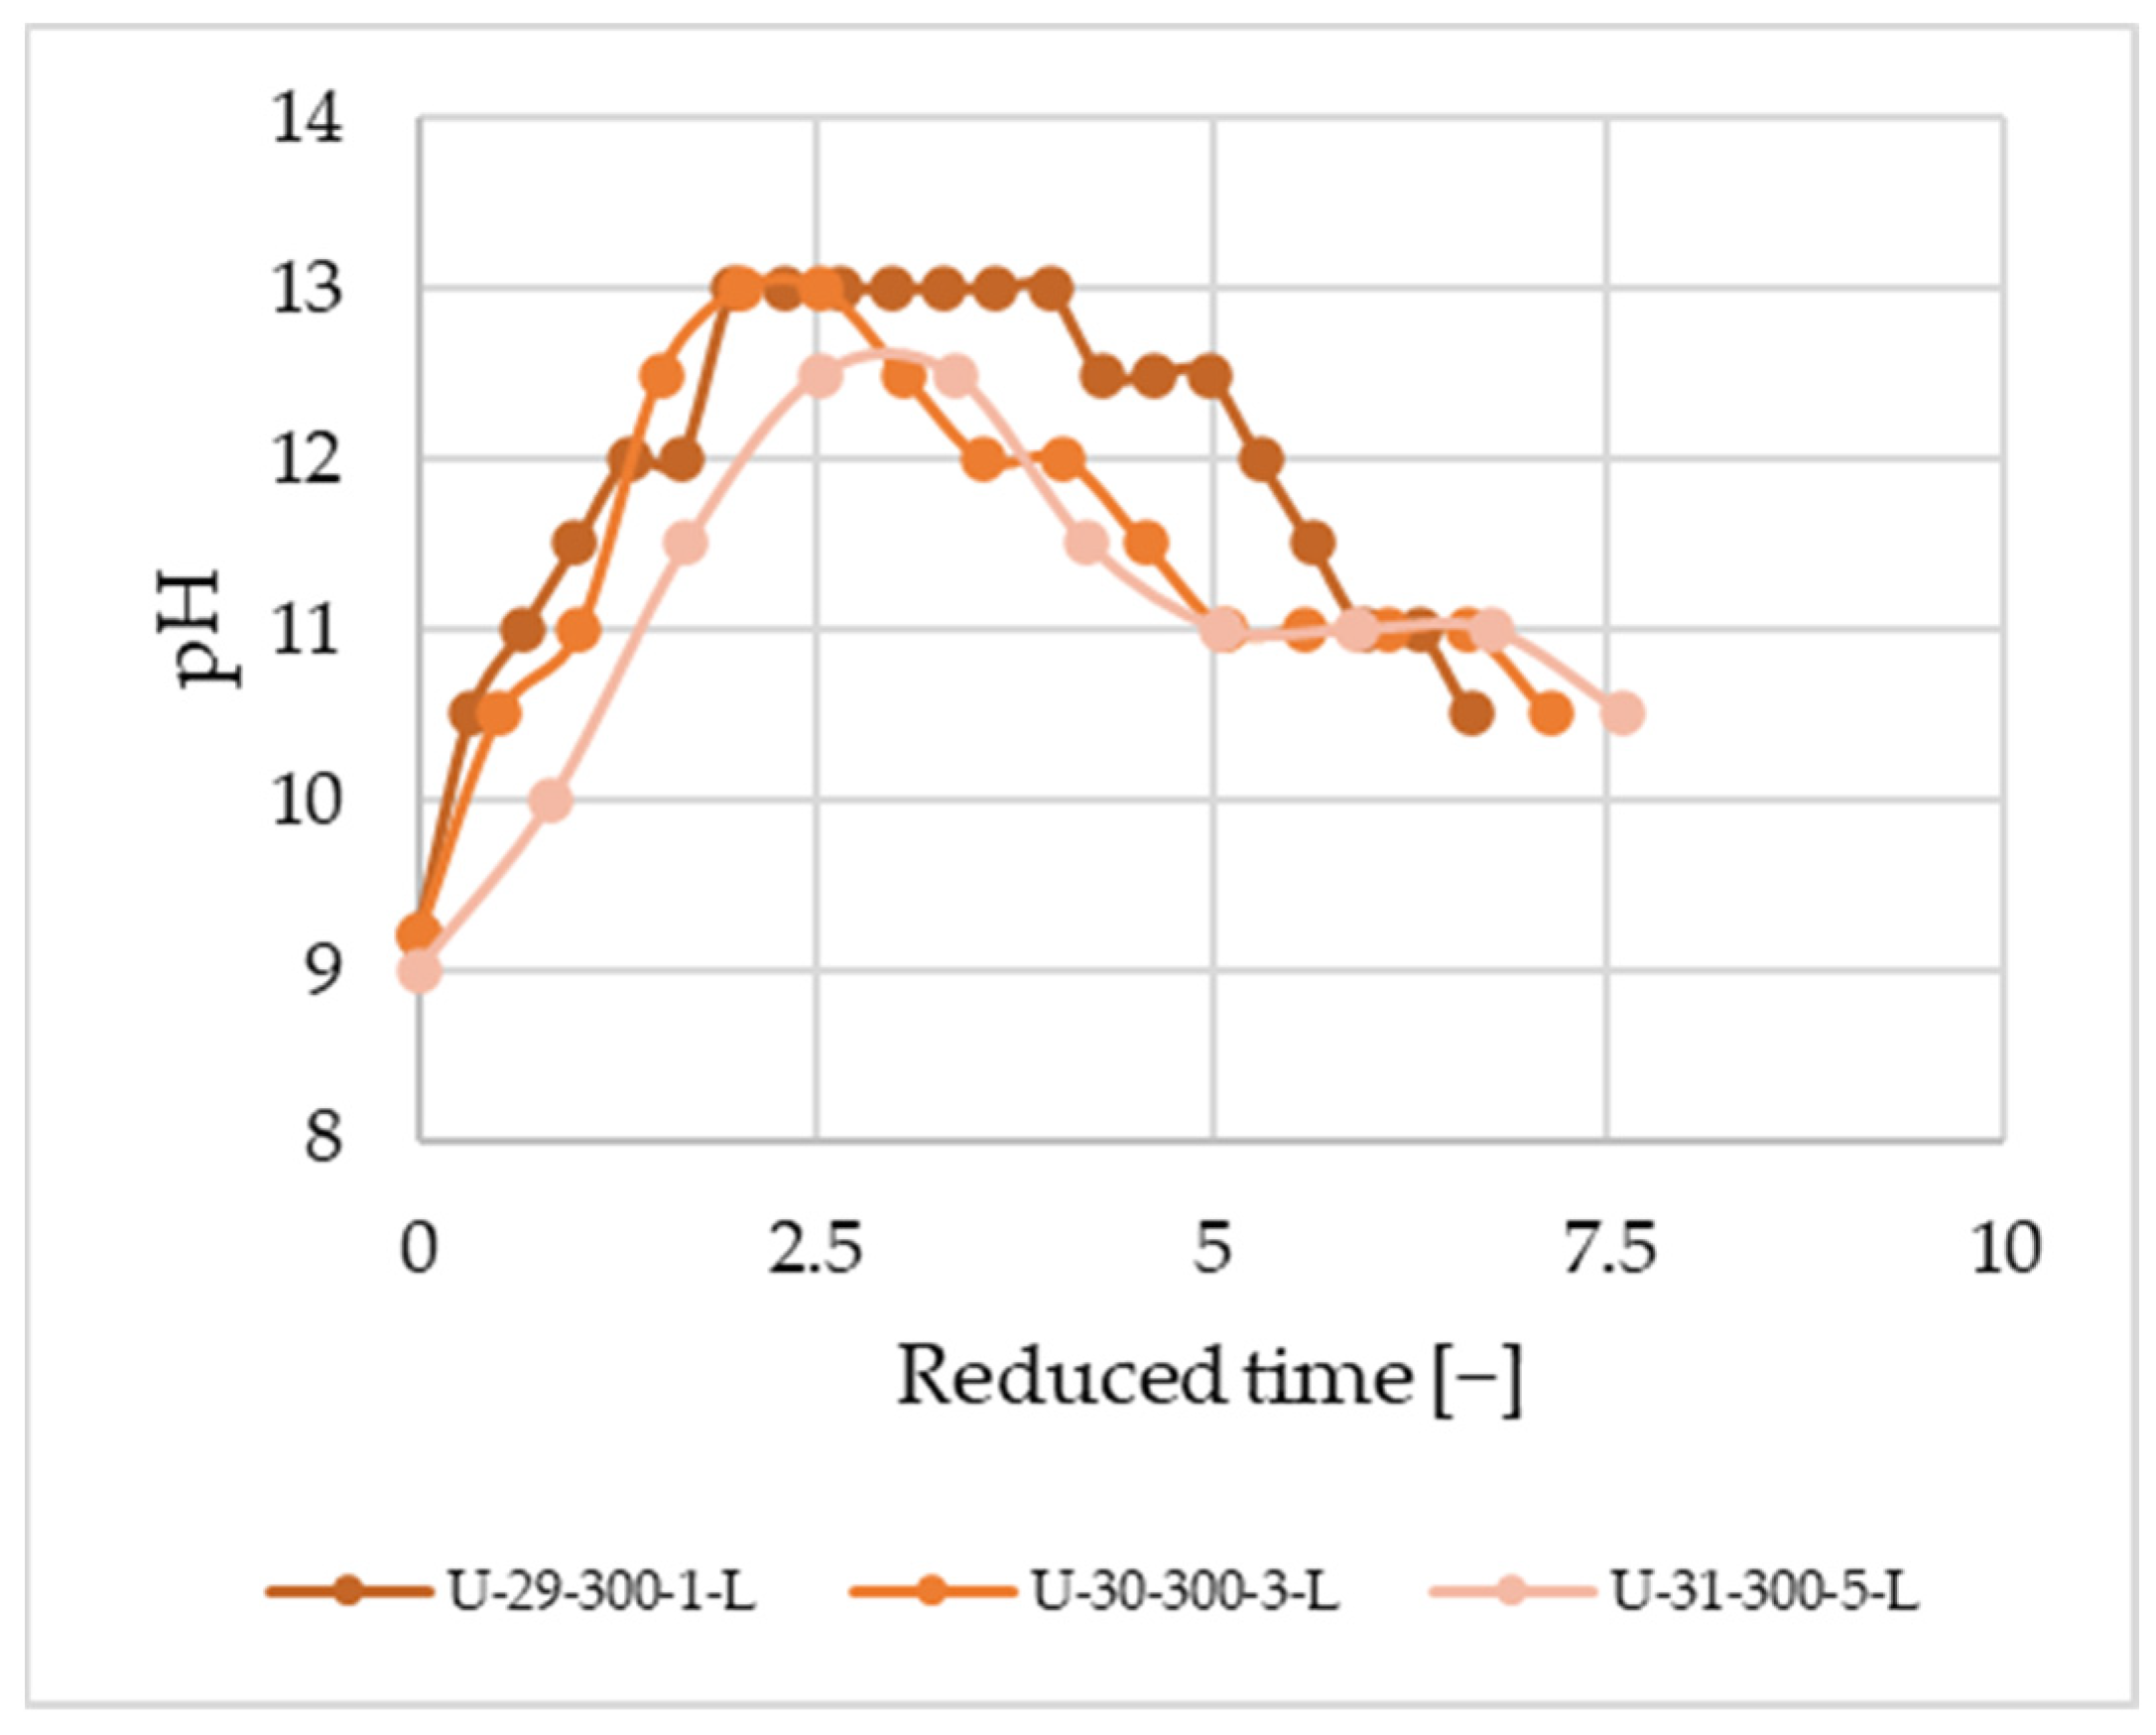
Based on these findings, it can be inferred that the decomposition process is primarily influenced by time rather than the fluid ratio. Although we are not nearing the technical solubility limit, time plays a crucial role. Reduced time vs. pH curves at 1, 3, and 5 g/min mass flow rates using the larger reactor (
Figure 10) do not show any significant difference.
In summarizing the outcomes from the two reactor sizes, we divided the reaction time by the average residence time, yielding the so-called reduced time. The only disparity between the two reactors lies in the length, signifying a greater capacity rather than a scale-up. When comparing the curves, no difference was found in the measurements conducted under laminar flow conditions.
We investigated the effect of fluid ratio and time on mass recovery at both 250 °C and 300 °C. Examining the residual amount as a function of the fluid ratio and time. There is a greater decrease in the mass of the remaining glass wool at 300 °C compared to the measurements at 250 °C (
Figure 11). Furthermore, it appears as if the mass loss increases continuously with increasing fluid ratio until a certain treatment time, and later, the rate of mass loss significantly decreases. This can be justified by the fact that, in addition to the decomposition of the coating, the quartz glass itself also dissolves to a different extent at different temperatures. At a pressure of 15 MPa and a temperature of 250 °C, the solubility of quartz glass is 423 mg/kg water, and at a temperature of 300 °C it is 626 mg/kg water [
36]. We performed experiments in our equipment with quartz glass sold as chromatographic injector filling (R sample) and measured a solubility of 1100 ± 400 mg/kg at a pressure of 15 MPa and a temperature of 300 °C.
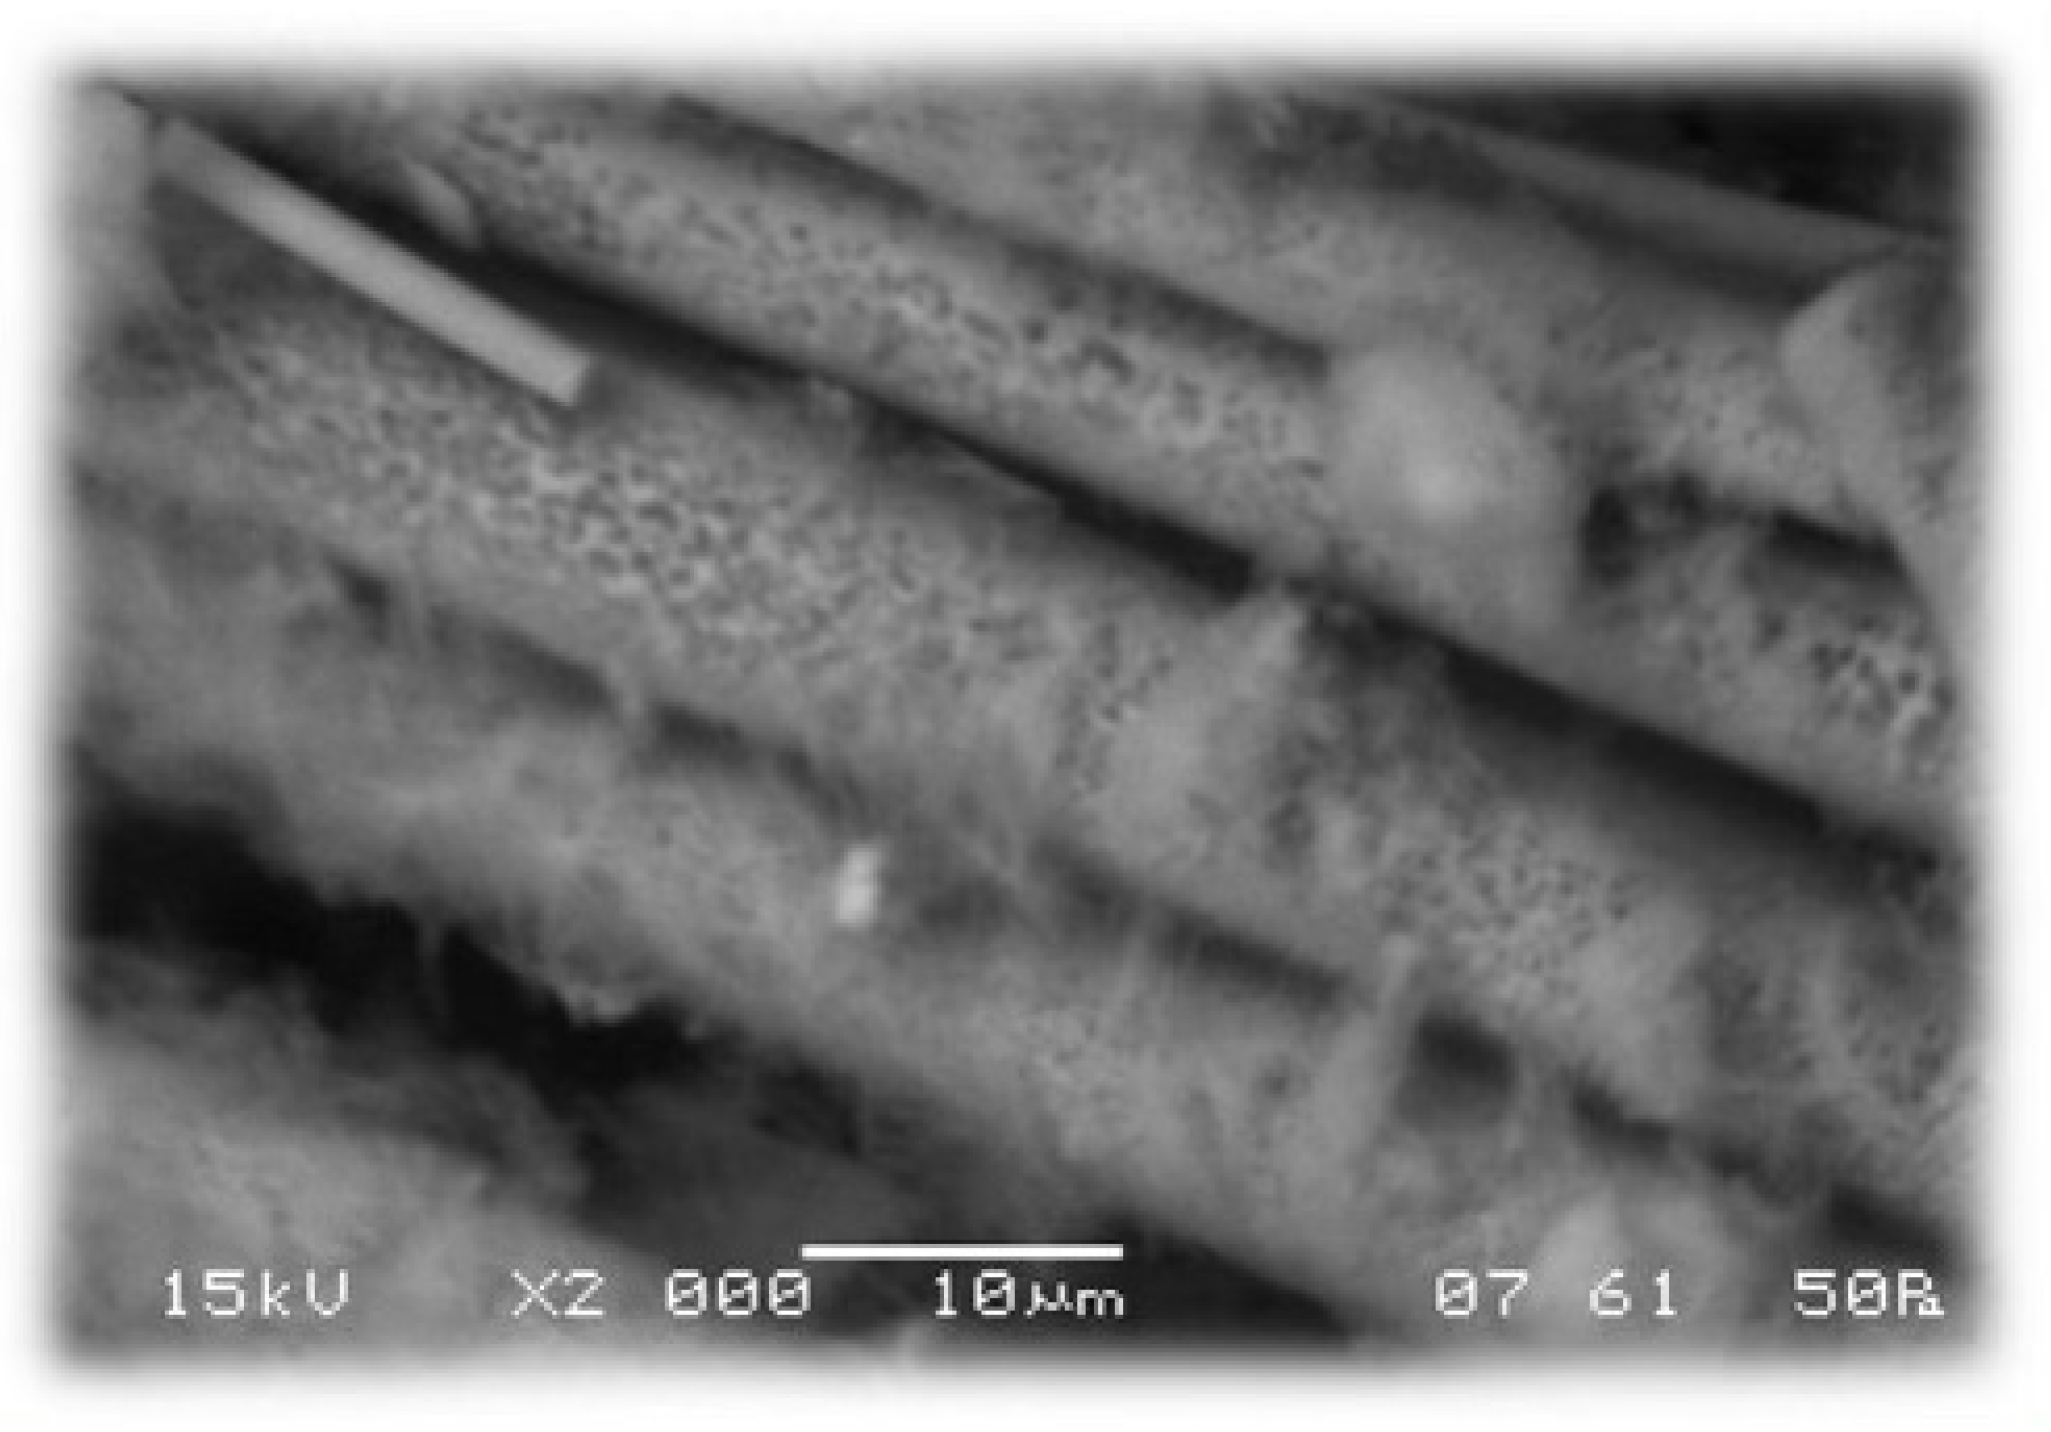
SEM measurements were also performed on glass wool fibers with a high fluid ratio and long treatment time (0.5 g/min water mass flow, 80 min, approximately 40 g/g fluid ratio). Small holes can be seen on the surface of the fibers obtained in this way (
Figure 12), and reprecipitation of the glass also occurs during the measurements, proving a slight dissolution of the glass itself.
Due to the porous structure observed in SEM imagery, we also investigated the change in the specific surface area of the fibers as a function of the fluid ratio. The results of the specific surface area measurement using the Brunauer–Emmett–Teller (BET) method on samples that underwent different fluid ratios (15.7, 21.8, and 73.4) show an increasing trend, it can reach a value of 101.5 m2/g with a fluid ratio of 73.4, whereas with 15.7 and 21.8 the reached specific surface values were 55 and 90.4 m2/g, respectively. A total of 100 m2/g is large enough to allow potential future applications by impregnating different materials to the enlarged surfaces. Our cleaned fibers might be suitable as a catalyst carrier or for any purpose that requires a large specific surface area.
3.4. Different Wastes
Tests were conducted on waste glass wool from various sources to assess the effectiveness of our cleaning method on wastes with diverse origins and histories. While there were slight variations in the pH curve for the different glass wools, in each case clean fibers were produced using the parameters optimized for U samples (furnace glass wool).
When presenting the SEM measurement data concerning UD glass wool, one can observe clean fibers achieved after the treatment process (
Figure 13). These fibers exhibit a smooth surface devoid of any aggregates, nodules, or crystalline structures.
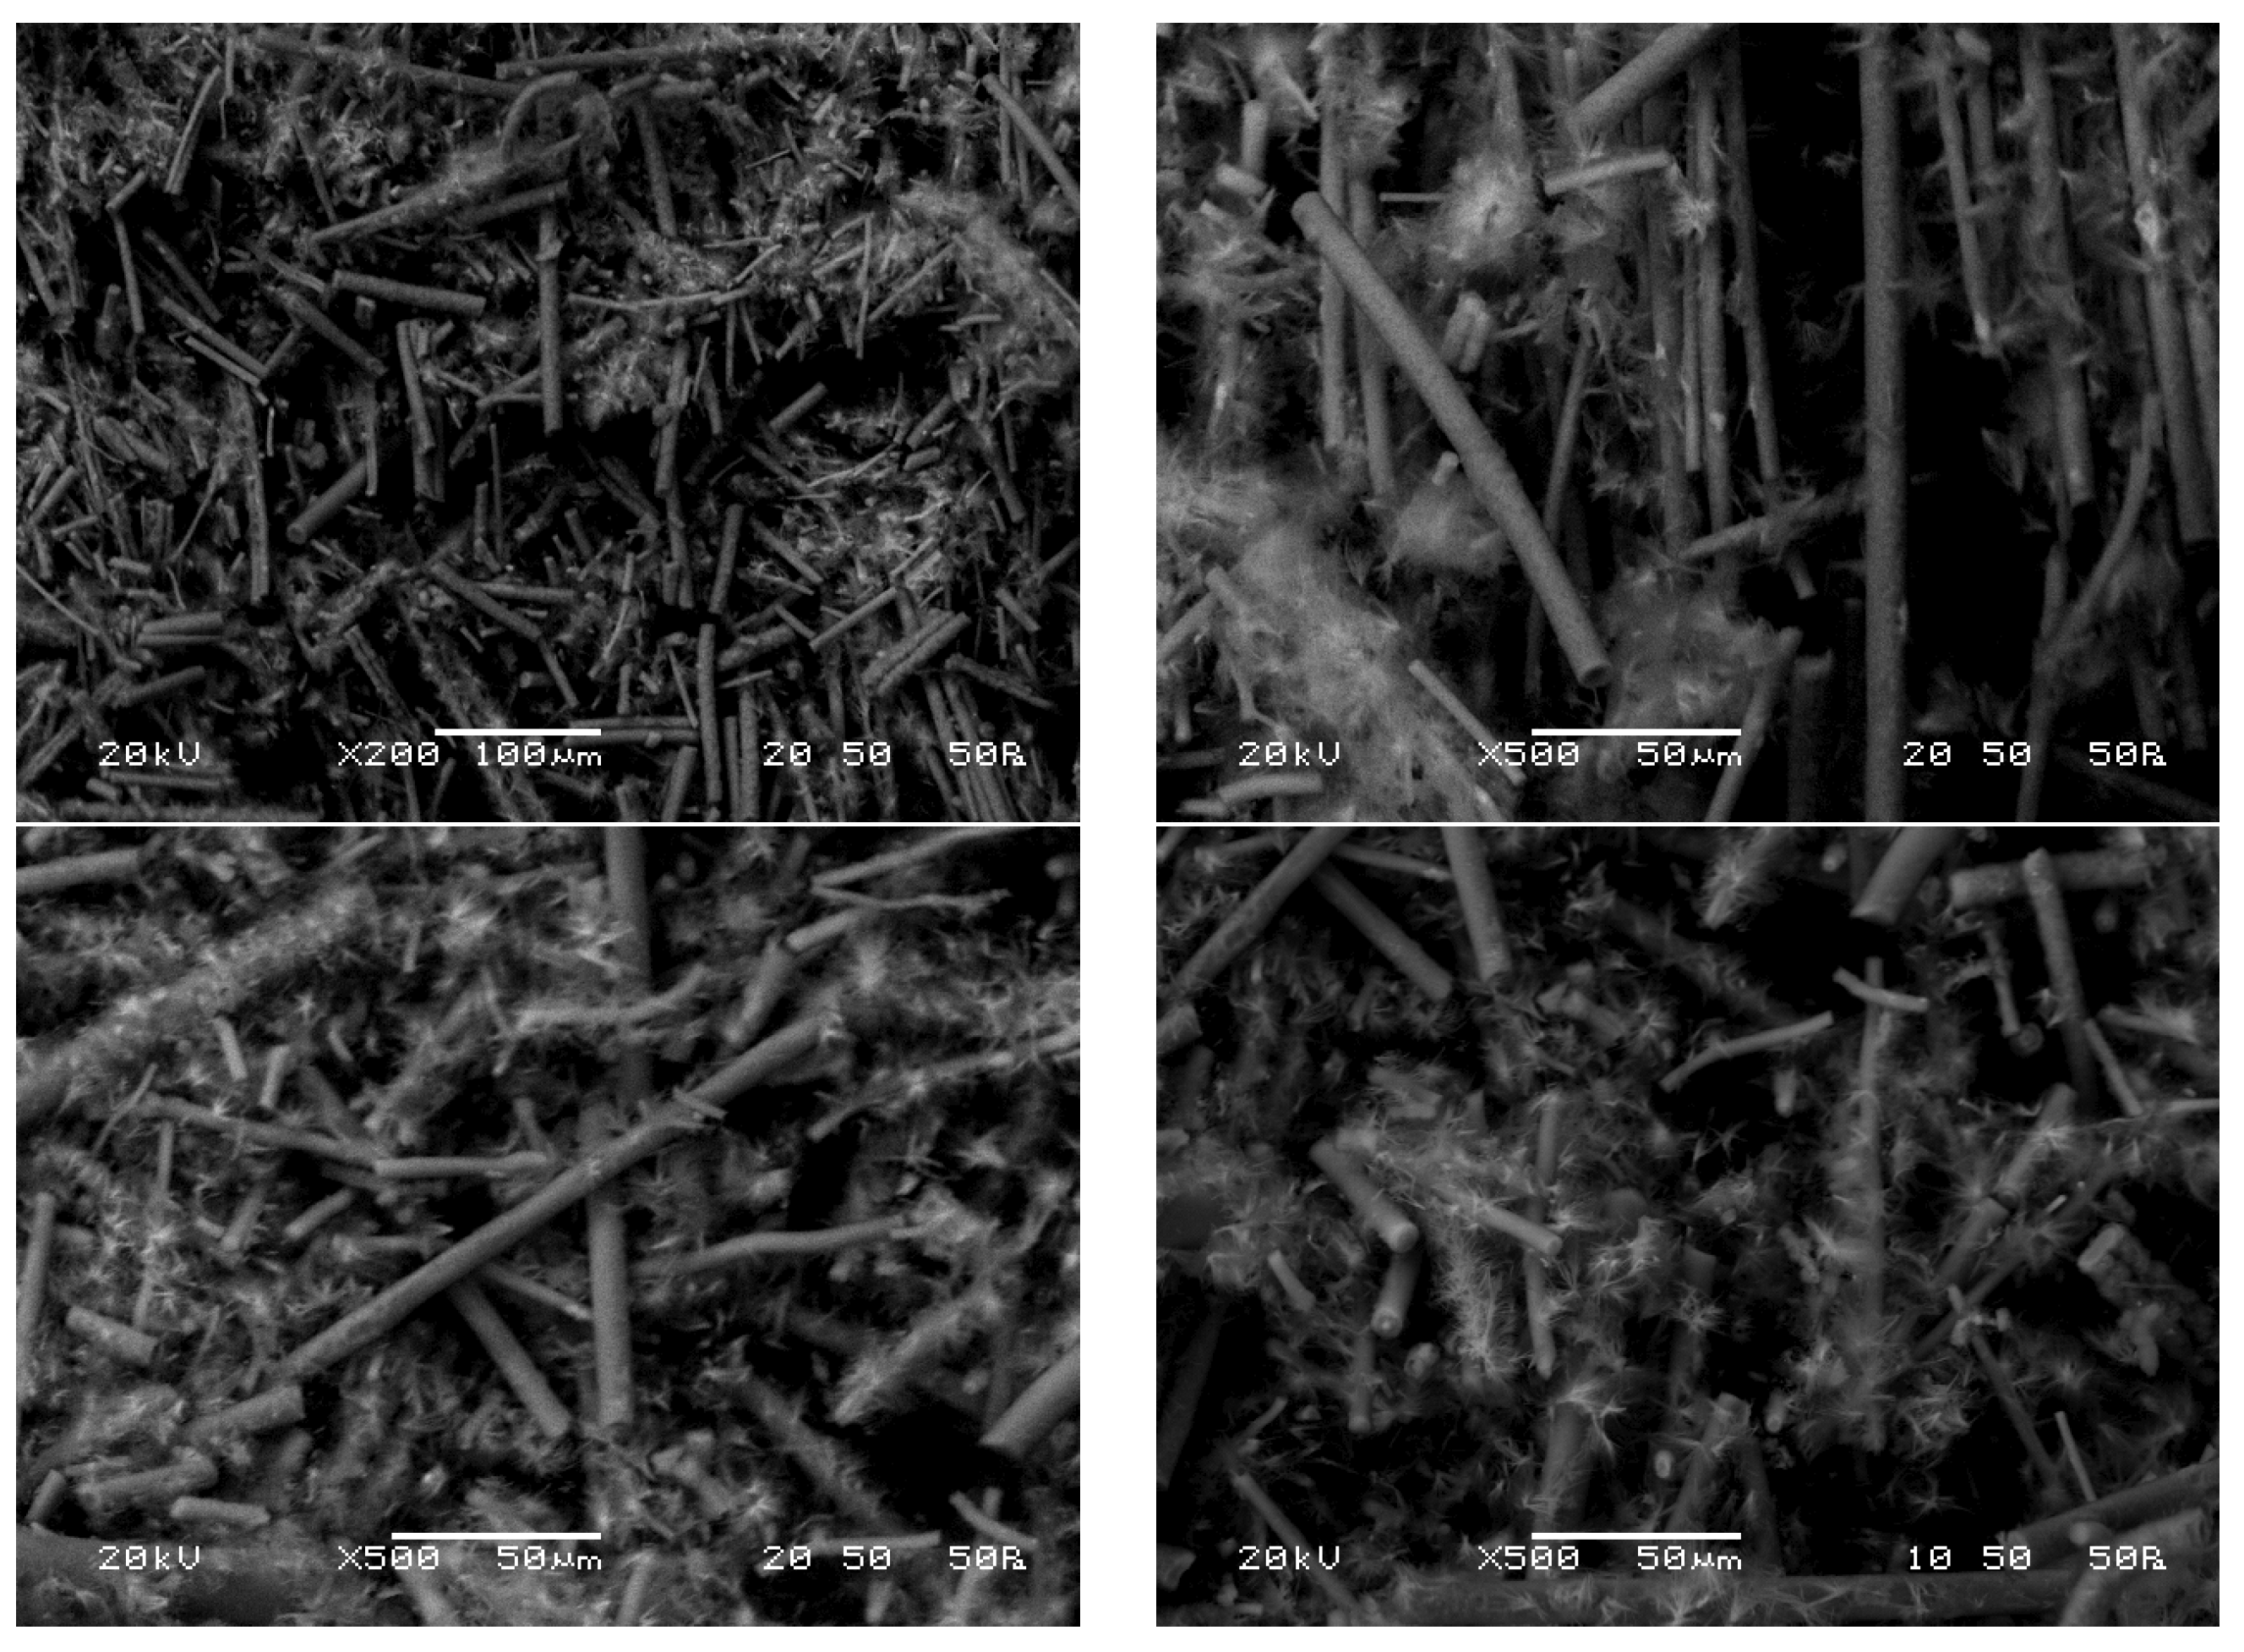
However, in the case of measurements performed on UF glass wool (
Figure 14) with optimized parameters, needle crystal-like formations can be observed on the surface of the fibers. The purity of the fibers can be estimated from the color and structure of the treated product, but it is important to note that homogeneous fiber surfaces cannot be observed based on the SEM images. The visible formations are probably glass crystals, which can also be explained by the larger mass loss accompanying measurements on UF glass wool under the same conditions.
The wool samples were tested with NIR spectroscopy. The purpose of using Near Infrared (NIR) is to be able to draw differences from the first (approx. 3900–5000 cm−1) and the second (5000–6000 cm−1) combination region since, in the case of raw glass wool Si-O-Si, Si-OH, and similar valence vibrations and deformations dominate the classical fingerprint IR region (1500–500 cm−1). In the NIR region, it becomes possible to distinguish between pure -OH and Si-OH, though even in this region, some vibrations have the same wave number.
Based on the results of the examination of untreated fibers, the wool used for furnace insulation (marked U) can be separated from the glass wool used for residential use (marked UD and UF). In the case of U samples, in addition to signs of aromatic hydrocarbon content (combination of C-C valence and C-H valence vibrations accompanied by aromatic signals), signs of amine content can also be found in the spectrum. In the case of all three samples, a clear H2O stretching-bending combination overtone is also visible, presumably due to the humidity affecting the atmospheric measurements.
Pyrolized samples were also measured with NIR. The spectra were different from those of the hydrothermally treated fibers, indicating chemical changes in the high-pressure, high-temperature environment.
Furthermore, samples that underwent the cleaning process were found to contain bounded water, which shows the same spectra regardless of the hydrothermal treatment temperature. However, if the sample is dried at 140 °C and then measured “hot”, the combination of free non-aqueous Si-OH elongation and bending clearly appears. After the treatment of wools of different origins, the spectra were not differentiable; thus, it can be assumed that regardless of the quality of glass and glue, the hydrothermal process is robust at removing the binder since all fibers showed the same free -OH groups after drying. Therefore, using different wastes, it was possible to produce a similar end product, which also can be further utilized [
37,
38].
