Abstract
The aim of this study was to analyze, both theoretically and experimentally, the material transport mechanisms governing the separation of ionic species in aqueous solutions using nanofiltration membranes. To interpret the experimental results, the Donnan Steric Partitioning Model (DSPM) and the Dielectric Exclusion Model (DSPM-DE) were applied and computationally simulated in Matlab. Experimental tests were conducted using a pilot-scale system with commercial NF90 membranes. The results indicate that the DSPM better describes the rejection of monovalent ions (sodium and chloride), while the DSPM-DE is more suitable for divalent ions (sulfate and magnesium). Additionally, both models were sensitized to explore the impact of hindrance factors on the rejection of different ionic species. For neutral molecules present in the solution, it was observed that the DSPM and DSPM-DE do not adequately interpret selectivity, suggesting that under such conditions, the electrostatic exclusion mechanism loses significance, with the steric mechanism prevailing.
1. Introduction
Nanofiltration (NF) is a membrane separation process driven by a total pressure difference [1,2,3], predominantly used for separating solutes, both ionic and non-ionic, in aqueous solutions. This technology has seen significant development in the last 30 years. Figure 1 illustrates that NF is selective for a range of molecular weights of compounds between 200 and 1000 Daltons, positioning itself between reverse osmosis (RO) and ultrafiltration (UF) [4,5,6]. Depending on the membrane type and operating conditions, NF can fractionate ions based on their electrical charge and molecular weight, as well as organic solutes with relatively low molecular weights [7]. This is because NF provides various advantages over other separation processes, such as RO. These include lower operating pressures, higher permeate fluxes, the effective retention of multivalent anion salts and organic compounds with a molecular size greater than 1 nm, reduced investment, and operating costs, as well as lower maintenance expenses [8,9,10,11,12]. The partial permeation of low molecular weight solutes through an NF membrane results in a lower osmotic pressure difference compared to an RO membrane, implying lower pressure gradients and, therefore, a lower energy consumption [6,13,14]. These significant characteristics allowed NF to enter the membrane separation market [15].
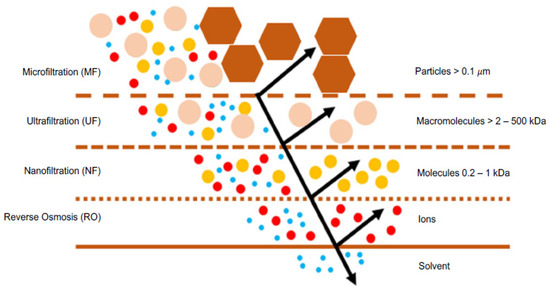
Figure 1.
Scheme of pressure-driven membrane processes and their respective rejection ranges.
Table 1 highlights NF applications in the food industry, especially for processing thermosensitive fluids. NF membranes effectively treat textile industry wastewater, removing dyes and multivalent salts. The NF process reduces electrical conductivity, the chemical oxygen demand, and color in industrial effluents, meeting water quality standards for textile finishing and wastewater discharge regulations [16]. In the past two decades, membrane technologies have been increasingly applied to purify industrial process waters, achieving standards comparable to those of drinking water. NF removes specific contaminants like dissolved As3+ in continental water bodies [17,18] and pharmaceuticals in wastewater treatment plants [19,20]. In brackish and saline water desalination, NF reduces solute content for industrial, mining, and agricultural uses. NF is also used as pretreatment for seawater reverse osmosis, removing divalent ions, separating organics, and reducing dissolved and colloidal solids for safe operation in subsequent membrane processes [21,22].

Table 1.
Most common industrial applications of NF.
A nanofiltration membrane is defined as a microporous medium with characteristics that fall between those of UF and RO. Structurally, NF membranes are asymmetric, featuring an ultra-thin selective layer [57,58,59]. This layer is responsible for selectivity and is installed on a porous support that provides the necessary mechanical strength to the membrane to withstand operating conditions.
NF membranes can be manufactured using polymers or inorganic materials.
The most used polymers are cellulose acetate, polyamide, and polyimide [60,61,62,63]. The inorganic materials employed are of ceramic-type, metal oxides (e.g., Al, Si, Ti, or Zr) [64,65].
Inorganic NF membranes exhibit remarkable chemical and structural stability. But these membranes are mechanically more fragile and more expensive than polymeric membranes [66,67].
Polymeric NF membranes are manufactured with asymmetric structures, resulting in thin film composite (TFC) membranes [68], which consist of a selective or active layer of polyamide polymerized on a microporous polysulfone support (see Figure 2). This combination provides selectivity (improved rejection) and productivity [69].

Figure 2.
TFC membrane and its constituent polymers.
1.1. Separation Mechanisms in NF Membranes
NF is a complex process influenced by microhydrodynamics, interfacial electrical phenomena, and the nanopore network size distribution. The membrane’s selectivity involves steric exclusion (size selectivity), Donnan exclusion, dielectric exclusion, and various transport mechanisms [70]. Steric exclusion is illustrated in Figure 3, where solutes larger than membrane pores are rejected, and smaller solutes have a higher probability of permeating if their projection falls within the pore region; otherwise, they are rejected [70,71]. The Donnan exclusion theory [72] explains equilibriums and interactions between ions in a solution with an electrically charged membrane. NF membranes acquire a surface charge due to functional group dissociation in their materials. Some NF polymers, containing ionizable groups like carboxylic and sulfonic acids, exhibit a negative charge [73,74]. Surface charge density depends on both membrane materials and the feed solution, linked to the pH of the solution [61]. Generally, negatively charged under neutral or alkaline conditions and positively charged under highly acidic conditions [71], the membrane attracts counter-ions and repels co-ions, creating an electric potential [75]. The Donnan exclusion mechanism retains counter-ions, ensuring stoichiometric passage through the membrane. In concentrated or multi-ionic solutions, interactions between different ions may alter ion permeability [76,77].
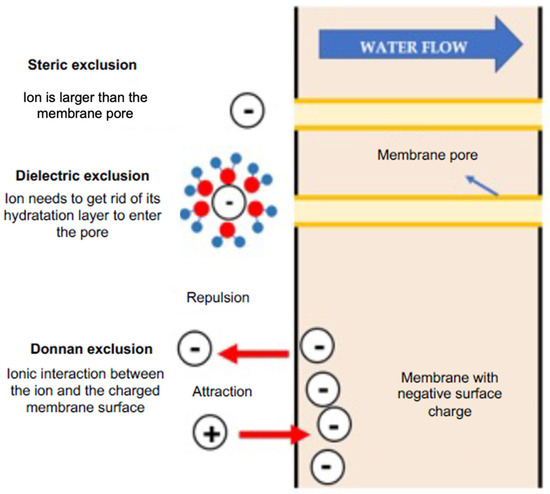
Figure 3.
Diagram of the different exclusion mechanisms in an NF membrane.
Dielectric exclusion in NF membranes with ionic solutions is explained through two mechanisms. The first mechanism attributes the phenomenon to electrostatic interactions between solution ions and polarization charges induced on the membrane surface due to the difference in dielectric constants. This creates a repulsive force, preventing ion entry into the pore and causing additional retention, irrespective of charge [78,79]. The second mechanism suggests a solvation energy barrier at the membrane interface, formed when an ion transitions between solvents with different dielectric constants. NF pores’ atomic scale confines the solvent, leading to solvent reorientation at the solvent–solid interface, affecting the viscosity and dielectric constant [59,80,81]. This work sought to explain the exclusion of each ion present in a solution to be processed via nanofiltration.
1.2. Modeling of Mass Transport in NF
Various authors have investigated the transport of neutral and colloidal solutes, along with their respective rejection in membrane processes [71,82,83]. From a comparative analysis of various models developed to describe NF, it was concluded that the Nernst–Planck equation was the most suitable for predicting the mechanisms of transport and ionic selectivity in NF [84,85,86,87]. Subsequently, the Donnan Steric Partitioning Model (DSPM) was applied, based on the extended Nernst–Planck equation, modified by incorporating hindered transport factors for both diffusion and convection [71,88,89]. The DSPM proved suitable for relatively simple solutes such as organic molecules and monovalent electrolytes but not for aqueous solutions of multivalent cations, such as Mg2+ [90]. Bowen and Welfoot [59] developed a modified DSPM, incorporating the phenomenon of dielectric exclusion (DSPM-DE), allowing for theoretical results closer to experimental ones. Today, the DSPM and DSPM-DE have not undergone significant changes; only the relationships of the dielectric effects and membrane charge density have been refined.
The DSPM describes the fractionation of solutes at the solution–membrane interfaces and the transport of solutes through the membrane pores, using the extended Nernst–Planck equation (see Equation (1)). The fractionation mechanisms include steric effects and Donnan electrostatic exclusion, where the considered parameters are membrane pore radius (), effective membrane thickness , and the volumetric charge density of the membrane () [71]. Equation (1) and Figure 4 describe the three transport mechanisms involved simultaneously in the NF process for ionic solutes: diffusion, electro-migration, and convection.
where is the flux per unit area of ion i, is the diffusivity of species i within the membrane pore (see Equation (2)), is the concentration of species i in the pore, x is the thickness of the membrane, is the valence of species i, R is the universal gas constant, T is the absolute temperature, F is Faraday’s constant, is the Donnan potential of the membrane, Ki,c is the hindrance factor for the convective term, and e is the permeate flow rate.
where Ki,d is the hindrance factor for the diffusive term, and Di,∞ is the diffusivity of species i in the bulk solvent.
Diffusion Electro-migration Convection
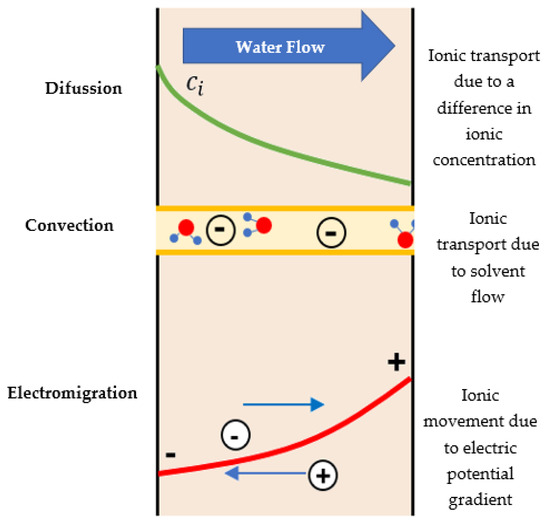
Figure 4.
Scheme of the transport mechanisms incorporated in the extended Nernst–Planck equation.
The DSPM considers that the diffusive and convective transports of species i are hindered by the size of the pores of the NF membrane. The hindrance factors and are functions of the ratio between the solute radius and the membrane pore radius (see Equation (3)), because the theoretical expressions are based on the hydrodynamics of the system, assuming a spherical solute with radius () moving in an infinitely long and finite radius cylindrical pore () [89]. Equations (4) and (5) allow for the determining of the hindrance factors for 0 < λ < 0.8, assuming a parabolic solute flow velocity profile of the Hagen–Poiseuille type fully developed within the pore:
where is the steric partition coefficient, representing the likelihood of a solute, smaller than the pore, successfully entering the pore:
The solute concentrations in the feed and in the permeate must be known to obtain an expression that allows the transport equation (Equation (1)) to be solved. The entry and exit of an ion through a pore are an equilibrium process (see Equation (7)):
where and are the activity coefficients of the ion in the pore and in the feed stream, respectively. and are the concentrations of the ion in the pore and in the feed stream, respectively. Equation (7) serves as the initial step to obtain an expression for calculating the ion concentration within the pore. This process begins by assuming ideal conditions and the presence of electroneutrality both in the solution feed stream (Equation (8)) and within the membrane pore (Equation (9)).
Based on the above and equating the Donnan potentials for each ionic species, Equation (7) for a particular ionic species is
where is the concentration of ion i at the entrance of the pore, and is the concentration of species i in the feed stream, at the membrane surface. Equation (10) is substituted into Equation (9), resulting in an expression (Equation (11)) that allows the calculation of the concentration of an ionic species at the entrance of the pore, and similarly at the exit of the pore.
On the other hand, considering the relationship between Jv and Ji, Equation (1) can be rearranged to yield Equation (12). Since the electric potential gradient is uniform for all ions within the membrane, this gradient is derived from Equation (1), resulting in Equation (13):
where corresponds to the concentration of the ionic species i in the permeate.
The permeate flux density and the osmotic pressure of the solution are estimated using the Hagen–Poiseuille and Van’t Hoff equations, respectively.
Consideration must be given to the fact that the ionic concentration near the membrane differs from that in the bulk solution. This creates a concentration profile between the bulk solution and the membrane, known as the concentration polarization phenomenon. Consequently, the actual ion concentration at the membrane surface can be correlated with the feed concentration and associated with the observed rejection, yielding an actual rejection equal to [90]
where Robs is
Incorporation of Dielectric Exclusion: DSPM-DE
As mentioned earlier, the DSPM had to be modified due to (1) it delivering unsatisfactory results when the feed contains divalent cations [73,91,92] and (2) the salt rejection of ionic solutions at the membrane’s isoelectric point; when its volumetric charge density is zero, it is not explained solely through the steric exclusion mechanism. Therefore, other exclusion mechanisms must be considered. In 2002, Bowen and Welfoot [59] included the dielectric exclusion phenomenon using the Born model equation [93], becoming known as the “DSPM-DE”. Due to the incorporation of the dielectric exclusion phenomenon [94], the steric partition coefficient () is
where is the Boltzmann constant, and describes the change in the solvation Gibbs energy associated with the movement of an ion from vacuum into either the bulk external solution or the fluid within the membrane pore [95], indicating the energy barrier that ions encounter during solvation into the pores [59,96]:
where e is the electron charge, is the vacuum dielectric constant, is the dielectric constant in the pore, and is the dielectric constant in the solution bulk [93,97].
Bowen and Welfoot [59] proposed Equation (21) to calculate the dielectric constant in the pore, arguing that the dielectric properties of the solvent in the pore are similar to those of bulk water, and that viscosity follows a similar reasoning as expressed in Equation (21). In general, this approach to the dielectric properties of the solvent in the pore is consistent with that used for the viscosity of the solvent in the pore. In both cases, such an assessment allows for the exploration of, at a quasi-continuous level, the effects of the variations in solvent properties in the pore for predictive purposes. Further theoretical improvements could probably be achieved only through non-continuous descriptions, such as molecular dynamics simulations, with considerable increases in conceptual and computational requirements.
where is the dielectric constant of the oriented layer (value depends on the solvent), and d is the thickness of the oriented layer of the solvent, usually using the size of the ring formed by a water molecule.
The theoretical challenges are related to establishing mathematical models that describe the fundamental transport mechanisms of the process NF. Such models should be capable of predicting the selectivity and productivity parameters of NF under different operating conditions and for various types of solutes. The importance of having reliable models for the NF process is a crucial factor for the proper design of these systems, allowing a reduction in the experimental work required to explore a particular liquid–liquid separation. The aim of this study was to correlate the experimental results obtained from a nanofiltration pilot plant with the interpretations of transport mechanisms and their corresponding equations.
2. Materials and Methods
Figure 5 outlines the two stages of the methodology followed in this research. The first stage involves the phenomenological simulation of nanofiltration, while the second stage consists of conducting nanofiltration experiments on the aqueous solutions of ionic solutes, operating under various concentrations, temperatures, and pressures. The membrane used for the experimental runs was a Dow-Filmtec NF90 spiral wound module.

Figure 5.
Scheme of the methodology followed in this research.
2.1. Simulations of the DSPM and DSPM-DE Models
Figure 6 shows the calculation algorithm programmed in Matlab®, which allowed the resolutions of the DSPM and DSPM-DE and is based on the equations outlined in Section 1.2. The DSPM considers, among others, the following parameters (Table 2): pore radius (), the ratio of effective membrane thickness over porosity , and volumetric charge density () [90], while for those of the DSPM-DE model, the dielectric constant in the pore () is also incorporated.
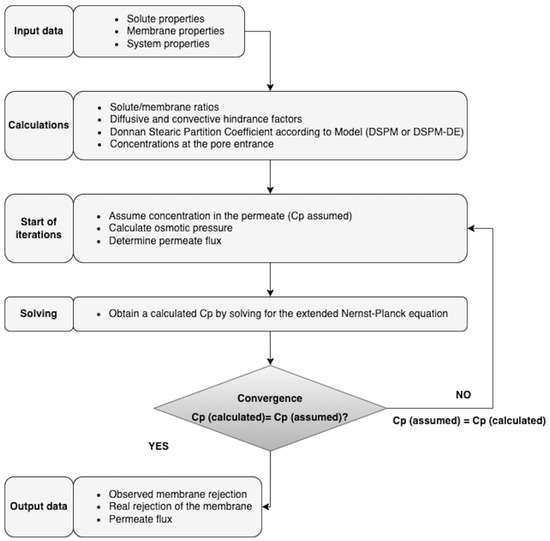
Figure 6.
Calculation algorithm for solving the DSPM and DSPM-DE models.
Table 2.
List of parameters with their method of acquisition for solving the DSPM and DSPM-DE.
The contribution of each transport mechanism was quantified based on the extended Nernst–Planck equation (Equation (1)), which presents three transport mechanisms for each ionic species: (1) diffusion (Equation (22)), (2) convection (Equation (23)), and (3) electro-migration (Equation (24)). Therefore, the relative effect in terms of percentage resistance is quantified using Equations (25)–(27):
The calculation algorithm was tested by simulating the nanofiltration process with the Dow-Filmtec NF90 module’s characteristics. This membrane has a molecular weight cut-off (MWCO) of 200 g/mol and a thickness of 1.34 μm [90,98,99]. The simulation of the process was carried out considering a brackish water matrix with physicochemical characteristics similar to the surface waters of the Camarones River, located in northern Chile (see Table 3). The operating pressure and temperature were 4.8 bar and 25 °C, respectively. The simulation results were compared with the information provided by the membrane manufacturer [100].
Table 3.
Ionic composition of brackish water [21].
2.2. Experiments with Monovalent and Divalent Saline Aqueous Solutions
The nanofiltration experiments were conducted in a pilot-scale plant located in the Department of Chemical and Bioprocess Engineering at the University of Santiago de Chile (USACH) (see Figure 7). The main components of the pilot plant included a Dow-Filmtec NF90 2540 spiral wound membrane module (see Table 4), membrane housing (length 40 in; diameter 2.5 in), high-pressure multistage vertical centrifugal pump Grundfos [101], a pH–conductivity–TDS meter, rotameters, pressure gauges, and a 5 μm cartridge filter.
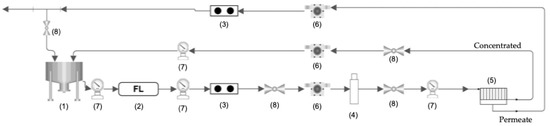
Figure 7.
Flowchart of the nanofiltration pilot plant: (1) tank, (2) filter (1 um), (3) conductivity meter, (4) high-pressure pump, (5) membrane module, (6) flowmeter, (7) manometer, and (8) valve.
Table 4.
Technical characteristics of the membrane used in the experiments [102].
The reagents used in the experiments were NaCl (99.5%, LOBA Chemie, Mumbai, Indian), MgSO4·7H2O (purity 99%) (99%, Wrinkler), NaOH (0.2 M, Merck, Darmstadt, Germany), and H2SO4 (95%) (95%, Merck).
The experiments allowed for the analysis of four cases:
- (1)
- Case 1: The permeability of pure water
- (2)
- Case 2: Variations in permeate flux and ionic rejection as functions of pressure and salt concentration.
- (3)
- Case 3: Behaviors of permeate flux and salt rejection as functions of feed water temperature.
- (4)
- Case 4: Variations in permeate flux and ionic rejection at different feed pH levels.
To study Case 1, the experiments were initially conducted in a temperature range between 20 and 30 °C while varying the operating pressure (4–14 bar). Subsequently, the experiments were carried out with the pressure fixed at 10.8 bar, while varying the temperature (20–36 °C). Later, to investigate Case 2, experimental runs were conducted with a feed flow of NaCl solution (500, 1000, and 2000 ppm) and MgSO4 solution (2000 ppm). For these experiments, the operating pressure ranged from 6.1 to 16.7 bar. Then, to investigate Case 3, a temperature range of 15 to 39 °C was considered. The operating pressure was 10.8 bar, and the feed flow was a NaCl solution of 2000 ppm. Finally, for Case 4, the operation was conducted at two different feed pH levels: at pH 8 by adding NaOH and at pH 5 by adding H2SO4. The experiment was conducted at 3 pressures: 6.1, 10.8, and 13.6 bar. The solution used was 2000 ppm MgSO4, and the temperature was maintained at 25 °C.
3. Results and Discussions
3.1. Simulations of Rejection for Each Ionic Species
The rejection results for each ion provided by the DSPM and DSPM-DE algorithms are shown in Figure 8. These results were compared with the data provided by the membrane manufacturer, aiming to quantify the discrepancies between the simulation results and the expectations set by the manufacturer. The divalent ions Ca2+, Mg2+, and SO42− have higher rejections, consistent with the experimental information and with what was predicted by the simulation. This is because these ions are larger than monovalent ions and have a greater hydration layer. This affects their solvation energy, making it more difficult for them to enter the pore and consequently increase ionic rejection. However, it was also observed that steric and Donnan exclusion effects are not the only phenomena explaining the rejection of these ions. In this regard, the effect of dielectric exclusion affects Ca2+ less than Mg2+, as Ca2+ has a smaller hydration layer than Mg2+. This aligns with the findings of Schaep et al. [91].
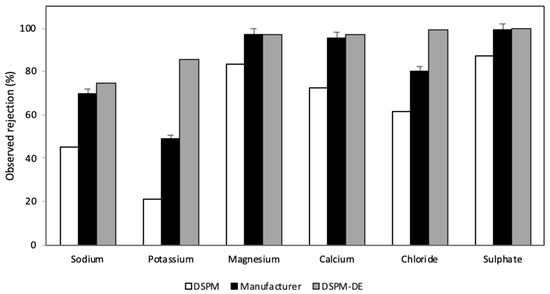
Figure 8.
Graph of the rejection reported by the manufacturer and that calculated according to the DSPM and DSPM-DE applied to brackish water.
Comparing the rejection between Na+ and K+, both models predict lower rejections compared to divalent ions. K+ has the worst fitting error, 65% and 80% in the DSPM and DSPM-DE, respectively. Despite potassium having a higher molecular weight than sodium, both simulation and experimental evidence indicate that K+ has a lower rejection than Na+. This is because K+ has a smaller Stokes radius and higher diffusivity than Na+. Therefore, the difference between the manufacturer’s data and the model results is due to the existing ionic interaction and the lower relative concentration of potassium in the considered water matrix. For K+, the DSPM-DE overestimated the rejection of monovalent ions.
In comparing the rejections predicted by the DSPM and DSPM-DE, it is observed that the Ca+2, Mg2+, and SO4−2 ions are the ions that best fit both models. In contrast, the results obtained for K+ ions differ from each other, especially when compared to the data reported by the manufacturer. It is important to note that the models were formulated for dilute solutions (ionic concentrations below 0.01 M), where interactions between solutes are very low or negligible, which is why these interactions can be ignored.
3.2. Model Sensitization: Permeate Rate and Membrane Pore Size
The permeate flows obtained with the DSPM and DSPM-DE had errors of 9% and 2%, respectively. Therefore, both models can be used to predict the permeate flow in an NF process. Consequently, the adjustments incorporated into the DSPM-DE that modify productivity are not relevant compared to the DSPM.
The DSPM is not the only one that uses the extended Nernst–Planck equation to predict ionic transport through an NF membrane. However, the characteristic feature of this model lies in the incorporation of hindrance factors for diffusion () and convection (), parameters that quantify the permeation phenomenon due to the nanometric size of the pores in an NF membrane. These hindrance factors are a function of the ratio between the solute radius and the pore radius (Equation (3)), where 0 < λ < 0.8. It is stated that a fully developed parabolic laminar profile is considered for determining the hindrance factors, which are the characteristic features of the DSPM. By varying the value of λ, the hindrance factor values will be modified, and since the Stokes radius of each ionic species is constant, only the pore size of the membrane can be varied. Some interesting aspects about the NF process are as follows:
- Diffusive, convective, and electro-migrative transports as a function of the membrane pore size. Figure 9a shows that when the pore size is less than, approximately, 1.0 nm, the contribution of the diffusive mechanism increases significantly. This is why a dense polymer with a small pore size will behave like a reverse osmosis membrane. Under such conditions, the transport of matter will be regulated by the solute-solvent solution–diffusion mechanism through the active layer of the membrane. In contrast, as the pore size increases, the behavior becomes closer to that of an ultrafiltration membrane. On the other hand, Figure 9b shows an opposite trend in terms of the percentage of convective contribution. This is because, as the pore size increases, the amount of fluid passing through the membrane increases, resulting in a greater contribution from transport due to the observable fluid velocity. Regarding the electro-migrative mechanism, it was observed that for most ionic species, its contribution was less than 7% of the total, except for the potassium ion, which reached 12% (see Figure 9c). This is because potassium is the ionic species with the highest convective contribution, resulting in greater rejection to maintain the electroneutrality of the solution.
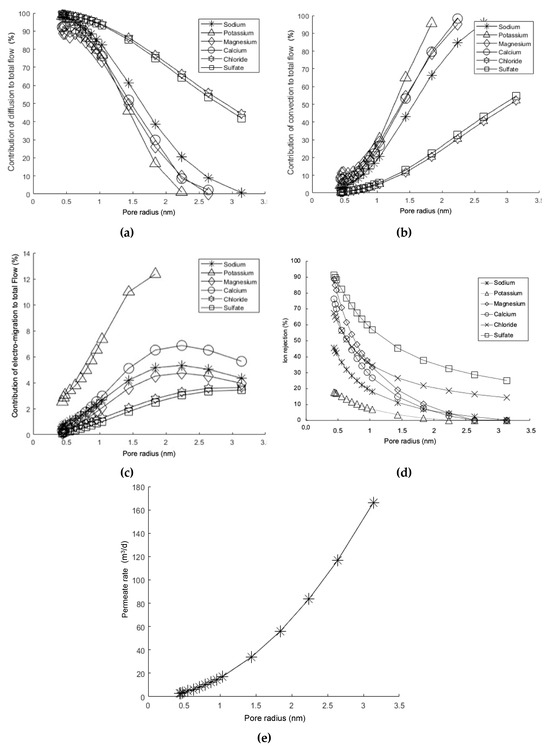 Figure 9. Simulation results (DSPM) for the percentage contributions of mechanisms as a function of membrane pore size: (a) diffusive mechanism, (b) convective mechanism, (c) electro-migrative mechanism; (d) ionic rejection as a function of membrane pore size, and (e) permeate rate as a function of membrane pore size. Operation pressure: 4.8 bar; concentration solutions: see Table 2.
 - Membrane pore size and ionic rejection. The phenomenon of ionic rejection increases as the pore size decreases (see Figure 9d). This is due to the steric effect, meaning that size exclusion becomes more significant as the pores become smaller. Additionally, as evidenced in Figure 9a, the reduction in pore size determines that the contribution of the diffusive mechanism becomes more predominant, which in turn slows down the transport, resulting in an increase in rejection for each ionic species. It is also noteworthy that the sulfate ion experiences much higher rejection, which is attributed to its size.
- Variation in permeate flux as a function of the membrane pore radius. The permeate rate increases as the membrane pore size increases (see Figure 9e). This result is expected [59,103,104], as it is a behavior observed in various membrane processes driven by a total pressure difference, such as microfiltration and ultrafiltration, whereas as the pore size decreases, the permeate rate also decreases, and vice versa. This is because the permeate rate is directly proportional to the space available for circulation.
3.3. Case 1—Experimental: Permeability of Pure Water
Figure 10 shows that the permeate flow in experiments with pure water is directly proportional to the total pressure difference. Similarly, it was observed that temperature increases the permeation rate, owing to the decrease in the viscosity of the permeating liquid, a characteristic behavior for the flow through a porous medium, as described by Darcy’s Law. Furthermore, the difference between the curves can also be explained by the effect of temperature on viscosity according to the Arrhenius–Guzman equation [105].
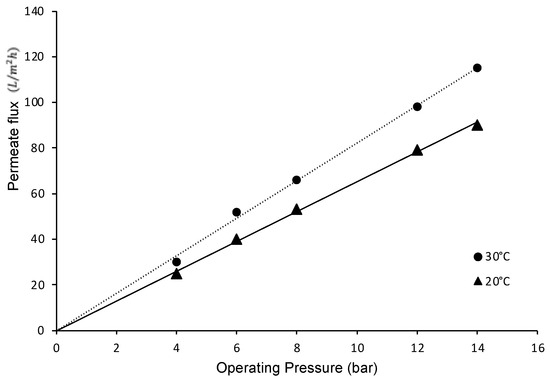
Figure 10.
Permeate flux as a function of the operating pressure of the system.
3.4. Case 2—Experimental: Variations in Permeate Flux and Ionic Rejection as Functions of Pressure and Salt Concentration
Figure 11a shows that as the operating pressure increases, the ionic rejection increases, regardless of the feed concentration. This is because increasing the operating pressure results in a greater increase in permeate flow than in ion flow through the membrane. This is reflected in the modeling for NF through Equations (1) and (15), which show that ionic flow depends on the concentration difference, while permeate flow is dependent on the system pressure. This behavior is like what is observed in reverse osmosis. Therefore, water transport depends on pressure, but salt transport depends on concentration (Fick’s Law). Thus, the amount of salt in the permeate is lower, and therefore, the rejection is higher. On the other hand, with an increase in salt concentration in the feed, ionic rejection should be lower, keeping pressure and temperature constant. This is because when the feed concentration is higher, the concentration difference between both sides of the membrane increases, favoring diffusive transport. Since ionic rejection is described by Equation (18), selectivity decreases.
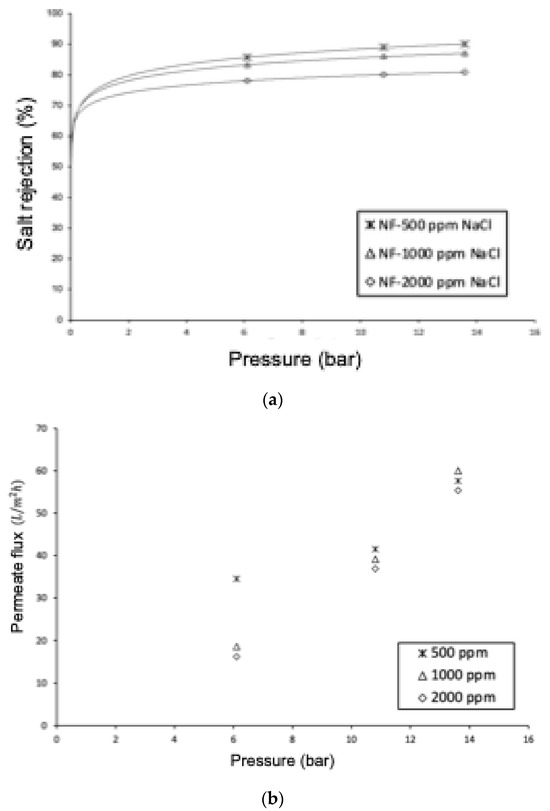
Figure 11.
Effect of pressure and salt concentration on (a) salt rejection and (b) permeate flow. NaCl solutions of 500 ppm, 1000 ppm, and 2000 ppm.
Another interesting result to analyze is the high rejection of NaCl by the NF90 membrane. To explain this behavior, we will consider the results obtained in the computational simulations, which have shown that the rejection of monovalent ions Na+ and Cl− is better described through the DSPM model, which considers only the steric exclusion mechanism and Donnan exclusion. From the model sensitization regarding the contributions of each transport mechanism involving the extended Nernst–Planck equation, the contribution of the electro-migrative mechanism is less than 4%, indicating that these ionic species are primarily rejected by steric mechanisms. The NF90 membrane has been classified by many researchers as a tight nanofiltration membrane due to its small pore size. The high rejections obtained for NaCl align with the study conducted by Krieg and colleagues [106], who achieved rejections of 90% for the NF90 membrane. This behavior has enabled some researchers [52,107] to desalinate seawater using a two-stage process with the NF90 membrane, saving 20–30% of energy compared to a single-stage reverse osmosis process. On the other hand, Figure 11b shows that as the salt content of the feed increases, the permeate flow decreases. This is related to the increase in the osmotic contribution of the solution, according to Equation (15), which results in a decrease in the net operating pressure difference, thereby causing the permeate flow to decrease. As observed in Figure 10, a linear relationship between the permeate flow and pressure was expected, However, the distribution pattern of the points can be attributed to membrane compression, along with the phenomenon of polarization [108], and undetected temperature changes in the experiment that are explained through the Arrhenius–Guzman equation [105].
The rejection of MgSO4 is higher than the rejection of NaCl (see Figure 12), due to the larger size of the Mg2+ and SO4−2 ions compared to Na+ and Cl−, as well as electrostatic and dielectric effects. The experimental rejections for multivalent ions are supported by the results of the DSPM-DE. Based on the model sensitization, the electro-migrative contribution is very low (around 4% of the total transport), indicating that the rejection of divalent ions is predominantly of a steric nature. On the other hand, the permeate fluxes for the 2000 ppm NaCl and 2000 ppm MgSO4 solutions show an average difference of over 4%, with higher rejection for the NaCl solution. This can be explained by the high rejection of the NF90 membrane to both types of ions, leading to an increase in osmotic pressures and resulting in similar permeate fluxes.
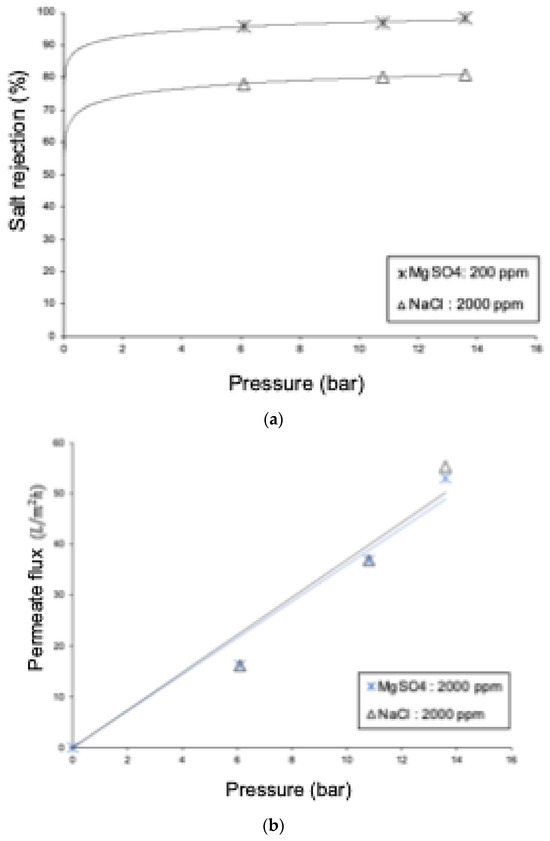
Figure 12.
Comparative graphs of the 2000 ppm NaCl and 2000 ppm MgSO4 solutions: (a) salt rejection and (b) permeate flux.
3.5. Case 3—Experimental: Behavior of Permeate Flux and Salt Rejection as a Function of Feed Water Temperature
Figure 13 shows experimental permeate flux results for pure water and for an aqueous NaCl solution. In both cases, permeation increases with temperature due to the viscous effect of the liquid. Comparing both curves, it was observed that the permeate flux of the solution was always lower than that of pure water at the same operating temperature. This is because the osmotic effect reduces the net pressure difference, which is the driving force for permeation. This behavior is like that of the RO process, especially considering that the NF membrane has a rejection of NaCl greater than 80%. On the other hand, Figure 13 shows that the rejection of NaCl increases with the rise in temperature. Similar to the reverse osmosis process, water permeation through an NF membrane is favored by thermal elevation without affecting solute flux in the same way. Consequently, there will be a permeate with a lower salt concentration, resulting in higher rejection.
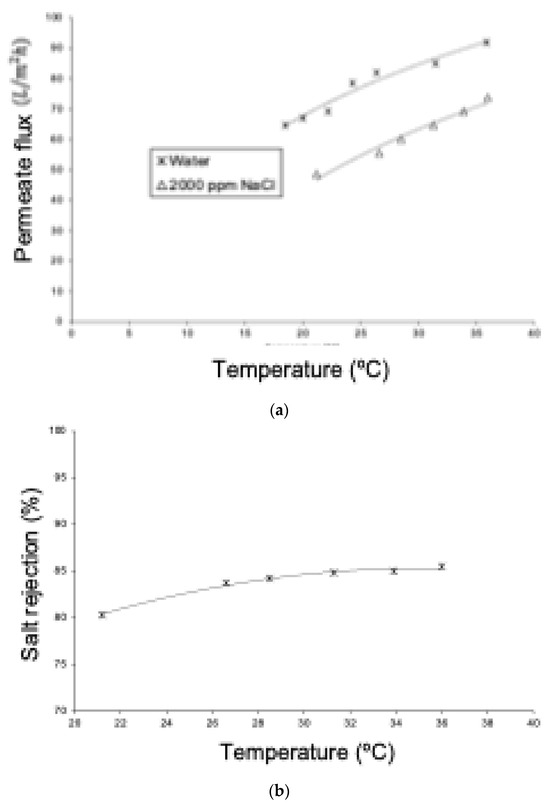
Figure 13.
(a) Comparison of the permeate flux density as a function of feed temperature for pure water and a 2000 ppm NaCl solution. Pressure: 10.8 bar. (b) Variation in ionic rejection as a function of feed temperature for NF. NaCl solution of 2000 ppm and pressure of 10.8 bar.
3.6. Case 4—Experimental: Variations in Permeate Flux and Ionic Rejection at Different Feed pH Levels
Figure 14 shows the effect of pH on the rejection of MgSO4, with a noticeable decrease in rejection at acidic pH levels (4.0) compared to the behavior at basic pH (8.0), estimating a significant difference in the range of 10 to 30 percentage points. The relationship between ionic rejection and pressure followed the expected pattern, increasing as the pressure rose. However, a significantly lower rejection was observed at an acidic pH compared to the experimentation carried out at a basic pH. To explain this behavior, it is necessary to mention that the NF 90 membrane has its isoelectric point at pH 4.5. At this value, the electric charge density is close to zero, making the rejection due to Donnan’s electrostatic effects practically negligible. The steeper slope for pH 4.0 could indicate the favoring of transport mechanisms other than electrostatic effects. On the other hand, it is reported that the permeate flux did not show significant differences.

Figure 14.
Comparison of ionic rejection at different pH values.
4. Conclusions
The DSPM and DSPM-DE theories have facilitated the description of mechanisms involving simultaneous diffusive, convective, and dielectric exclusion processes. This study, from both a theoretical and experimental perspective, delved into the research of nanofiltration, interpreting results in the context of the constitutive equations of the DSPM and DSPM-DE theories. Mathematical simulations were conducted, resulting in calculation algorithms that were fine-tuned for various operating conditions and membrane NF porosity levels.
Under certain operating conditions, nanofiltration approximates the behavior of reverse osmosis, where the diffusive mechanism is the most relevant transport through the membrane. For other operating conditions and sensitivities, the mechanisms of electrostatic interaction, dielectric exclusion, and Donnan exclusion become relevant, manifesting themselves both at the membrane surface and inside the pores.
An adequate combination of both theories allows for an approximation to the real behavior of nanofiltration. Although their theoretical basis is similar—the dielectric exclusion of a charged membrane in contact with ionic solutions—for some ions of different size and charge, the DSPM theory based on a polarized layer due to electrostatic interactions between ions in solution is appropriate, while the DSPM-DE theory, which predicts a solvation energy barrier formed by ions in solution, is the approach closest to experimental reality. The initial simulations show a good fit to the brackish data from northern Chile.
The simulations showed that monovalent ions are more appropriately fitted to the DSPM, while divalent ions are fitted to the DSPM-DE, regardless of the type of feedwater used. In particular, the DSPM adapted to the monovalent cation sodium, while the DSPM-DE adapted to the divalent cation magnesium. Emphasis is placed on the need to consider the electroneutrality of each result obtained, calculated by the algorithms of the models. In particular, the model sensitivity analysis of the DSPM showed that it adequately predicted NF for membranes with pore sizes ranging from 0.5 nm to 3.5 nm. For values outside this range, the model experienced convergence issues.
Experimentally, the NF90 membrane exhibited an average salt rejection of approximately 85% for NaCl and 98% for MgSO4, with results obtained at neutral or slightly basic pH levels.
Author Contributions
Conceptualization, A.S. and J.V.; methodology, A.S. and J.V.; validation, A.S., J.V. and H.V.; formal analysis, A.S., J.V. and H.V.; investigation, A.S. and J.V.; resources, A.S.; data curation, J.V.; writing—original draft preparation, A.S. and H.V.; writing—review and editing, A.S., S.H., J.V. and H.V.; visualization, J.V. and H.V; supervision, A.S.; project administration, A.S.; funding acquisition, A.S. All authors have read and agreed to the published version of the manuscript.
Funding
This research was funded by the Universidad de Santiago de Chile (USACH), grant number DICYT Project 092011SF.
Institutional Review Board Statement
Not applicable.
Informed Consent Statement
Not applicable.
Data Availability Statement
Calculation algorithm.
Acknowledgments
A.S. would like to give thanks to DICYT Project 092011SF, Universidad de Santiago de Chile, for supporting their research in desalination. H.V. would like to give thanks to UCM/VRIP Project UCM-IN-21201, Universidad Católica del Maule, for supporting their research in sustainable processes.
Conflicts of Interest
The authors declare no conflicts of interest. Sebastian Hernandez was employed by the company Samsara Eco Pty Limited. The remaining authors declare that the research was conducted in the absence of any commercial or financial relationships that could be construed as a potential conflict of interest.
References
- Verma, B.; Balomajumder, C.; Sabapathy, M.; Gumfekar, S.P. Pressure-driven membrane process: A review of advanced technique for heavy metals remediation. Processes 2021, 9, 752. [Google Scholar] [CrossRef]
- Hidalgo, A.M.; León, G.; Murcia, M.D.; Gómez, M.; Gómez, E.; Gómez, J.L. Using pressure-driven membrane processes to remove emerging pollutants from aqueous solutions. Int. J. Environ. Res. Public Health 2021, 18, 4036. [Google Scholar] [CrossRef] [PubMed]
- Kamiloglu, S.; Ozdal, T.; Catalkaya, G.; Capanoglu, E. Separation of Polyphenols and Carotenoids using Nanofiltration. In Membrane Separation of Food Bioactive Ingredients; Springer: Cham, Switzerland, 2022; pp. 205–238. [Google Scholar] [CrossRef]
- Mkilima, T.; Bazarbayeva, T.; Assel, K.; Nurmukhanbetova, N.N.; Ostretsova, I.B.; Khamitova, A.S.; Makhanova, S.; Sergazina, S. Pore Size in the Removal of Phosphorus and Nitrogen from Poultry Slaughterhouse Wastewater Using Polymeric Nanofiltration Membranes. Water 2022, 14, 2929. [Google Scholar] [CrossRef]
- Lan, Q.; Feng, C.; Ou, K.; Wang, Z.; Wang, Y.; Liu, T. Phenolic membranes with tunable sub-10-nm pores for nanofiltration and tight-ultrafiltration. J. Membr. Sci. 2021, 640, 119858. [Google Scholar] [CrossRef]
- Saavedra, A.; Valdés, H.; Mahn, A.; Acosta, O. Comparative Analysis of Conventional and Emerging Technologies for Seawater Desalination: Northern Chile as A Case Study. Membranes 2021, 11, 180. [Google Scholar] [CrossRef] [PubMed]
- Abdel-Fatah, M.A. Nanofiltration systems and applications in wastewater treatment: Review article. Ain Shams Eng. J. 2018, 9, 3077–3092. [Google Scholar] [CrossRef]
- Yang, Z.; Zhou, Y.; Feng, Z.; Rui, X.; Zhang, T.; Zhang, Z. A Review on Reverse Osmosis and Nanofiltration Membranes for Water Purification. Polymers 2019, 11, 1252. [Google Scholar] [CrossRef] [PubMed]
- Zhao, Y.; Tong, T.; Wang, X.; Lin, S.; Reid, E.M.; Chen, Y. Differentiating solutes with precise nanofiltration for next generation environmental separations: A review. Environ. Sci. Technol. 2021, 55, 1359–1376. [Google Scholar] [CrossRef] [PubMed]
- Teow, Y.H.; Sum, J.Y.; Ho, K.C.; Mohammad, A.W. Principles of nanofiltration membrane processes. In Osmosis Engineering; Elsevier: Amsterdam, The Netherlands, 2021; pp. 53–95. [Google Scholar] [CrossRef]
- Rosentreter, H.; Walther, M.; Lerch, A. Partial Desalination of Saline Groundwater: Comparison of Nanofiltration, Reverse Osmosis and Membrane Capacitive Deionisation. Membranes 2021, 11, 126. [Google Scholar] [CrossRef]
- Hilal, N.; Al-Zoubi, H.; Darwish, N.A.; Mohamma, A.W.; Arabi, M.A. A comprehensive review of nanofiltration membranes: Treatment, pretreatment, modelling, and atomic force microscopy. Desalination 2004, 170, 281–308. [Google Scholar] [CrossRef]
- Elsaid, K.; Sayed, E.T.; Abdelkareem, M.A.; Baroutaji, A.; Olabi, Y.A. Environmental impact of desalination processes: Mitigation and control strategies. Sci. Total Environ. 2020, 740, 140125. [Google Scholar] [CrossRef] [PubMed]
- Pontié, M.; Dach, H.; Leparc, J.; Hafsi, M.; Lhassani, A. Novel approach combining physico-chemical characterizations and mass transfer modelling of nanofiltration and low pressure reverse osmosis membranes for brackish water desalination intensification. Desalination 2008, 221, 174–191. [Google Scholar] [CrossRef]
- Schäfer, A.I.; Fane, A.G. (Eds.) Nanofiltration: Principles, Applications, and New Materials; John Wiley & Sons: Hoboken, NJ, USA, 2021. [Google Scholar]
- Aouni, A.; Fersi, C.; Cuartas-Uribe, B.; Bes-Pía, A.; Alcaina-Miranda, M.I.; Dhahbi, M. Reactive dyes rejection and textile effluent treatment study using ultrafiltration and nanofiltration processes. Desalination 2012, 297, 87–96. [Google Scholar] [CrossRef]
- Siddique, T.; Dutta, N.K.; Roy Choudhury, N. Nanofiltration for Arsenic Removal: Challenges, Recent Developments, and Perspectives. Nanomaterials 2020, 10, 1323. [Google Scholar] [CrossRef] [PubMed]
- Worou, C.N.; Chen, Z.L.; Bacharou, T. Arsenic removal from water by nanofiltration membrane: Potentials and limitations. Water Pract. Technol. 2021, 16, 291–319. [Google Scholar] [CrossRef]
- Zaviska, F.; Drogui, P.; Grasmick, A.; Azais, A.; Héran, M. Nanofiltration membrane bioreactor for removing pharma-ceutical compounds. J. Membr. Sci. 2013, 429, 121–129. [Google Scholar] [CrossRef]
- Lin, Y.L.; Chiou, J.H.; Lee, C.H. Effect of silica fouling on the removal of pharmaceuticals and personal care products by nanofiltration and reverse osmosis membranes. J. Hazard. Mater. 2014, 277, 102–109. [Google Scholar] [CrossRef] [PubMed]
- Saavedra, A.; Valdes, H.; Zuñiga, C. Manual Técnico de Desalación y Purificación de Aguas Mediante Membranas. Informativo INIA 462, Instituto de Investigaciones Agropecuarias, Centro Regional de investigación La Cruz, Chile. 2022. Available online: https://hdl.handle.net/20.500.14001/68743 (accessed on 23 January 2023). (In Spanish).
- Zhou, D.; Zhu, L.; Fu, Y.; Zhu, M.; Xue, L. Development of lower cost seawater desalination processes using nanofiltration technologies—A review. Desalination 2015, 376, 109–116. [Google Scholar] [CrossRef]
- Hofmann, K.; Hamel, C. Screening and Scale-up of Nanofiltration Membranes for Concentration of Lactose and Real Whey Permeate. Membranes 2023, 13, 173. [Google Scholar] [CrossRef]
- Simonič, M.; Pintarič, Z.N. Study of Acid Whey Fouling after Protein Isolation Using Nanofiltration. Membranes 2021, 11, 492. [Google Scholar] [CrossRef]
- Timmer, J.M.K.; Van der Horst, H.C. Whey processing and separation technology: State of the art and new developments. Whey Bull. 1998, 9804, 40–65. [Google Scholar]
- Yadav, D.; Karki, S.; Ingole, P.G. Nanofiltration (NF) membrane processing in the food industry. Food Eng. Rev. 2022, 14, 579–595. [Google Scholar] [CrossRef]
- Belleville, M.P.; Sanchez-Marcano, J.; Bargeman, G.; Timmer, M. Nanofiltration in the food industry. In Nanofiltration: Principles, Applications, and New Materials; Wiley: Hoboken, NJ, USA, 2021; Volume 2, pp. 499–542. [Google Scholar] [CrossRef]
- Sontakke, A.D.; Das, P.P.; Mondal, P.; Purkait, M.K. Thin-film composite nanofiltration hollow fiber membranes toward textile industry effluent treatment and environmental remediation applications. Emergent Mater. 2021, 5, 1409–1427. [Google Scholar] [CrossRef]
- Li, Y.; Xiong, S.; Tang, X.; Wu, H.; Han, C.; Yi, M.; Wang, Y. Loose nanofiltration membrane with highly-branched SPEI/PEI assembly for dye/salt textile wastewater treatment. J. Environ. Chem. Eng. 2021, 9, 106371. [Google Scholar] [CrossRef]
- Yang, L.; Xia, C.; Jiang, J.; Chen, X.; Zhou, Y.; Yuan, C.; Bai, L.; Meng, S.; Cao, G. Removal of antibiotics and estrogens by nanofiltration and reverse osmosis membranes. J. Hazard. Mater. 2024, 461, 132628. [Google Scholar] [CrossRef] [PubMed]
- Nasrollahi, N.; Vatanpour, V.; Khataee, A. Removal of antibiotics from wastewaters by membrane technology: Limitations, successes, and future improvements. Sci. Total Environ. 2022, 838, 156010. [Google Scholar] [CrossRef] [PubMed]
- Aziz, M.; Ojumu, T. Exclusion of Estrogenic and Androgenic Steroid Hormones from Municipal Membrane Bioreactor Wastewater Using UF/NF/RO Membranes for Water Reuse Application. Membranes 2020, 10, 37. [Google Scholar] [CrossRef] [PubMed]
- Alarifi, I.M. Nanofiltration for blood products. In Nanotechnology for Hematology, Blood Transfusion, and Artificial Blood; Micro and Nano Technologies: Rajasthan, India, 2022; pp. 371–395. [Google Scholar] [CrossRef]
- Ideno, S.; Takahashi, K.; Yusa, K.; Sakai, K. Quantitative PCR evaluation of parvovirus B19 removal via nanofiltration. J. Virol. Methods 2020, 275, 113755. [Google Scholar] [CrossRef] [PubMed]
- Barro, L.; Nebie, O.; Chen, M.S.; Wu, Y.W.; Koh, M.B.; Knutson, F.; Watanabe, N.; Takahara, M.; Burnouf, T. Nanofiltration of growth media supplemented with human platelet lysates for pathogen-safe xeno-free expansion of mesenchymal stromal cells. Cytotherapy 2020, 22, 458–472. [Google Scholar] [CrossRef]
- Domingos, J.M.; Martinez, G.A.; Morselli, E.; Bandini, S.; Bertin, L. Reverse osmosis and nanofiltration opportunities to concentrate multicomponent mixtures of volatile fatty acids. Sep. Purif. Technol. 2022, 290, 120840. [Google Scholar] [CrossRef]
- Zhu, Y.; Galier, S.; Roux-de Balmann, H. Description of the variation of retention versus pH in nanofiltration of organic acids. J. Membr. Sci. 2021, 637, 119588. [Google Scholar] [CrossRef]
- Cooper, J.; Ye, Y.; Razmjou, A.; Chen, V. High-value organic acid recovery from first-generation bioethanol dunder using nanofiltration. Ind. Eng. Chem. Res. 2020, 59, 11940–11952. [Google Scholar] [CrossRef]
- Esser, T.; Huber, M.; Voß, D.; Albert, J. Development of an efficient downstream process for product separation and catalyst recycling of a homogeneous polyoxometalate catalyst by means of nanofiltration membranes and design of experiments. Chem. Eng. Res. Des. 2022, 185, 37–50. [Google Scholar] [CrossRef]
- Schnoor, J.-K.; Bettmer, J.; Kamp, J.; Wessling, M.; Liauw, M.A. Recycling and Separation of Homogeneous Catalyst from Aqueous Multicomponent Mixture by Organic Solvent Nanofiltration. Membranes 2021, 11, 423. [Google Scholar] [CrossRef]
- Schnoor, J.K.; Fuchs, M.; Böcking, A.; Wessling, M.; Liauw, M.A. Homogeneous catalyst recycling and separation of a multicomponent mixture using organic solvent nanofiltration. Chem. Eng. Technol. 2019, 42, 2187–2194. [Google Scholar] [CrossRef]
- Gagnon, R.D.; Langevin, M.È.; Lutin, F.; Bazinet, L. Impact of nanofiltration pre-concentration prior to a combination of electrodialytic processes on the extraction of proteins from tofu whey. Future Foods 2023, 8, 100258. [Google Scholar] [CrossRef]
- Ghalamara, S.; Coscueta, E.R.; Silva, S.; Brazinha, C.; Pereira, C.D.; Pintado, M.E. Integrated ultrafiltration, nanofiltration, and reverse osmosis pilot process to produce bioactive protein/peptide fractions from sardine cooking effluent. J. Environ. Manag. 2022, 317, 115344. [Google Scholar] [CrossRef]
- Roth, N.J.; Dichtelmüller, H.O.; Fabbrizzi, F.; Flechsig, E.; Gröner, A.; Gustafson, M.; Jorquera, J.; Kreil, T.; Misztela, D.; Moretti, E.; et al. Nanofiltration as a robust method contributing to viral safety of plasma-derived therapeutics: 20 yearsʼ experience of the plasma protein manufacturers. Transfusion 2020, 60, 2661–2674. [Google Scholar] [CrossRef]
- Pal, P.; Chakrabortty, S.; Linnanen, L. A nanofiltration–coagulation integrated system for separation and stabilization of arsenic from groundwater. Sci. Total Environ. 2014, 476, 601–610. [Google Scholar] [CrossRef]
- Saitua, H.; Gil, R.; Padilla, A.P. Experimental investigation on arsenic removal with a nanofiltration pilot plant from naturally contaminated groundwater. Desalination 2011, 274, 1–6. [Google Scholar] [CrossRef]
- Wang, S.; Li, L.; Yu, S.; Dong, B.; Gao, N.; Wang, X. A review of advances in EDCs and PhACs removal by nanofiltration: Mechanisms, impact factors and the influence of organic matter. Chem. Eng. J. 2021, 406, 126722. [Google Scholar] [CrossRef]
- Nguyen, L.D.; Gassara, S.; Bui, M.Q.; Zaviska, F.; Sistat, P.; Deratani, A. Desalination and removal of pesticides from surface water in Mekong Delta by coupling electrodialysis and nanofiltration. Environ. Sci. Pollut. Res. 2019, 26, 32687–32697. [Google Scholar] [CrossRef] [PubMed]
- Madsen, H.T.; Søgaard, E.G. Applicability and modelling of nanofiltration and reverse osmosis for remediation of groundwater polluted with pesticides and pesticide transformation products. Sep. Purif. Technol. 2014, 125, 111–119. [Google Scholar] [CrossRef]
- Lee, J.; Shin, Y.; Boo, C.; Hong, S. Performance, limitation, and opportunities of acid-resistant nanofiltration membranes for industrial wastewater treatment. J. Membr. Sci. 2023, 666, 121142. [Google Scholar] [CrossRef]
- Sharma, M.; Meena, N.; Chauhan, P.; Nehra, S.; Pachwarya, R.B.; Sharma, R.; Kumar, D. Desalination Through Nanofiltration Technique. In Nanofiltration Membrane for Water Purification; Springer Nature Singapore: Singapore, 2023; pp. 141–156. [Google Scholar] [CrossRef]
- Vuong, D.X. Two Stage Nanofiltration Seawater Desalination System. U.S. Patent No. 7,144,511, 5 December 2006. [Google Scholar]
- Harrison, C.J.; Le Gouellec, Y.A.; Cheng, R.C.; Childress, A.E. Benchscale testing of nanofiltration for seawater desalination. J. Environ. Eng. 2007, 133, 1004–1014. [Google Scholar] [CrossRef]
- Elmenshawy, M.R.; Shalaby, S.M.; Elshinnawy, A.I.; Gado, T.A. Groundwater desalination for agricultural purposes using reverse osmosis and nanofiltration technologies: Case study wadi El-natrun, Egypt. Process Saf. Environ. Prot. 2023, 180, 669–685. [Google Scholar] [CrossRef]
- Khawaji, A.D.; Kutubkhanah, I.K.; Wie, J.M. Advances in seawater desalination technologies. Desalination 2008, 221, 47–69. [Google Scholar] [CrossRef]
- Choi, Y.H.; Kweon, J.H.; Kim, D.I.; Lee, S. Evaluation of various pretreatment for particle and inorganic fouling control on performance of SWRO. Desalination 2009, 247, 137–147. [Google Scholar] [CrossRef]
- Vacassy, R.; Guizard, C.; Thoraval, V.; Cot, L. Synthesis and characterization of microporous zirconia powders: Application in nanofilters and nanofiltration characteristics. J. Membr. Sci. 1997, 132, 109–118. [Google Scholar] [CrossRef]
- Stawikowska, J.; Livingston, A. New developments in the physio-chemical characterization of OSN membranes. In Proceedings of the Third International Conference on Organic Solvent Nanofiltration, London, UK, 13–15 September 2010. [Google Scholar]
- Bowen, W.R.; Welfoot, J.S. Modelling of membrane nanofiltration—Pore size distribution effects. Chem. Eng. Sci. 2002, 57, 1393–1407. [Google Scholar] [CrossRef]
- Glater, J. The early history of reverse osmosis membrane development. Desalination 1998, 117, 297–309. [Google Scholar] [CrossRef]
- Childress, A.E.; Elimelech, M. Effect of solution chemistry on the surface charge of polymeric reverse osmosis and nano-filtration membranes. J. Membr. Sci. 1996, 119, 253–268. [Google Scholar] [CrossRef]
- Domenech, N.G.; Purcell-Milton, F.; Gun’ko, Y.K. Recent progress and future prospects in development of advanced materials for nanofiltration. Mater. Today Commun. 2020, 23, 100888. [Google Scholar] [CrossRef]
- Jamil, T.S.; Nasr, R.A.; Abbas, H.A.; Ragab, T.I.; Xabela, S.; Moutloali, R. Low-Cost High Performance Polyamide Thin Film Composite (Cellulose Triacetate/Graphene Oxide) Membranes for Forward Osmosis Desalination from Palm Fronds. Membranes 2022, 12, 6. [Google Scholar] [CrossRef]
- Merlet, R.B.; Pizzoccaro-Zilamy, M.A.; Nijmeijer, A.; Winnubst, L. Hybrid ceramic membranes for organic solvent nanofiltration: State-of-the-art and challenges. J. Membr. Sci. 2020, 599, 117839. [Google Scholar] [CrossRef]
- Van Gestel, T.; Kruidhof, H.; Blank, D.H.; Bouwmeester, H.J. ZrO2 and TiO2 membranes for nanofiltration and per-vaporation: Part 1. Preparation and characterization of a corrosion-resistant ZrO2 nanofiltration membrane with a MWCO < 300. J. Membr. Sci. 2006, 284, 128–136. [Google Scholar] [CrossRef]
- Verweij, H. Inorganic membranes. Curr. Opin. Chem. Eng. 2012, 1, 156–162. [Google Scholar] [CrossRef]
- Lu, G.Q.; Da Costa, J.D.; Duke, M.; Giessler, S.; Socolow, R.; Williams, R.H.; Kreutz, T. Inorganic membranes for hydrogen production and purification: A critical review and perspective. J. Colloid. Interface Sci. 2007, 314, 589–603. [Google Scholar] [CrossRef]
- Lau, W.J.; Gray, S.; Matsuura, T.; Emadzadeh, D.; Chen, J.P.; Ismail, A.F. A review on polyamide thin film nanocomposite (TFN) membranes: History, applications, challenges and approaches. Water Res. 2015, 80, 306–324. [Google Scholar] [CrossRef]
- Khulbe, K.C.; Matsuura, T. Synthetic membrane characterization—A review: Part I. Membr. Technol. 2017, 2017, 7–12. [Google Scholar] [CrossRef]
- Mohammad, A.W.; Teow, Y.H.; Ang, W.L.; Chung, Y.T.; Oatley-Radcliffe, D.L.; Hilal, N. Nanofiltration membranes review: Recent advances and future prospects. Desalination 2015, 356, 226–254. [Google Scholar] [CrossRef]
- Wang, R.; Lin, S. Pore model for nanofiltration: History, theoretical framework, key predictions, limitations, and prospects. J. Membr. Sci. 2021, 620, 118809. [Google Scholar] [CrossRef]
- Donnan, F.G. Theory of membrane equilibria and membrane potentials in the presence of non-dialysing electrolytes. A contribution to physical-chemical physiology. J. Membr. Sci. 1995, 100, 45–55. [Google Scholar] [CrossRef]
- Suhalim, N.S.; Kasim, N.; Mahmoudi, E.; Shamsudin, I.J.; Mohammad, A.W.; Mohamed Zuki, F.; Jamari, N.L.A. Rejection Mechanism of Ionic Solute Removal by Nanofiltration Membranes: An Overview. Nanomaterials 2022, 12, 437. [Google Scholar] [CrossRef] [PubMed]
- Oatley-Radcliffe, D.L.; Walters, M.; Ainscough, T.J.; Williams, P.M.; Mohammad, A.W.; Hilal, N. Nanofiltration membranes and processes: A review of research trends over the past decade. J. Water Process Eng. 2017, 19, 164–171. [Google Scholar] [CrossRef]
- Fernández, I. Estudio del Comportamiento de una Membrana de Nanofiltración de Bajo Ensuciamiento Frente a Disoluciones Iónicas. Desarrollo de Metodologías de Ajuste de los Parámetros del Modelo DSPM con Efectos Dieléctricos. Ph.D. Thesis, Universitat Politècnica de València, Valencia, Spain, 2017. [Google Scholar] [CrossRef]
- Ortiz-Albo, P.; Ibañez, R.; Urtiaga, A.; Ortiz, I. Phenomenological prediction of desalination brines nanofiltration through the indirect determination of zeta potential. Sep. Purif. Technol. 2019, 210, 746–753. [Google Scholar] [CrossRef]
- Fernández de Labastida, M.; Yaroshchuk, A. Nanofiltration of multi-ion solutions: Quantitative control of concentration polarization and interpretation by solution-diffusion-electro-migration model. Membranes 2021, 11, 272. [Google Scholar] [CrossRef] [PubMed]
- Israelachvili, J.N. Intermolecular and Surface Forces, 3rd ed.; Elsevier Inc.: Amsterdam, The Netherlands; Academic Press: Cambridge, MA, USA, 2011. [Google Scholar]
- Bandini, S.; Bruni, L. Transport phenomena in nanofiltration membranes. In Comprehensive Membrane Science and Engineering, Volume 2: Membrane Operations in Molecular Separations; Drioli, E., Giorno, L., Eds.; Elsevier: Oxford, UK, 2010; pp. 67–89. [Google Scholar]
- Lyklema, J.; Van Leeuwen, H.P.; Minor, M. DLVO-theory, a dynamic reinterpretation. Adv. Colloid. Interface Sci. 1999, 83, 33–69. [Google Scholar] [CrossRef]
- Oatley, D.L.; Llenas, L.; Pérez, R.; Williams, P.M.; Martínez-Lladó, X.; Rovira, M. Review of the dielectric properties of nanofiltration membranes and verification of the single oriented layer approximation. Adv. Colloid. Interface Sci. 2012, 173, 1–11. [Google Scholar] [CrossRef]
- Vatsa, S.; Kumar, M.; Ghanghas, N.; Prabhakar, P.K.; Meghwal, M. Nanofiltration: Principles, Process Modeling, and Applications. In Food Processing; CRC Press: Boca Raton, FL, USA, 2021; pp. 195–222. [Google Scholar]
- Zhang, Y.; Zhang, L.; Hou, L.; Kuang, S.; Yu, A. Modeling of the variations of permeate flux, concentration polarization, and solute rejection in nanofiltration system. AIChE J. 2019, 65, 1076–1087. [Google Scholar] [CrossRef]
- Jye, L.W.; Ismail, A.F. Nanofiltration Membranes: Synthesis, Characterization, and Applications; CRC Press: Boca Raton, FL, USA, 2016. [Google Scholar] [CrossRef]
- Ghorbani, A.; Bayati, B.; Drioli, E.; Macedonio, F.; Kikhavani, T.; Frappa, M. Modeling of nanofiltration process using dspm-de model for purification of amine solution. Membranes 2021, 11, 230. [Google Scholar] [CrossRef] [PubMed]
- Abderrezak, B.; Mehdi, M.; Drouiche, N.; Wenten, I.G.; Hakim, L. Progress of fitting models describing transport phenomena within nanofiltration membranes: A review. Desalin Water Treat. 2020, 184, 94–129. [Google Scholar] [CrossRef]
- Dresner, L. Some remarks on the integration of the extended Nernst-Planck equations in the hyperfiltration of multicomponent solutions. Desalination 1972, 10, 27–46. [Google Scholar] [CrossRef]
- Bandini, S.; Vezzani, D. Nanofiltration modeling: The role of dielectric exclusion in membrane characterization. Chem. Eng. Sci. 2003, 58, 3303–3326. [Google Scholar] [CrossRef]
- Bowen, W.R.; Mohammad, A.W. Characterization and prediction of nanofiltration membrane performance-A general assessment. Chem. Eng. Res. Des. 1998, 76, 885–893. [Google Scholar] [CrossRef]
- Mohammad, A.W.; Hilal, N.; Al-Zoubi, H.; Darwish, N.A. Prediction of permeate fluxes and rejections of highly concentrated salts in nanofiltration membranes. J. Membr. Sci. 2007, 289, 40–50. [Google Scholar] [CrossRef]
- Schaep, J.; Vandecasteele, C.; Mohammad, A.W.; Bowen, W.R. Analysis of the salt retention of nanofiltration membranes using the Donnan-steric partitioning pore model. Sep. Sci. Technol. 1999, 34, 3009–3030. [Google Scholar] [CrossRef]
- Schaep, J.; Van der Bruggen, B.; Vandecasteele, C.; Wilms, D. Influence of ion size and charge in nanofiltration. Sep. Sci. Technol. 1998, 14, 155–162. [Google Scholar] [CrossRef]
- Mulder, M.; Mulder, J. Basic Principles of Membrane Technology; Springer Science & Business Media: Berlin/Heidelberg, Germany, 1996. [Google Scholar]
- Couto, P.C.D.; Chipman, D.M. How does dielectric solvation affect the size of an ion? J. Phys. Chem. A 2010, 114, 12788–12793. [Google Scholar] [CrossRef]
- Pintauro, P.N.; Tandon, R.; Chao, L.; Xu, W.; Evilia, R. Equilibrium partitioning of monovalent/divalent cation-salt mixtures in Nafion cation-exchange membranes. J. Phys. Chem. 1995, 99, 12915–12924. [Google Scholar] [CrossRef]
- Guzmán-Garcia, A.G.; Pintauro, P.N.; Verbrugge, M.W.; Hill, R.F. Development of a space-charge transport model for ion-exchange membranes. AIChE J. 1990, 36, 1061–1074. [Google Scholar] [CrossRef]
- Senapati, S.; Chandra, A. Dielectric constant of water confined in a nanocavity. J. Phys. Chem. B 2001, 105, 5106–5109. [Google Scholar] [CrossRef]
- Santafé-Moros, A.; Gozálvez-Zafrilla, J.M.; Lora-García, J. Applicability of the DSPM with dielectric exclusion to a high rejection nanofiltration membrane in the separation of nitrate solutions. Desalination 2008, 221, 268–276. [Google Scholar] [CrossRef]
- Kamada, T.; Ohara, T.; Shintani, T.; Tsuru, T. Controlled surface morphology of polyamide membranes via the addition of co-solvent for improved permeate flux. J. Membr. Sci. 2014, 467, 303–312. [Google Scholar] [CrossRef]
- Lenntech. FILMTEC NF90-2540 Nanofiltration Elements for Commercial Systems. FILMTEC Membranes, Lenntech Water Treatment Solutions, Delft, Netherland. 2022. Available online: https://www.lenntech.com/Data-sheets/Dow-Filmtec-NF90-2540.pdf (accessed on 19 October 2023).
- Grundfos. Specifications: CRIE 1-27 A-FGJ-A-E-HQQE. Bombas Grundfos España S.A, Madrid, España. 2020. Available online: https://product-selection.grundfos.com/es/products/cr-cre-cri-crie-crn-crne-crt-crte/crie/ (accessed on 6 October 2023).
- Pure Aqua. DOW FILMTEC NF90-2540 Membrane. Pure Aqua Inc., Reverse Osmosis & Water Treatment, Santa Ana, CA 92704, United States. 2017. Available online: https://pureaqua.com/content/pdf/dow-filmtec-nf90-2540-membrane.pdf (accessed on 6 October 2023).
- Wang, L. Molecular Dynamics Simulations of Liquid Transport through Nanofiltration Membranes. Ph.D. Thesis, McMaster University, Hamilton, ON, Canada, 2012. Available online: http://hdl.handle.net/11375/12488 (accessed on 7 January 2024).
- Zhang, T.; Fu, R.Y.; Wang, K.P.; Gao, Y.W.; Li, H.R.; Wang, X.M.; Xie, Y.F. Effect of synthesis conditions on the non-uniformity of nanofiltration membrane pore size distribution. J. Membr. Sci. 2022, 647, 120304. [Google Scholar] [CrossRef]
- de Guzman, J. Relación entre la fluidez y el calor de fusión. An. Soc. Española Fis. Química 1913, 11, 353. [Google Scholar]
- Krieg, H.M.; Modise, S.J.; Keizer, K.; Neomagus, H.W.J.P. Salt rejection in nanofiltration for single and binary salt mixtures in view of sulphate removal. Desalination 2005, 171, 205–215. [Google Scholar] [CrossRef]
- Adham, S.; Cheng, R.C.; Vuong, D.X.; Wattier, K.L. Long Beach’s Dual-Stage NF Beats Single-Stage SWRO. Inter. Desalin Water Reuse Quart. 2003, 13, 18–21. Available online: http://www.safedrinkingwater.com/community/2004/LBDesalTech.pdf (accessed on 6 December 2023).
- Hernández, S.; Porter, C.; Zhang, X.; Wei, Y.; Bhattacharyya, D. Layer-by-layer assembled membranes with immobilized porins. RSC Adv. 2017, 7, 56123–56136. [Google Scholar] [CrossRef]


Disclaimer/Publisher’s Note: The statements, opinions and data contained in all publications are solely those of the individual author(s) and contributor(s) and not of MDPI and/or the editor(s). MDPI and/or the editor(s) disclaim responsibility for any injury to people or property resulting from any ideas, methods, instructions or products referred to in the content. |
© 2024 by the authors. Licensee MDPI, Basel, Switzerland. This article is an open access article distributed under the terms and conditions of the Creative Commons Attribution (CC BY) license (https://creativecommons.org/licenses/by/4.0/).