

New Approach for Sulfidation Process in Packed Bed with Hi-Fuel A310 Sorbent—Thermodynamical Studies

 ,
,
Abstract
1. Introduction
2. Materials and Methods
2.1. Materials
2.2. Experimental Setup
2.3. Analytical Methods
2.3.1. Thermogravimetric Analysis
2.3.2. Specific Surface Area Determination
2.3.3. Environmental Scanning Electron Microscopy (ESEM)
2.3.4. Fourier Transform Infrared Spectroscopy—Attenuated Total Reflectance (FTIR—ATR)
2.3.5. Raman Spectroscopic Study
2.3.6. Elemental Analysis (C, H, N, S)
3. Results and Discussion
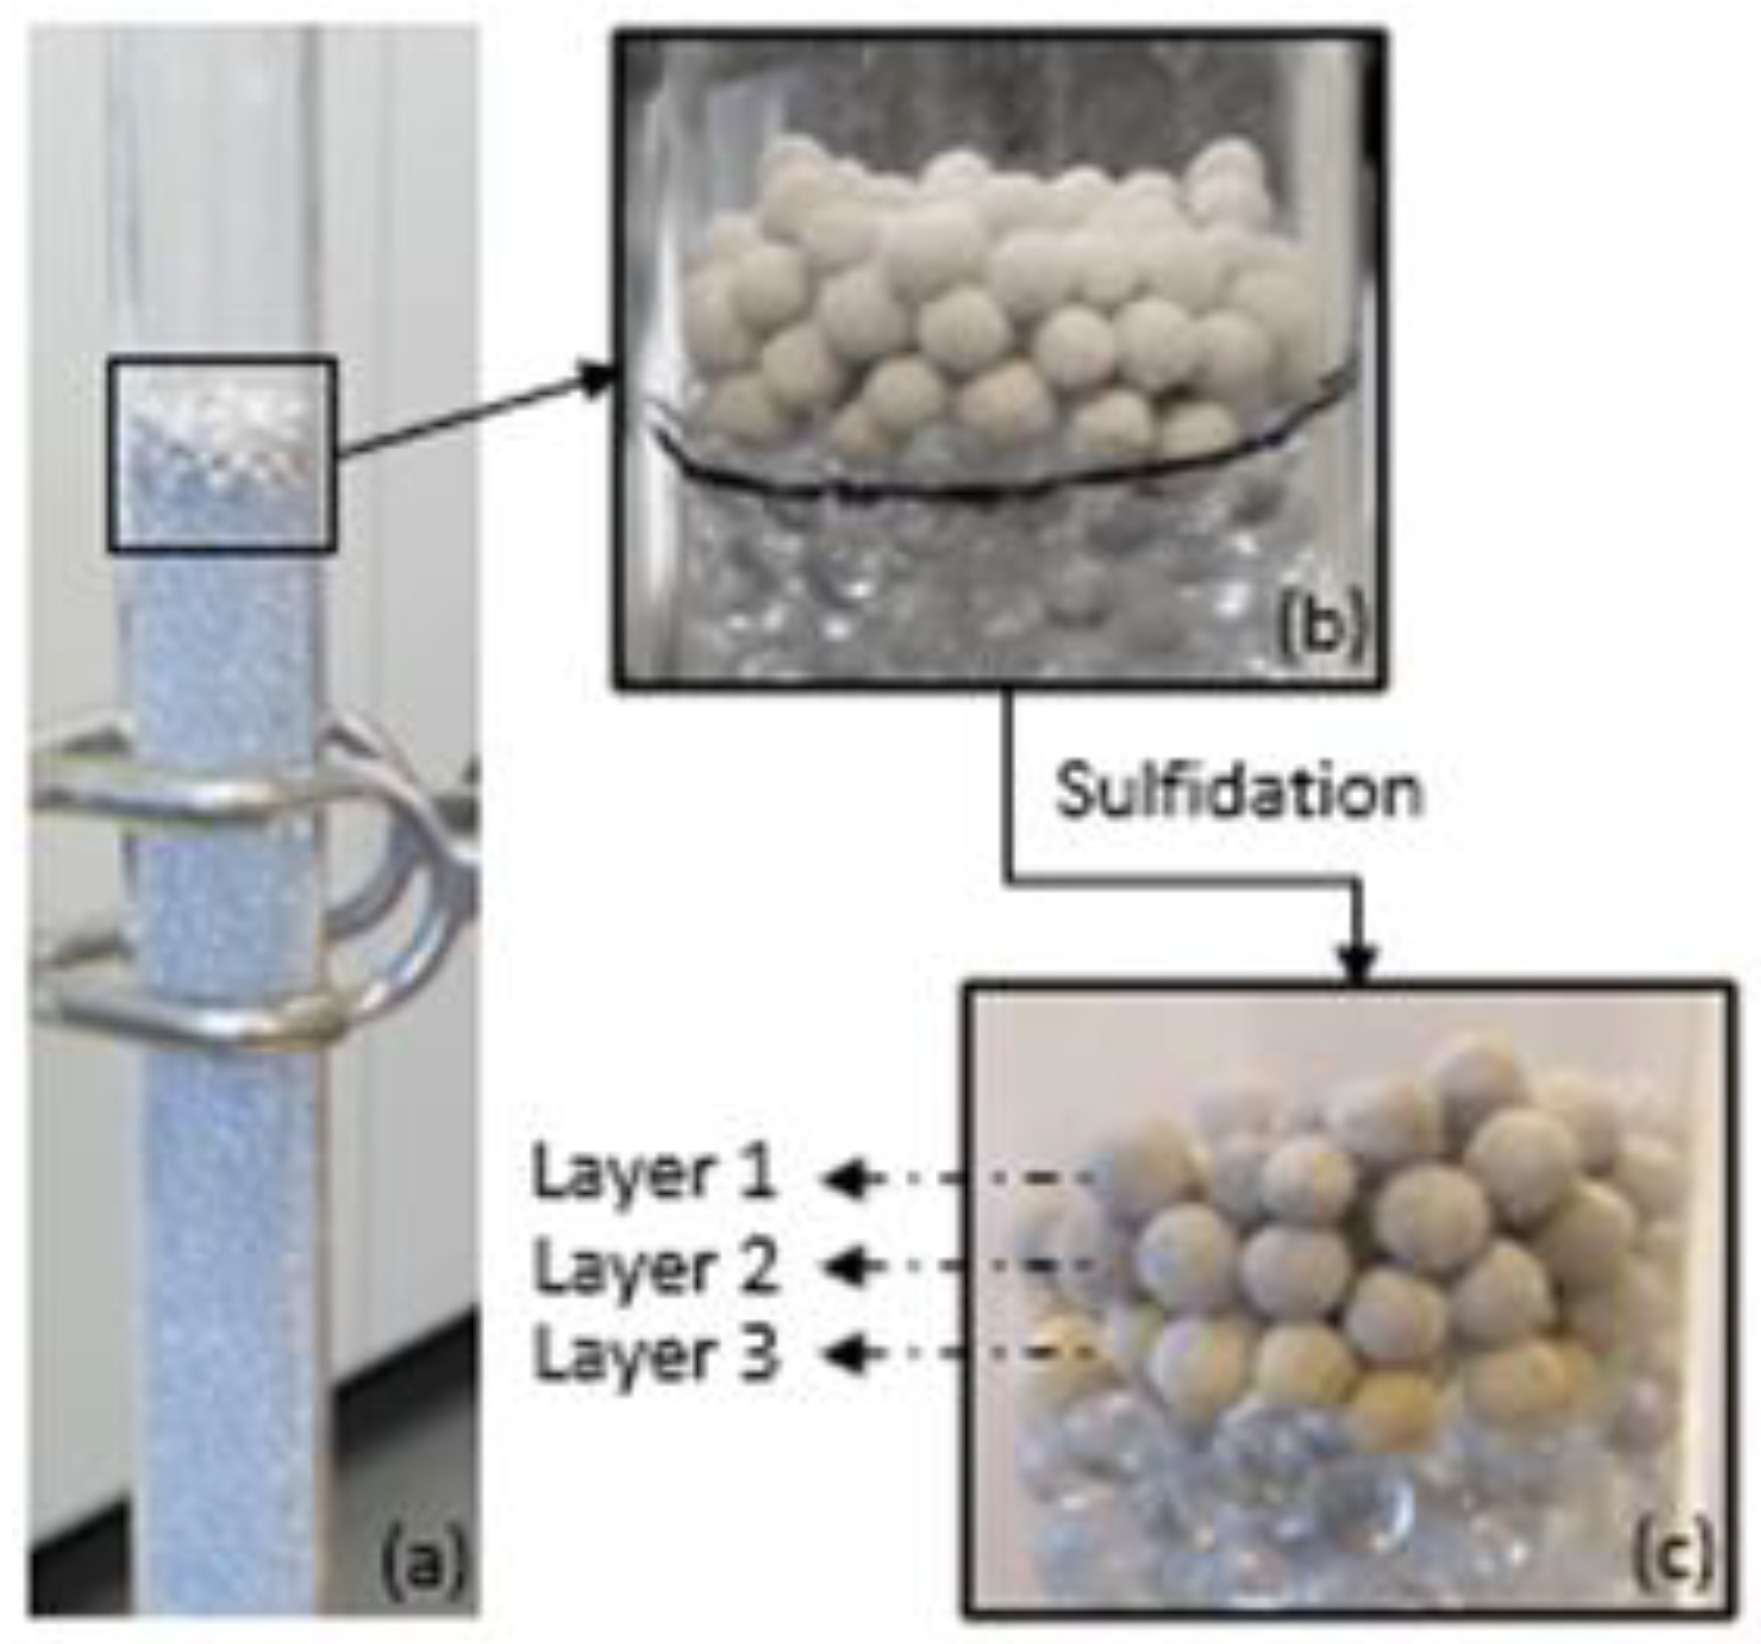
3.1. Breakthrough Curve
3.2. Characterization of Sorbent before and after Sulfidation
3.3. Thermodynamics Calculations
4. Conclusions
Author Contributions
Funding
Data Availability Statement
Acknowledgments
Conflicts of Interest
References
- Frilund, C.; Kurkela, E.; Hiltunen, I. Development of a simplified gas ultracleaning process: Experiments in biomass residue-based fixed-bed gasification syngas. Biomass Conv. Bioref. 2021, 13, 15673–15684. [Google Scholar] [CrossRef]
- Li, X.; O’Moore, L.; Song, Y.; Bond, P.L.; Yuan, Z.; Wilkie, S.; Hanzic, L.; Jiang, G. The rapid chemically induced corrosion of concrete sewers at high H2S concentration. Water Res. 2019, 162, 95–104. [Google Scholar] [CrossRef]
- Legras, B.; Ordomsky, V.V.; Dujardin, C.; Virginie, M.; Khodakov, A.Y. Impact and Detailed Action of Sulfur in Syngas on Methane Synthesis on Ni/γ-Al2O3 Catalyst. ACS Catal. 2014, 4, 2785–2791. [Google Scholar] [CrossRef]
- ISO 14687:2019; Hydrogen Fuel Quality—Product Specification. International Organization for Standarization: Geneva, Switzerland, 2019.
- National Physical Laboratory (NPL). Available online: https://www.npl.co.uk/products-services/environmental/hydrogen-purity-for-fuel-cell-vehicles (accessed on 29 June 2021).
- Huiling, F.; Yanxu, L.; Chunhu, L.; Hanxian, G.; Kechang, X. The apparent kinetics of H2S removal by zinc oxide in the presence of hydrogen. Fuel 2002, 81, 91–96. [Google Scholar] [CrossRef]
- Skrzypski, J.; Bezverkhyy, I.; Heintz, O.; Bellat, J.P. Low Temperature H2S Removal with Metal-Doped Nanostructure ZnO Sorbents: Study of the Origin of Enhanced Reactivity in Cu-Containing Materials. Ind. Eng. Chem. Res. 2011, 50, 5714–5722. [Google Scholar] [CrossRef]
- Neveux, L.; Chiche, D.; Bazer-Bachi, D.; Favergeon, L.; Pijolat, M. New insight on the ZnO sulfidation reaction: Evidences for an outward growth process of the ZnS phase. Chem. Eng. J. 2012, 181–182, 508–515. [Google Scholar] [CrossRef]
- Yang, H.; Cahela, D.R.; Tatarchuk, B.J. A study of kinetic effects due to using microfibrous entrapped zinc oxide sorbents for hydrogen sulfide removal. Chem. Eng. Sci. 2008, 63, 2707–2716. [Google Scholar] [CrossRef]
- Babé, C.; Tayakout-Fayolle, M.; Geantet, C.; Vrinat, M.; Bergeret, G.; Huard, T.; Bazer-Bachi, D. Crystallite size effect in the sulfidation of ZnO by H2S: Geometric and kinetic modelling of the transformation. Chem. Eng. Sci. 2012, 82, 73–83. [Google Scholar] [CrossRef]
- Karmakar, M.K.; Chandra, P.; Chatterjee, P.K. A review on the fuel gas cleaning technologies in gasification process. J. Environ. Chem. Eng. 2015, 3, 689–702. [Google Scholar] [CrossRef]
- Frilund, C.; Simell, P.; Kaisalo, N.; Kurkela, E.; Koskinen-Soivi, M.-L. Desulfurization of Biomass Syngas Using ZnO-Based Adsorbents: Long-Term Hydrogen Sulfide Breakthrough Experiments. Energy Fuels 2020, 34, 3316–3325. [Google Scholar] [CrossRef]
- Westmoreland, P.R.; Gibson, J.B.; Harrison, D.P. Comparative kinetics of high-temperature reaction between hydrogen sulfide and selected metal oxides. Environ. Sci. Technol. 1977, 11, 488–491. [Google Scholar] [CrossRef]
- Xue, M.; Chitrakar, R.; Sakane, K.; Ooi, K. Screening of adsorbents for removal of H2S at room temperature. Green Chem. 2003, 5, 529–534. [Google Scholar] [CrossRef]
- Sohn, H.Y.; Szekely, J.A. Structural model for gas-solid reactions with a moving boundary—III. Chem. Eng. Sci. 1972, 27, 763–778. [Google Scholar] [CrossRef]
- Sadegh-Vaziri, R.; Babler, M.U. Numerical investigation of the outward growth of ZnS in the removal of H2S in a packed bed of ZnO. Chem. Eng. Sci. 2017, 158, 328–339. [Google Scholar] [CrossRef]
- Bezverkhyy, I.; Skrzypski, J.; Safonova, O.; Bellat, J.P. Sulfidation Mechanism of Pure and Cu-Doped ZnO Nanoparticles at Moderate Temperature: TEM and In Situ XRD Studies. J. Phys. Chem. C 2012, 116, 14423–14430. [Google Scholar] [CrossRef]
- Liu, Y.; Zhao, J.; Zhang, H.; Zhu, Y.; Wang, Z. Thermal decomposition of basic zinc carbonate in nitrogen atmosphere. Thermochim. Acta 2004, 414, 121–123. [Google Scholar] [CrossRef]
- Hales, M.C.; Frost, R.L. Thermal analysis of smithsonite and hydrozincite. J. Therm. Anal. Calorim. 2008, 91, 855–860. [Google Scholar] [CrossRef]
- Kowalik, P.; Konkol, M.; Antoniak-Jurak, K.; Próchniak, W.; Wiercioch, P.; Rawski, M.; Borowiecki, T. Structure and morphology transformation of ZnO by carbonation and thermal treatment. Mater. Res. Bull. 2015, 65, 149–156. [Google Scholar] [CrossRef]
- Balichard, K.; Nyikeine, C.; Bezverkhyy, I. Nanocrystalline ZnCO3—A novel sorbent for low-temperature removal of H2S. J. Hazard. Mater. 2014, 264, 79–83. [Google Scholar] [CrossRef]
- Brunauer, S.; Emmett, P.H.; Teller, E. Adsorption of Gases in Multimolecular Layers. J. Am. Chem. Soc. 1938, 60, 309–319. [Google Scholar] [CrossRef]
- Holbrook, R.D.; Galyean, A.A.; Gorham, J.M.; Herzing, A.; Pettibone, J. Overview of Nanomaterial Characterization and Metrology. Front. Nanosci. 2015, 8, 47–87. [Google Scholar] [CrossRef]
- Palchoudhury, S.; Baalousha, M.; Lead, J.R. Methods for Measuring Concentration (Mass, Surface Area and Number) of Nanomaterials. Front. Nanosci. 2015, 8, 153–181. [Google Scholar] [CrossRef]
- Florén, C.R. Development of Desulphurisation Unit for Fuel Cell System. Master’s Thesis, Chalmers University of Technology, Göteborg, Sweden, 2015; p. 88. [Google Scholar]
- Kanari, N.; Mishra, D.; Gaballah, I.; Dupré, B. Thermal decomposition of zinc carbonate hydroxide. Thermochim. Acta 2004, 410, 93–100. [Google Scholar] [CrossRef]
- Castellano, M.; Matijevic, E. Uniform colloidal zinc compounds of various morphologies. Chem. Mater. 1989, 1, 78–82. [Google Scholar] [CrossRef]
- Sharma, D.; Jha, R. Analysis of structural, optical and magnetic properties of Fe/Co co-doped ZnO nanocrystals. Ceram. Int. 2017, 43, 8488–8496. [Google Scholar] [CrossRef]
- Winiarski, J.; Tylus, W.; Winiarska, K.; Szczygieł, I.; Szczygieł, B. XPS and FT-IR Characterization of Selected Synthetic Corrosion Products of Zinc Expected in Neutral Environment Containing Chloride Ions. J. Spectrosc. 2018, 2018, 1–14. [Google Scholar] [CrossRef]
- Vágvölgyi, V.; Hales, M.; Martens, W.; Kristóf, J.; Horváth, E.; Frost, R.L. Dynamic and controlled rate thermal analysis of hydrozincite and smithsonite. J. Therm. Anal. Calorim. 2008, 92, 911–916. [Google Scholar] [CrossRef][Green Version]
- Koga, N.; Goshi, Y.; Yamada, S.; Pérez-Maqueda, L.A. Kinetic approach to partially overlapped thermal decomposition processes: Co-precipitated zinc carbonates. J. Therm. Anal. Calorim. 2013, 111, 1463–1474. [Google Scholar] [CrossRef]
- Milekhin, A.G.; Yeryukov, N.A.; Sveshnikova, L.L.; Duda, T.A.; Himcinschi, C.; Zenkevich, E.I.; Zahn, D.R.T. Resonant Raman scattering of ZnS, ZnO, and ZnS/ZnO core/shell quantum dots. Appl. Phys. A 2012, 107, 275–278. [Google Scholar] [CrossRef]
- Fairbrother, A.; Izquierdo-Roca, V.; Fontané, X.; Ibáñez, M.; Cabot, A.; Saucedo, E.; Pérez-Rodríguez, A. ZnS grain size effects on near-resonant Raman scattering: Optical non-destructive grain size estimation. CrystEngComm 2014, 16, 4120–4125. [Google Scholar] [CrossRef]
- Kim, J.H.; Rho, H.; Kim, J.; Choi, Y.J.; Park, J.G. Raman spectroscopy of ZnS nanostructures: Raman spectroscopy of ZnS nanostructures. J. Raman Spectrosc. 2012, 43, 906–910. [Google Scholar] [CrossRef]
- Scott, S.D.; Barnes, H.L. Sphalerite-wurtzite equilibria and stoichiometry. Geochim. Cosmochim. Acta 1972, 36, 1275–1295. [Google Scholar] [CrossRef]
- Samokhvalov, A.; Tatarchuk, B.J. Characterization of active sites, determination of mechanisms of H2S, COS and CS2 sorption and regeneration of ZnO low-temperature sorbents: Past, current and perspectives. Phys. Chem. Chem. Phys. 2010, 13, 3197–32092011. [Google Scholar] [CrossRef] [PubMed]
- Li, L.; King, D.L. H2S removal with ZnO during fuel processing for PEM fuel cell applications. Catal. Today 2006, 116, 537–541. [Google Scholar] [CrossRef]
- Gültekin, D.; Akbulut, H. Raman Studies of ZnO Products Synthesized by Solution Based Methods. Acta Phys. Pol. A 2016, 129, 803–805. [Google Scholar] [CrossRef]
- RRUFF Project. ID: 040035. Available online: https://rruff.info/R040035 (accessed on 1 February 2021).
- Binnewies, M.; Milke, E. Thermochemical Data of Elements and Compounds, 2nd ed.; Wiley-VCH Verlag GmbH: Weinheim, Germany, 2002. [Google Scholar] [CrossRef]
- Neveux, L. Study of the kinetics and mechanism of ZnO sulfidation by H2S. Ph.D. Thesis, Ecole Nationale Supérieure des Mines de Saint Etienne, Saint Etienne, France, 2011; p. 31. [Google Scholar]


| Sorbent | Surface Area (m2/g) | Average Pore Diameter (Å) | Single Point Adsorption Total Pore Volume of Pores Less than 403.122 Å Diameter at p/p° = 0.95 (cm3/g) | Pore Volume of Mesopores by BJH, Diameter between 17 and 3000 Å (cm3/g) |
|---|---|---|---|---|
| Fresh | 52.6 | 117.2 | 0.154 | 0.215 |
| Thermally treated at 300 °C for 6 h | 51.9 | 122.7 | 0.162 | 0.268 |
| Converted sorbent from packed bed scale at 300 °C | ||||
| Layer 1 | 44.6 | 112.7 | 0.132 | 0.206 |
| Layer 2 | 50.5 | 120.1 | 0.152 | 0.200 |
| Layer 3 | 51.6 | 117.7 | 0.152 | 0.214 |
| Sorbent | Carbon [%] | Hydrogen [%] | Sulfur [%] | Oxygen [%] | Mean Conversion Rate (α) of ZnO into ZnS Calculated for Each Layer of Converted Sorbent |
|---|---|---|---|---|---|
| Fresh | 1.18 | 0.48 | 0 | 19.16 | - |
| Thermally treated at 300 °C for 6 h | 0.85 | 0.21 | 0 | 12.58 | - |
| Converted sorbent from packed bed scale at 300 °C | |||||
| Layer 1 | 0.65 | 0.18 | 10.13 | 12.54 | 0.27 |
| Layer 2 | 0.76 | 0.18 | 3.99 | 13.58 | 0.11 |
| Layer 3 | 0.75 | 0.18 | 3.06 | 10.43 | 0.08 |
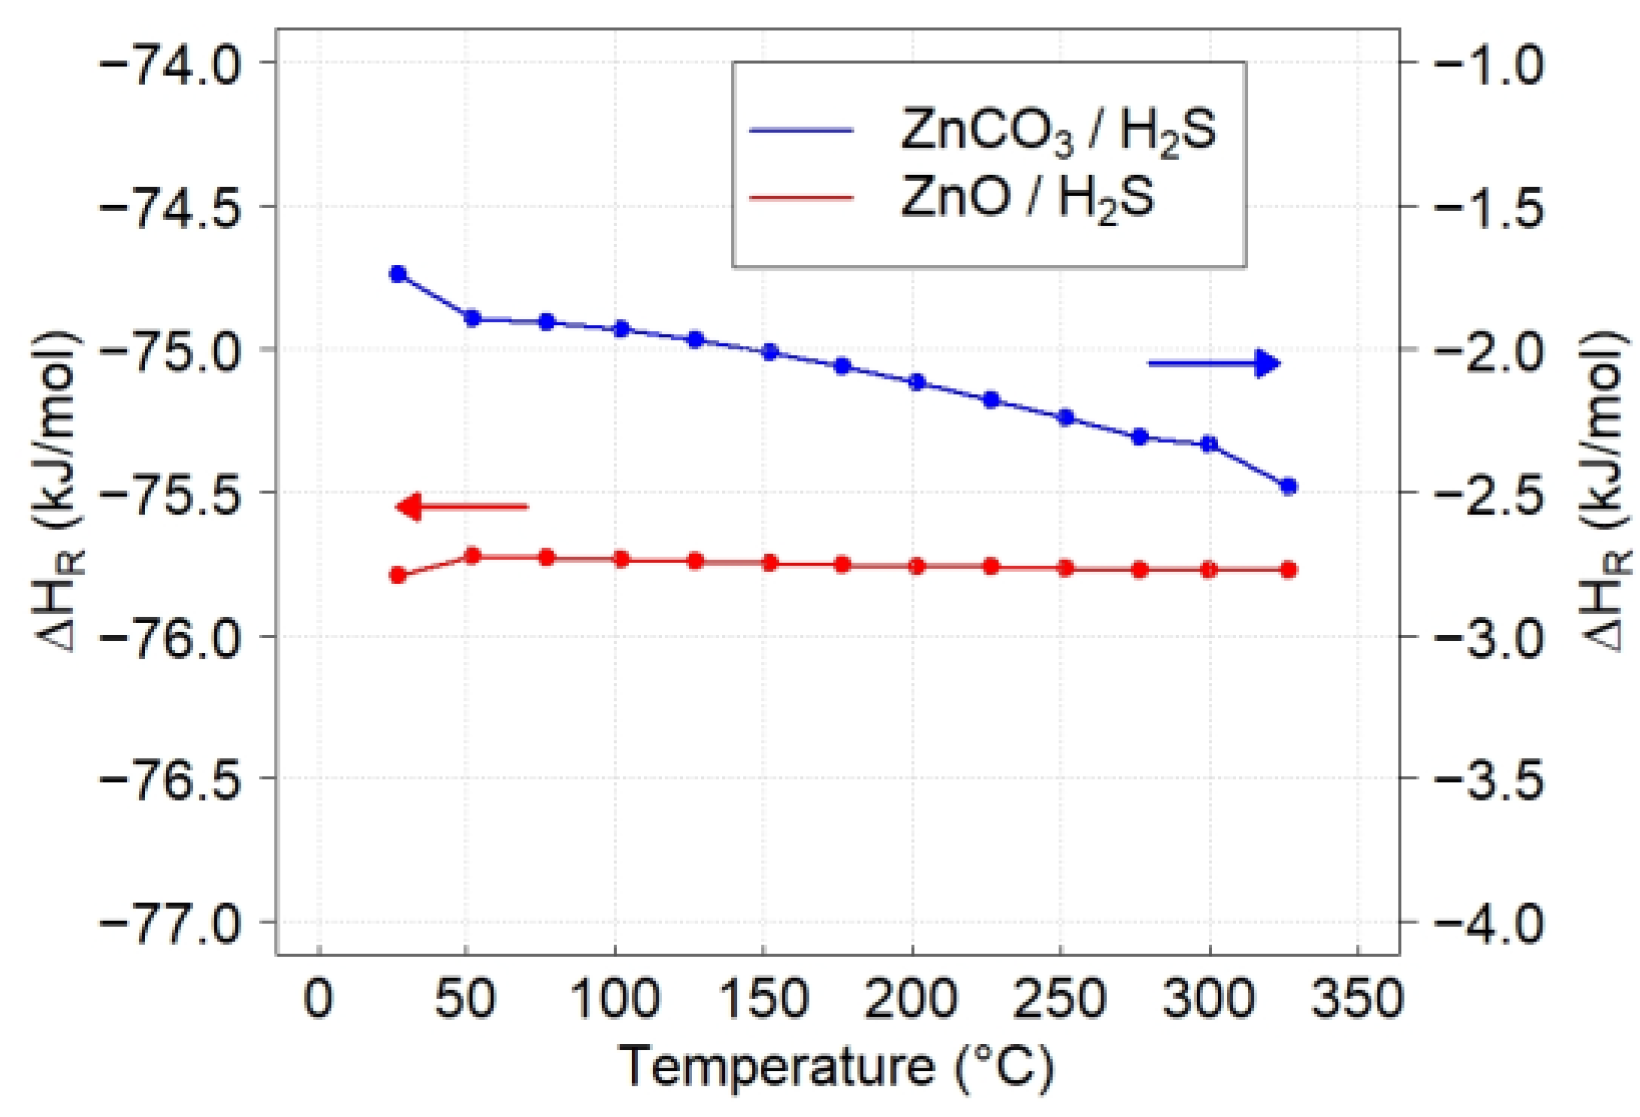
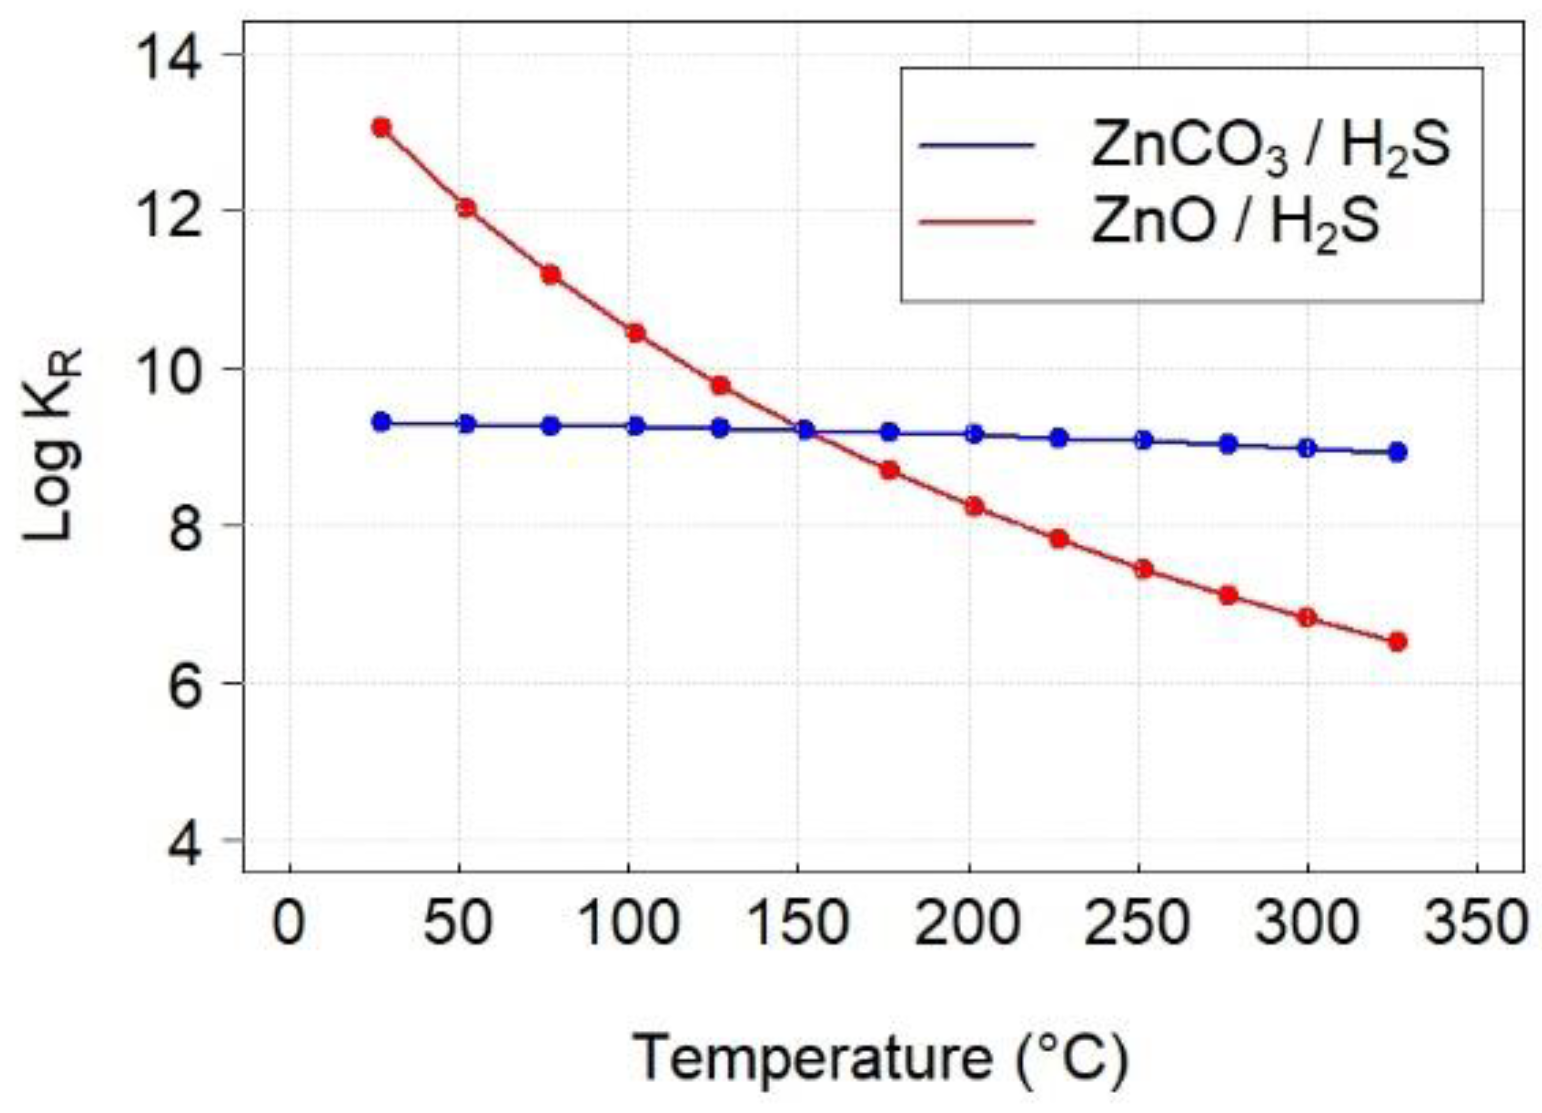
| Reaction | ∆HR (kJ/mol) | ∆SR (J/mol·K) | ∆GR (kJ/mol) | KR |
|---|---|---|---|---|
| ZnO + H2S → ZnS + H2O | −75.77 | −1.6 | −74.87 | 6.6 × 10⁶ |
| ZnCO3 + H2S → ZnS + CO2 + H2O | −2.33 | 167.9 | −98.54 | 9.5 × 10⁸ |
Disclaimer/Publisher’s Note: The statements, opinions and data contained in all publications are solely those of the individual author(s) and contributor(s) and not of MDPI and/or the editor(s). MDPI and/or the editor(s) disclaim responsibility for any injury to people or property resulting from any ideas, methods, instructions or products referred to in the content. |
© 2024 by the authors. Licensee MDPI, Basel, Switzerland. This article is an open access article distributed under the terms and conditions of the Creative Commons Attribution (CC BY) license (https://creativecommons.org/licenses/by/4.0/).
Share and Cite
Lorreyte, C.; Malinowska, B.; Butin, V.; Ruscassier, N.; Casalinho, J.; Perré, P. New Approach for Sulfidation Process in Packed Bed with Hi-Fuel A310 Sorbent—Thermodynamical Studies. ChemEngineering 2024, 8, 38. https://doi.org/10.3390/chemengineering8020038
Lorreyte C, Malinowska B, Butin V, Ruscassier N, Casalinho J, Perré P. New Approach for Sulfidation Process in Packed Bed with Hi-Fuel A310 Sorbent—Thermodynamical Studies. ChemEngineering. 2024; 8(2):38. https://doi.org/10.3390/chemengineering8020038
Chicago/Turabian StyleLorreyte, Clarisse, Barbara Malinowska, Vincent Butin, Nathalie Ruscassier, Joel Casalinho, and Patrick Perré. 2024. "New Approach for Sulfidation Process in Packed Bed with Hi-Fuel A310 Sorbent—Thermodynamical Studies" ChemEngineering 8, no. 2: 38. https://doi.org/10.3390/chemengineering8020038
APA StyleLorreyte, C., Malinowska, B., Butin, V., Ruscassier, N., Casalinho, J., & Perré, P. (2024). New Approach for Sulfidation Process in Packed Bed with Hi-Fuel A310 Sorbent—Thermodynamical Studies. ChemEngineering, 8(2), 38. https://doi.org/10.3390/chemengineering8020038