
Investigation of Duplex Brass Membranes with Metallography, Permeability and Treatments: Work-Hardening, Annealing and Quenching

 ,
, 
 and
and 
Abstract
:1. Introduction
2. Experimental Section
2.1. Sample Preparation
2.2. Alloy Treatment
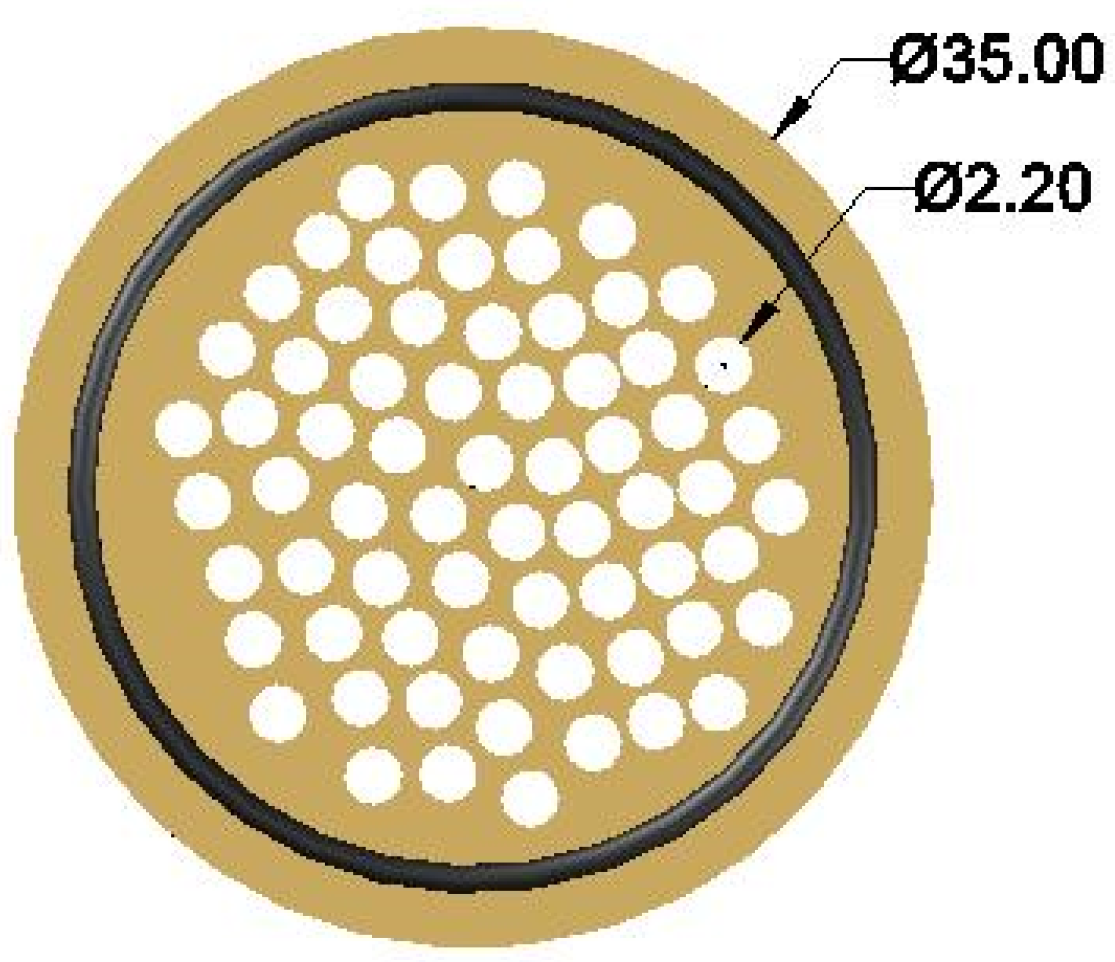
2.3. Membrane Fabrication
3. Results
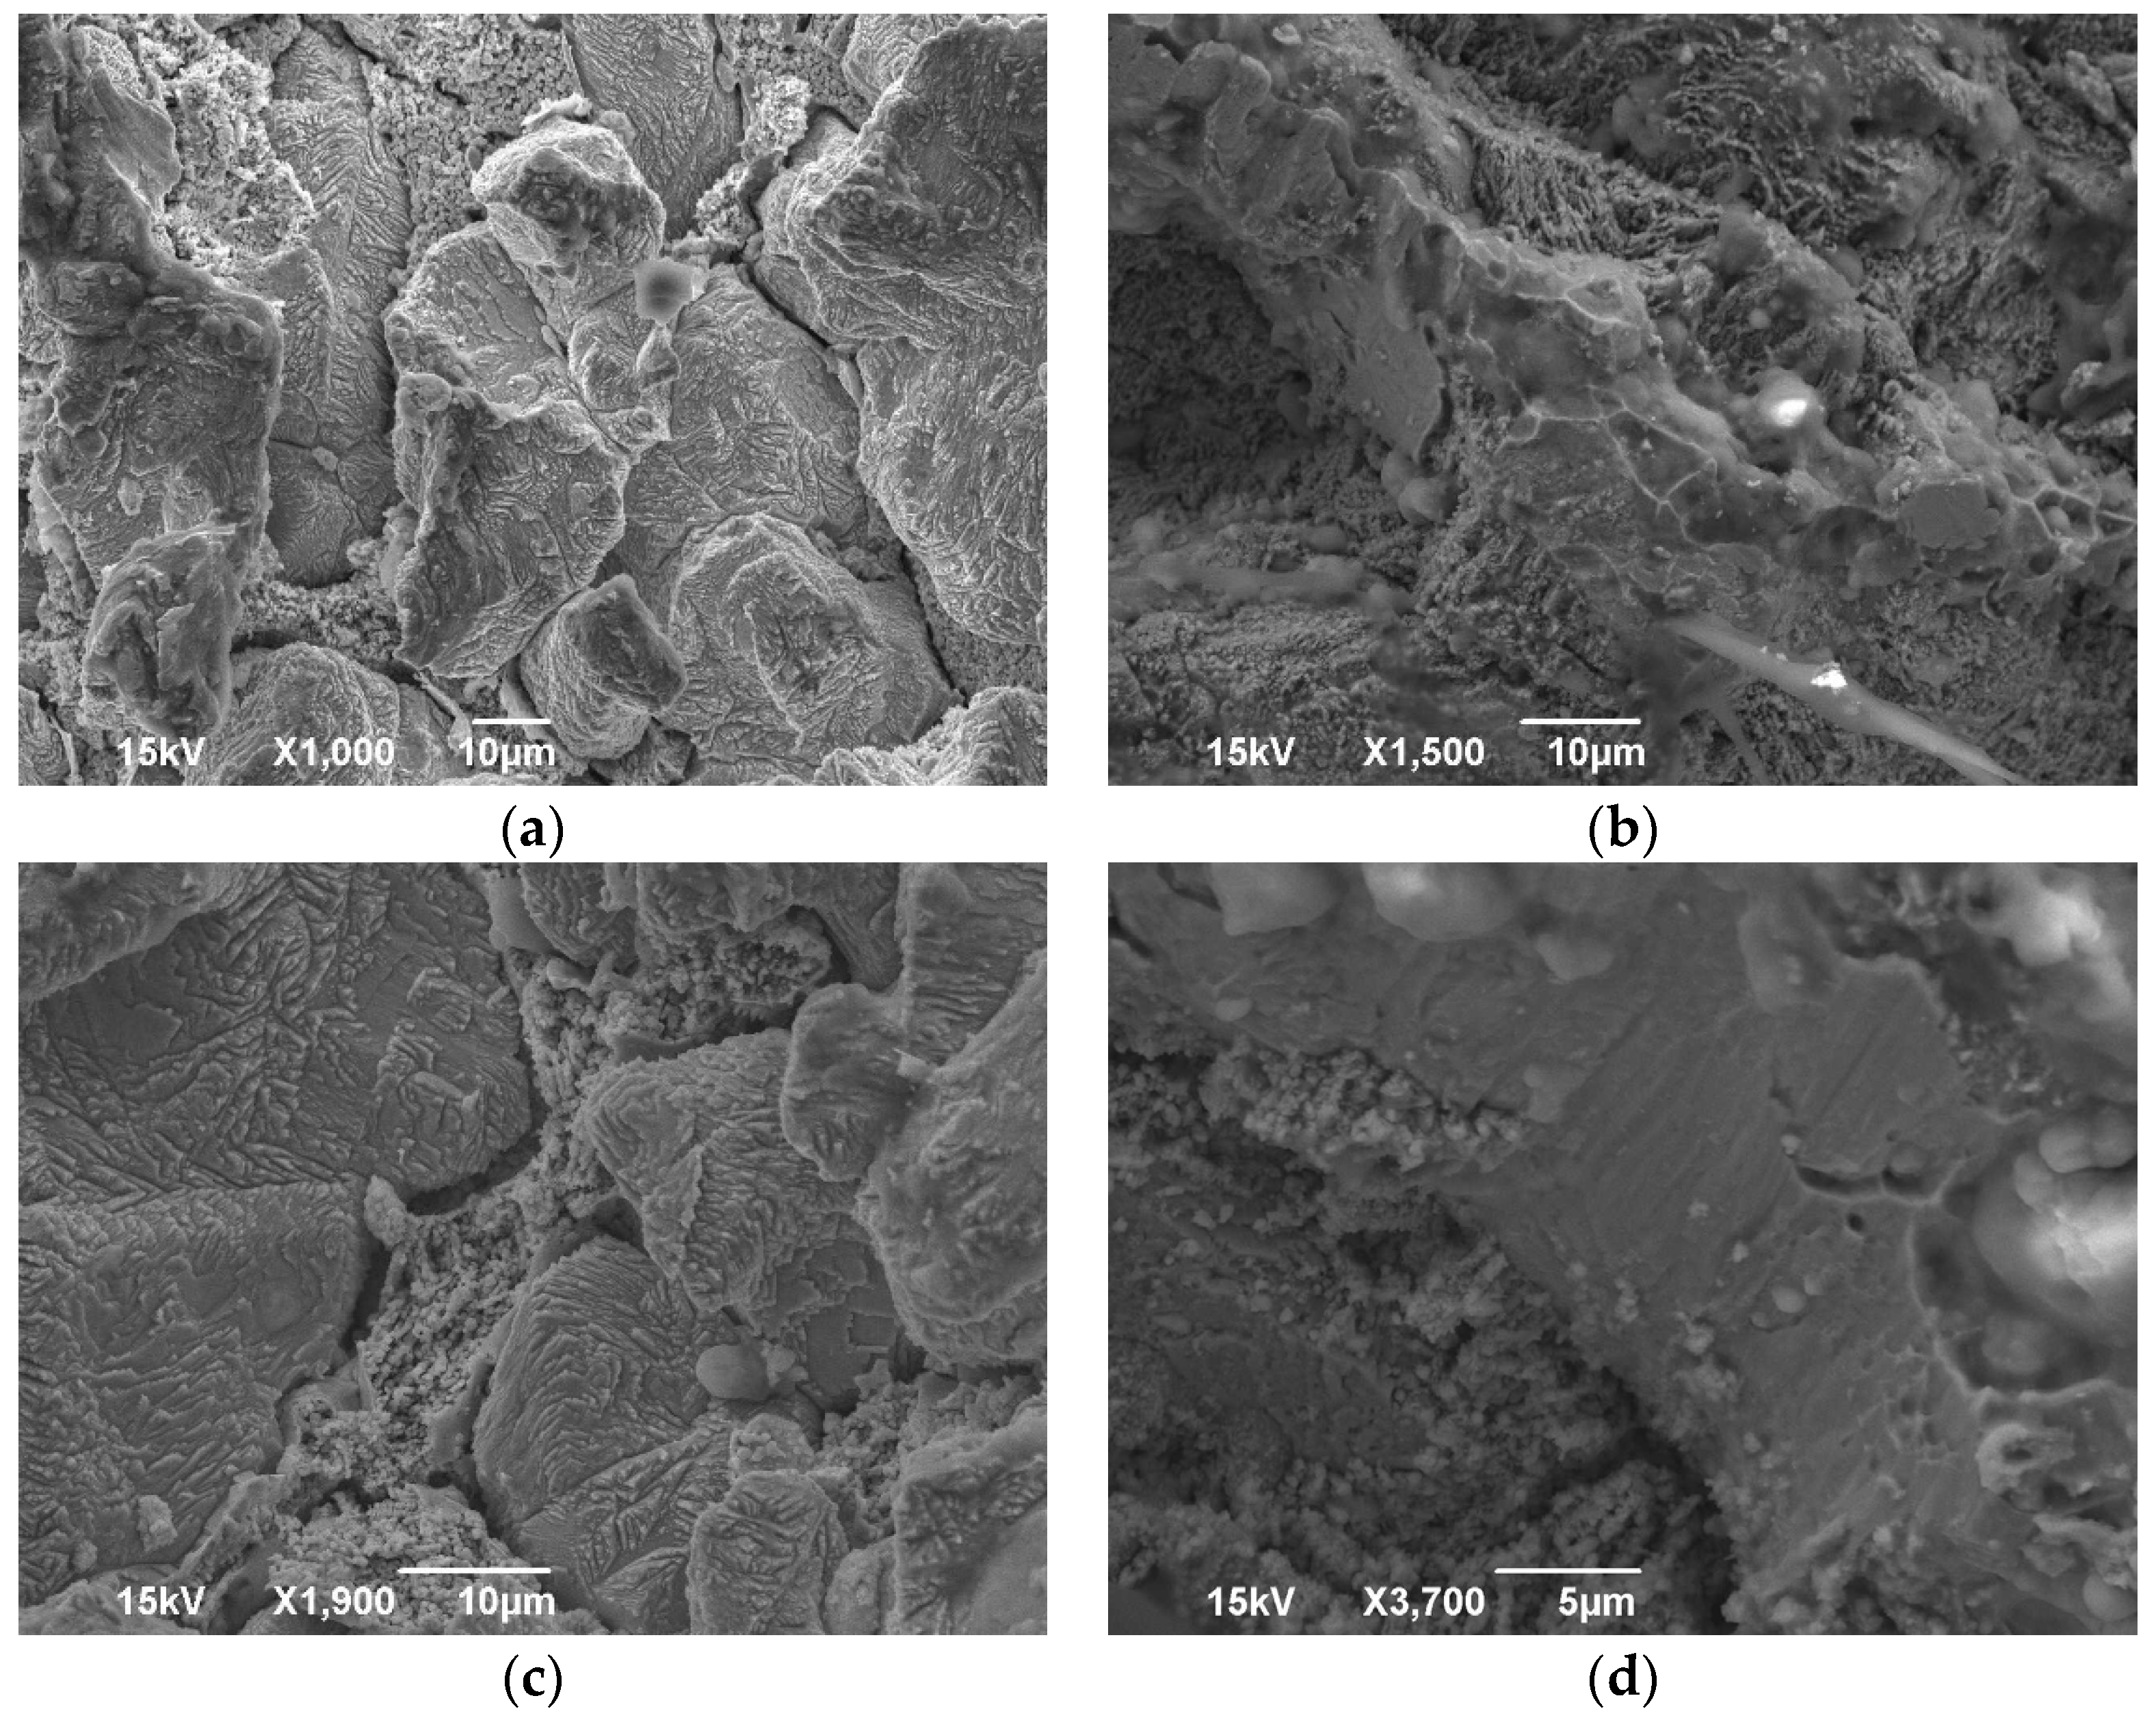
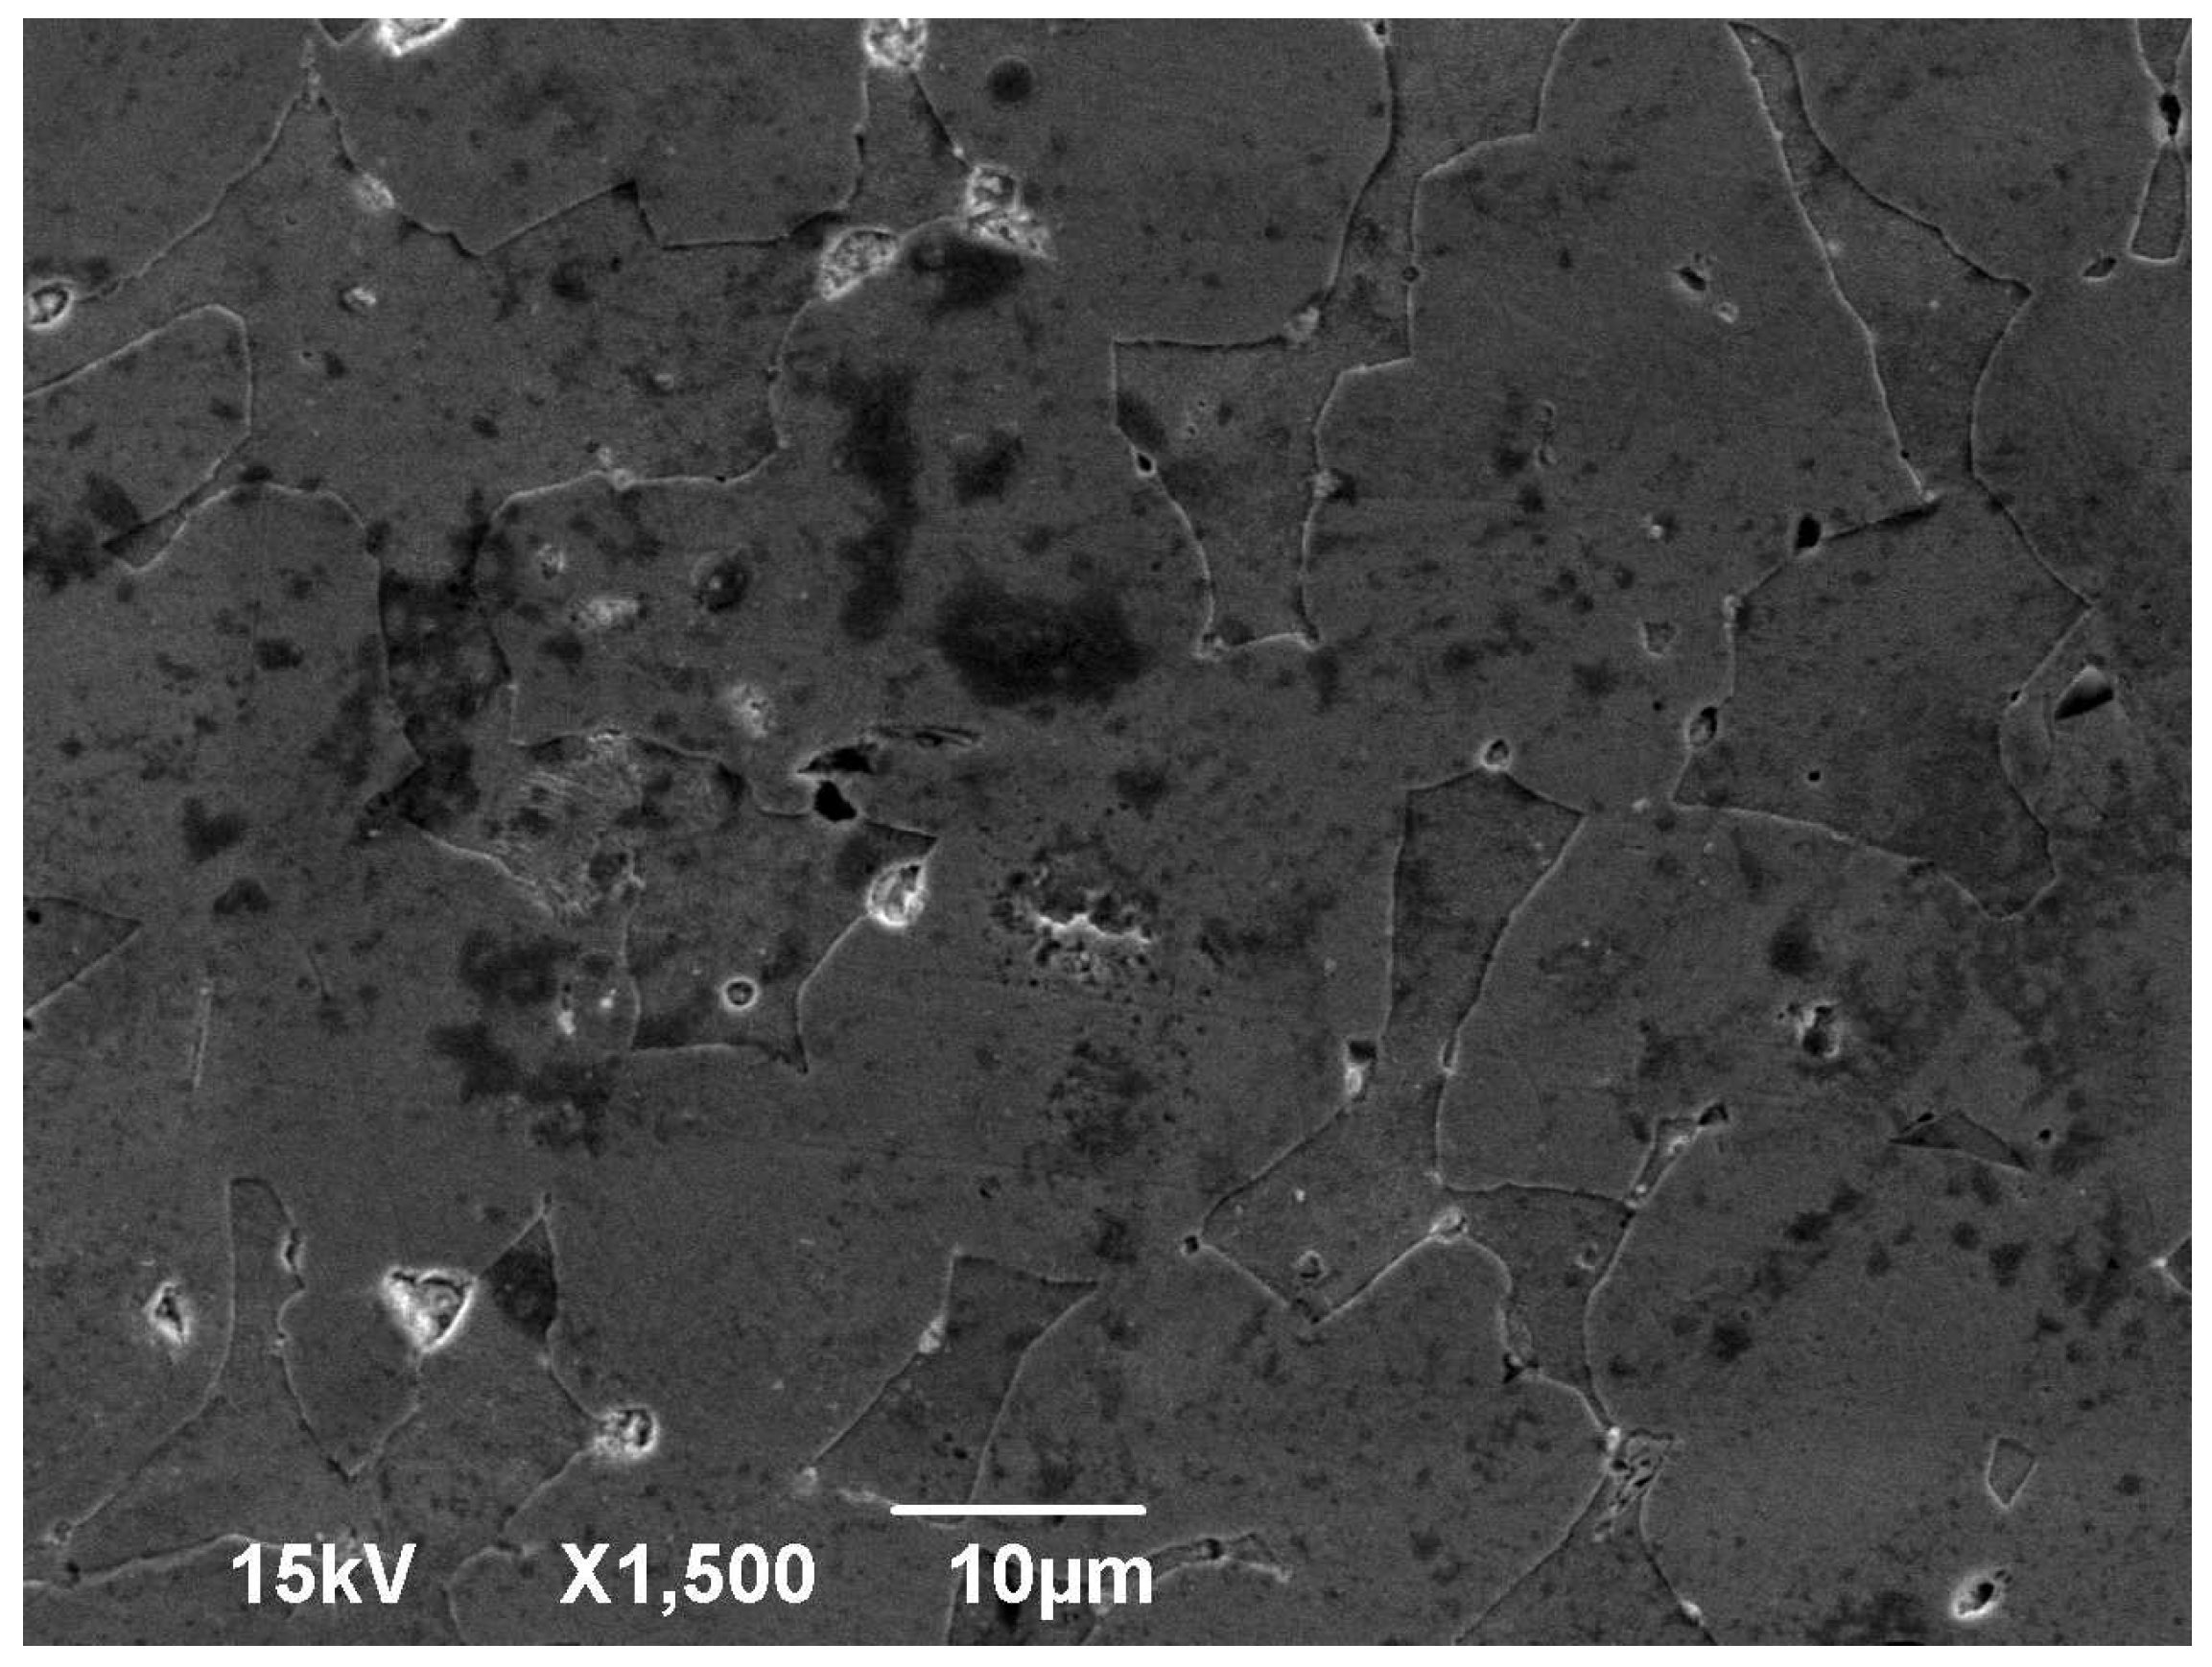
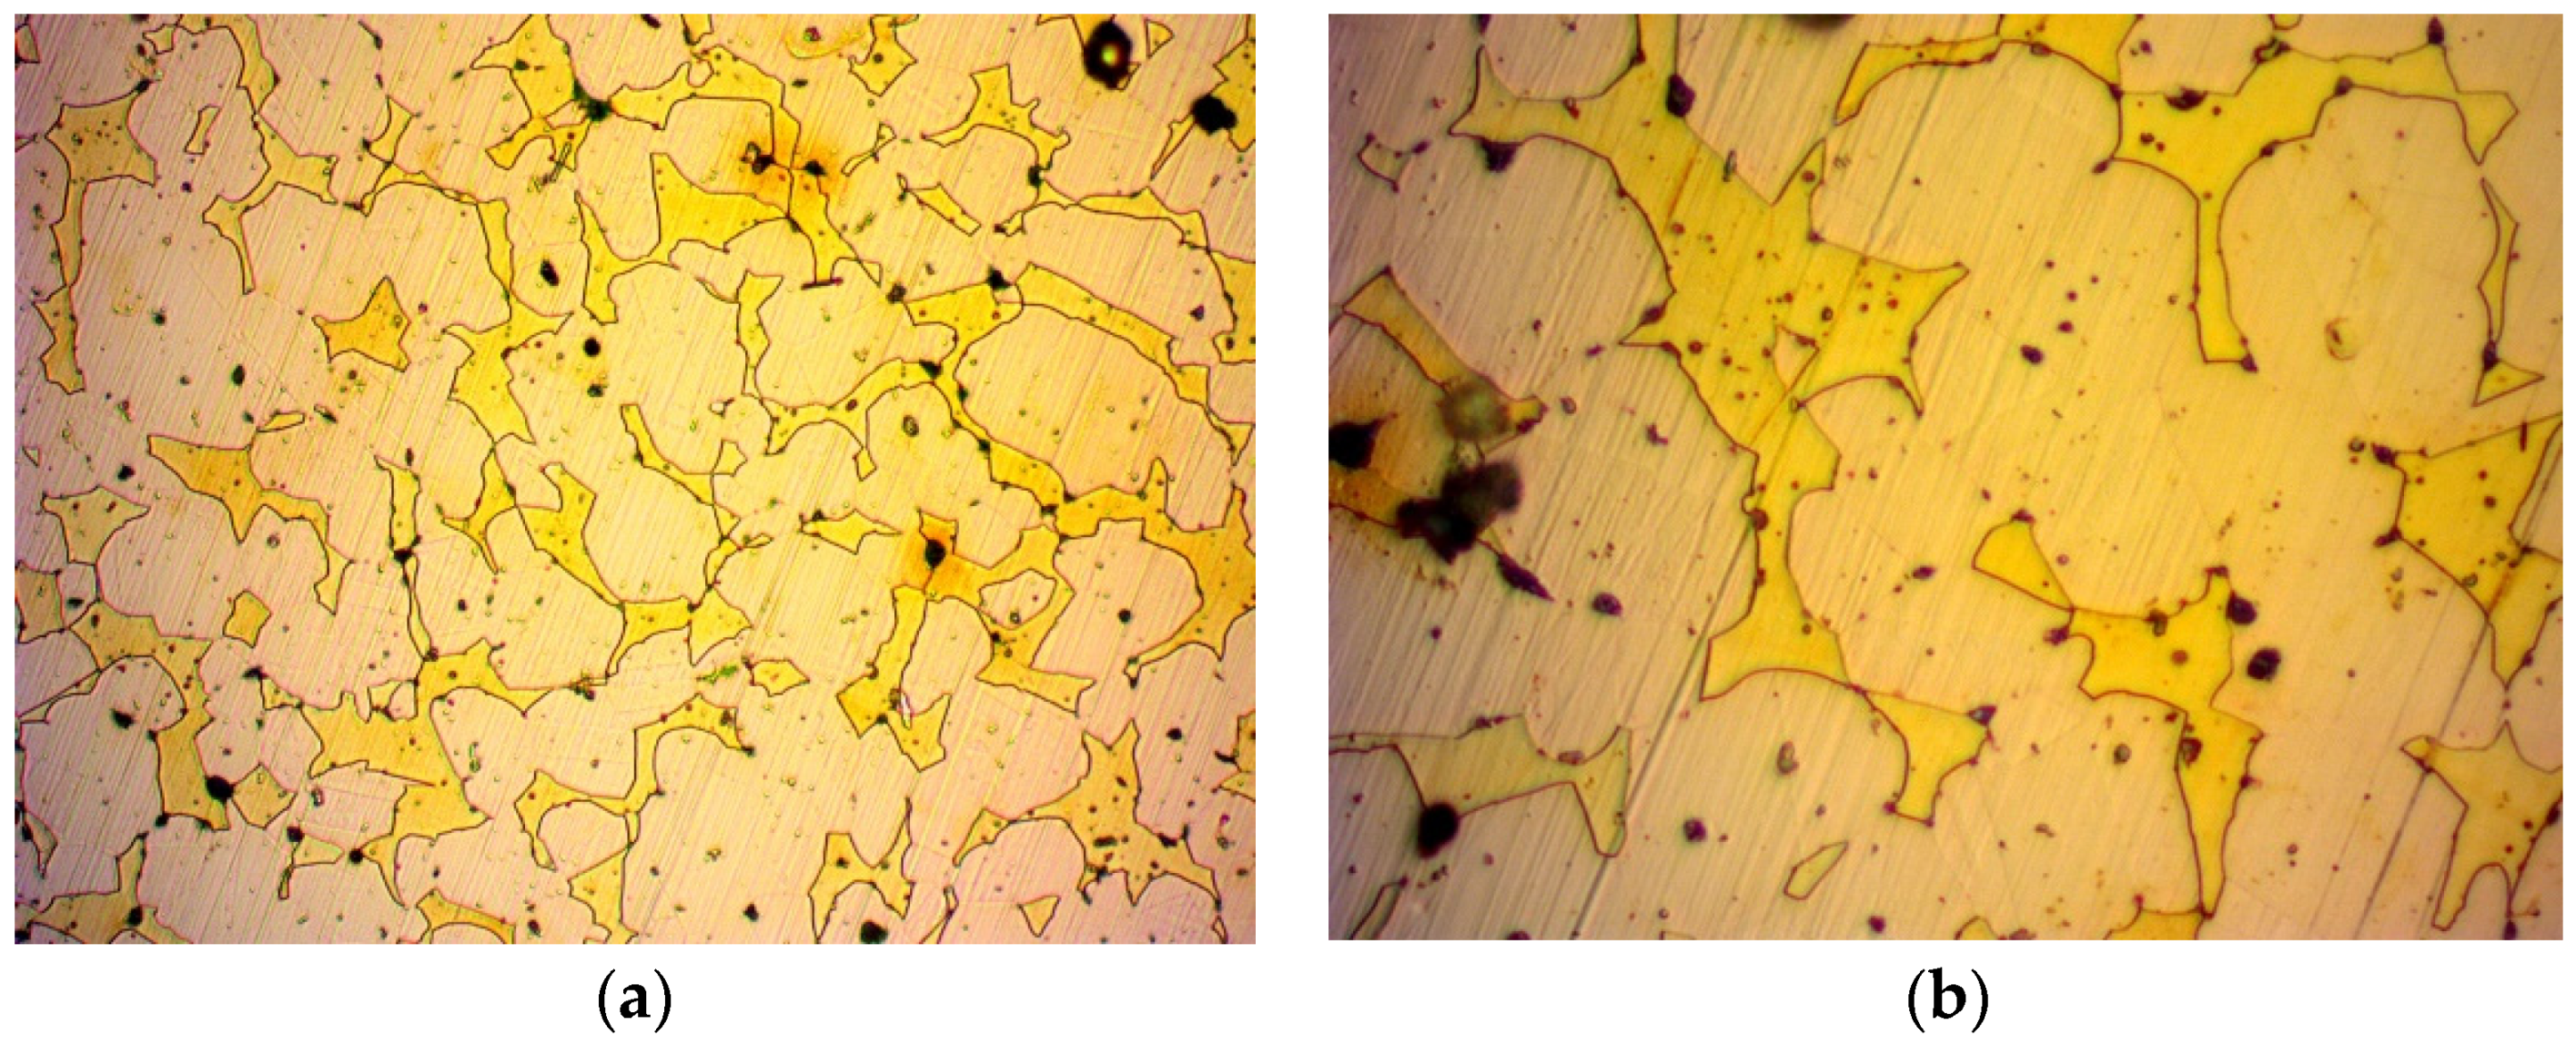
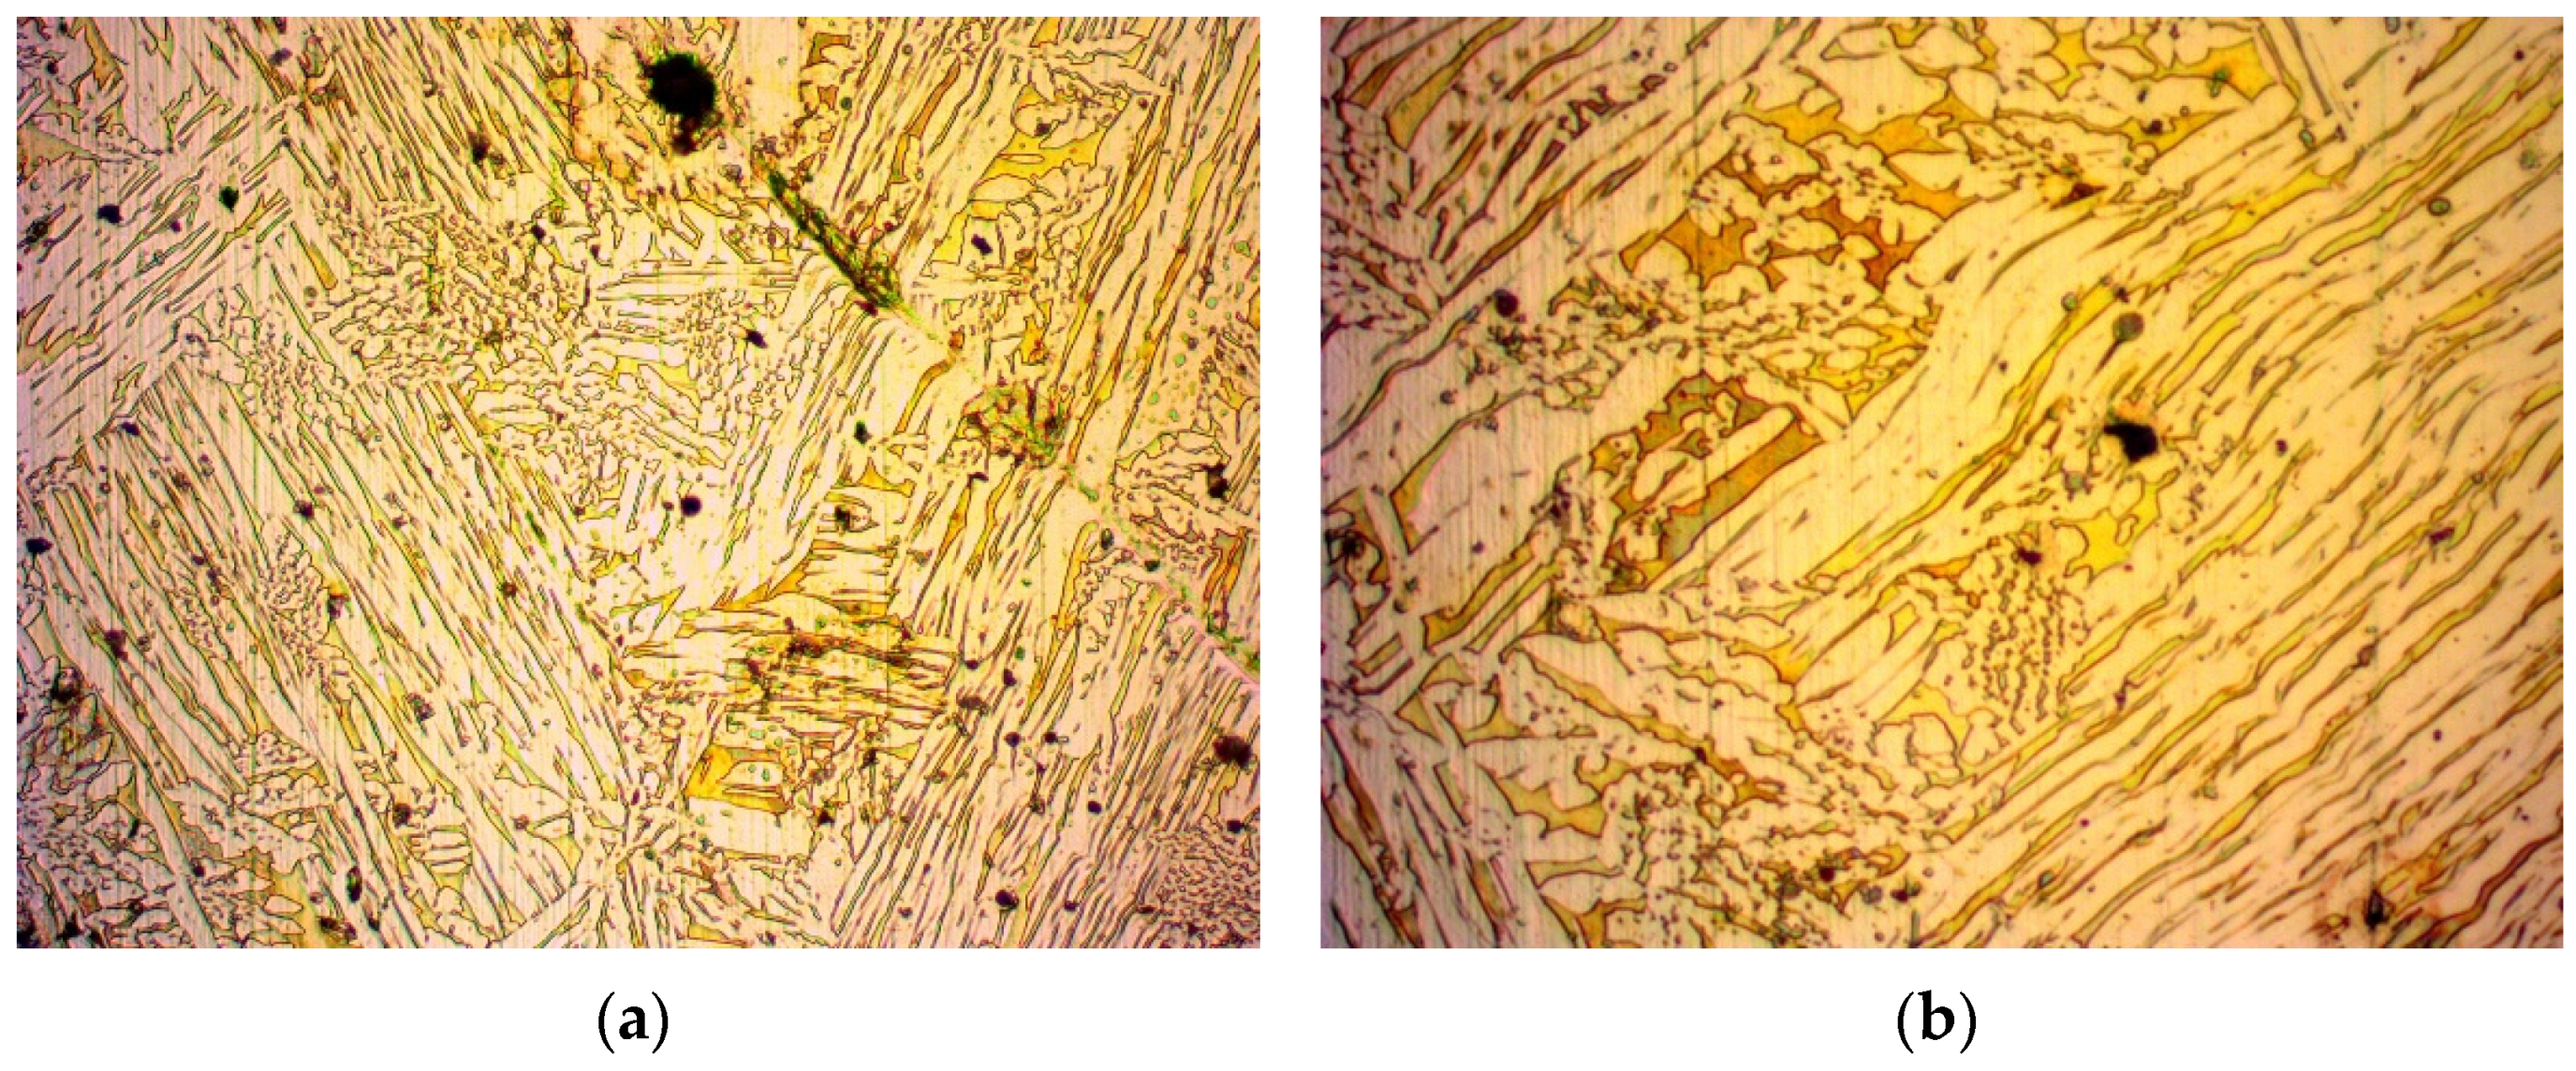
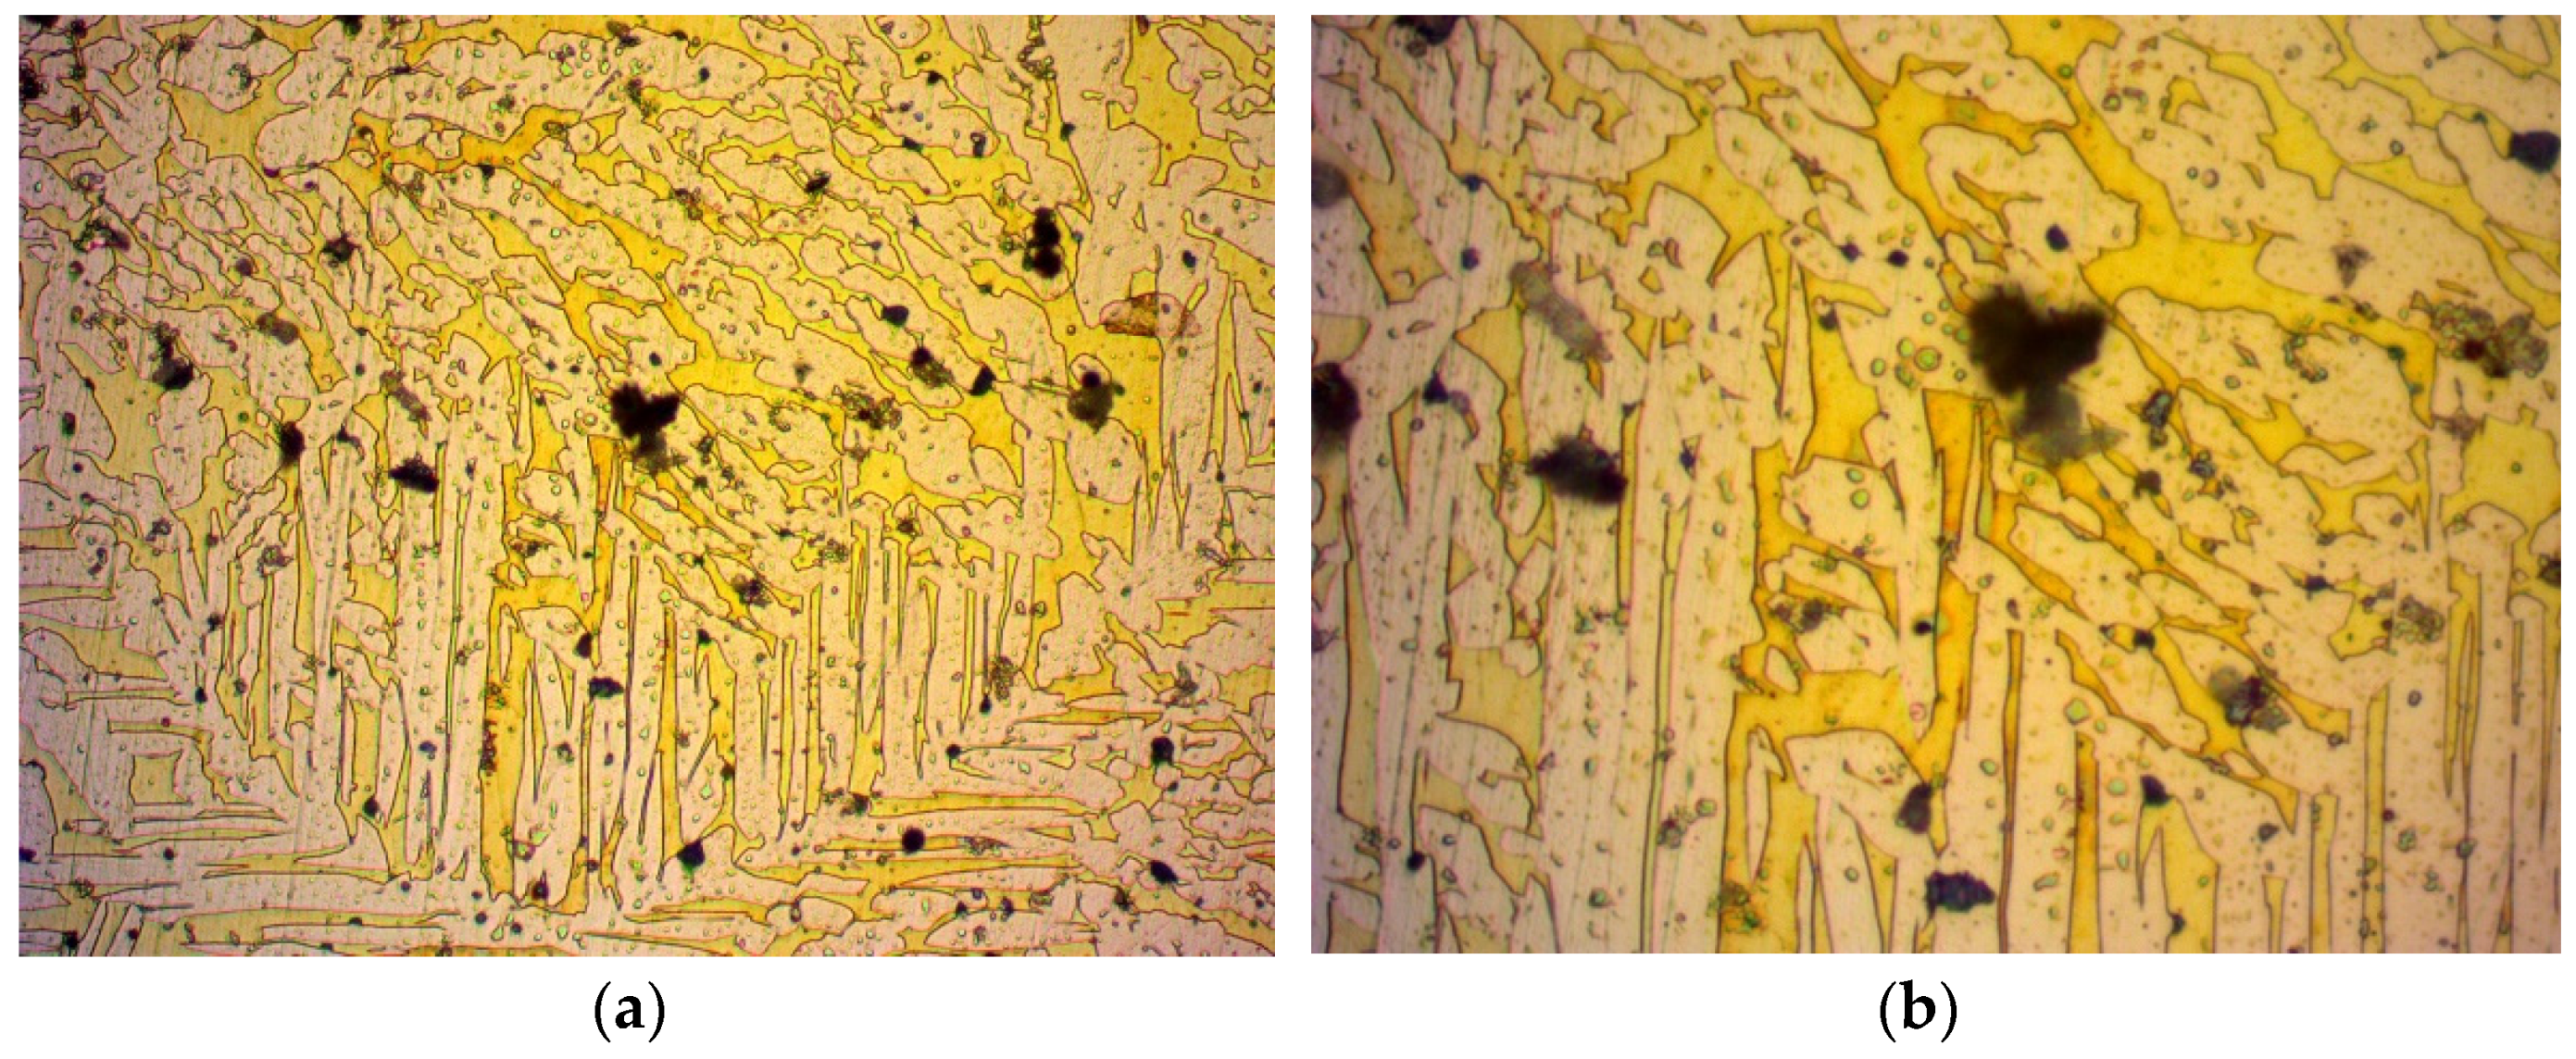
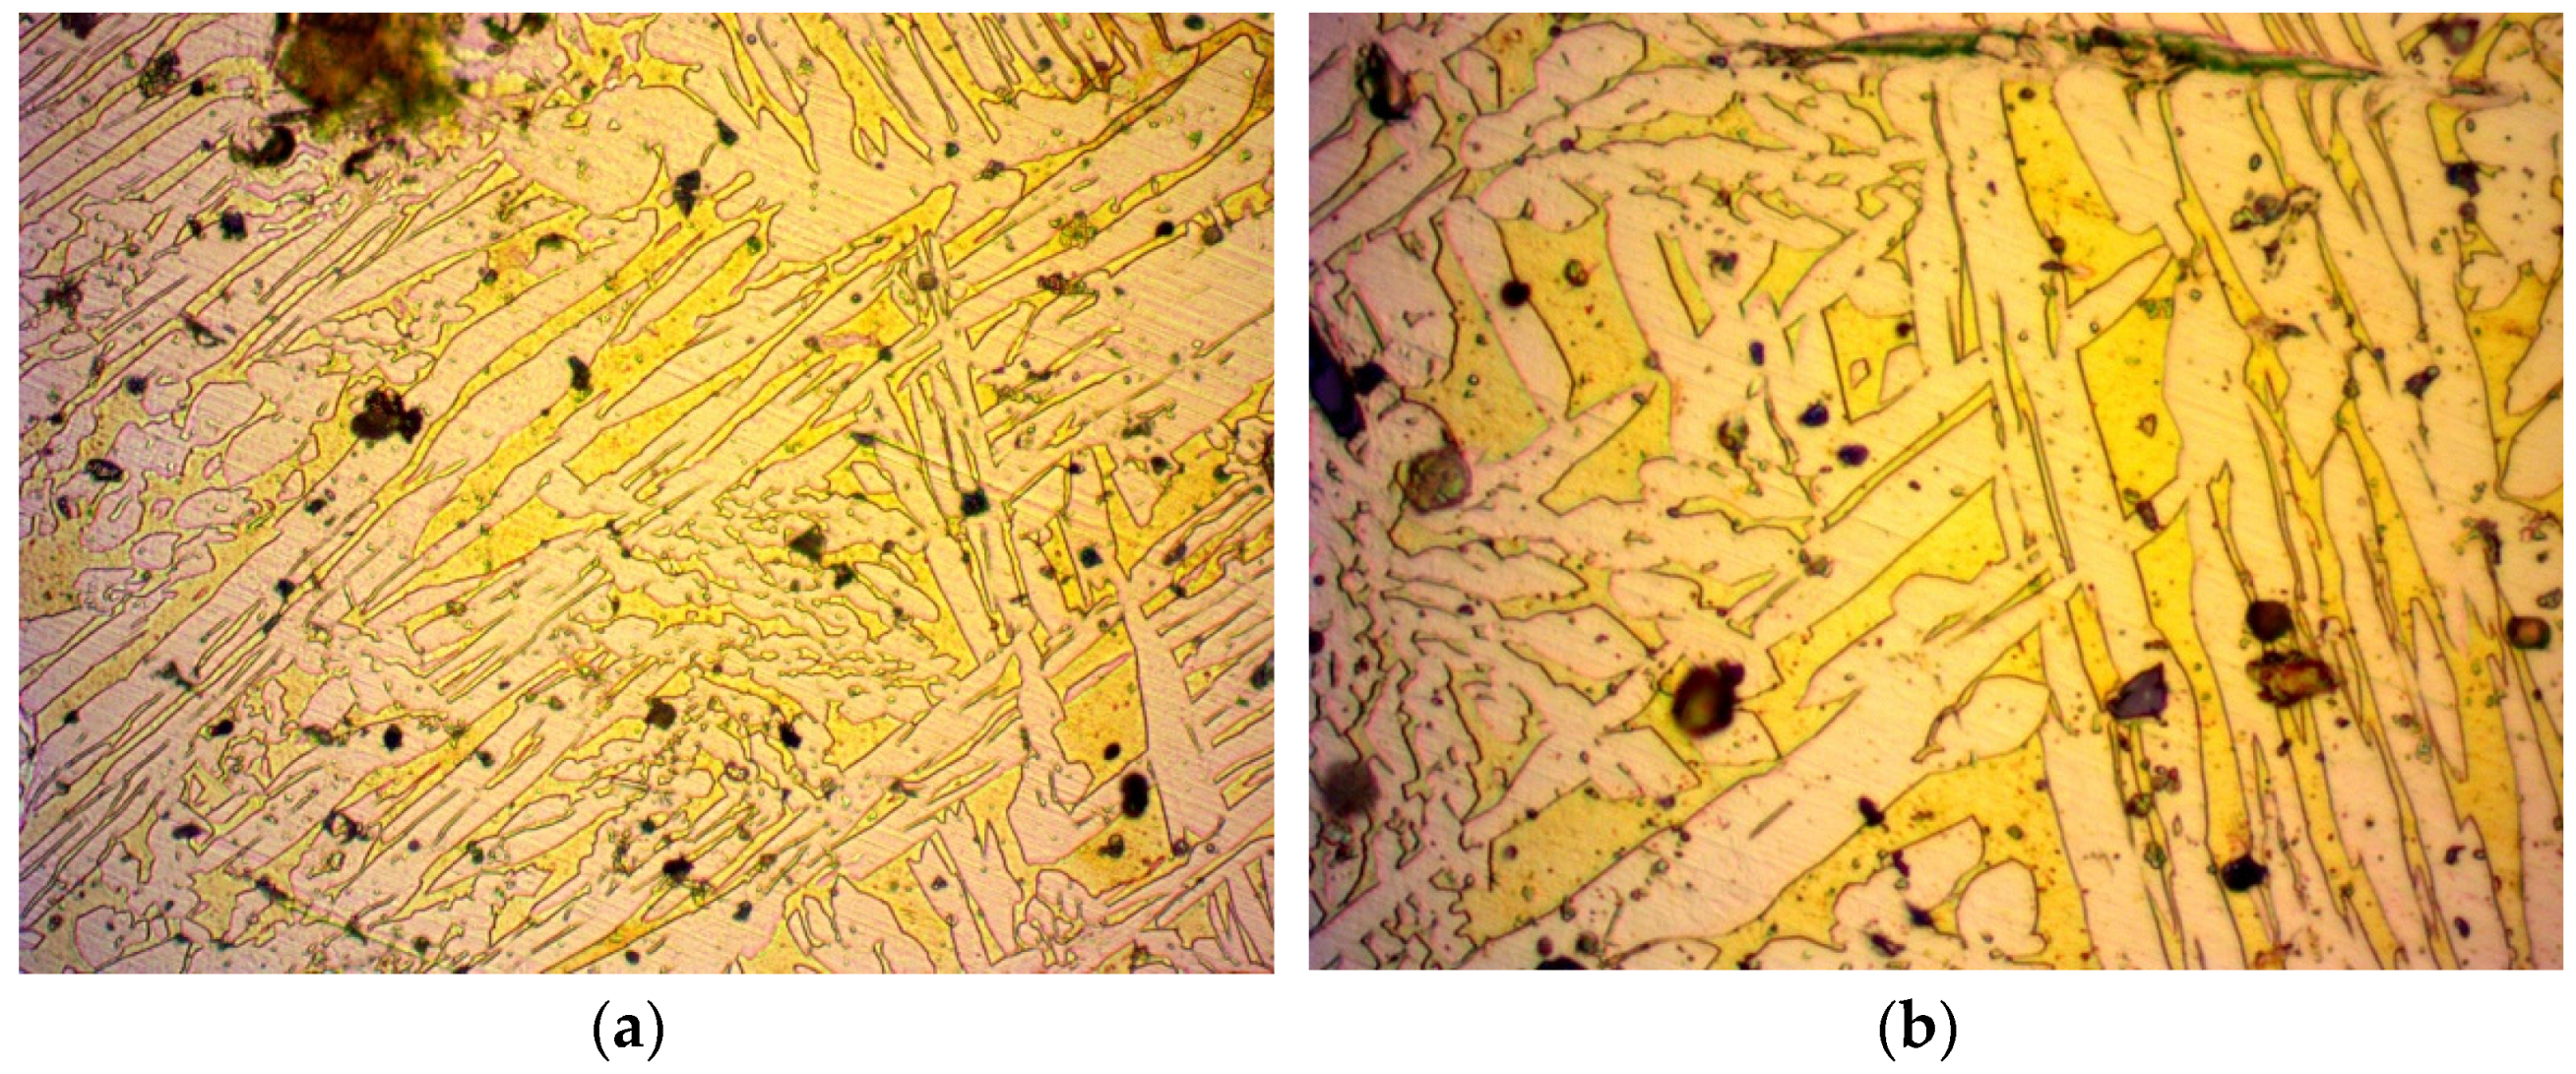
3.1. Microscopy
- During the annealing process, the internal stress of the material that was a result of its manufacturing method was reduced. This was due to the molecules repositioning in the crystal structure, inhibiting the presence of crystal structure faults. Such a crystal structure has a homogenous set of pathways for fluid to pass through, in contrast with a work-hardened one, which has locally compressed pathways. Due to this recovery of the crystal structure, easier flow of a fluid is possible and thus, an increase in permeability is expected.
- The grains grew in size. While larger grains do not necessarily contribute to a larger porosity of a material, since the packing factor can be kept constant, the pore size should be increased in a crystal structure. However, a crystal structure contains less dislocations as opposed to an amorphous material [37,38]. These dislocations can create wider pores in the material, thus creating more favourable flow conditions and increased permeability. On the contrary, a material with a crystal structure has thinner pores and is expected to present a decrease in permeability. However, one should take into consideration that amorphous materials do not have a certain pattern and are subject to blind or closed pores, which can decrease permeability in amorphous materials.
- Regarding the crystal structure faults that can reduce the pore size, the annealing process inhibits such faults from forming, greatly supporting even further permeability increases.
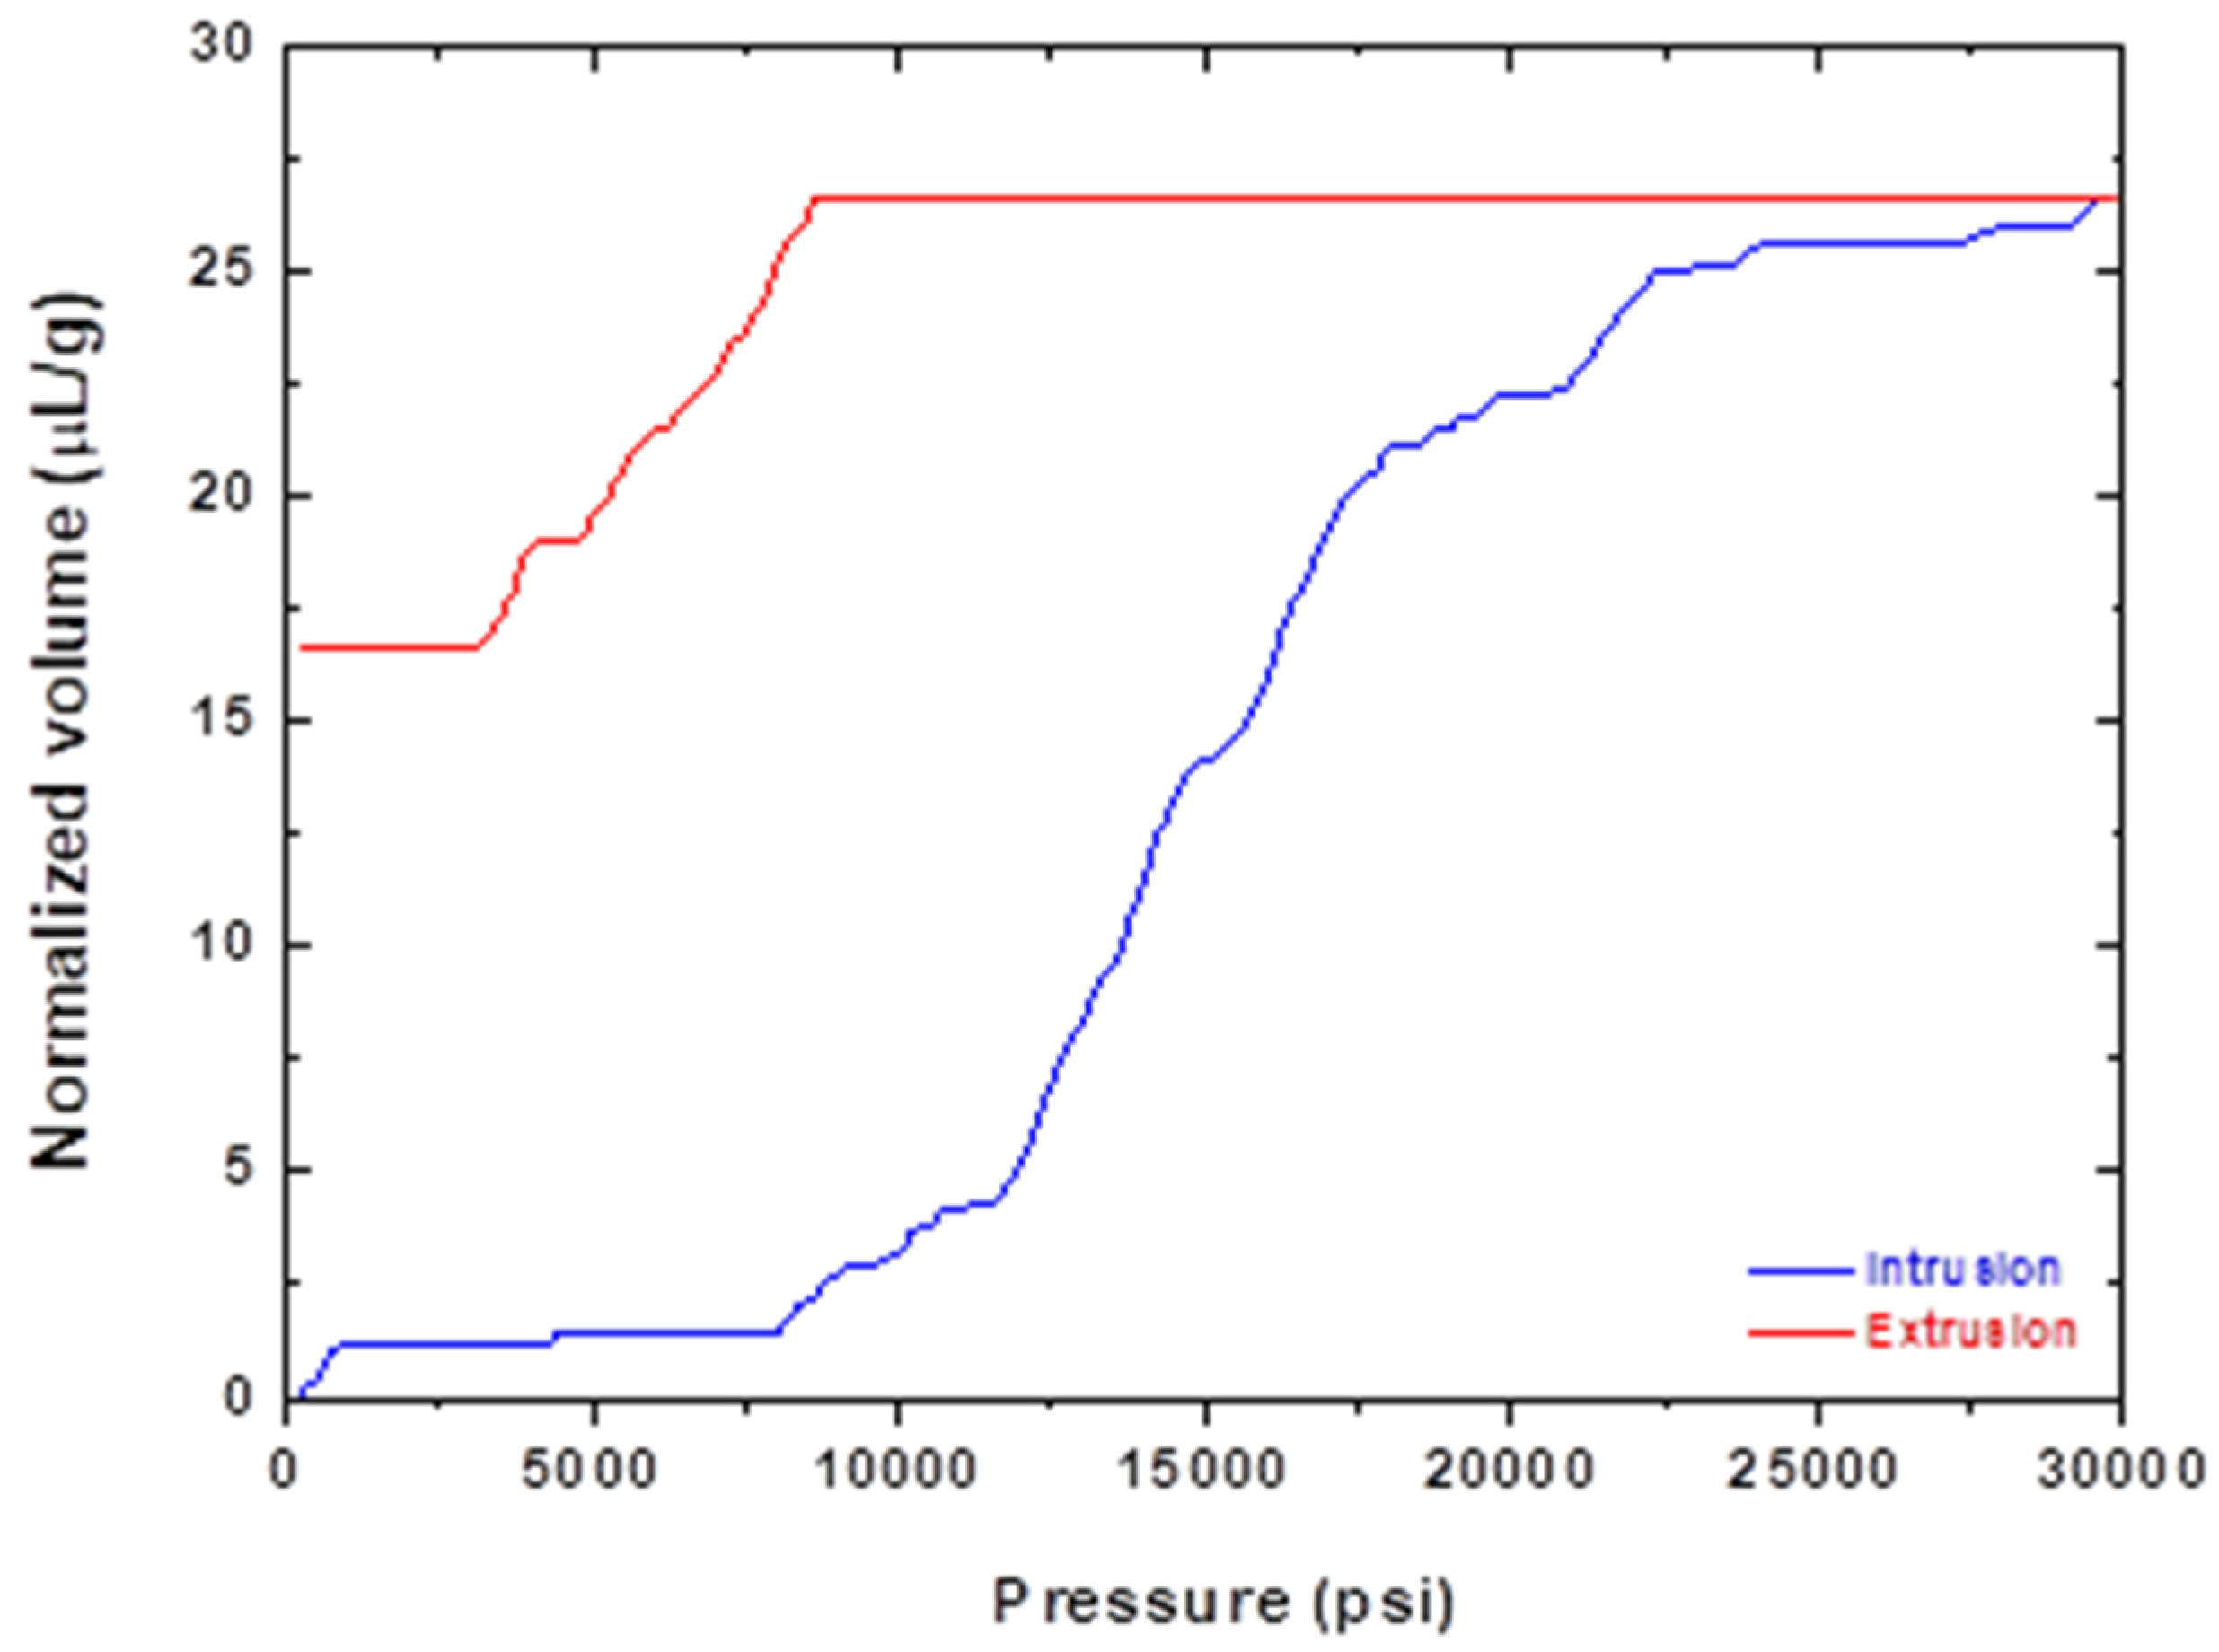
3.2. Porosity
3.3. Volumetric Flow Measurement
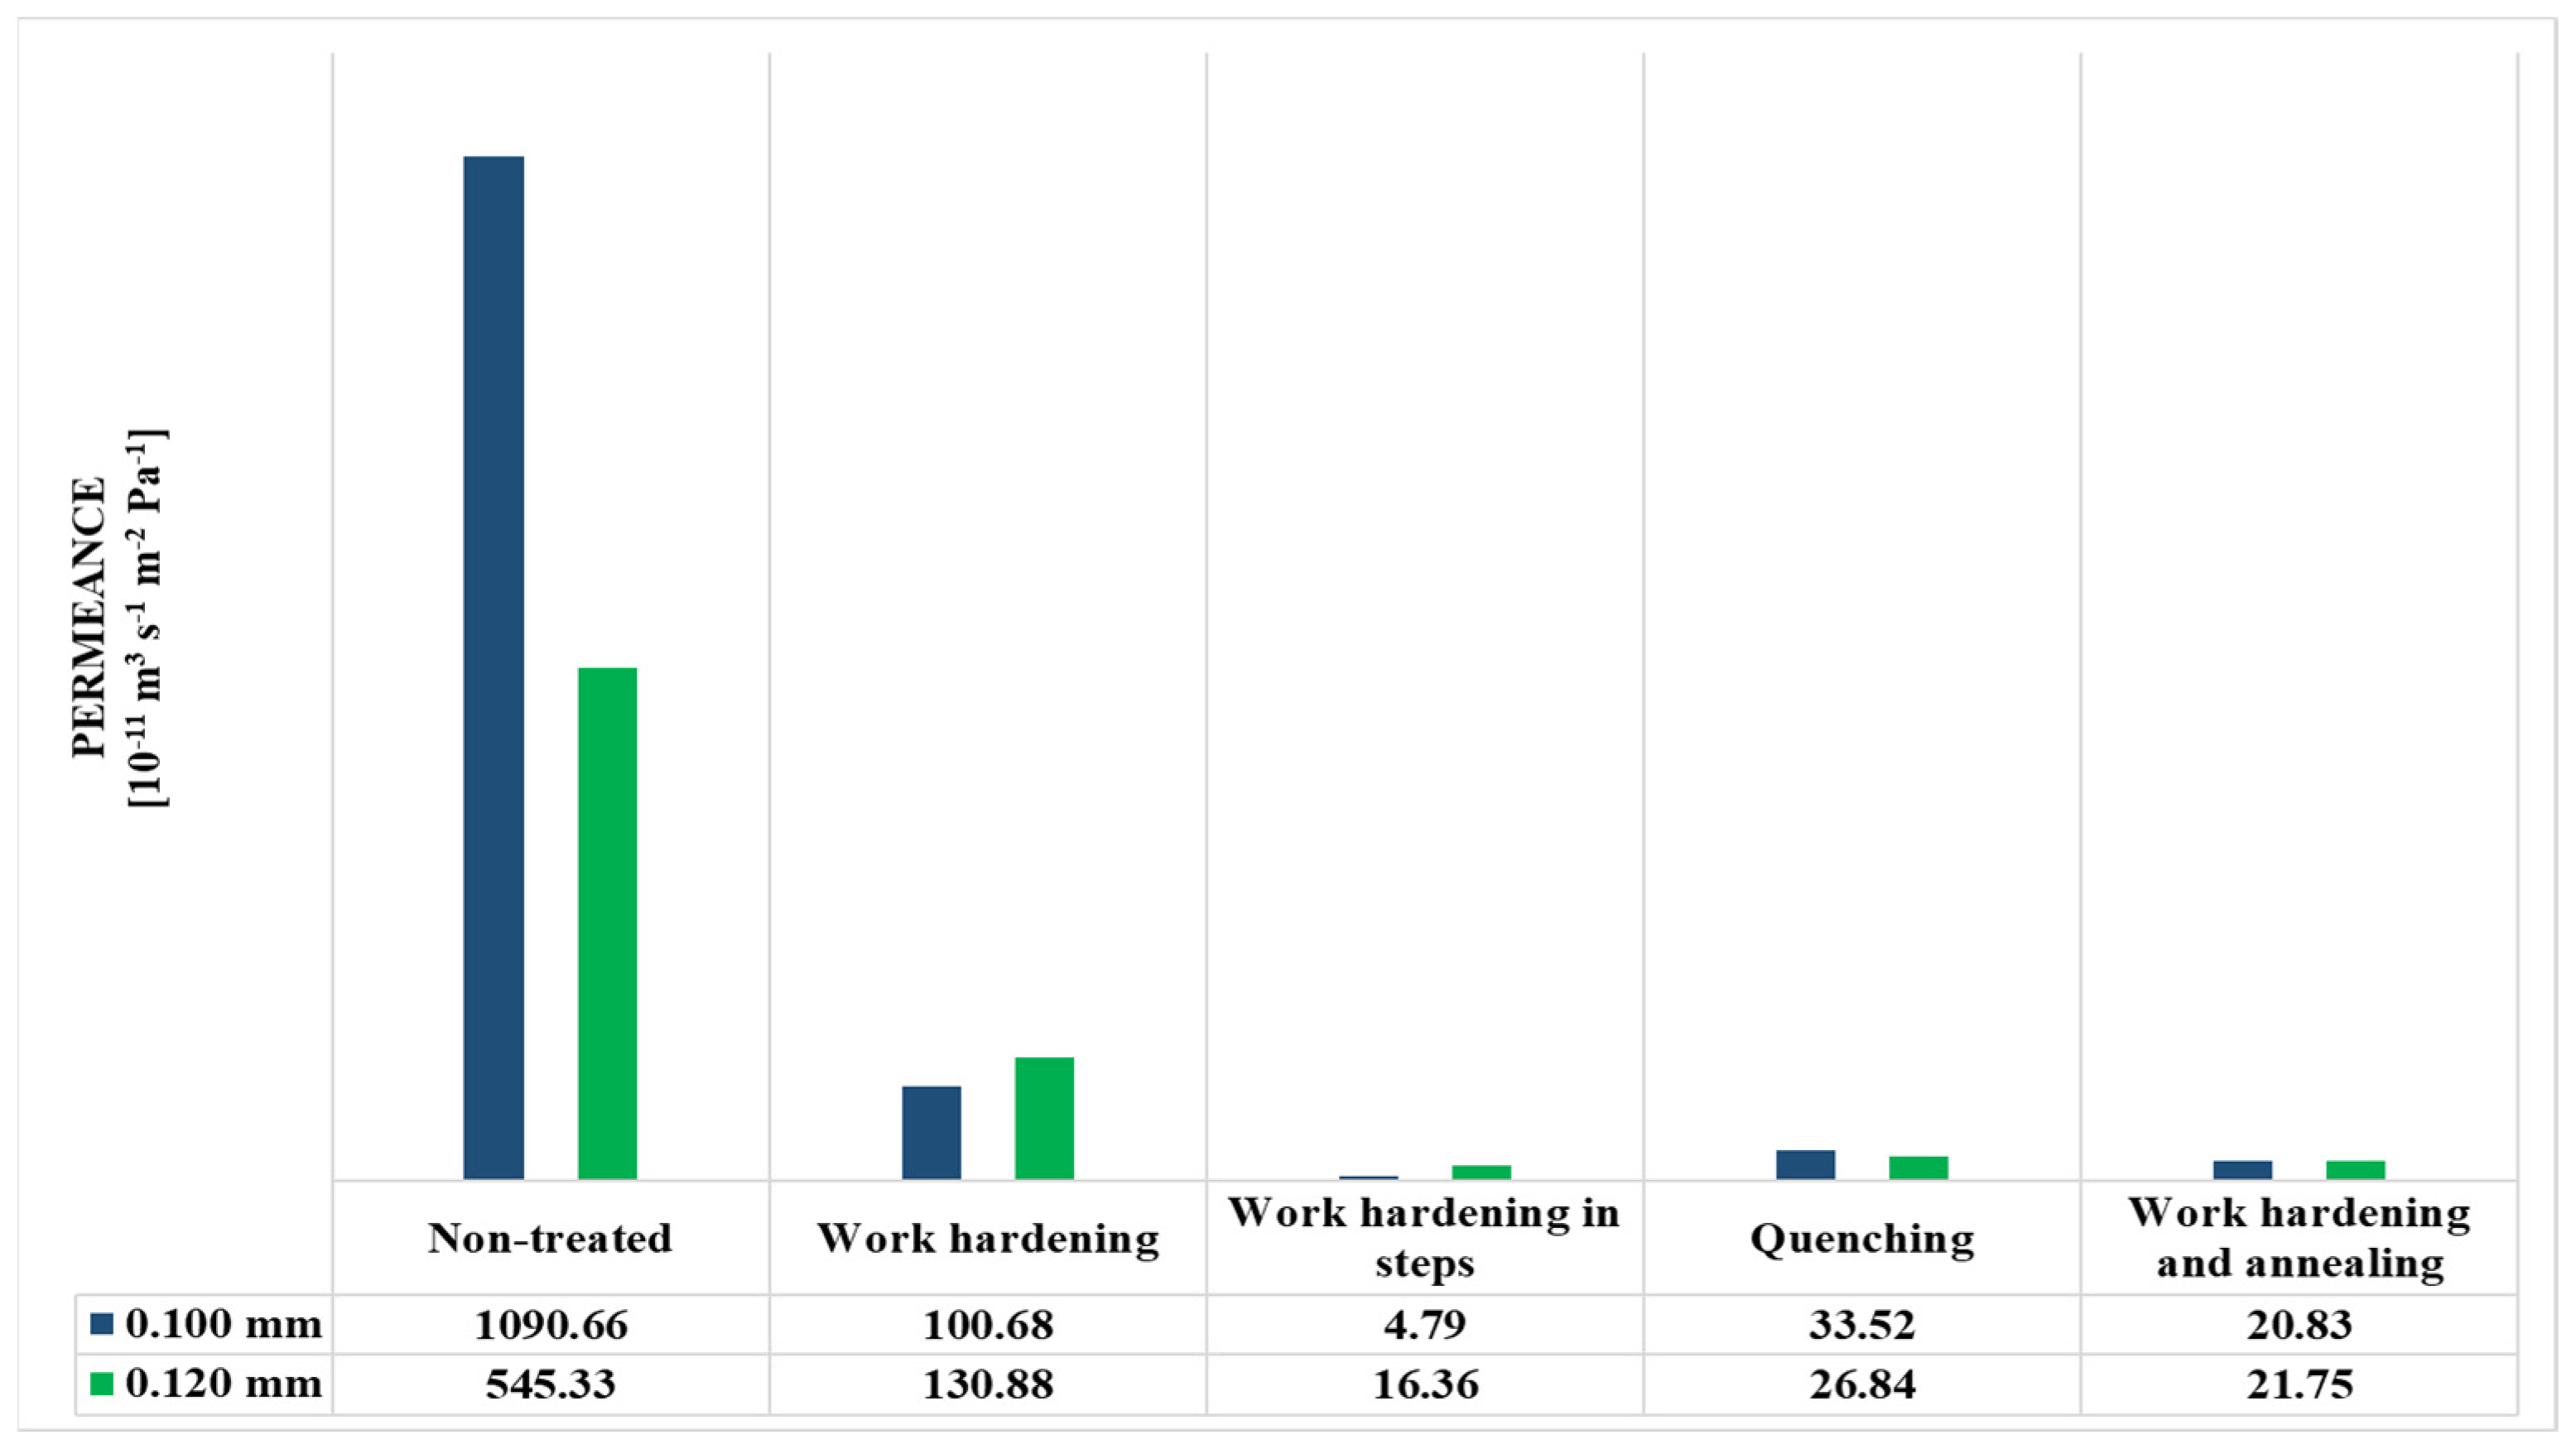
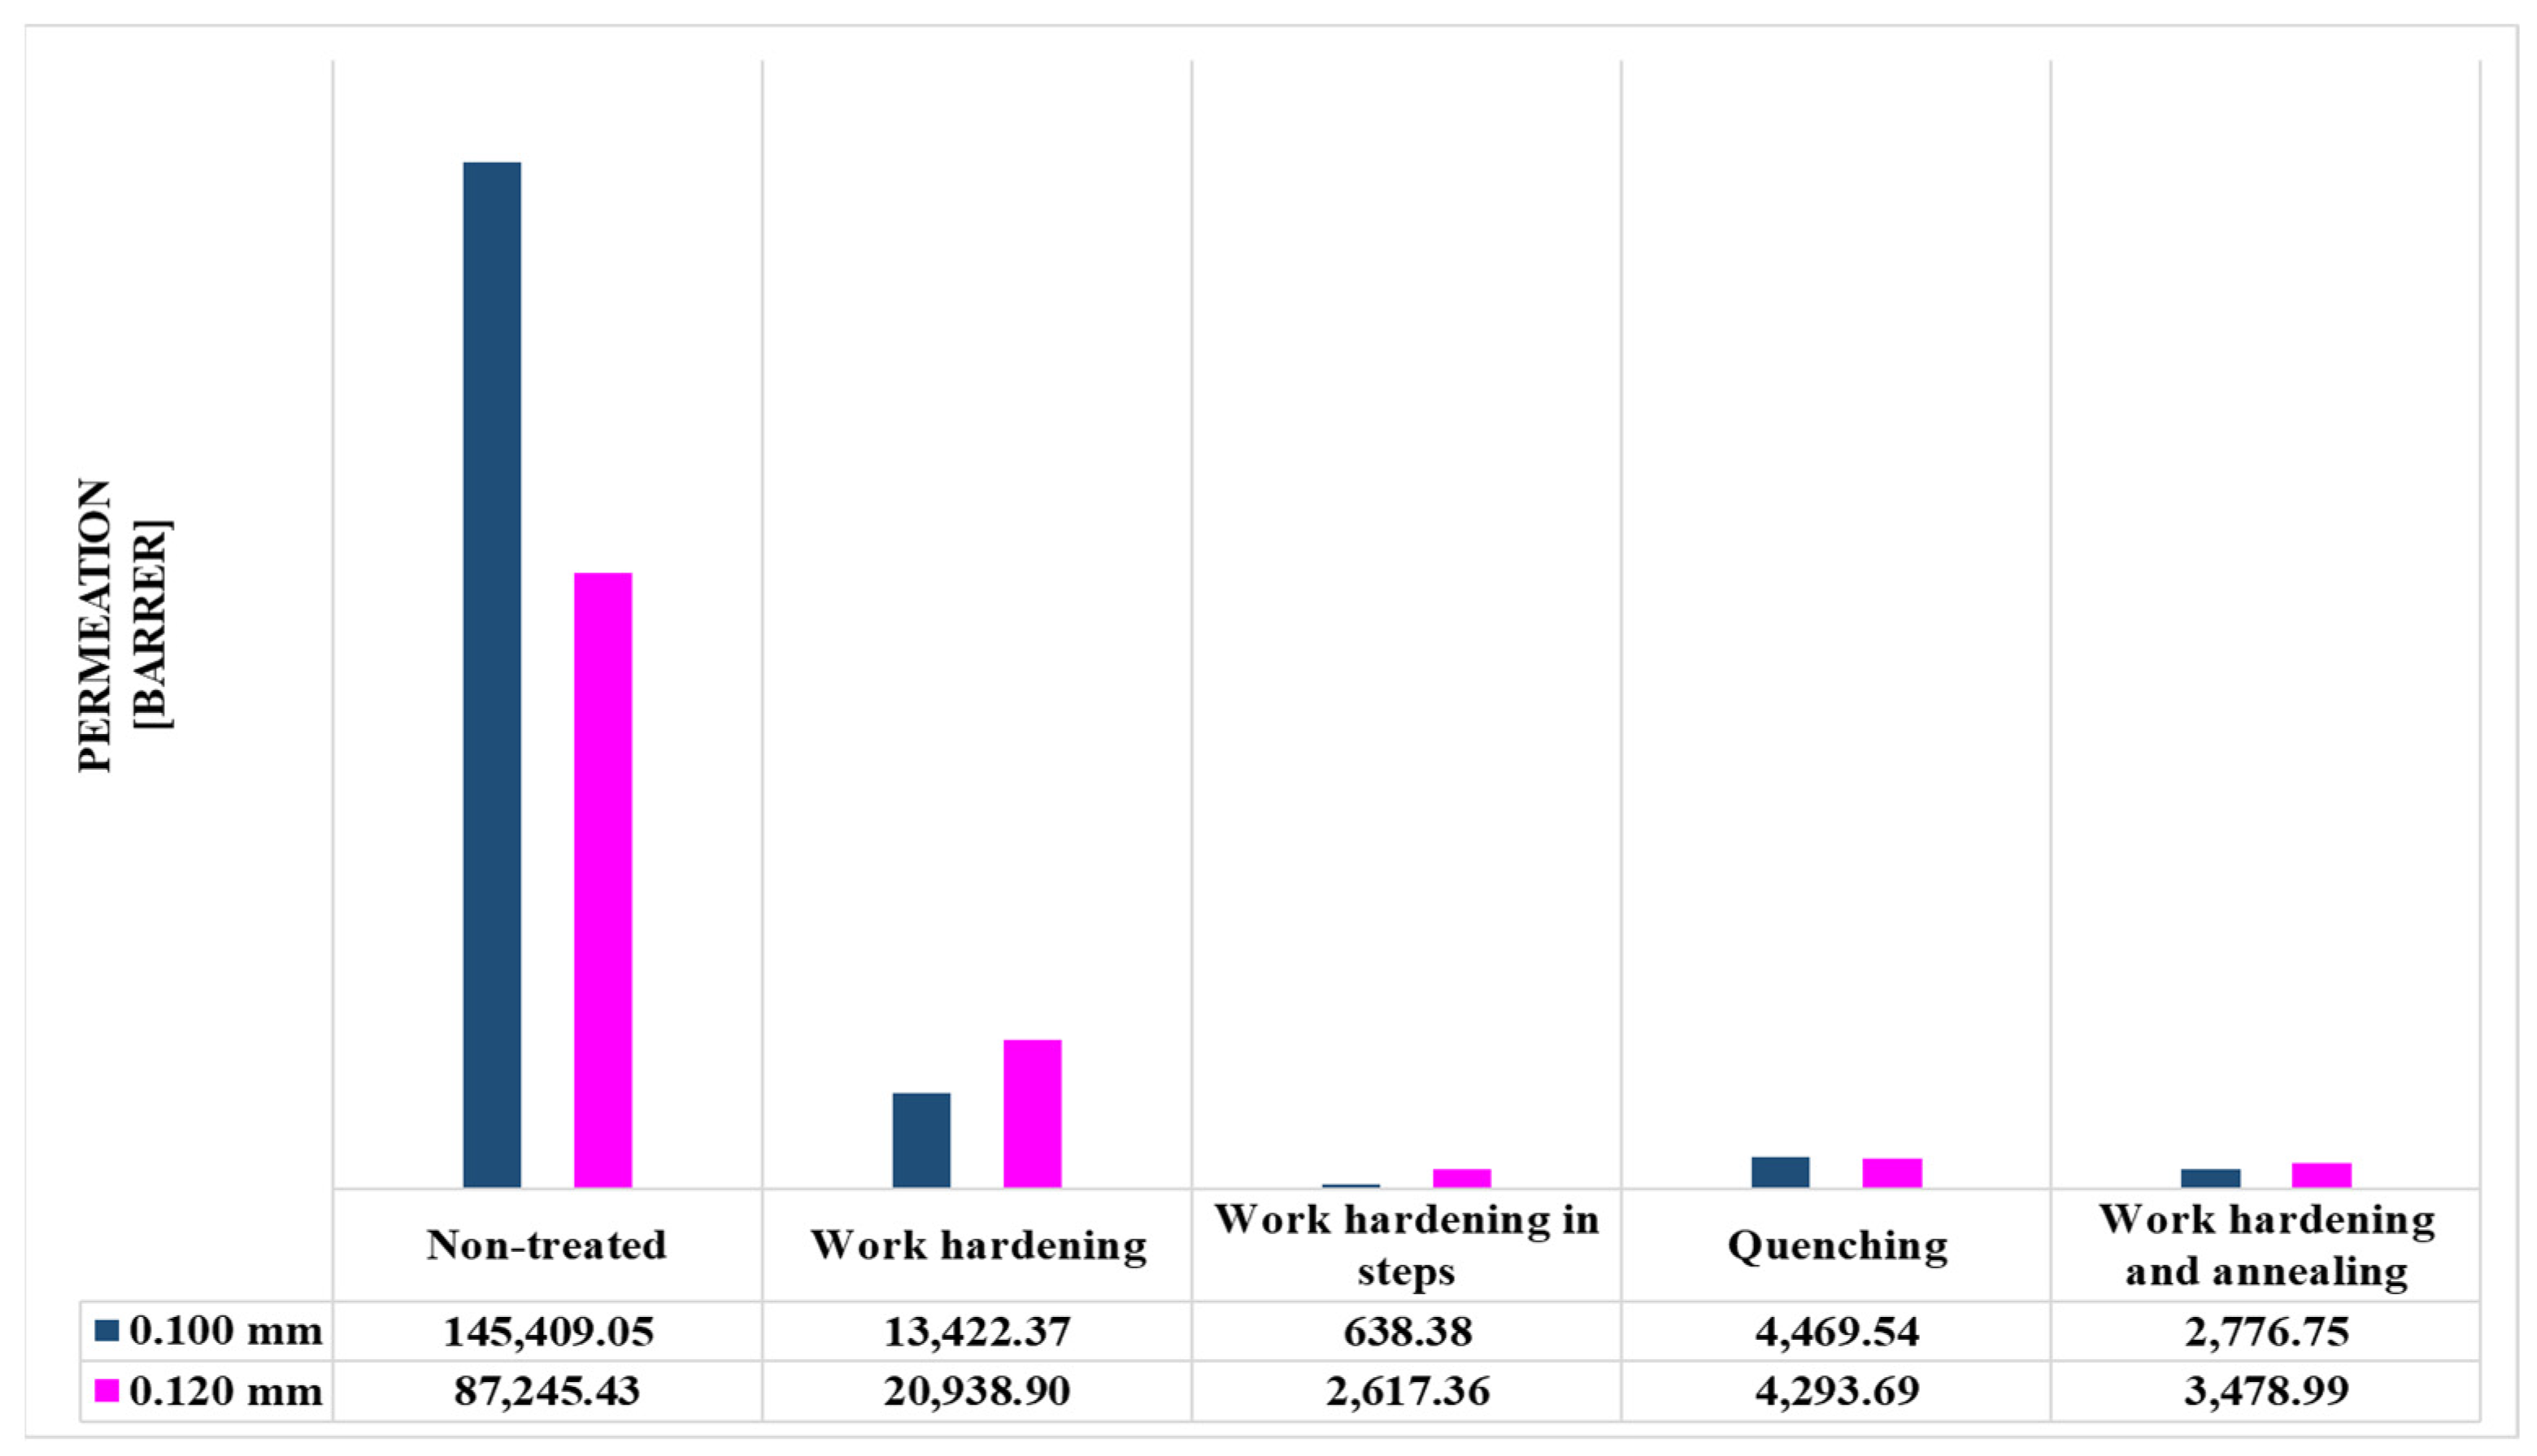
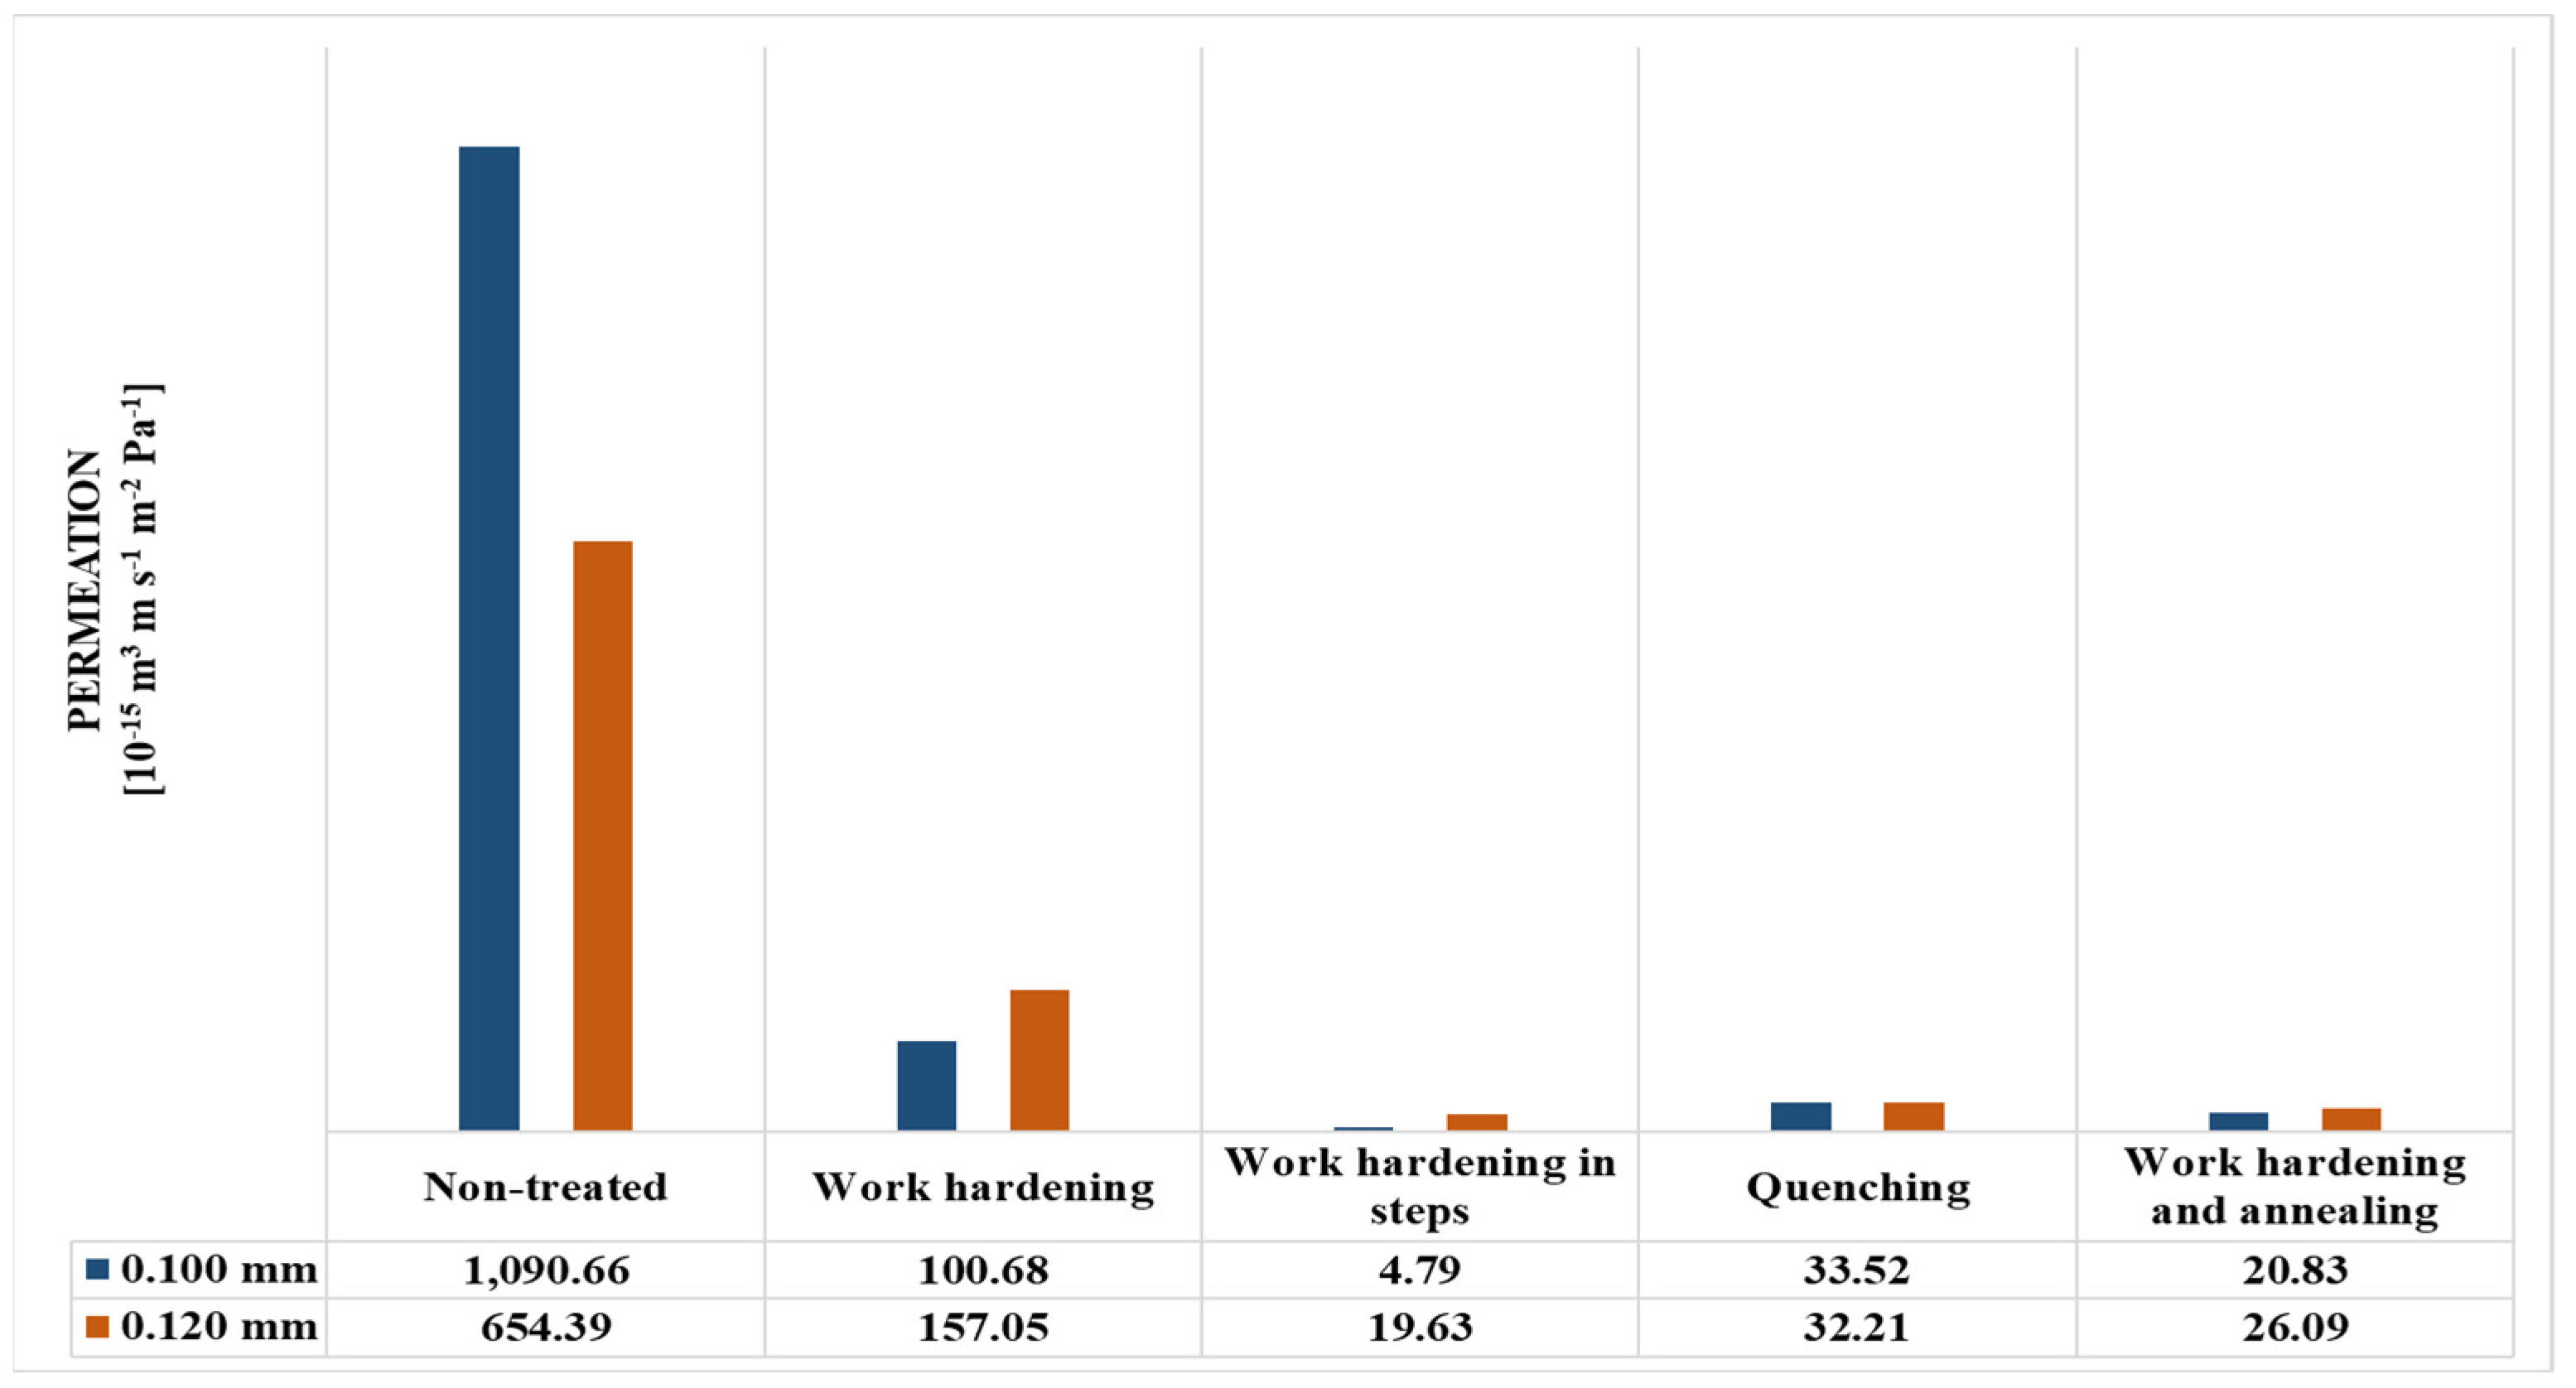
3.4. Permeability
4. Discussion
5. Conclusions and Future Prospects
Author Contributions
Funding
Institutional Review Board Statement
Informed Consent Statement
Data Availability Statement
Conflicts of Interest
References
- Kayvani Fard, A.; McKay, G.; Buekenhoudt, A.; Al Sulaiti, H.; Motmans, F.; Khraisheh, M.; Atieh, M. Inorganic Membranes: Preparation and Application for Water Treatment and Desalination. Materials 2018, 11, 74. [Google Scholar] [CrossRef] [PubMed] [Green Version]
- Yoshino, Y.; Suzuki, T.; Nair, B.N.; Taguchi, H.; Itoh, N. Development of tubular substrates, silica based membranes and membrane modules for hydrogen separation at high temperature. J. Membr. Sci. 2005, 267, 8–17. [Google Scholar] [CrossRef]
- Burggraaf, A.J.; Cot, L. Fundamentals of Inorganic Membrane Science and Technology; Elsevier: Amsterdam, The Netherlands, 1996. [Google Scholar]
- Peinemann, K.V.G.; Nunes, S. Membrane Technology; Wiley Online Library: Hoboken, NJ, USA, 2021. [Google Scholar]
- Baker, R.W. Membrane Technology and Applications; John Wiley & Sons: Hoboken, NJ, USA, 2012. [Google Scholar]
- Pandey, P.; Chauhan, R.S. Membranes for gas separation. Prog. Polym. Sci. 2001, 26, 853–893. [Google Scholar] [CrossRef]
- Crespo, J.G.; Böddeker, K.W. Membrane Processes in Separation and Purification; Springer Science & Business Media: Berlin/Heidelberg, Germany, 2013; Volume 13. [Google Scholar]
- Dumée, L.F.; He, L.; Lin, B.; Ailloux, F.M.; Lemoine, J.B.; Velleman, L.; Kong, L. The fabrication and surface functionalization of porous metal frameworks—A review. J. Mater. Chem. A 2013, 1, 15185–15206. [Google Scholar] [CrossRef] [Green Version]
- Zhu, B.; Duke, M.; Dumée, L.F.; Merenda, A.; Des Ligneris, E.; Kong, L.; Gray, S. Short Review on Porous Metal Membranes—Fabrication, Commercial Products, and Applications. Membranes 2018, 8, 83. [Google Scholar] [CrossRef] [PubMed] [Green Version]
- González-Carrasco, J.L.; Cifuentes Cuellar, S.C.; Lieblich Rodríguez, M. 5-Metals. In Bone Repair Biomaterials, 2nd ed.; Pawelec, K.M., Planell, J.A., Eds.; Woodhead Publishing: Sawston, UK, 2019; pp. 103–140. [Google Scholar]
- Callister, W.D.; Rethwisch, D.G. Materials Science and Engineering: An Introduction; Wiley: New York, NY, USA, 2018; Volume 9. [Google Scholar]
- David, O.Y.; Gendel, Y.; Wessling, M. Tubular macro-porous titanium membranes. J. Membr. Sci. 2014, 461, 139–145. [Google Scholar] [CrossRef]
- Duan, Y.; Hui, H.; Wang, H.; Kang, J.; Li, J. Fabrication and characterization of hierarchically porous titanium membrane for dye wastewater treatment. Mater. Res. Express 2019, 6, 115534. [Google Scholar] [CrossRef]
- Ryi, S.-K.; Park, J.-S.; Kim, D.-K.; Kim, T.-H.; Kim, S.-H. Methane steam reforming with a novel catalytic nickel membrane for effective hydrogen production. J. Membr. Sci. 2009, 339, 189–194. [Google Scholar] [CrossRef]
- Lin, W.-H.; Liu, Y.-C.; Chang, H.-F. Hydrogen production from oxidative steam reforming of ethanol in a palladium–silver alloy composite membrane reactor. J. Chin. Inst. Chem. Eng. 2008, 39, 435–440. [Google Scholar] [CrossRef]
- Song, J.; Oh, H.; Kong, H.; Jang, J. Polyrhodanine modified anodic aluminum oxide membrane for heavy metal ions removal. J. Hazard. Mater. 2011, 187, 311–317. [Google Scholar] [CrossRef] [PubMed]
- Wu, T.N.; Prasetya, N.; Li, K. Recent advances in aluminium-based metal-organic frameworks (MOF) and its membrane applications. J. Membr. Sci. 2020, 615, 118493. [Google Scholar] [CrossRef]
- Ho, W.; Sirkar, K. Membrane Handbook; Springer Science & Business Media: Berlin/Heidelberg, Germany, 2012. [Google Scholar]
- Singh, H.P.; Saxena, P.; Puri, Y.M. Materials selection and manufacturing of metal membranes for industrial applications. Mater. Lett. 2020, 269, 127557. [Google Scholar] [CrossRef]
- Adiga, S.P.; Jin, C.; Curtiss, L.A.; Monteiro-Riviere, N.A.; Narayan, R.J. Nanoporous membranes for medical and biological applications. Wiley Interdiscip. Rev. Nanomed. Nanobiotechnol. 2009, 1, 568–581. [Google Scholar] [CrossRef] [Green Version]
- Ang, T.W.; Wang, J.; Zhang, C.; Yang, Z.; Dai, X.; Cheng, M.; Hou, X. Metal–organic framework MIL-101(Cr) as a sorbent of porous membrane-protected micro-solid-phase extraction for the analysis of six phthalate esters from drinking water: A combination of experimental and computational study. Analyst 2015, 140, 5308–5316. [Google Scholar] [CrossRef]
- Leiknes, T.; Ødegaard, H.; Myklebust, H. Removal of natural organic matter (NOM) in drinking water treatment by coagulation–microfiltration using metal membranes. J. Membr. Sci. 2004, 242, 47–55. [Google Scholar] [CrossRef]
- Zhang, S.; Qu, Y.; Liu, Y.; Yang, F.; Zhang, X.; Furukawa, K.; Yamada, Y. Experimental study of domestic sewage treatment with a metal membrane bioreactor. Desalination 2005, 177, 83–93. [Google Scholar] [CrossRef]
- Yang, C.; Tao, Q.; Ding, Y. Recent Progress in Lead-free Environmentally-friendly Brasses. Cailiao Daobao Mater. Rep. 2019, 33, 2109–2118. [Google Scholar]
- Vilarinho, C.; Davim, J.; Soares, D.; Castro, F.; Barbosa, J. Influence of the chemical composition on the machinability of brasses. J. Mater. Process. Technol. 2005, 170, 441–447. [Google Scholar] [CrossRef] [Green Version]
- Ab Latif Wani, A.A.; Usmani, J.A. Lead toxicity: A review. Interdiscip. Toxicol. 2015, 8, 55. [Google Scholar] [CrossRef] [PubMed] [Green Version]
- Goyer, R.A. Lead toxicity: Current concerns. Environ. Health Perspect. 1993, 100, 177–187. [Google Scholar] [CrossRef] [PubMed]
- Boruah, B.S.; Biswas, R. An optical fiber based surface plasmon resonance technique for sensing of lead ions: A toxic water pollutant. Opt. Fiber Technol. 2018, 46, 152–156. [Google Scholar] [CrossRef]
- German Institute for Standardisation (Deutsches Institut für Normung). Wrought Copper Alloys-Copper-Zinc Alloys-(Brass)-(Special Brass)-Composition; German Institute for Standardisation: Berlin/Heidelberg, Germany, 2018; Available online: https://www.copper.org/resources/properties/db/datasheets/wrought-brasses.pdf (accessed on 10 June 2021).
- Hingwe, A.K.; Subramanian, K.N. Deformation of duplex crystals and two-phase bicrystals of alpha-beta brass. J. Mater. Sci. 1975, 10, 183–188. [Google Scholar] [CrossRef]
- Rao, K.V. Manufacturing Science and Technology-Manufacturing Processess and Machine Tools; New Age International Publishers: New Delhi, India, 2020. [Google Scholar]
- Xu, J.; Guo, B.; Wang, C.; Shan, D. Blanking clearance and grain size effects on micro deformation behavior and fracture in micro-blanking of brass foil. Int. J. Mach. Tools Manuf. 2012, 60, 27–34. [Google Scholar] [CrossRef]
- Doherty, R.; Hughes, D.; Humphreys, F.; Jonas, J.; Jensen, D.J.; Kassner, M.; King, W.; McNelley, T.; McQueen, H.; Rollett, A. Current issues in recrystallization: A review. Mater. Sci. Eng. A 1997, 238, 219–274. [Google Scholar] [CrossRef] [Green Version]
- Ekmekci, B. White Layer Composition, Heat Treatment, and Crack Formation in Electric Discharge Machining Process. Met. Mater. Trans. A 2009, 40, 70–81. [Google Scholar] [CrossRef]
- Alaneme, K.K.; Okotete, E.A. Recrystallization mechanisms and microstructure development in emerging metallic materials: A review. J. Sci. Adv. Mater. Devices 2019, 4, 19–33. [Google Scholar] [CrossRef]
- Koo, J.B.; Yoon, D.Y. Abnormal grain growth in bulk Cu—The dependence on initial grain size and annealing temperature. Met. Mater. Trans. A 2001, 32, 1911–1926. [Google Scholar] [CrossRef]
- Brooks, C.R. Heat Treatment, Structure, and Properties of Nonferr Ous Alloys; ASM International: Geauga County, OH, USA, 1982. [Google Scholar]
- Butts, A. Copper: The Science and Technology of the Metal, Its Alloys and Compounds; Reinhold Publishing Corporation: New York, NY, USA, 1954; Volume 122. [Google Scholar]
- Washburn, E.W. Note on a Method of Determining the Distribution of Pore Sizes in a Porous Material. Proc. Natl. Acad. Sci. USA 1921, 7, 115–116. [Google Scholar] [CrossRef] [PubMed] [Green Version]
- Tabe-Mohammadi, A. A review of the applications of membrane separation technology in natural gas treatment. Sep. Sci. Technol. 1999, 34, 2095–2111. [Google Scholar] [CrossRef]
- Ismail, A.F.; Khulbe, K.C.; Matsuura, T. Fundamentals of Gas Permeation Through Membranes. In Gas Separation Membranes: Polymeric and Inorganic; Springer International Publishing: Cham, Switzerland, 2015; pp. 11–35. [Google Scholar]


| Specimen Number | Treatment Type |
|---|---|
| 1 | Non-treated brass alloy |
| 2 | Work-hardening at 750 °C heating temperature and compressed at 450 bar |
| 3 | Work-hardening in consecutive steps: heating at 780 °C and compressed at 50 bar, then 860 °C and 450 bar, 820 °C and 450 bar, and 900 °C and 450 bar |
| 4 | Work-hardening at 750 °C and annealing: recovery at 400 °C, crystal growth at 650 °C |
| 5 | Heating at 850 °C for and quenching by an air stream |
| Parameter | Units | Value |
|---|---|---|
| Saturation volume | (μL/g) | 25.62 |
| Minimum saturation pressure | (psi) | 8700 |
| Density | (g/cm3) | 8.48 |
| Porosity | (%) | 21.73 |
| Pore size | (A) | 122.6 |
| Treatment | Thickness: 0.100 mm | Thickness: 0.120 mm | ||
|---|---|---|---|---|
| Permeance (GPU) | Permeation (Barrer) | Permeance (GPU) | Permeation (Barrer) | |
| Non-treated | 1454.09 | 145,409 | 727.04 | 87,245 |
| Work-hardening | 134.22 | 13,422 | 174.49 | 20,939 |
| Work-hardening in steps | 6.38 | 638 | 21.81 | 2617 |
| Quenching | 44.70 | 4470 | 35.78 | 4294 |
| Work-hardening and annealing | 27.77 | 2777 | 28.99 | 3479 |
| Treatment | Thickness: 0.100 mm | Thickness: 0.120 mm | ||
|---|---|---|---|---|
| Permeance (m3 s−1 m−2 Pa−1) | Permeation (m3 m s−1 m−2 Pa−1) | Permeance (m3 s−1 m−2 Pa−1) | Permeation (m3 m s−1 m−2 Pa−1) | |
| Non-treated | 1091 × 10−8 | 1091 × 10−12 | 5453 × 10−9 | 6544 × 10−13 |
| Work-hardening | 1007 × 10−9 | 1007 × 10−13 | 1309 × 10−9 | 1571 × 10−13 |
| Work-hardening in steps | 4788 × 10−11 | 4788 × 10−15 | 1636 × 10−10 | 1963 × 10−14 |
| Quenching | 3352 × 10−10 | 3352 × 10−14 | 2684 × 10−10 | 3221 × 10−14 |
| Work-hardening and annealing | 2083 × 10−10 | 2083 × 10−14 | 2175 × 10−10 | 2609 × 10−14 |
| Treatment Method | ||
|---|---|---|
| 0.100 mm | 0.120 mm | |
| Work-hardening | 90.77 | 76.00 |
| Work-hardening in steps | 99.56 | 97.00 |
| Work-hardening and annealing | 98.09 | 96.01 |
| Quenching | 96.93 | 95.08 |
Publisher’s Note: MDPI stays neutral with regard to jurisdictional claims in published maps and institutional affiliations. |
© 2021 by the authors. Licensee MDPI, Basel, Switzerland. This article is an open access article distributed under the terms and conditions of the Creative Commons Attribution (CC BY) license (https://creativecommons.org/licenses/by/4.0/).
Share and Cite
Kavafaki, S.; Bomis, G.; Drakaki, K.; Varoutoglou, A.; Kiourtzidis, K.; Kyzas, G.Z.; Mitropoulos, A.C. Investigation of Duplex Brass Membranes with Metallography, Permeability and Treatments: Work-Hardening, Annealing and Quenching. ChemEngineering 2021, 5, 76. https://doi.org/10.3390/chemengineering5040076
Kavafaki S, Bomis G, Drakaki K, Varoutoglou A, Kiourtzidis K, Kyzas GZ, Mitropoulos AC. Investigation of Duplex Brass Membranes with Metallography, Permeability and Treatments: Work-Hardening, Annealing and Quenching. ChemEngineering. 2021; 5(4):76. https://doi.org/10.3390/chemengineering5040076
Chicago/Turabian StyleKavafaki, Sofia, George Bomis, Kyriaki Drakaki, Athanasios Varoutoglou, Konstantinos Kiourtzidis, George Z. Kyzas, and Athanasios C. Mitropoulos. 2021. "Investigation of Duplex Brass Membranes with Metallography, Permeability and Treatments: Work-Hardening, Annealing and Quenching" ChemEngineering 5, no. 4: 76. https://doi.org/10.3390/chemengineering5040076
APA StyleKavafaki, S., Bomis, G., Drakaki, K., Varoutoglou, A., Kiourtzidis, K., Kyzas, G. Z., & Mitropoulos, A. C. (2021). Investigation of Duplex Brass Membranes with Metallography, Permeability and Treatments: Work-Hardening, Annealing and Quenching. ChemEngineering, 5(4), 76. https://doi.org/10.3390/chemengineering5040076