Article

A 3D Smoothed Particle Hydrodynamics Study of a Non-Symmetrical Rayleigh Collapse for an Empty Cavity

by
Andrea Albano
*,† and
Alessio Alexiadis
*,†
School of Chemical Engineering, University of Birmingham, Birmingham B15 2TT, UK
*
Authors to whom correspondence should be addressed.
These authors contributed equally to this work.
ChemEngineering 2021, 5(3), 63; https://doi.org/10.3390/chemengineering5030063
Submission received: 31 May 2021 / Revised: 23 August 2021 / Accepted: 9 September 2021 / Published: 14 September 2021

Abstract

:
In this work the first 3D Smoothed Particle Hydrodynamics model of a Rayleigh collapse for an empty cavity is proposed with the aim of improving the hydrodynamic analysis of a non-symmetrical collapse. The hydrodynamics of the model is validated against the solution of the Rayleigh-Plesset equation for a symmetrical collapse. The model is then used to simulate a non-symmetrical collapse of an empty cavity attached to a solid surface with γ = 0.6 induced by an external pressure of 50 [MPa]. The results shows that is possible to identify three regions where the hydrodynamics of the collapsing cavity shows different features. For all the stages of the collapse the simulation shows smooth pressure and velocity fields in the liquid and in the solid phase with the formation of a vortex ring in the final phase of the collapse. Finally, the model is compared to a previous 2D model to highlight strong, weak points and the key differences of both approaches in final phase of the collapse.

1. Introduction

The collapse of bubbles, or cavities, has been studied for more than a hundred years [1,2,3,4,5,6,7,8,9,10,11] since the first study by Besant in 1859 [12]. The collapse is the second phase of the cavitation phenomenon, and generally occurs after the growth phase of the so-called cavitation nuclei present in a liquid medium as water [13]. When the driving force of the collapse phase is the pressure difference between the pressure of the liquid and the pressure inside the cavity the collapse is called Rayleigh collapse named after Lord Rayleigh who first derived the analytical expression to describe the dynamics of a collapsing empty cavity [2].
The collapse phase is considered one of the main sources of erosion in applications related to hydraulic machines, propellers and many more [14,15,16] and, during the decades, has been investigated theoretically [17,18,19,20,21], experimentally [7,8,22,23,24,25] and computationally [26,27,28,29].
The erosion process induced by the collapse of cavities, called cavitation erosion, is associated to the strong shock waves generated at the collapse [13,15]. The intensity of the interaction between the shock waves and a nearby surface depends on the proximity of the cavity respect to the surface [13]. Moreover, when a spherical cavity is within a specific distance with the surface, of approximately five times the cavity radius, the cavity does not preserve its symmetry generating a high-speed jet in the direction of the surface [30].
When the collapsing cavity is attached to the surface, the jet impacts directly on it generating a strong water hammer shock followed by other post-impact shocks of different intensity induced by the complex hydrodynamic patterns of the collapsing cavity [1,13].
Due to practical difficulties (i.e., short time scale of the collapse, small dimension scale of the cavity) in studying the collapse of a single cavity with an experimental approach, researchers started studying the collapse phase of a single cavity with numerical experiments. Initially, only traditional mesh-based methods were used to address the problem, and lately also mesh-free particle methods [1,31,32,33,34] were used.
Mesh-free particle methods, where the domain is discretised using a finite number of particles interacting with each other without a grid, show advantages over mesh-based method in presence of large liquid deformation and break up of solid structures [35]. In particular, Smoothed Particle Hydrodynamics (SPH) has been successfully used for simulating shock waves [36,37], underwater explosion [38,39], multiphase flow and high velocity impact phenomena [40]. For this reasons, it looks promising for simulating the hydrodynamics of the collapse phase of a cavity and its interaction with a solid surface.
However, to the best of our knowledge, all cavitation studies based on mesh-free methods are limited to two-dimensional domains. In this paper, we present the first three-dimensional SPH model of a collapsing cavity near a solid surface with the aim to investigate the hydrodynamics of the last phases of a non-symmetrical collapse. The results show several key differences between two- and three-dimensional simulations regarding the last phase of the collapse.

2. Smoothed Particle Hydrodynamics

The SPH method has been originally developed by Lucy [41] and Gingold & Monaghan [42] in 1977 to simulate astrophysics problems. In the following years it was expanded to be able to simulate a wide range of applications such as shock waves [43,44], Riemann problem [45], explosion [46], non Newtonian fluid flow [47,48], multiphase flow [49,50], thermo-capillary flows [51], nano-fluid flows [52], and thermo-fluid application [53].
The SPH method uses a particle representation of continuous functions to discretise set of equations [35]. To derive a particle expression of a function and of the gradient of a function we start from the integral representation of a function: given a domain delimited within a volume V, is possible to express any continuum function f ( r ) , function of the position r , with the integral representation
f ( r ) = f ( r ) δ ( | r r | ) d r ,
where δ ( r r ) is the Dirac delta function. In the SPH framework the Dirac delta function is replaced with a bell-shaped, normalised, symmetric function with compact support function called smoothing function or kernel, W. The kernel only depends on the position r and on the smoothing length h [35]. With this substitution we obtain the so-called SPH interpolant.
f ( r ) f ( r ) W ( | r r | , h ) d r .
From the SPH interpolant, we can now derive the particle representation of the function: in the SPH framework, the control volume defined before is represented with a finite number of particles with their own volume and mass, and carrying physical information. The idea of the particle approximation is to assume that a smaller portion of V, d r 3 , is occupied by a particle with a finite volume and a mass m = ρ d r 3 . With this assumption, it is possible to discretise Equation (2) as follows
f ( r i ) m j ρ j f ( r j ) W ( | r i r j | , h ) = m j ρ j f j W i j ,
where r i is the position of the i-th particle and m j , ρ j and r j are mass, density and position of the j-th neighbour particle, which is the neighbour of the i-th particle. In fact, particles for which | r i r j | < h i are considered neighbouring particles and accounted for in the summation [35].
To discretise a PDE or ODE we also need a particle expression for the gradient operator: since f and m are particle properties the gradient operator is only going to operate on W. We obtain
f ( r i ) m j ρ j f ( r j ) W ( | r i r j | , h ) = m j ρ j f j W i j .

Kernel Function

There are several kernels in literature, all of them must satisfy the Unity, Delta, Compact, and Positivity conditions [35]. In this work we choose to use the original Lucy kernel:
W ( R , h ) = χ 1 + 3 S 1 S 3 S 1 0 S > 1 ,
where S = | r r | / h and χ is the parameter used to satisfy the unity condition. χ is, for one, two and three dimensions, equal to 5 / 4 h , 5 / π h 2 and 105 / 16 π h 3 .
Despite being the first kernel used by Lucy in 1977, it performs well in the model presented in this work. In fact, as shown in the next sections, the simulation does not show any forms of instability and its simple form helps to lower the overall computational cost of the simulation. Elsewhere [34], we compared the effect of different kernels for the case of void collapse and no significant difference was found in the results.

3. Model

3.1. Particle Expression of Governing Equations

The following continuity and momentum equations
d ρ d t = ρ v β x β , d v α d t = 1 ρ P x α ,
in the SPH framework have the following particle expressions
d ρ i d t = j m j v i j β W i j x i β , m i d v i η d t = j m i m j P i ρ i 2 + P i ρ j 2 + Π i j W i j x i η ,
where η and β are the Einstein notation indexes, v is the velocity vector with v i j = v i v j , and Π i j is the artificial viscosity introduced by Monaghan [43] to model shock wave:
Π i j = α h c i + c j ρ i + ρ j v i j · r i j r i j 2 + ϵ h 2 ,
where α is the dimensionless dissipation factor, c i and c j the speed of sound of particle i and j, and ϵ = 0.01 is used to avoid singularities when particles are very close to each other.
To solve the set of Equation (7) an Equation Of State (EOS) linking the pressure P with density ρ is required to solve the set of equations. In SPH a common EOS is the Tait equation [35]
P ( ρ ) = c 0 2 ρ 0 7 ρ ρ 0 7 1 ,
where c 0 is the speed of sound of the liquid and ρ 0 is the reference density. In this work c 0 = 1484 [ms], that is the real speed of sound of the water, and ρ 0 = 978.46 [kg m−3]. The value of the reference density was chosen to set the initial pressure of the system to 50 [MPa].

3.2. Problem Description
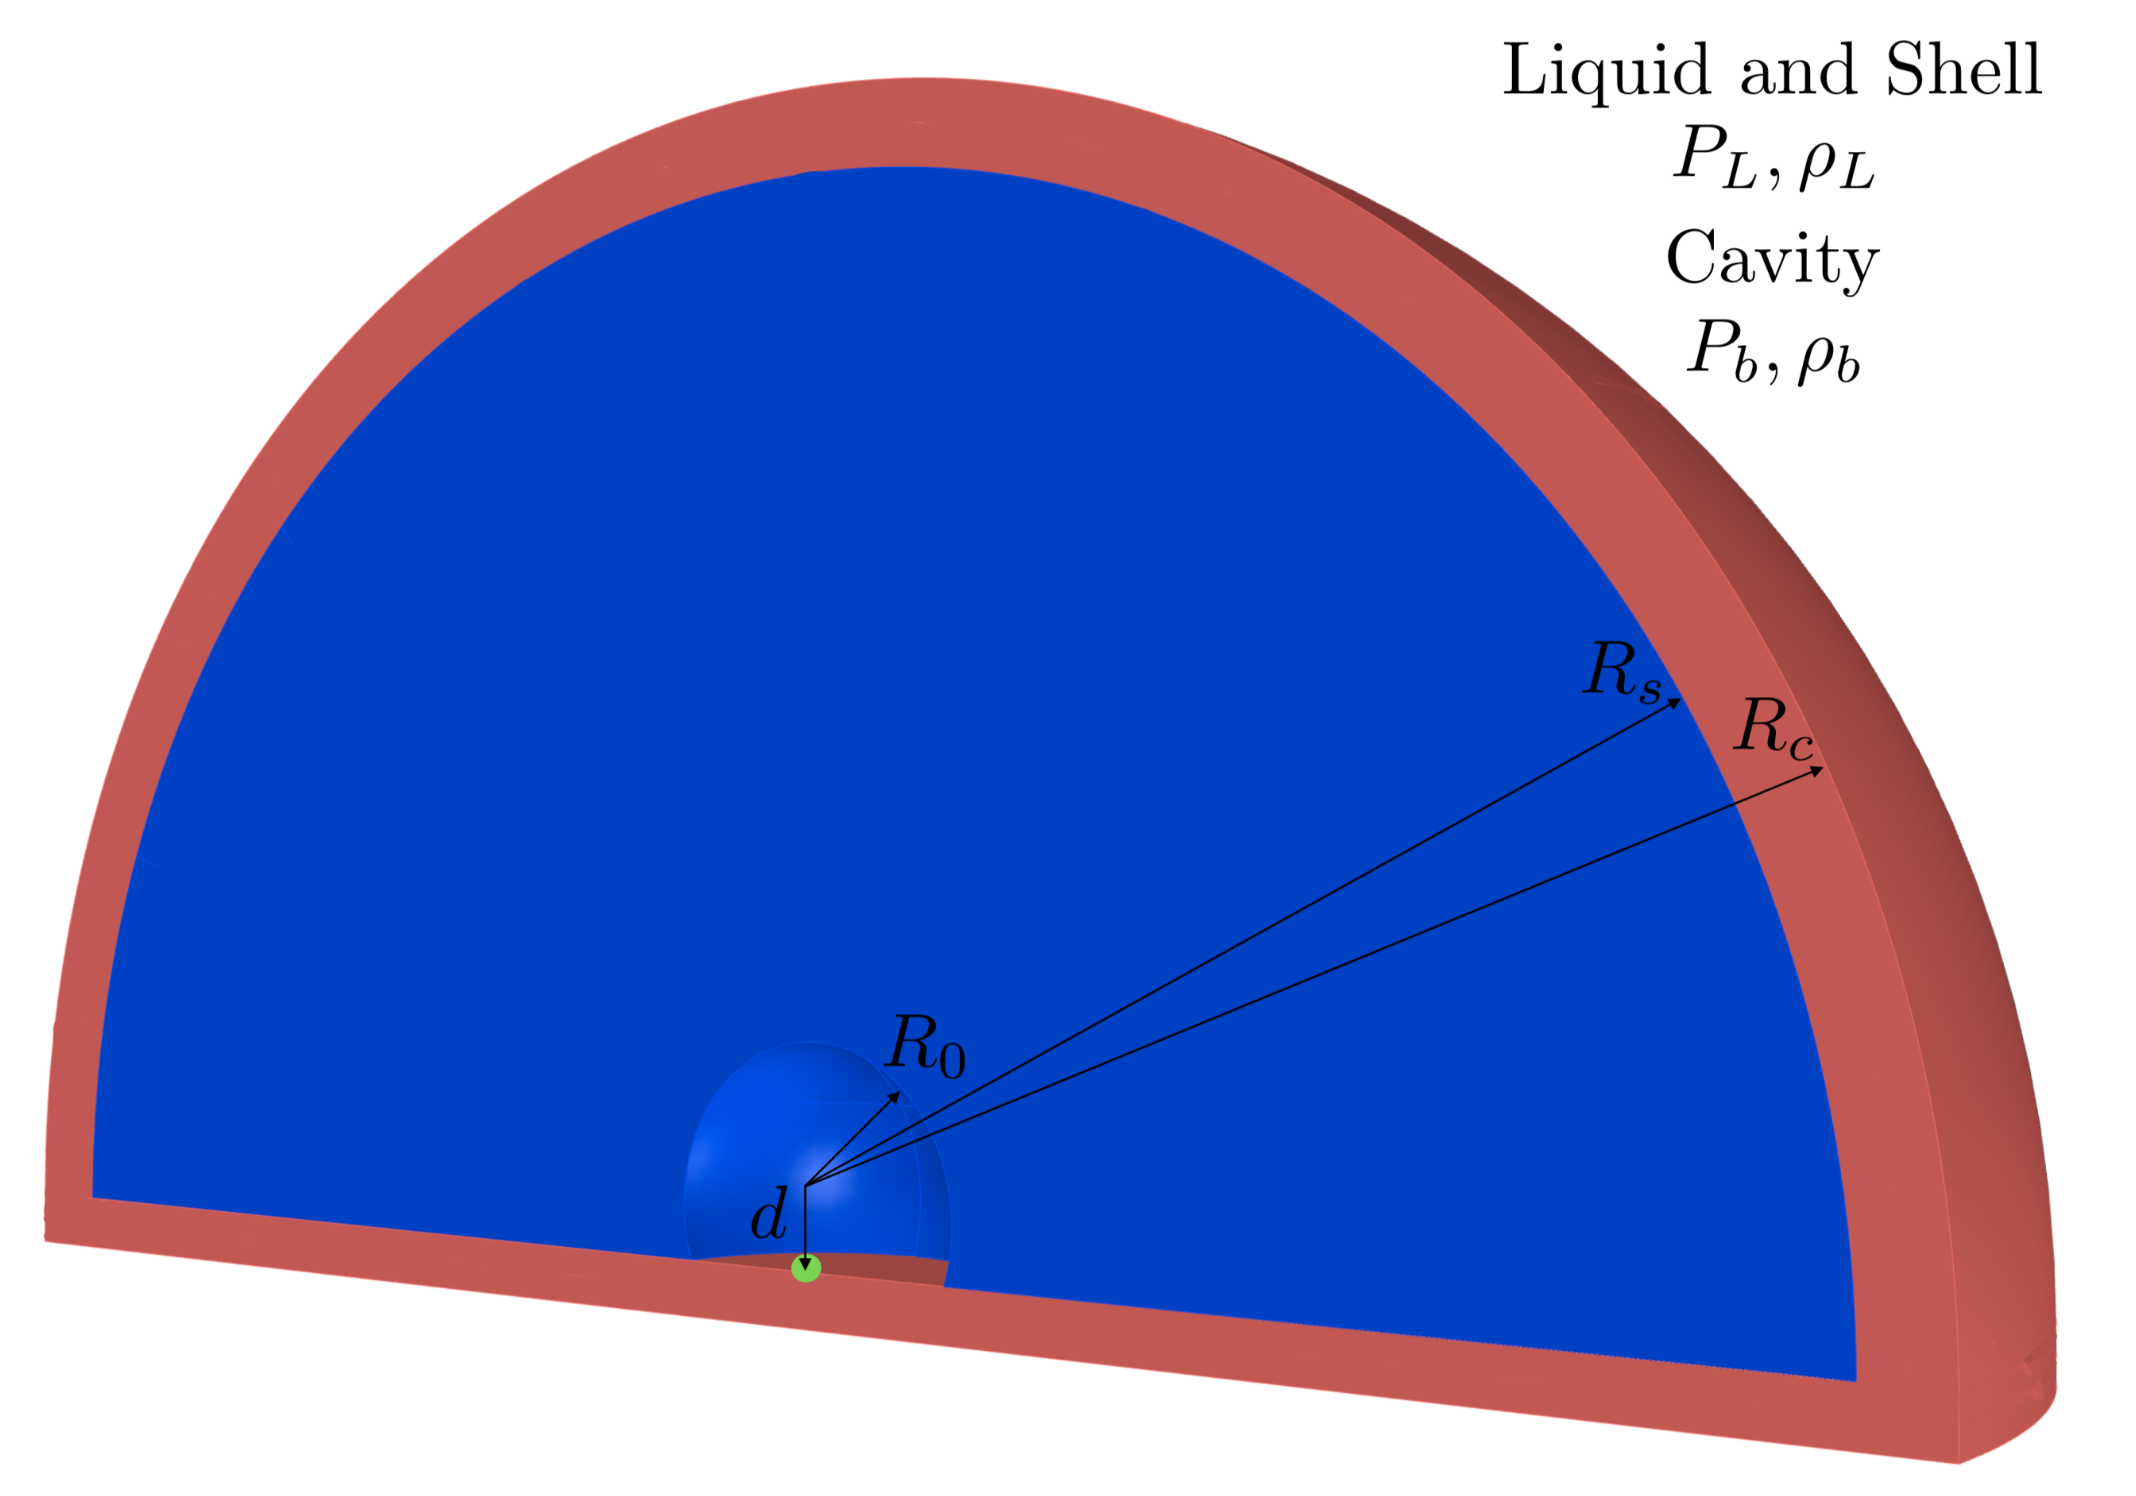
The aim of this work is to simulate a non-symmetrical Rayleigh collapse of a wall-attached empty cavity. The term Rayleigh collapse is generally used to describe a collapse whose collapse driving force is the pressure difference between the pressure of the liquid, P , and the pressure inside the cavity, p b , as described by the Rayleigh-Plesset equation:
p B P ( t ) ρ L = R ( t ) d 2 R ( t ) d t 2 + 3 2 d R ( t ) d t 2 + 4 ν L R ( t ) d R ( t ) d t + 2 S ρ L R ( t ) ,
where ν L is the liquid viscosity, S the surface tension of the cavity, and the R ( t ) the radius of the cavity.
In Equation (10), the viscosity and the surface tension terms are often neglected since their order of magnitude is smaller than that of the inertial term [15]. Under this assumption is possible to directly determine the Rayleigh collapse time [2] with an analytical expression:
t T C = 0.915 R 0 ρ L p p B 1 2 ,
where R 0 is the initial radius of the cavity.
Another reason to use the term Rayleigh collapse is to differentiate it from another collapse mechanism called shock-induced collapse. In the shock-induced collapse the collapse driving force is the interaction of the cavity with a travelling shock wave [28,33]. Another difference is that the shock-induced collapse is always non-symmetrical since a re-entrant jet is formed in the shock direction. On the contrary, the Rayleigh collapse can be either symmetric in presence of an isotropic pressure field or non-symmetric in presence of anisotropic pressure field. The anisotropic pressure field is generated by the presence of anisotropic drivers such as gravitational field, nearby rigid or free surface, stationary potential flow, liquid interfaces, or inertial boundaries [30].
To quantify the degree of anisotropy in the pressure field induced by a nearby rigid surface anisotropic driver we use the standoff defined as:
γ = d R 0 ,
where d is the distance between the centre of the cavity and the surface, see Figure 1.

3.3. Geometry

The 3D domain shown in Figure 1 is divided in three concentric regions, delimited by three different radii. In those regions the particles are distributed using a lattice, a set of point in space, determined by a face-centred cubic (fcc) unit cell with basis atoms, with characteristic size equal to 2.5 × 10 6 [m], that is replicated in all dimensions. In this model, two types of computational particles are used:
  • Cavity ( r < R 0 ): the particles in this region are removed to model an empty cavity with p b = 0 and ρ b = 0 . Modelling the cavity as a void region is a common procedure in computational [1,17,33,34] and theoretical [2,20] studies.
  • Liquid ( R 0 < r < R s ): the particles inside this region are modelled as water following the Tait EOS. The density is set as ρ = 1000 [Kg m 3 ] with an initial pressure P = 50 [MPa].
  • Shell ( R s < r < R c ): In this region the particles are modelled as described in the liquid region. However, the have fixed position and density to keep constant pressure as boundary condition. The lower part of this region also acts as anisotropy driver inducing an anisotropic pressure field during the collapse. Between the shell region and the liquid region a non compenetration condition is used.
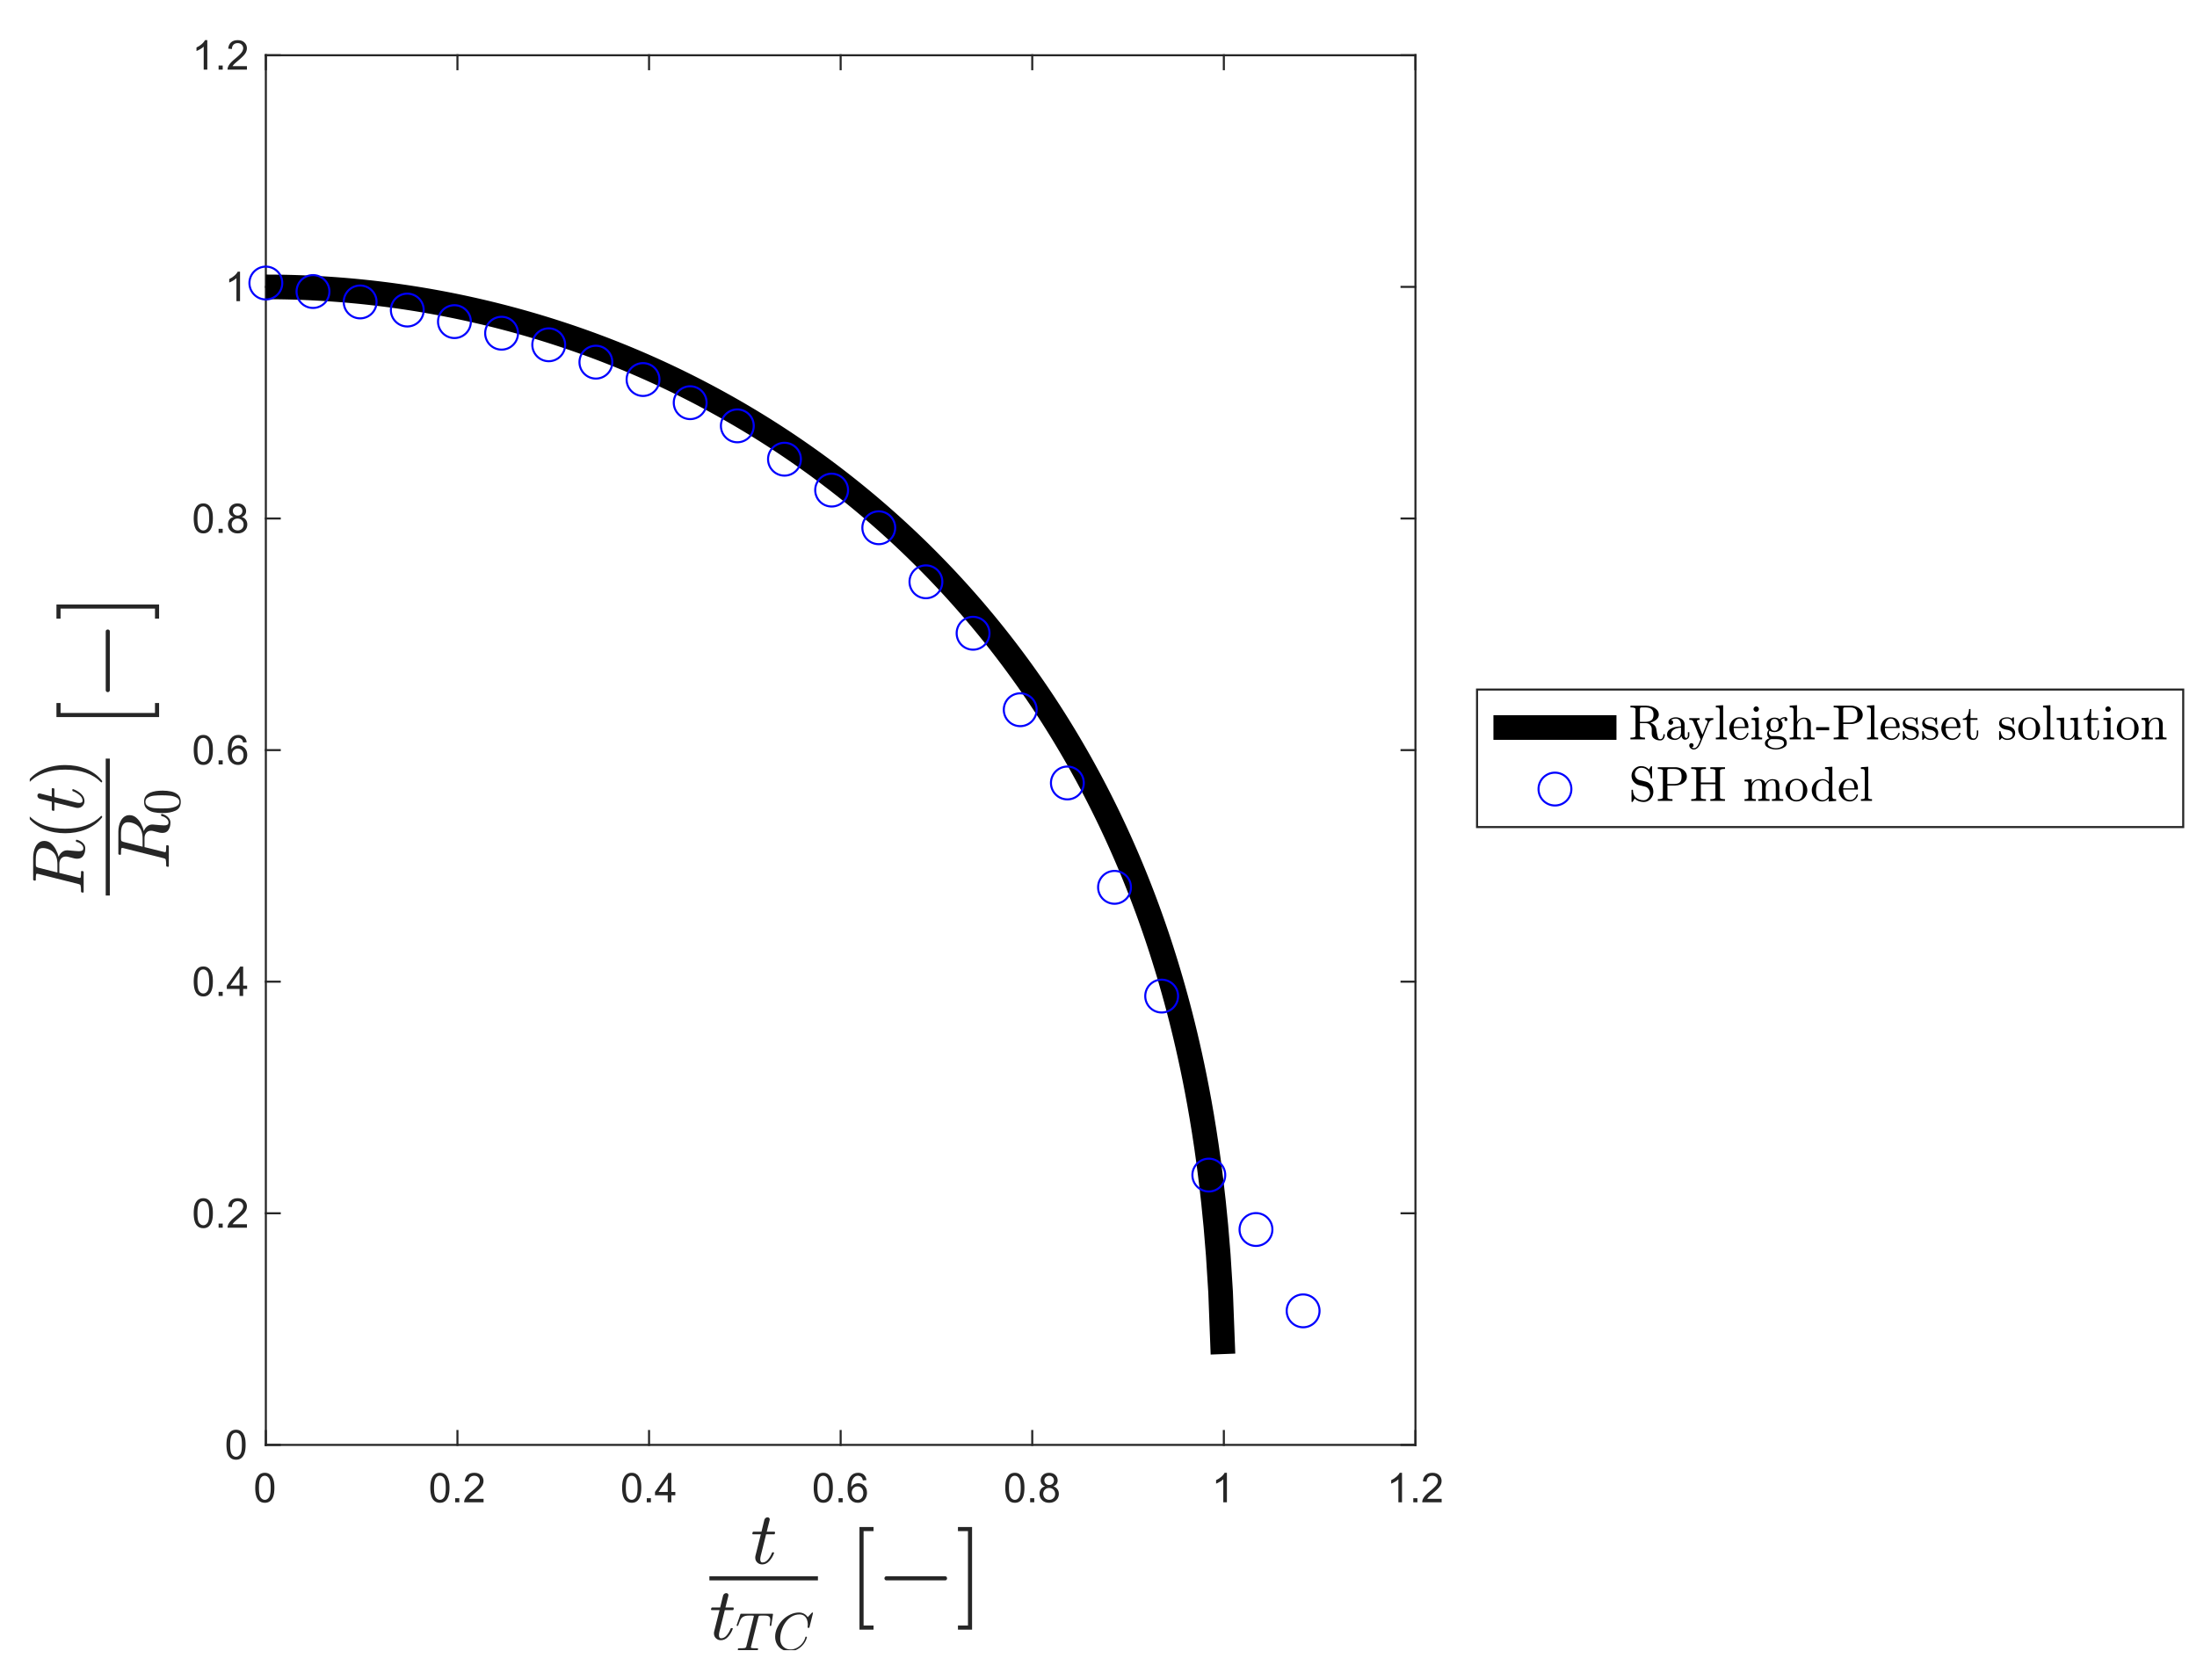
A green spot, with a radius of 0.01 mm, is highlighted in Figure 1; this spot will be used to monitor the pressure evolution during the collapse.
In this work, we focus on a single case of non-symmetrical Rayleigh collapse with γ = 0.6 to investigate the hydrodynamic evolution of the cavity during the collapse and the pressure developed on the surface. The reason for that is that the 3D simulations are considerably more computationally intensive than the 2D simulations. Therefore, a complete parametric study would be impractical. In a previous work [1], we carried out a parametric study in 2D. We identified the case of γ = 0.6 as particularly interesting because of its complex mechanics. Therefore, we focus the 3D simulations on this value of γ and compare the 2D and 3D results.

3.4. Validation

To validate the hydrodynamics of the model we compare evolution of the dimensionless radius, R ( t ) / R 0 , plotted against the dimensionless time, τ = t / t T C (where t T C is the Rayleigh collapse time for this configuration determined using Equation (11)), of our model to the solution of Equation (10) for a symmetrical collapse
For validation, we use the case of symmetric collapse, where the cavity is not near a solid surface ( γ ) because it has a theoretical solution (see Equation (10)). The model is in good agreement with the theoretical solution. There is a certain difference in the final phase of the collapse where the particles resolution is no enough to preserve the spherical symmetry (this issue is also been discussed in a previous work [34]). The final dimensionless time is τ = 1.08 .
During the validation, we choose the minimal resolution of d L / R 0 = 40, with d L initial spacing between particle, identified in previous works [32,33,34]. Although this resolution was identified for the 2D model, Figure 2 shows that it is also good for the 3D case. However, for the non-symmetrical collapse, a higher resolution is required, see Section 4, to see all the hydrodynamic features [1].

3.5. Software for Simulation, Visualisation and Post-Process

The simulations were run with the open source code simulator LAMMPS [54,55,56]. The visualisation and data post-processing were generated with the Open Source code OVITO [57].

4. Results

The Results shown in this section are obtained using the Lucy Kernel and smoothing length of h = 1.3 d L . The dimensionless dissipation factor is set as α = 1 as usually done for shock wave problems [1,34,37,44] while the time step t s = 1 × 10 10 has been chosen following the CFL criterion. The resolution, particle numbers, the collapse driving force, the initial radius and the magnitude of the anisotropic diver are respectively, d L / R 0 = 133 , N p = 20,292,752, P = 50 [MPa], R 0 = 100 μ m and γ = 0.6 .
Figure 3 shows the pressure history over the green region in Figure 1.
The pressure trend can be divided in three regions corresponding to different collapsing phase and hydrodynamics features of the cavity that are discussed in the next sections.

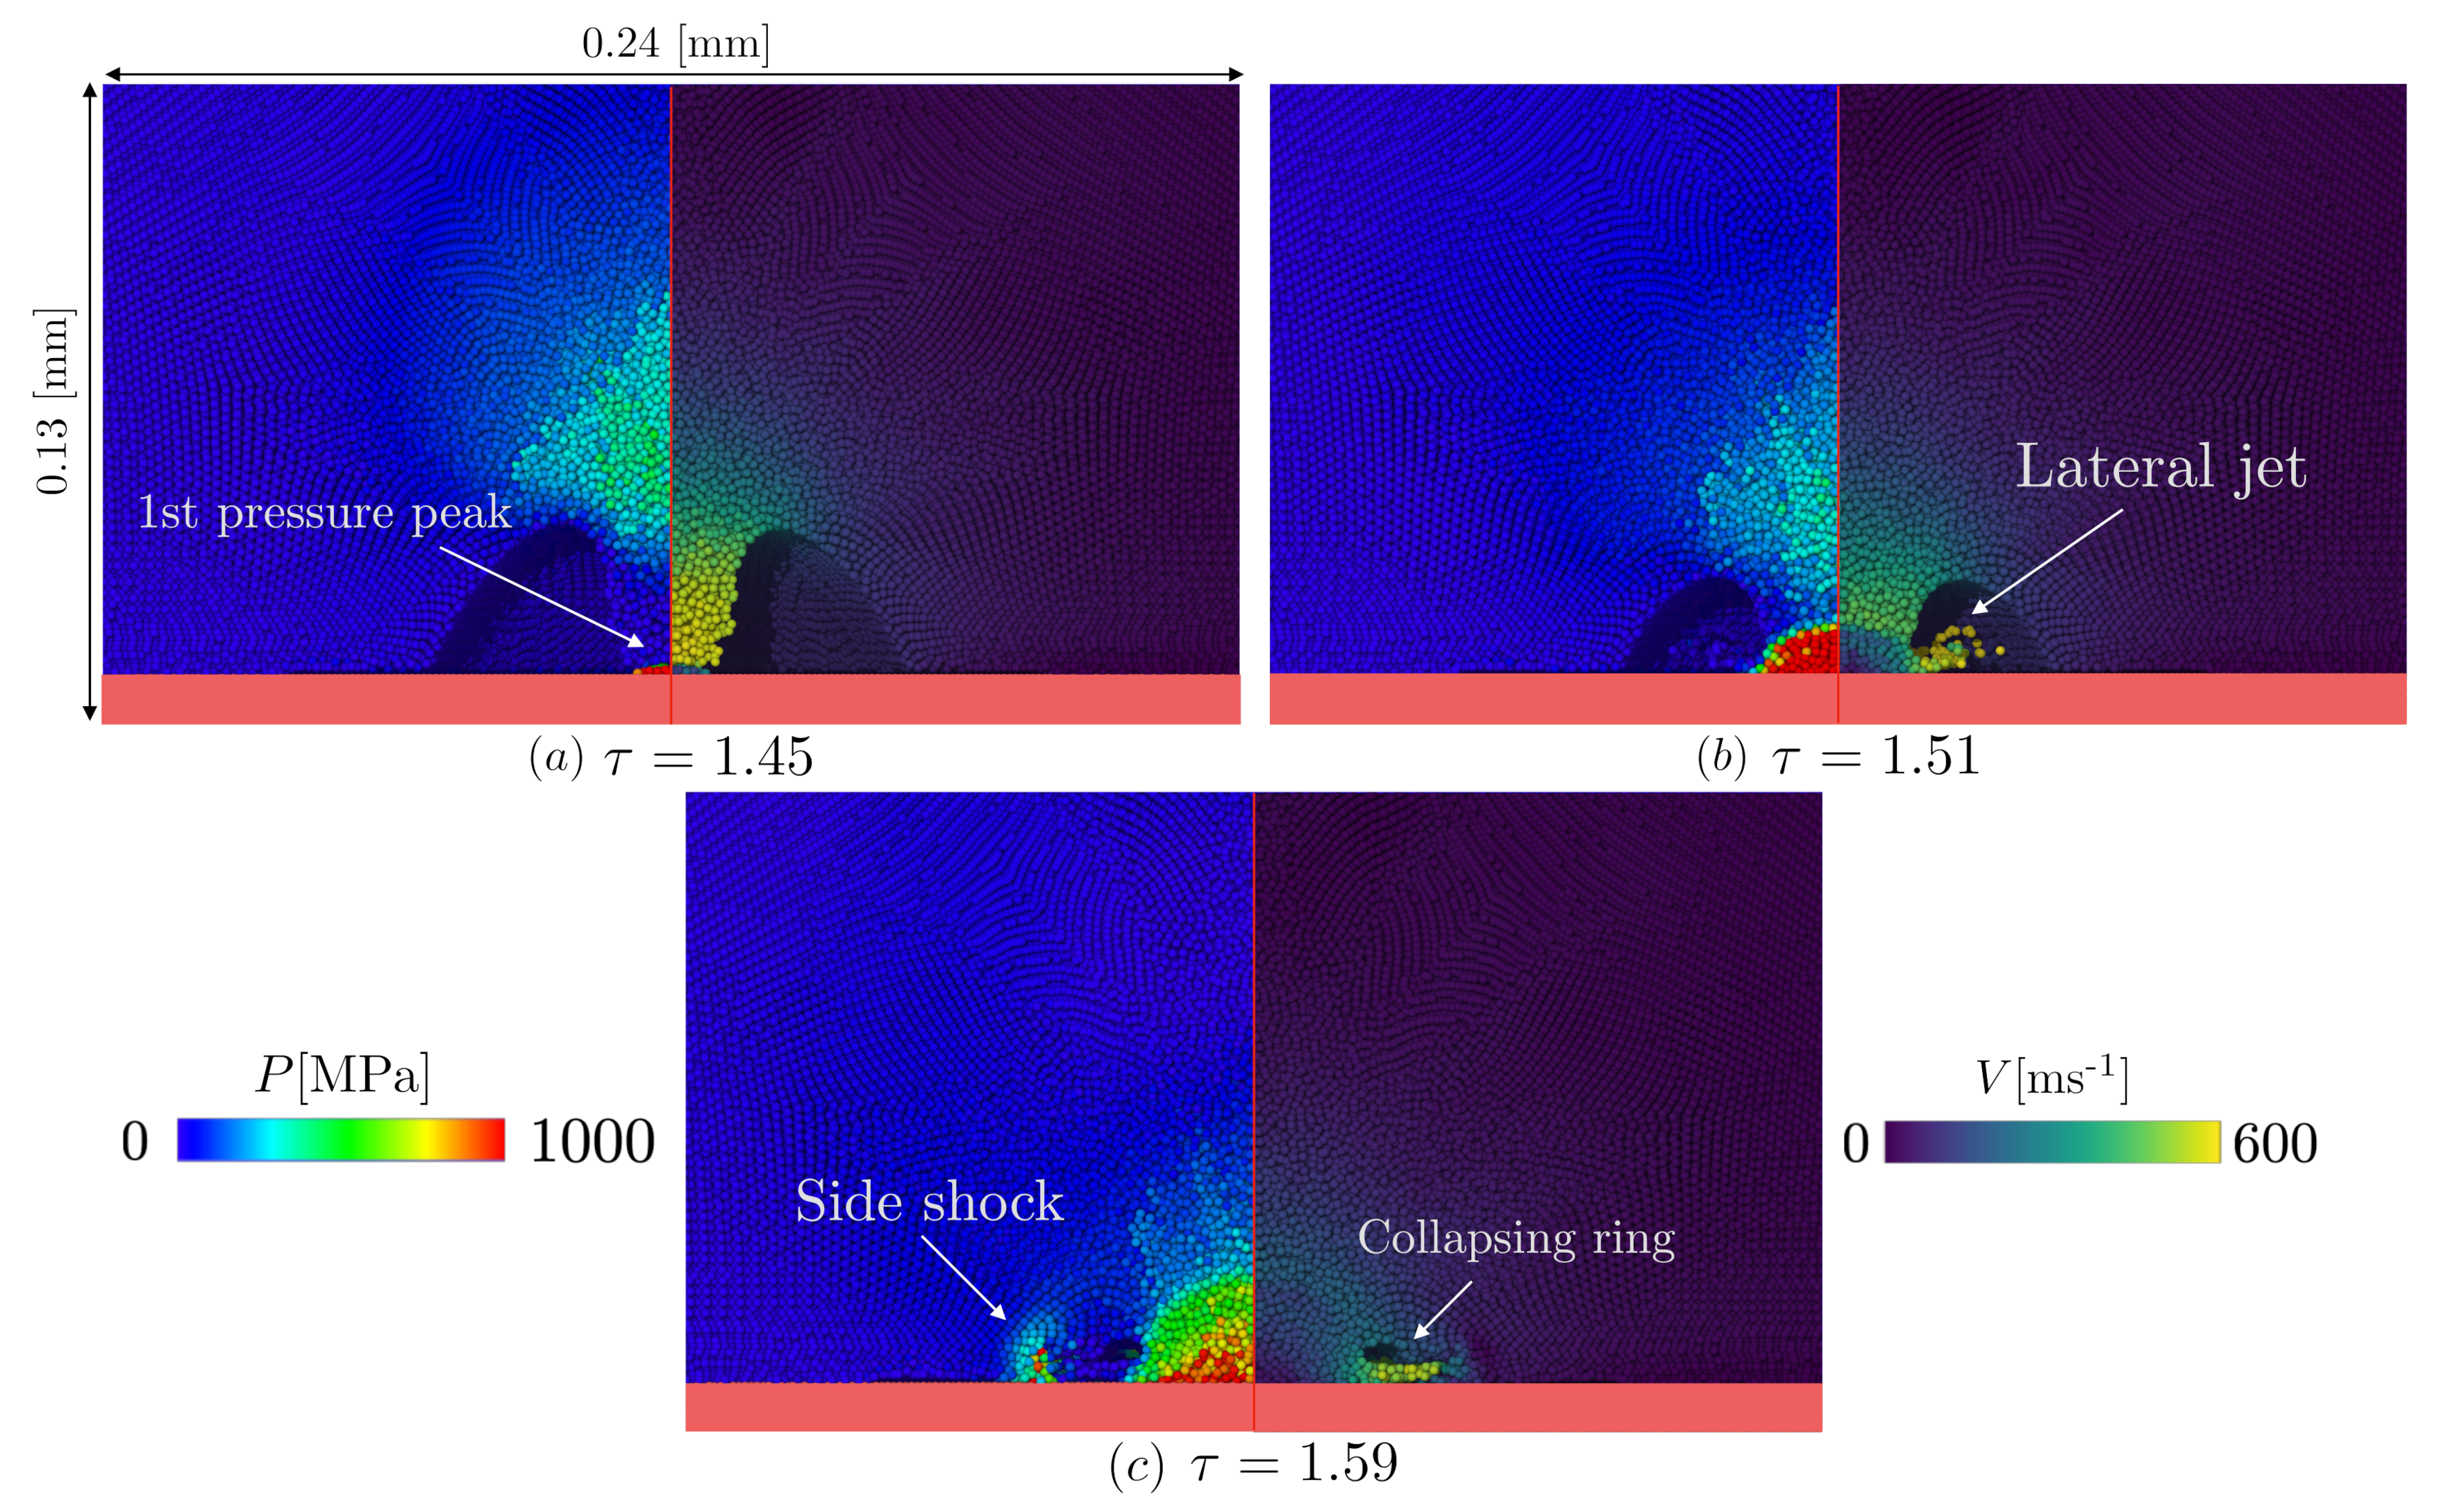
4.1. Region I: Jet Formation

With a stand off of γ = 0.6 , the collapse cannot be symmetric and an anisotropic pressure field is expected. Figure 4a shows a high-pressure area above the cavity.
As the time passes the pressure of this area raises and accelerate the liquid of the top of the cavity pushing it the direction of the solid surface. This generates the re-entrant jet (Figure 4b).
The jet, before the impact with the surface, has a high speed/ low-pressure profile as can be seen from Figure 4c.

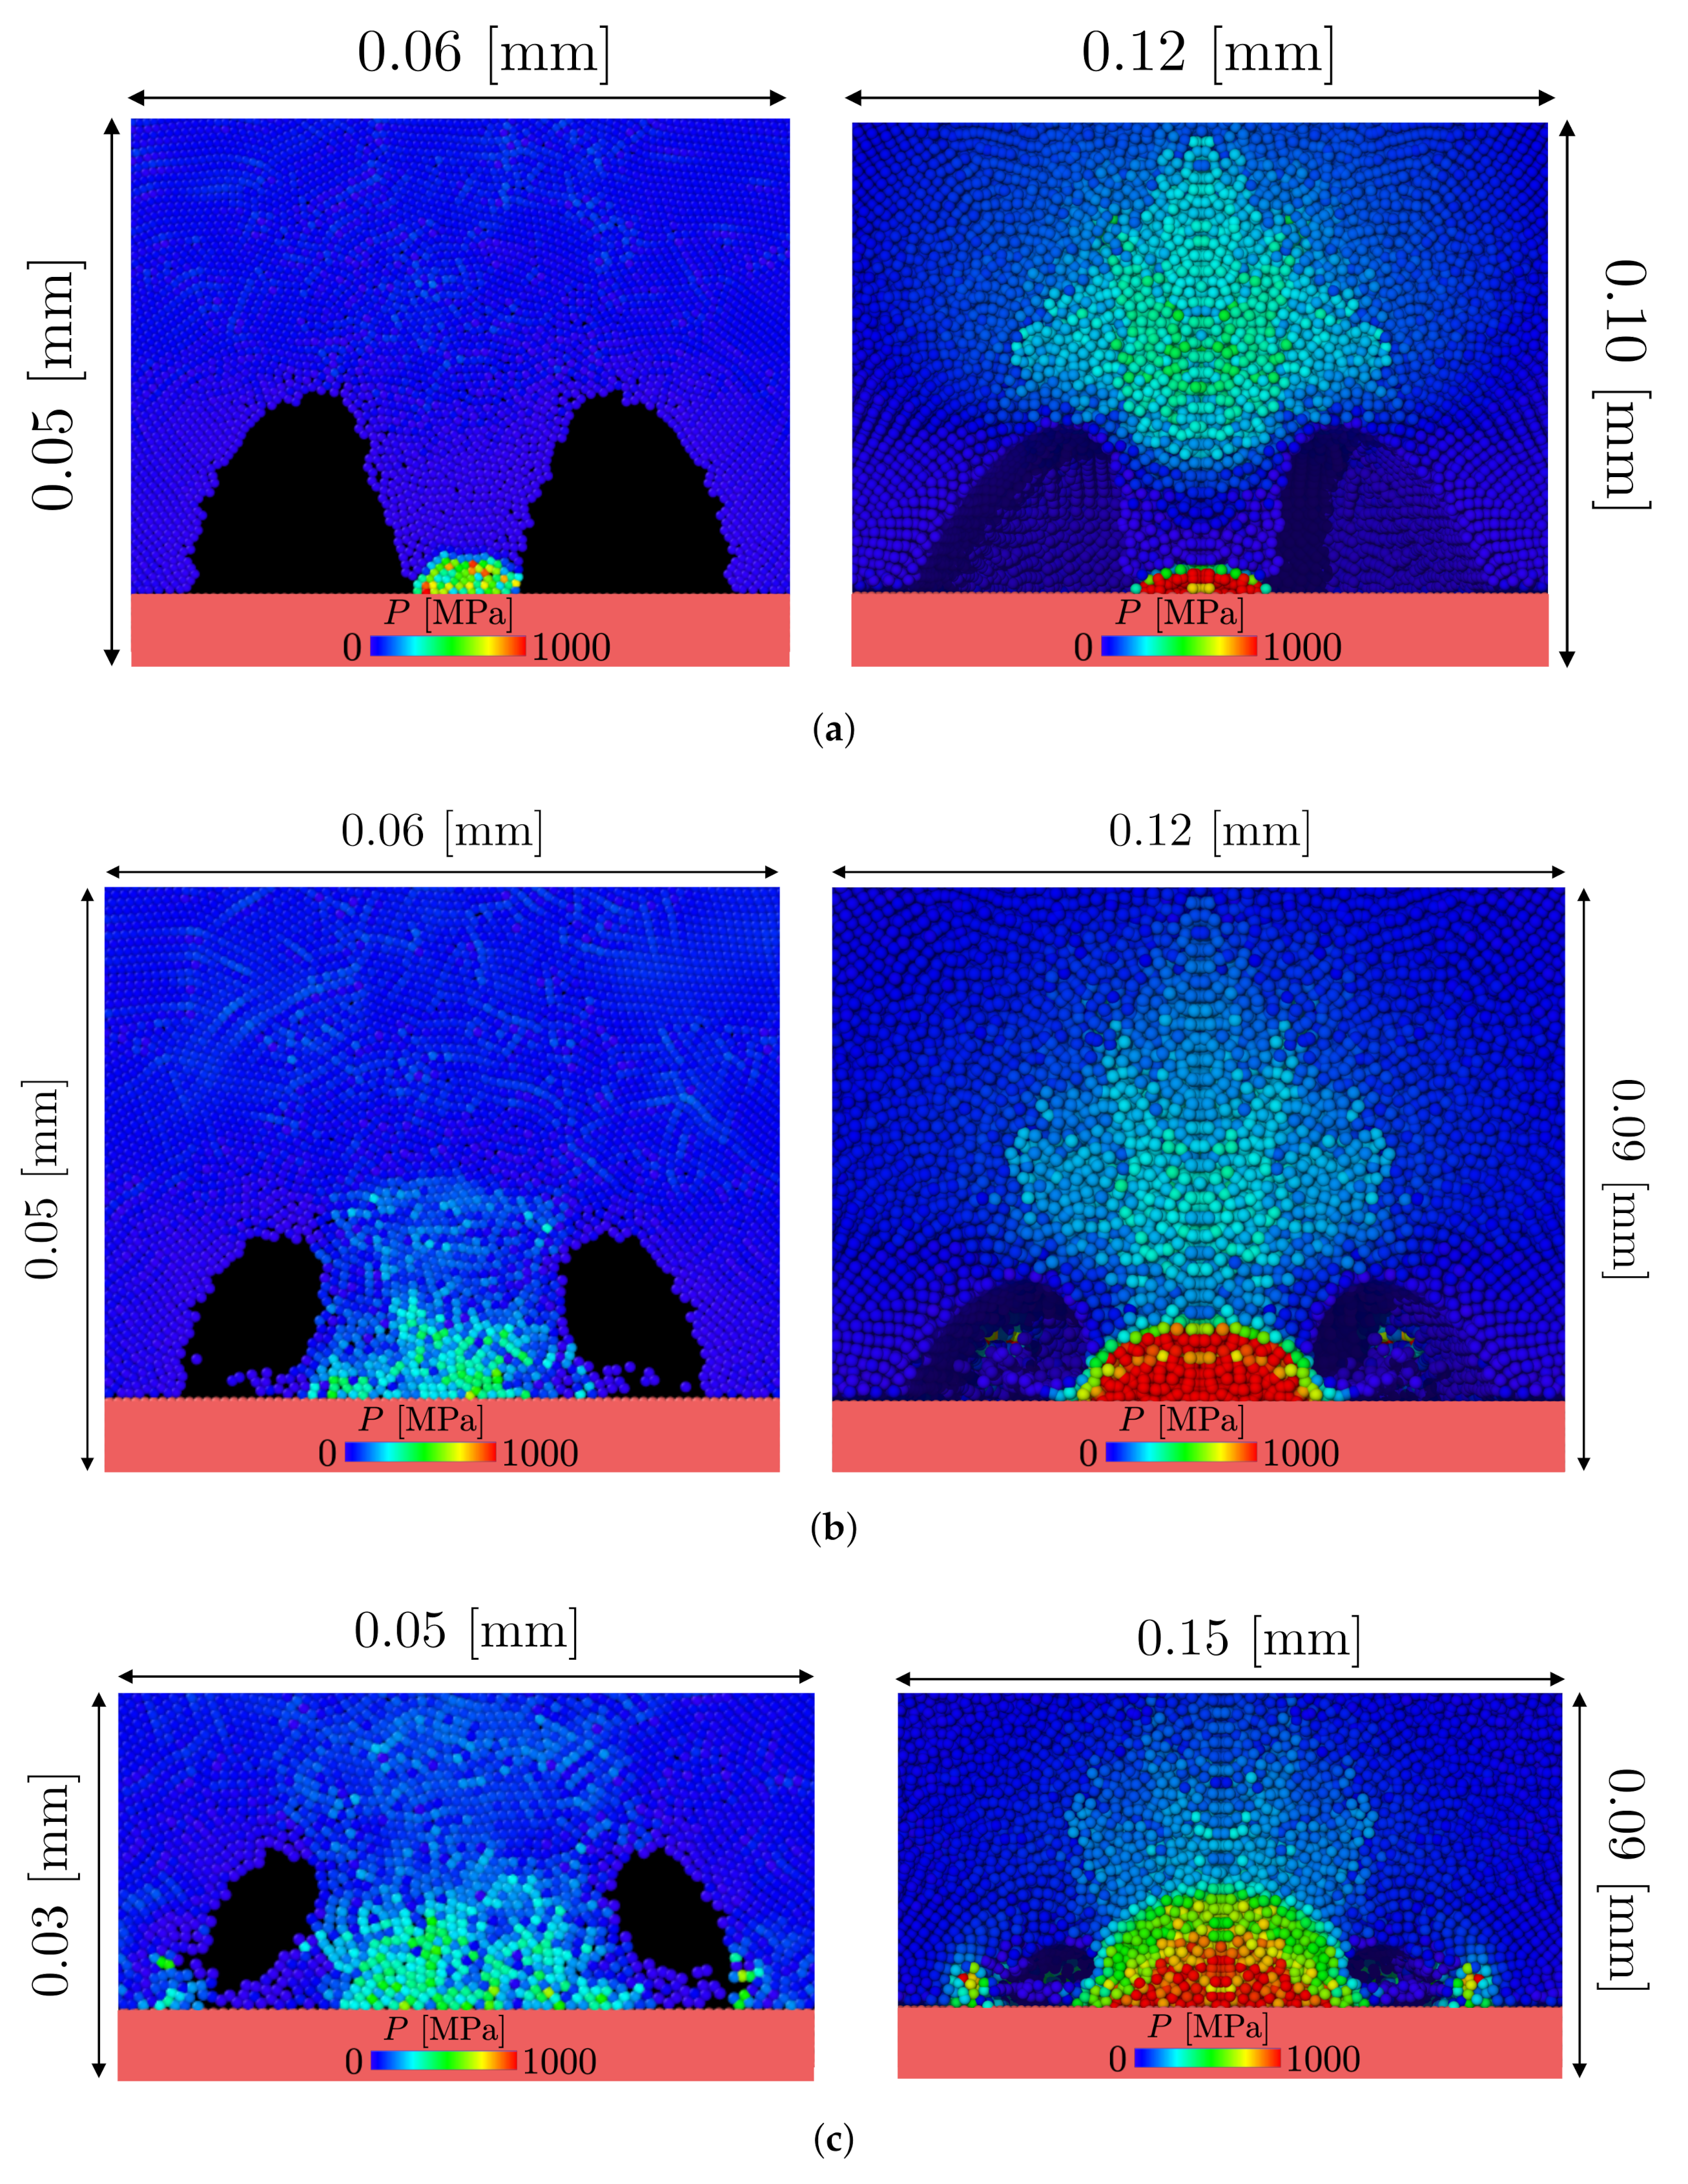
4.2. Region II: Jet Impact and Ring Formation

At the impact, Figure 5a, the pressure at the centre of the surface reaches a maximal peak of around 1500 MPa (see Figure 6a). Because of the impact the jet splits in circular lateral jet (see Figure 5b and Figure 6b) that will eventually hit the side of the collapsing cavity generating side shocks, see Figure 5c and Figure 6c. When the lateral jets impact with the cavity side the cavity assumes the shape of a ring.
The pressure field shown in Figure 6 have non-intuitive square symmetry. This symmetry is forced by the topology of the particle distribution. However, these “artefacts” are temporary and only appears when the fluid instantly interacts with the surface plane and the circular symmetry is restored during the ring expansion, see Figure 7.

4.3. Region III: Ring Expansions

After the ring formation the collapse proceeds and, as the ring reduces its volume, a high-pressure shock is generated in the inner section of the ring (see Figure 8a). This produces a maximal pressure wave with the shape of circle, Figure 7a, whose pressure is higher than the pressure the centre of the plate. This shock will move to the centre of the surface, Figure 7b and Figure 8b, generating the second pressure peak at the centre shown in Figure 3.
Around the ring there is a non-uniform pressure field, see Figure 8c, that prevents a final “inertial collapse” but rather induce a rotation and an expansion of the ring to dissipate the energy gained during the collapse.
The ring behaves as a vortex ring, which dissipates the energy gained during the collapse by spinning and expanding around its central axis. This behaviour can be seen in the Videos S1–S3 available in the supplementary materials, while a schematic representation of the ring is shown in Figure 9.
At the end of its motion the ring closes without generating shock waves, unlike noticed on the 2D model for the similar chase [1].

4.4. 3D and 2D Hydrodynamics Comparison

In this section we compare the hydrodynamics features and the pressures field between the 3D model and analogous 2D models [31,32,33] and, particularly, the 2D study made by Albano and Alexiadis [1]. We chose to compare 2D and 3D models using our previous (cartesian) 2D model [1] because we already have all the simulations available. Joshi et al. [33] carried out axisymmetric 2D simulations and the main features of the cartesian 2D and the axisymmetric 2D are the same. Our conclusions, therefore, can be generalised to both cartesian and axisymmetric 2D.
In Albano and Alexiadis [1] and here, we use exactly the same physical parameters for the simulation: driving pressure, initial radius, gamma, EOS, h, α and particle resolution. Figure 10 shows a side-by-side comparison of the last phase for a high-resolution collapse between the 2D model and the 3D model.
In all phases of the collapse, the 3D model shows a smother pressure field. This shows that the 2D parameters were good enough to simulate the phenomenon, but the model induces additional constrains to keep the particle in the plane affecting the smoothness of the pressure field.
Overall, the 3D and the 2D models are both able to capture similar hydrodynamics features: (1) formation of re-entrant jet (2) formation of lateral jets (3) ring formation (corresponding to circle formation in 2D) (4) generation of side pressure waves. However, unlike the 3D model, in the 2D the new-formed circle does not dissipate their energy as vortex rings, but they generate a third pair of shock waves during the final phase of the collapse. This implies that 2D simulations of Rayleigh collapse can be considered accurate up to the final phase of the collapse where they show a third pressure peak that, which does not occur in 3D simulations.
This hydrodynamic difference also reflects on the pressure trend over the nearby solid. As can be seen in Figure 3, the second pressure peak is lower than the first peak while for the 2D the second is higher than the first [1]. This can be explained as follow:
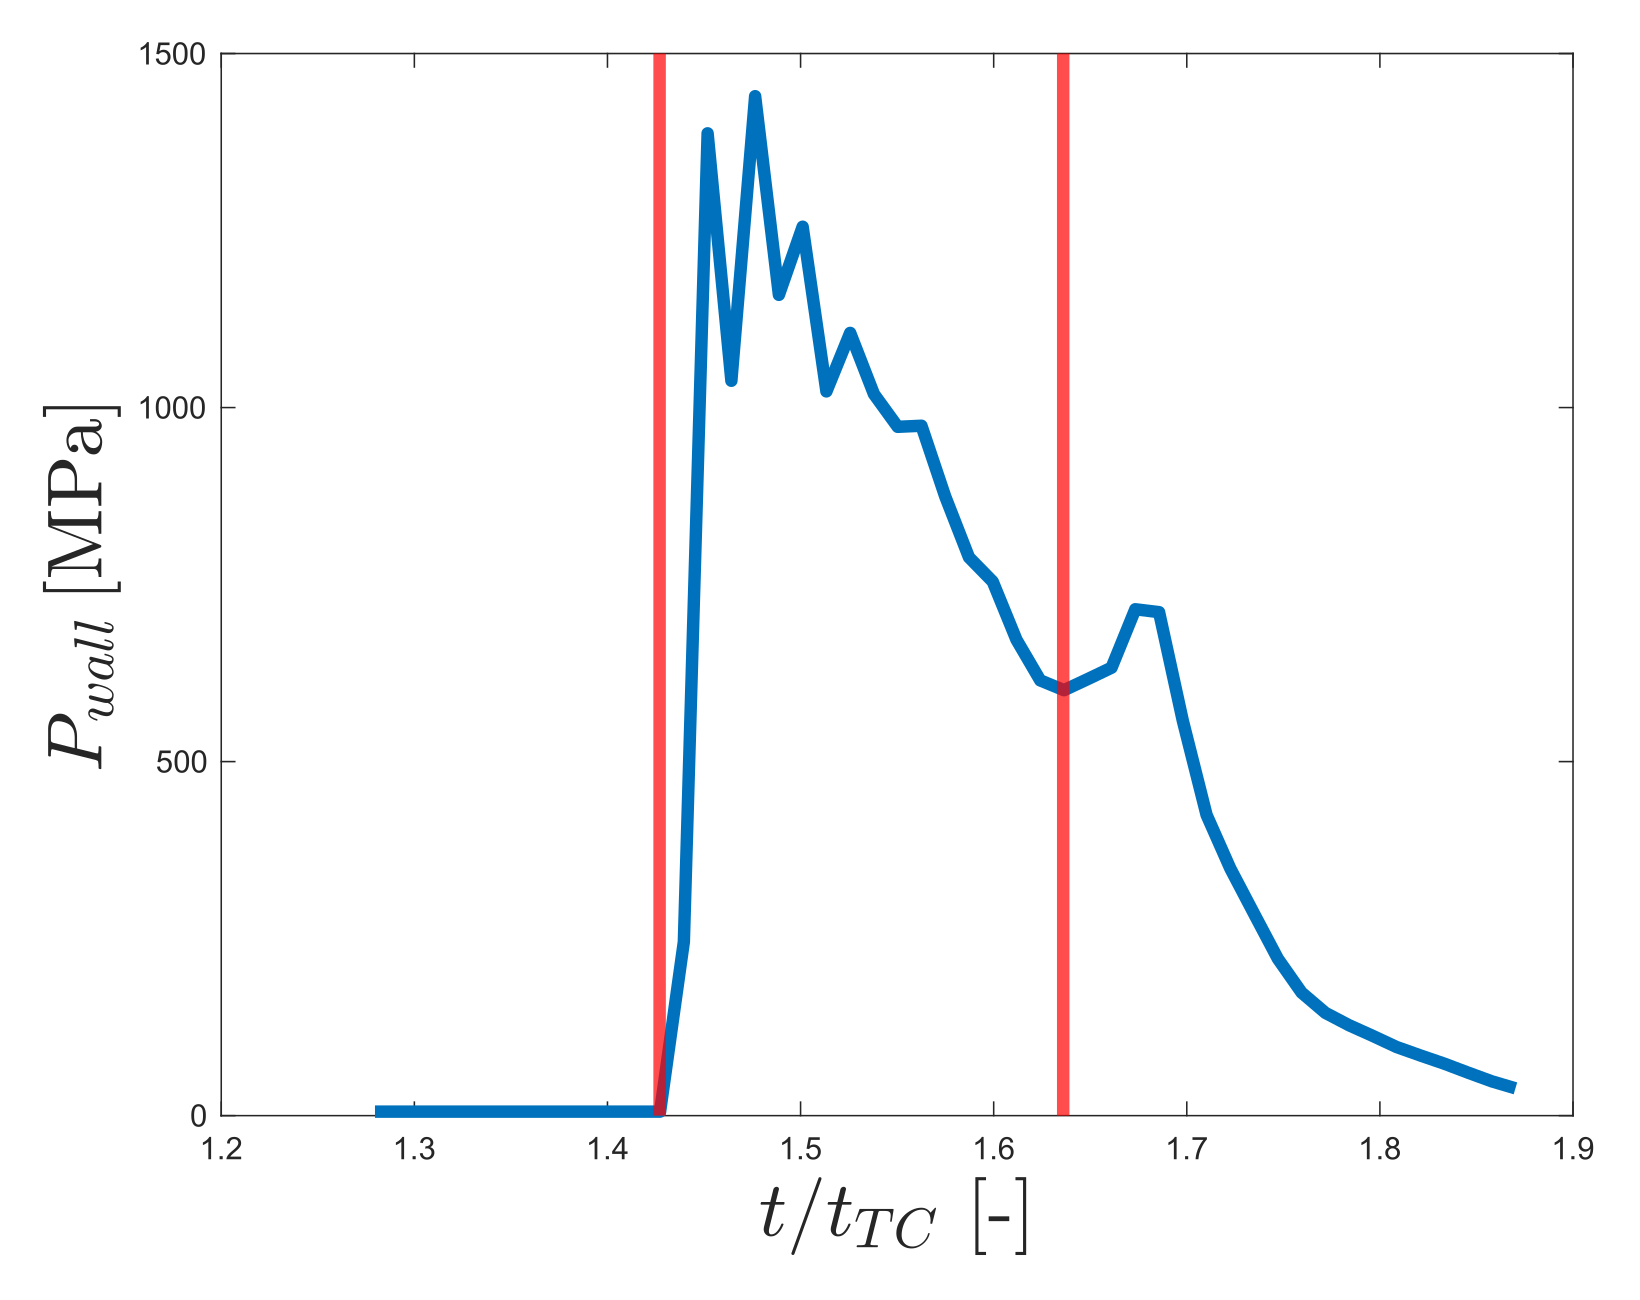
  • For the 3D: the energy gained by the fluid during the collapse, as a high speed jet, is partially used to generate a first maximal pressure peak shown in Figure 3 because of the water hammer impact between the jet and the surface. The residual energy is partially used to generate the second local maximal peak in region III and partially dissipate during the ring expansion.
  • For the 2D: as before, the energy gained by the fluid is partially used to generate a first local maximal peak with the water hammer impact. The residual energy, since the vortex dissipation is not present, is totally dissipated by the circle collapse generating a second maximal pressure peak [1].
Another advantages of the 3D model over 2D models is for studying the pressure field over the nearby surface: with the 2D the layer of particles representing the surface is composed only by a single line and this makes complicate to study the spatial distribution and some noise is expected [1,34]. However, the advantage of the 2D model over the 3D is the computational cost of the simulation. A simulation with a total time of t = 1 μ s with N p , 2 D = 9,575,802 particles took 4 h of runtime on a supercomputer using 200 computational cores. On the other hand the 3D simulation with a total time of t = 0.8 μ s with N p , 3 D = 20,292,752 particles took 27 h of runtime using 200 computational cores.

5. Conclusions

In this work we proposed the first 3D SPH model to simulate a Rayleigh collapse. The Hydrodynamics of the model is validated for the symmetrical collapse case using the Rayleigh-Plesset Equation.
The model is then used to simulate a non symmetrical collapse of an empty cavity where a solid surface is acting as an anisotropic driver with γ = 0.6 .
From the pressure trend over the surface is possible to identify three regions where the hydrodynamics of the collapsing cavity shows different features:
  • Region I: The anisotropic pressure field in the liquid by the driver generates a high-speed jet from the top of the cavity that will impact on the surface.
  • Region I I :The jet impacts with the solid surface generating the first pressure peak and splitting in lateral a lateral jet that, by impacting with the cavity sides, makes the cavity assume the shape of a ring.
  • Region I I I : The new formed ring reaches its minimal volume generating a shock wave an a second pressure peak and then the ring behaves as a vortex ring by dissipating its energy by rotating and expanding.
Finally, the model is compared with a similarly set up 2D model to investigate the difference between the two approaches: at cost of a great increase in computational cost, the 3D shows smoother pressure and velocity fields and also displays a different hydrodynamics behaviour in the last moment of the collapse with the formation of the vortex ring.
A natural evolution of the presented model is in the Discrete Multi-Physics framework [58]:
  • By substituting the SPH particle acting as a solid surface with Discrete Element Method or Peridynamic particles would be possible to study the erosion process of cavitation.
  • By filling the cavity with SPH particles, as done in previous work [31,32,34], following a gas EOS would be possible to study the temperature and pressure profile inside the cavity.
  • By enabling a multiphase energy exchange (gas-liquid, gas-solid and liquid-solid), as done in a previous work [34], would be possible to investigate the role of temperature in the hydrodynamic of the collapse and tin the erosion process within the same computational framework.

Supplementary Materials

The following are available online at https://www.mdpi.com/article/10.3390/chemengineering5030063/s1, Video S1: Non-symmetrical Rayleigh collapse ( γ = 0.6 ) with pressure field in the liquid phase, Video S2: Non-symmetrical Rayleigh collapse ( γ = 0.6 ) with velocity field in the liquid phase, Video S3: Pressure field over the surface generated during the Rayleigh non-symmetrical collapse ( γ = 0.6 ).

Author Contributions

A.A. (Andrea Albano) and A.A. (Alessio Alexiadis) conceptualise the work; A.A. (Andrea Albano) designed the work and performed the simulations; A.A. (Andrea Albano) and A.A. (Alessio Alexiadis) contributed in writing/reviewing and editing the paper. Both authors have read and agreed to the published version of the manuscript.

Funding

This work was supported by the US Office of Naval Research Global (ONRG) under 256 NICOP Grant N62909-17-1-2051.

Data Availability Statement

All relevant data are within the manuscript and its Supporting Information files.

Conflicts of Interest

The authors declare no conflict of interest.

References

  1. Albano, A.; Alexiadis, A. Non-Symmetrical Collapse of an Empty Cylindrical Cavity Studied with Smoothed Particle Hydrodynamics. Appl. Sci. 2021, 11, 3500. [Google Scholar] [CrossRef]
  2. Rayleigh, L. VIII. On the pressure developed in a liquid during the collapse of a spherical cavity. Lond. Edinb. Dublin Philos. Mag. J. Sci. 1917, 34, 94–98. [Google Scholar] [CrossRef]
  3. Plesset, M.S. The dynamics of cavitation bubbles. J. Appl. Mech. 1949, 16, 277–282. [Google Scholar] [CrossRef]
  4. Benjamin, T.B. Pressure waves from collapsing cavities. In Proceedings of the 2nd Symposium on Naval Hydrodynamics, Washington, DC, USA, 25–29 August 1958; pp. 207–229. [Google Scholar]
  5. Hickling, R.; Plesset, M.S. Collapse and rebound of a spherical bubble in water. Phys. Fluids 1964, 7, 7–14. [Google Scholar] [CrossRef] [Green Version]
  6. Knapp, R.; Daily, J.; Hammitt, F. Cavitation; McGraw-Hill: New York, NY, USA, 1970; Volume 39. [Google Scholar]
  7. Vogel, A.; Lauterborn, W.; Timm, R. Optical and acoustic investigations of the dynamics of laser-produced cavitation bubbles near a solid boundary. J. Fluid Mech. 1989, 206, 299–338. [Google Scholar] [CrossRef]
  8. Philipp, A.; Lauterborn, W. Cavitation erosion by single laser-produced bubbles. J. Fluid Mech. 1998, 361, 75–116. [Google Scholar] [CrossRef]
  9. Giannadakis, E.; Gavaises, M.; Arcoumanis, C. Modelling of cavitation in diesel injector nozzles. J. Fluid Mech. 2008, 616, 153–193. [Google Scholar] [CrossRef] [Green Version]
  10. Hsiao, C.T.; Jayaprakash, A.; Kapahi, A.; Choi, J.K.; Chahine, G.L. Modelling of material pitting from cavitation bubble collapse. J. Fluid Mech. 2014, 755, 142–175. [Google Scholar] [CrossRef] [Green Version]
  11. Sun, X.; Xuan, X.; Song, Y.; Jia, X.; Ji, L.; Zhao, S.; Yoon, J.Y.; Chen, S.; Liu, J.; Wang, G. Experimental and numerical studies on the cavitation in an advanced rotational hydrodynamic cavitation reactor for water treatment. Ultrason. Sonochem. 2021, 70, 105311. [Google Scholar] [CrossRef]
  12. Besant, W.H. A Treatise on Hydrostatics and Hydrodynamics; Deighton, Bell: London, UK, 1859. [Google Scholar]
  13. Kim, K.H.; Chahine, G.; Franc, J.P.; Karimi, A. Advanced Experimental and Numerical Techniques for Cavitation Erosion Prediction; Springer: Berlin/Heidelberg, Germany, 2014; Volume 106. [Google Scholar]
  14. Karimi, A.; Martin, J. Cavitation erosion of materials. Int. Met. Rev. 1986, 31, 1–26. [Google Scholar] [CrossRef]
  15. Brennen, C.E. Cavitation and Bubble Dynamics; Cambridge University Press: Cambridge, UK, 2014. [Google Scholar]
  16. Turangan, C.; Ball, G.; Jamaluddin, A.; Leighton, T. Numerical studies of cavitation erosion on an elastic–plastic material caused by shock-induced bubble collapse. Proc. R. Soc. A Math. Phys. Eng. Sci. 2017, 473, 20170315. [Google Scholar] [CrossRef]
  17. Plesset, M.S.; Prosperetti, A. Bubble dynamics and cavitation. Annu. Rev. Fluid Mech. 1977, 9, 145–185. [Google Scholar] [CrossRef]
  18. Keller, J.B.; Miksis, M. Bubble oscillations of large amplitude. J. Acoust. Soc. Am. 1980, 68, 628–633. [Google Scholar] [CrossRef] [Green Version]
  19. Tomita, Y.; Shima, A. Mechanisms of impulsive pressure generation and damage pit formation by bubble collapse. J. Fluid Mech. 1986, 169, 535–564. [Google Scholar] [CrossRef]
  20. Kudryashov, N.A.; Sinelshchikov, D.I. Analytical solutions of the Rayleigh equation for empty and gas-filled bubble. J. Phys. A Math. Theor. 2014, 47, 405202. [Google Scholar] [CrossRef] [Green Version]
  21. Kudryashov, N.A.; Sinelshchikov, D.I. Analytical solutions for problems of bubble dynamics. Phys. Lett. A 2015, 379, 798–802. [Google Scholar] [CrossRef] [Green Version]
  22. Naude, C.F.; Ellis, A.T. On the Mechanism of Cavitation Damage by Nonhemispherical Cavities Collapsing in Contact with a Solid Boundary. J. Basic Eng. 1961, 83, 648–656. [Google Scholar] [CrossRef]
  23. Kling, C.L.; Hammitt, F.G. A photographic Study of Spark-Induced Cavitation Bubble Collapse. J. Basic Eng. 1972, 94, 825–832. [Google Scholar] [CrossRef]
  24. Lauterborn, W.; Bolle, H. Experimental investigations of cavitation-bubble collapse in the neighbourhood of a solid boundary. J. Fluid Mech. 1975, 72, 391–399. [Google Scholar] [CrossRef]
  25. Flannigan, D.J.; Suslick, K.S. Inertially confined plasma in an imploding bubble. Nat. Phys. 2010, 6, 598–601. [Google Scholar] [CrossRef] [Green Version]
  26. Plesset, M.S.; Chapman, R.B. Collapse of an initially spherical vapour cavity in the neighbourhood of a solid boundary. J. Fluid Mech. 1971, 47, 283–290. [Google Scholar] [CrossRef] [Green Version]
  27. Blake, J.; Taib, B.; Doherty, G. Transient cavities near boundaries. Part 1. Rigid boundary. J. Fluid Mech. 1986, 170, 479–497. [Google Scholar] [CrossRef]
  28. Johnsen, E.; Colonius, T. Numerical simulations of non-spherical bubble collapse. J. Fluid Mech. 2009, 629, 231–262. [Google Scholar] [CrossRef] [Green Version]
  29. Beig, S.; Aboulhasanzadeh, B.; Johnsen, E. Temperatures produced by inertially collapsing bubbles near rigid surfaces. J. Fluid Mech. 2018, 852, 105–125. [Google Scholar] [CrossRef]
  30. Supponen, O.; Obreschkow, D.; Tinguely, M.; Kobel, P.; Dorsaz, N.; Farhat, M. Scaling laws for jets of single cavitation bubbles. J. Fluid Mech. 2016, 802, 263–293. [Google Scholar] [CrossRef] [Green Version]
  31. Nair, P.; Tomar, G. Simulations of gas-liquid compressible-incompressible systems using SPH. Comput. Fluids 2019, 179, 301–308. [Google Scholar] [CrossRef]
  32. Pineda, S.; Marongiu, J.C.; Aubert, S.; Lance, M. Simulation of a gas bubble compression in water near a wall using the SPH-ALE method. Comput. Fluids 2019, 179, 459–475. [Google Scholar] [CrossRef]
  33. Joshi, S.; Franc, J.P.; Ghigliotti, G.; Fivel, M. SPH modelling of a cavitation bubble collapse near an elasto-visco-plastic material. J. Mech. Phys. Solids 2019, 125, 420–439. [Google Scholar] [CrossRef] [Green Version]
  34. Albano, A.; Alexiadis, A. A smoothed particle hydrodynamics study of the collapse for a cylindrical cavity. PLoS ONE 2020, 15, e0239830. [Google Scholar]
  35. Liu, G.R.; Liu, M.B. Smoothed Particle Hydrodynamics: A Meshfree Particle Method; World Scientific: Singapore, 2003. [Google Scholar]
  36. Liu, M.; Liu, G.; Lam, K. Investigations into water mitigation using a meshless particle method. Shock Waves 2002, 12, 181–195. [Google Scholar] [CrossRef]
  37. Albano, A.; Alexiadis, A. Interaction of Shock Waves with Discrete Gas Inhomogeneities: A Smoothed Particle Hydrodynamics Approach. Appl. Sci. 2019, 9, 5435. [Google Scholar] [CrossRef] [Green Version]
  38. Swegle, J.; Attaway, S. On the feasibility of using smoothed particle hydrodynamics for underwater explosion calculations. Comput. Mech. 1995, 17, 151–168. [Google Scholar] [CrossRef]
  39. Liu, M.; Liu, G.; Lam, K.; Zong, Z. Smoothed particle hydrodynamics for numerical simulation of underwater explosion. Comput. Mech. 2003, 30, 106–118. [Google Scholar] [CrossRef]
  40. Johnson, G.R.; Stryk, R.A.; Beissel, S.R. SPH for high velocity impact computations. Comput. Methods Appl. Mech. Eng. 1996, 139, 347–373. [Google Scholar] [CrossRef]
  41. Lucy, L.B. A numerical approach to the testing of the fission hypothesis. Astron. J. 1977, 82, 1013–1024. [Google Scholar] [CrossRef]
  42. Gingold, R.A.; Monaghan, J.J. Smoothed particle hydrodynamics: Theory and application to non-spherical stars. Mon. Not. R. Astron. Soc. 1977, 181, 375–389. [Google Scholar] [CrossRef]
  43. Monaghan, J.; Gingold, R.A. Shock simulation by the particle method SPH. J. Comput. Phys. 1983, 52, 374–389. [Google Scholar] [CrossRef]
  44. Morris, J.; Monaghan, J. A switch to reduce SPH viscosity. J. Comput. Phys. 1997, 136, 41–50. [Google Scholar] [CrossRef]
  45. Monaghan, J. SPH and Riemann solvers. J. Comput. Phys. 1997, 136, 298–307. [Google Scholar] [CrossRef]
  46. Sirotkin, F.V.; Yoh, J.J. A Smoothed Particle Hydrodynamics method with approximate Riemann solvers for simulation of strong explosions. Comput. Fluids 2013, 88, 418–429. [Google Scholar] [CrossRef]
  47. Shao, S.; Lo, E.Y. Incompressible SPH method for simulating Newtonian and non-Newtonian flows with a free surface. Adv. Water Resour. 2003, 26, 787–800. [Google Scholar] [CrossRef]
  48. Hosseini, S.; Manzari, M.; Hannani, S. A fully explicit three-step SPH algorithm for simulation of non-Newtonian fluid flow. Int. J. Numer. Methods Heat Fluid Flow 2007, 17, 715–735. [Google Scholar] [CrossRef]
  49. Shadloo, M.S.; Oger, G.; Le Touzé, D. Smoothed particle hydrodynamics method for fluid flows, towards industrial applications: Motivations, current state, and challenges. Comput. Fluids 2016, 136, 11–34. [Google Scholar] [CrossRef]
  50. Rahmat, A.; Yildiz, M. A multiphase ISPH method for simulation of droplet coalescence and electro-coalescence. Int. J. Multiph. Flow 2018, 105, 32–44. [Google Scholar] [CrossRef]
  51. Hopp-Hirschler, M.; Shadloo, M.S.; Nieken, U. A smoothed particle hydrodynamics approach for thermo-capillary flows. Comput. Fluids 2018, 176, 1–19. [Google Scholar] [CrossRef]
  52. Nasiri, H.; Jamalabadi, M.Y.A.; Sadeghi, R.; Safaei, M.R.; Nguyen, T.K.; Shadloo, M.S. A smoothed particle hydrodynamics approach for numerical simulation of nano-fluid flows. J. Therm. Anal. Calorim. 2019, 135, 1733–1741. [Google Scholar] [CrossRef]
  53. Ng, K.; Ng, Y.; Sheu, T.; Alexiadis, A. Assessment of Smoothed Particle Hydrodynamics (SPH) models for predicting wall heat transfer rate at complex boundary. Eng. Anal. Bound. Elem. 2020, 111, 195–205. [Google Scholar] [CrossRef]
  54. Plimpton, S. Fast Parallel Algorithms for Short-Range Molecular Dynamics; Technical Report; Sandia National Labs.: Albuquerque, NM, USA, 1993. [Google Scholar]
  55. Ganzenmüller, G.C.; Steinhauser, M.O.; Van Liedekerke, P.; Leuven, K.U. The implementation of Smooth Particle Hydrodynamics in LAMMPS. Paul Van Liedekerke Kathol. Univ. Leuven 2011, 1, 1–26. [Google Scholar]
  56. Albano, A.; Le Guillou, E.; Danzé, A.; Moulitsas, I.; Sahputra, I.H.; Rahmat, A.; Duque-Daza, C.A.; Shang, X.; Ng, K.C.; Ariane, M.; et al. How to modify LAMMPS: From the prospective of a Particle method researcher. ChemEngineering 2021, 5, 30. [Google Scholar] [CrossRef]
  57. Stukowski, A. Visualization and analysis of atomistic simulation data with OVITO–the Open Visualization Tool. Model. Simul. Mater. Sci. Eng. 2009, 18, 015012. [Google Scholar] [CrossRef]
  58. Alexiadis, A. The discrete multi-hybrid system for the simulation of solid-liquid flows. PLoS ONE 2015, 10, e0124678. [Google Scholar] [CrossRef] [PubMed] [Green Version]
Figure 1. Section of the simulation box obtained with a slicing plan perpendicular to the y-axis and the collapsing cavity at t = 0 . The radii dimensions are: R 0 = 1 × 10 4 [m], R S = 3 × 10 3 [m], and R C = 3.1 × 10 3 [m] .
Chemengineering 05 00063 g001
Figure 2. Dimensionless ratio ( R / R 0 ) against dimensionless time ( t / t c ) for both SPH (blue circle dot) and the numerical solution of the Rayleigh-Plesset equation (continuum black curve) for the empty cavity collapse ( P = 50 [MPa], ρ L =1000 [Kg m 3 ] , P b = 0, ρ b = 0 ).
Chemengineering 05 00063 g002
Figure 3. Pressure trend over the green region of Figure 1 for a non-symmetrical wall attached collapse ( d L / R 0 =133, γ = 0.6 & P = 50 [MPa]). The profile is divided in three regions: (I) Jet formation, ( I I ) Jet impact and ring formation, ( I I I ) Ring expansion.
Chemengineering 05 00063 g003
Figure 4. Pressure and velocity field in the domain represented in Figure 1 for different collapse snapshots in Region I ( d L / R 0 = 133, γ = 0.6 & P = 50 [MPa]): (a) Anisotropic pressure field formation in the liquid phase (b) Generation of the jet towards the surface. (c) High-speed/Low pressure profile of the fully-developed jet.
Chemengineering 05 00063 g004
Figure 5. Pressure and velocity field in the domain represented in Figure 1 for different collapse snapshots in Region II ( d L / R 0 = 133, γ = 0.6 & P = 50 [MPa]): (a) The jet impacts with the surface generating a water hammer impact. (b) The impact splits the jet in a high-speed/low pressure circular lateral jet. (c) The lateral jet impacts with the cavity side generating side shocks in the liquid phase.
Chemengineering 05 00063 g005
Figure 6. Pressure field over the surface for different collapse snapshots in Region II ( d L / R 0 = 133, γ = 0.6 & P = 50 [MPa]): (a) Pressure field of the surface during the water hammer impact between the surface and the jet. (b) Pressure field of the surface during the jet split. (c) Pressure field of the surface at the impact between the lateral jet and the cavity side.
Chemengineering 05 00063 g006
Figure 7. Pressure field over the surface for different collapse snapshots in Region III ( d L / R 0 = 133, γ = 0.6 & P = 50 [MPa]): (a) Pressure field on the surface at the inner shock generation. (b) Pressure field of the surface at the second pressure peak. (c) Pressure field of the surface during the ring expansion.
Chemengineering 05 00063 g007
Figure 8. Pressure and velocity field in the domain represented in Figure 1 for different collapse snapshots in Region III ( d L / R 0 = 133, γ = 0.6 & P = 50 [MPa]): (a) Inner high pressure shock generation. (b) Second pressure peak generated by the travelling inner shock. (c) Collapsing ring expansion.
Chemengineering 05 00063 g008
Figure 9. Schematic representation collapsing vortex ring: blue surface represents the collapsing ring, black arrows represent the liquid flow.
Chemengineering 05 00063 g009
Figure 10. Pressure field for 2D [1] (left side) and 3D (right side) SPH model for a non symmetrical Rayleigh collapse ( d L / R 0 = 133, γ = 0.6 & P = 50 MPa): (a) Water hammer impact of the jet with the surface. (b) Lateral jet formation. (c) Lateral jet impact with the cavity sides and side shock formation. (d) Inner high pressure shock generation. (e) Second pressure peak generated by the travelling inner shock.
Chemengineering 05 00063 g010aChemengineering 05 00063 g010b
Publisher’s Note: MDPI stays neutral with regard to jurisdictional claims in published maps and institutional affiliations.

