Article

Simulation-Based Defect Engineering in “α-Spodumene”

by
Sivanujan Suthaharan
1,
Poobalasuntharam Iyngaran
1 and
Navaratnarajah Kuganathan
2,*
1
Department of Chemistry, University of Jaffna, Sir. Pon Ramanathan Road, Thirunelvely, Jaffna 40000, Sri Lanka
2
Department of Materials, Imperial College London, London SW7 2AZ, UK
*
Author to whom correspondence should be addressed.
ChemEngineering 2021, 5(3), 57; https://doi.org/10.3390/chemengineering5030057
Submission received: 19 July 2021 / Revised: 27 August 2021 / Accepted: 28 August 2021 / Published: 31 August 2021
(This article belongs to the Special Issue Chemical Engineering and Multidisciplinary)

Abstract

:
Naturally occurring lithium-rich α-spodumene (α-LiAlSi2O6) is a technologically important mineral that has attracted considerable attention in ceramics, polymer industries, and rechargeable lithium ion batteries (LIBs). The defect chemistry and dopant properties of this material are studied using a well-established atomistic simulation technique based on classical pair-potentials. The most favorable intrinsic defect process is the Al-Si anti-site defect cluster (1.08 eV/defect). The second most favorable defect process is the Li-Al anti-site defect cluster (1.17 eV/defect). The Li-Frenkel is higher in energy by 0.33 eV than the Al-Si anti-site defect cluster. This process would ensure the formation of Li vacancies required for the Li diffusion via the vacancy-assisted mechanism. The Li-ion diffusion in this material is slow, with an activation energy of 2.62 eV. The most promising isovalent dopants on the Li, Al, and Si sites are found to be Na, Ga, and Ge, respectively. The formation of both Li interstitials and oxygen vacancies can be facilitated by doping of Ga on the Si site. The incorporation of lithium is studied using density functional theory simulations and the electronic structures of resultant complexes are discussed.

Graphical Abstract

1. Introduction

Escalating demand for mineral candidates, especially in industries of lithium ion batteries (LIBs), has fueled the transformational shift in mobile-electronics. In particular, lithium-rich minerals have drawn the attention of investigators to analyze their potential candidacy [1]. Lithium-rich minerals are significant in modern industries of LIBs, alloys, and pharmacy [2,3,4]. Spodumene is a lithium aluminosilicate system, which is categorized as a granitic-pegmatite in geo-mineralogy [5,6,7]. The theoretical Li content in the spodumene is reported to be 3.73% [8], where it offers a theoretical Li2O content of 8 wt % [9]. Mineralogists describe that the spodumene has some associations with quartz and albite [10] and as a three-phase system [11,12]. α, β, and γ are the three major phases of spodumene, where α-spodumene (LiAlSi2O6) is the mined natural material [1]. In addition, α-spodumene has great potential to serve as a main lithium resource for lithium industries in comparison with the other two phases [13].
Previous computational investigations have shown the significance of atomistic scale computation to reveal the defect energetic features of the minerals for energy applications [14,15,16,17]. Spodumene has been experimentally studied in previous cases for its phase transformation mechanisms [18] and to clarify the density of defects in natural α-spodumene [19]. Systematic computational studies have not been carried out previously and this investigation presents the first atomistic modelling defect energetic study of α-spodumene. Understanding the fundamental defect processes in α-LiAlSi2O6 can be useful to optimize its performance in a wide industrial portrait. We have attempted to elucidate the energetics of the optimized theoretical model of α-spodumene and its intrinsic defect processes employing atomistic simulations based on classical pair-potentials. Density functional theory (DFT) simulations were performed to examine the stability of Li-incorporated α-spodumene and the electronic structures of the resultant complexes.

2. Computational Methods

Defect calculations were performed using a classical pair-wise potential simulation code GULP (general utility lattice program) in which lattice energy optimization procedures are concretized [20]. A summary of the aspects of these techniques will be presented as comprehensive reviews are given elsewhere [21]. Perfect and defective lattices are simulated on the basis of potential system attributed to the energy as attested by the atomic position coordinates within the crystal lattice. Inter-ionic interactions are described in terms of long-range Coulombic interactions and short-range Buckingham potential parameters (refer to Table 1) [22,23,24,25]. Ionic polarization is treated using the core–shell model where the instances with large spring values are approached with core alone treatment as the shell has no charge. The Mott-Littleton approach [26] was utilized to calculate defect formation energies in the lattice environment, in which the lattice is portioned as region I and region II. It is foreseen that the calculated defect process energies will be overvalued owing to the spherical treatment of ions at dilution limits. Although such an overestimation prevails in the present methodology, trends in relative energies will be congruous [27]. The contemporary atomistic scale simulations correspond to isobaric (i.e., constant pressure condition) parameters for the processes [28,29].
DFT simulation as implemented in the Vienna ab initio simulation program (VASP) code [30] was used to model the incorporation of Li. In this code, projected augmented wave (PAW) potentials [31] and plane wave basis sets are used. A plane wave basis set with a cut-off of 500 eV was used in all calculations. For bulk α-LiAlSi2O6, we used 4 × 4 × 8 Monkhorst-Pack [32] k-points. A 2 × 2 × 2 super cell containing 320 atoms was used to model Li incorporation. For this supercell, 2 × 2 × 4 Monkhorst-Pack k-points were used. The generalized gradient approximation (GGA) as parameterized by Perdew, Burke, and Ernzerhof (PBE) [33] was used to model exchange correlation. Full geometry optimizations were performed to relax both atomic positions and cell parameters using the conjugate gradient algorithm [34]. We used zero damping DFT+D3 as parameterized by Grimme et al. [35] to model short-range dispersive interactions.

3. Results

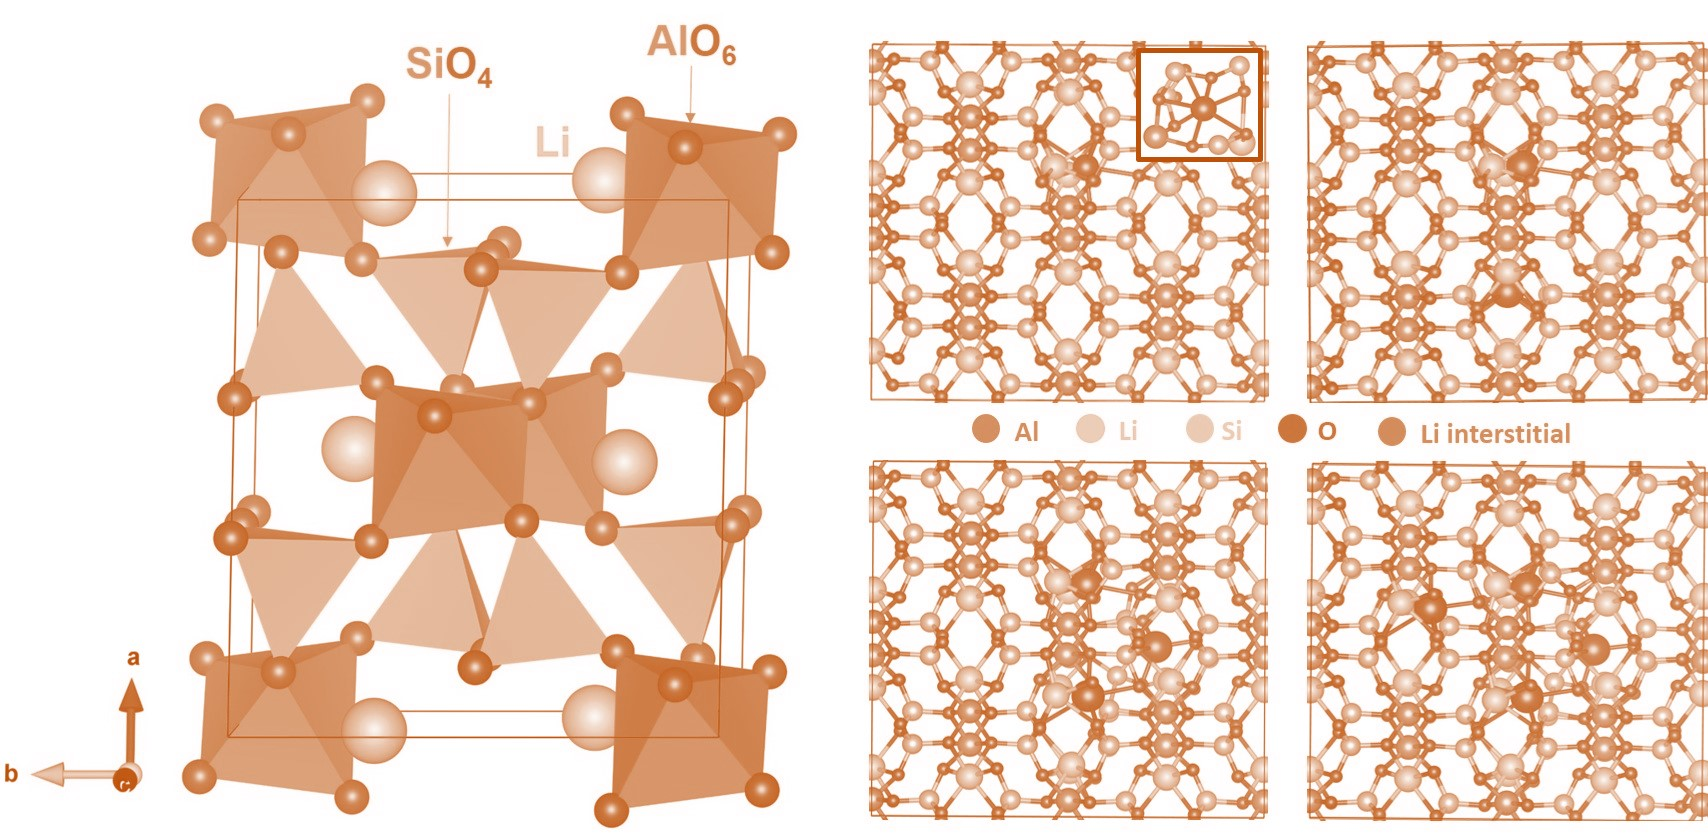
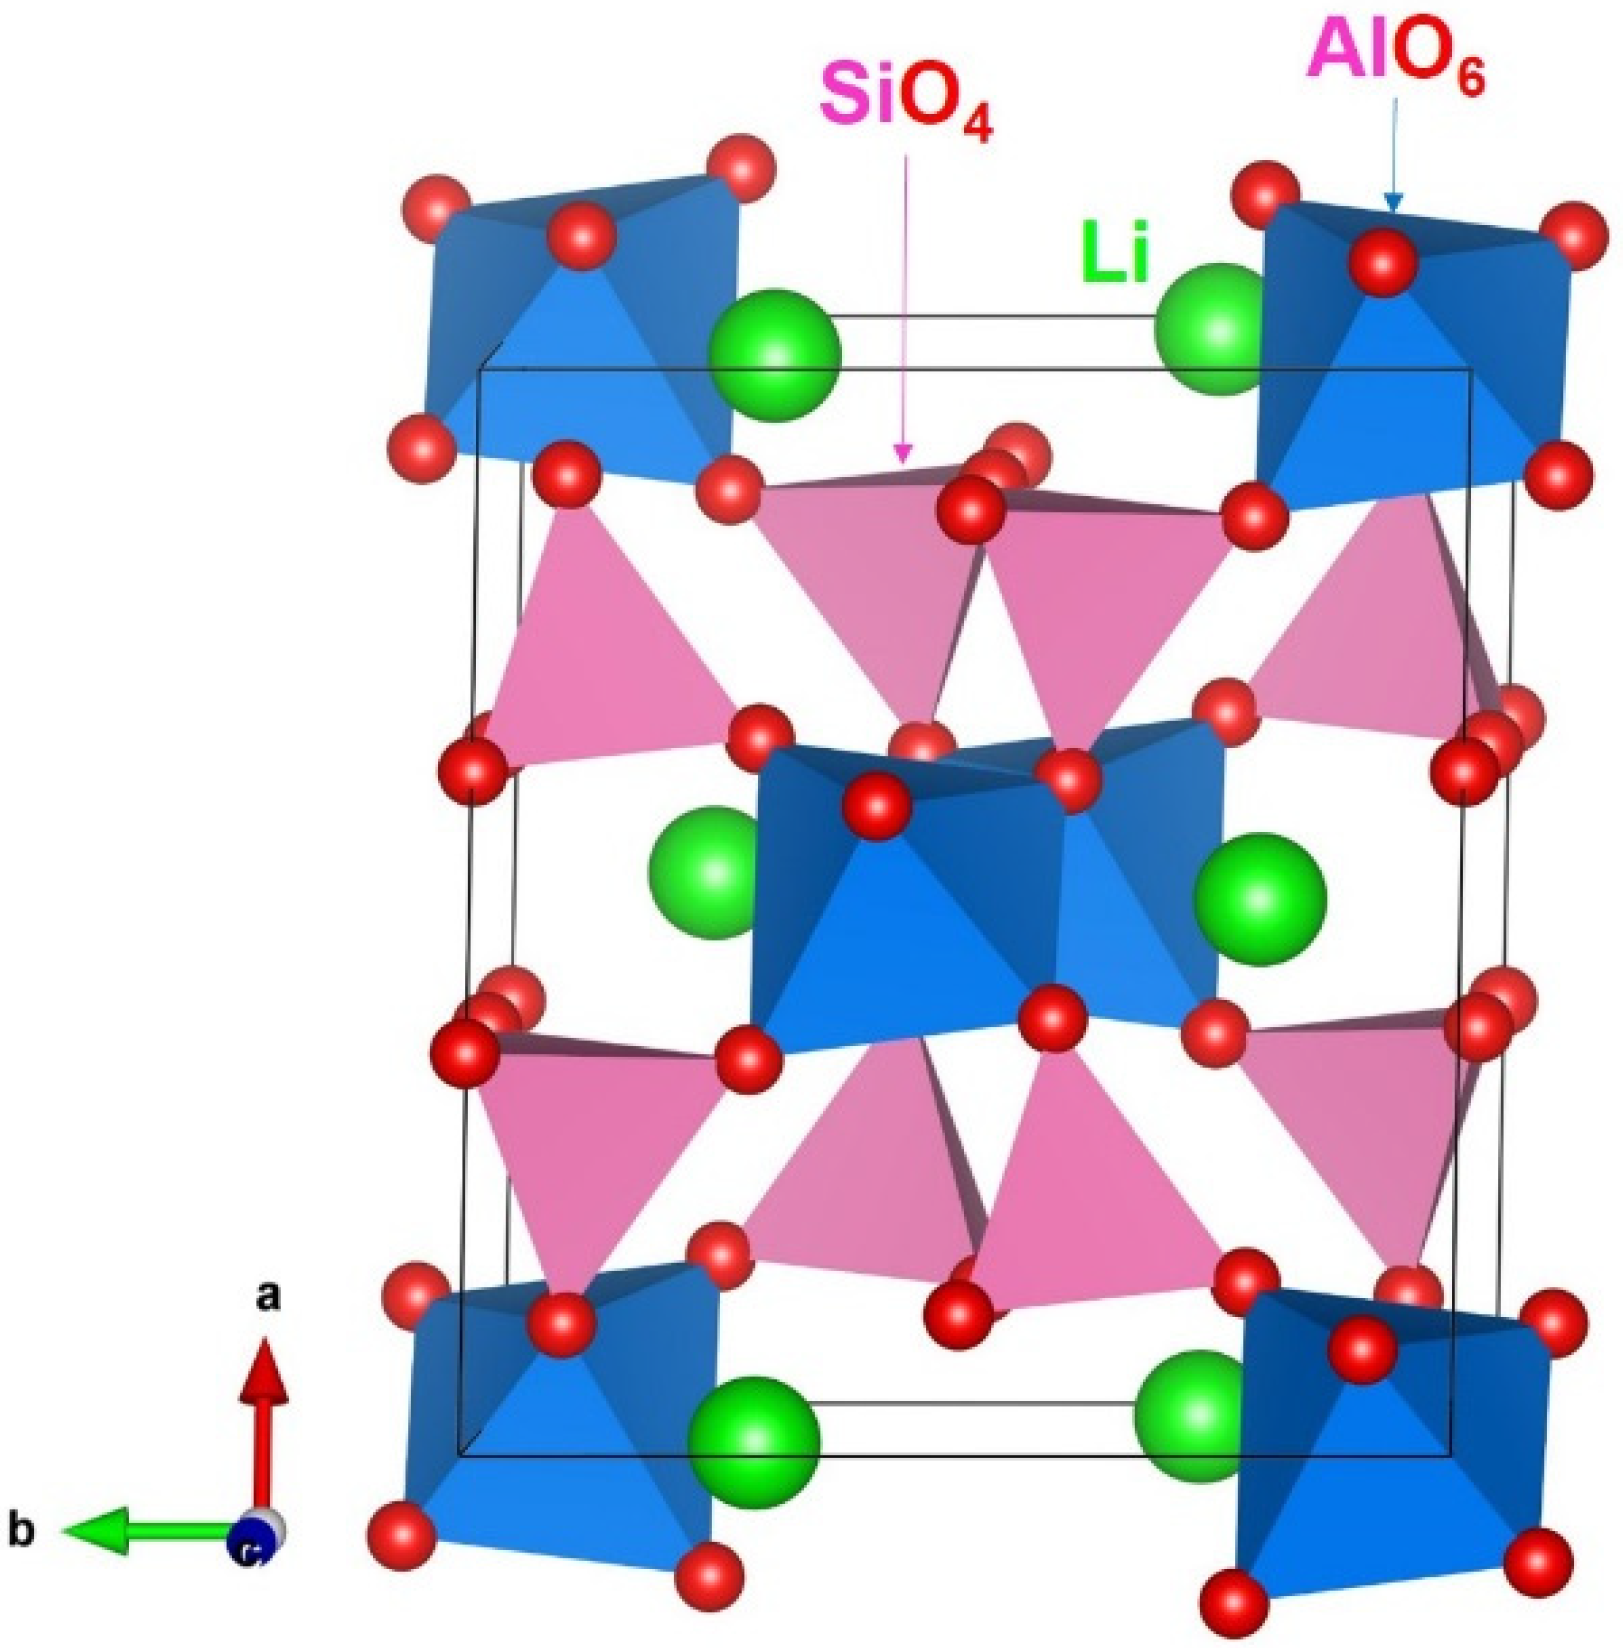
3.1. Computational Modelling of α-LiAlSi2O6

The aluminosilicate α-spodumene crystallizes in the space group C 2/c with a monoclinic structure, where Al3+ and Si4+ exhibit octahedral and tetrahedral coordination, respectively [36]. The experimental crystal structure of α-LiAlSi2O6 (lattice parameters: a = 9.461 Å, b = 8.395 Å, c = 5.217 Å, α = γ = 90.00°, and β = 110.09°) [36] was reproduced by both classical and DFT simulations, where the calculated structural parameters are in good agreement with the experimental values (refer to Table 2). Figure 1 illustrates the structure and chemical environment of α-spodumene. This parameterized model of the α-LiAlSi2O6 thus provides a valid fundamental base for subsequent defect modelling and calculation.

3.2. Intrinsic Defects

In this section, we report the results of intrinsic defect energies calculated using classical simulation. First, point defect (vacancy and interstitial) energies were calculated (refer to Table 3). They were then combined together with appropriate lattice energies to calculate Frenkel and Schottky defect energies. Anti-site defects in which cations exchange their atomic positions were also calculated in the forms of isolated and cluster. In the isolated form, the formation energies of impurities were calculated separately. In contrast, impurities were allowed to form next to each other in the cluster form and formation energy for the defect cluster was calculated simultaneously. Anti-site defect is an important defect that dominate the diffusion property of a material. The following reaction equations show the intrinsic defect processes (Schottky, Frenkel, and anti-site), as written using the Kröger–Vink notation [37].
Li   Frenkel :   Li Li X     V Li +   Li i
Al   Frenkel :   Al Al X     V Al +   Al i
Si   Frenkel :   Si Si X     V Si +   Si i
O   Frenkel :   O O X     V O •• +   O i
Schottky : Li Li x +   Al Al x + 2 Si Si x + 6 O O x V Li + V Al + 2 V Si + 6   V O + LiAlSi 2 O 6
Li 2 O   Schottky :   2   Li Li X +   O O X   2   V Li + V O + Li 2 O
Al 2 O 3   Schottky :   2   Al Al X + 3   O O X   2   V Al + 3   V O + Al 2 O 3
ZrO 2   Schottky :   Zr Zr X + 2   O O X     V Zr + 2   V O +   ZrO 2
Li / Al   antisite   ( isolated ) :   Li Li X +   Al Al X   Li Al + Al Li
Li / Al   antisite   ( cluster ) :   Li Li X +   Al Al X   { Li Al + Al Li }
Li / Si   antisite   ( isolated ) :   Li Li X +   Si Si X   Li Si + Si Li
Li / Zr   antisite   ( cluster ) :   Li Li X +   Si Si X     { Li Si + Si Li }
Al / Si   antisite   ( isolated ) :   Al Al X +   Si Si X   Al Si + Si Al
Al / Si   antisite   ( cluster ) :   Al Al X +   Si Si X     { Al Si + Si Al }
Formation energies of all vacancies are endothermic. Formation energy increases with the increase in the charge of ion formed (Li > O > Al > Si). Conversely, all interstitial formation energies are exoergic and formation energy increases with the decrease in the charge of intertitial ion.
In Table 4, we report the calculated defect energies. The most favourable defect energy process is the Al-Si anti-site defect cluster Equation (14). This indicates that a small percentage of Al-Si cation mixing would be present in this material. The cluster form is energetically more favourable (by 0.31 eV) than its isolated form. This is owing to the isolated impurity defects preferring to form a cluster with exothermic binding energy of –0.31 eV. The second most favourable defect process is the Li-Al anti-site defect cluster. The defect energy is higher only by 0.09 eV than the Al-Si anti-site cluster. Anti-site defects have been found in many oxide materials experimentally and theoretically [38,39,40,41]. The Li-Frenkel is higher in energy by 0.33 eV than the Al-Si anti-site defect cluster. This Frenkel would ensure the formation of Li vacancies needed for the vacancy mediated Li-ion diffusion. Other Frenkel defect processes are highly endoergic, meaning that the Li2O partial Schottky is the lowest energy process compared with the other Schottky defect processes. This process will lead to the loss of Li2O in this material. However, this process would require energy in the form of heat.

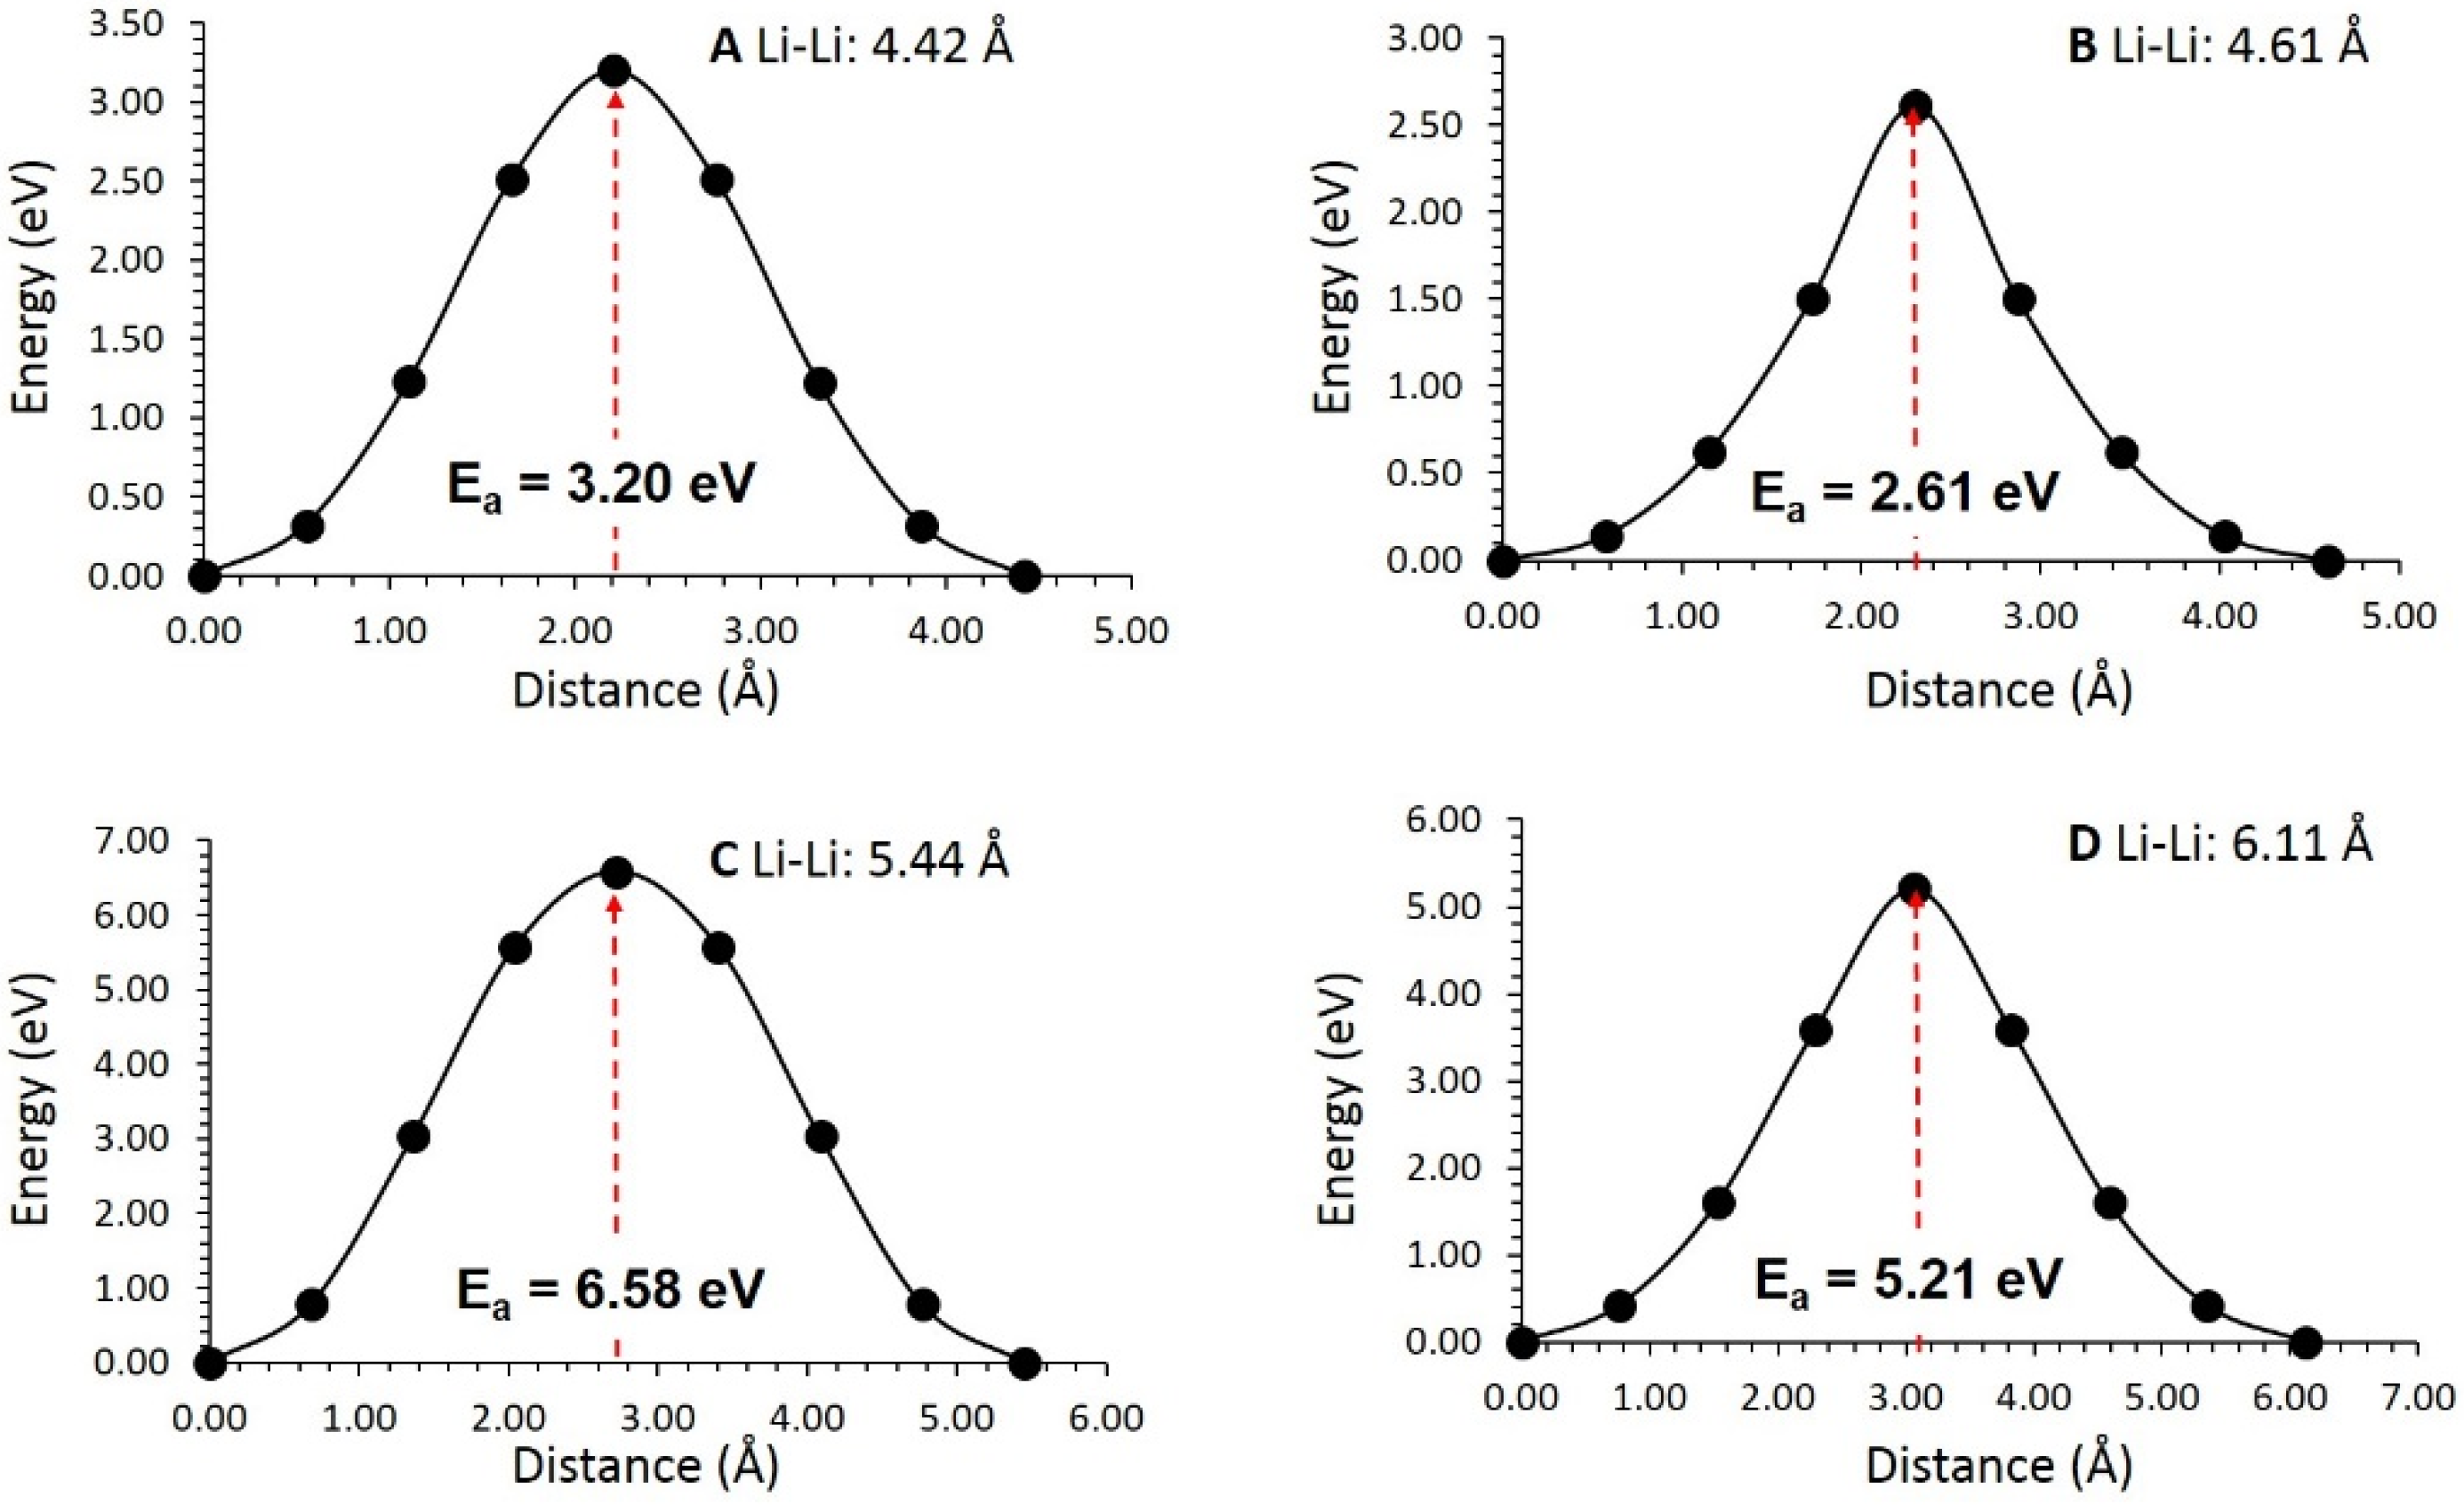
3.3. Li-Ion Diffusion

Ionic conductivity is an important parameter determining the property of a material. Here, we use classical simulation to examine the Li-ion diffusion pathways and their activation energies. In previous simulation studies [42,43,44,45], many oxide materials have been analysed to construct Li-ion migration pathways together with activation energies. For a promising Li-ion battery, electrode material with low activation energy of Li-ion migration is preferred. Computational simulations have been supportive to experimental studies in determining the diffusion pathways, as experimental investigation of diffusion is often challenging.
Four different Li local hops (A–D) were identified (see Figure 2). The Li hop distances and activation energies are reported in Table 5. The energy profile diagrams (see Figure 3) show the activation energies calculated for local Li hops. The local hop B exhibits the lowest activation energy of 2.61 eV. We constructed a long-range diffusion pathway (B→B→B→B) consisting of local hops B. Li-ion migrates in a zig-zag pattern in the ac plane (see Figure 2) in this diffusion pathway. Although this long-range pathway exhibits the lowest activation energy of 2.61 eV, diffusion of Li-ion is expected to be sluggish. For a promising electrode material, activation energy of Li-ion migration should be lower than 0.50 eV. Other local hops (A, C and D) have higher activation energies than that calculated for hop B. Although other long-range diffusion pathways [A→A→A→A, C→C→C→C and D→D→D→D] can be constructed, their overall activation energies are quite high. Migration calculations show that Li-ion conduction in this material is very slow. This is partly owing to the fact that Li-Li separation in this material is large. There is no experimental information available on the Li-ion migration pathways or activation energies in this material. Current simulation study can be useful to the future experimental verification. An efficient strategy to enhance the Li-ion diffusion would be introducing additional Li by appropriate doping. We discuss this strategy in the next section.

3.4. Solution of Dopants

Cation doping is an important strategy to modify the properties of materials. Here, we consider isovalent and alovalent dopants at different cation sites. Charge compensating defects are not necessary in the case of isovalent doping. However, point defects (vacancies and interstitials) are used to compensate charges produced upon aliovalent doping. A range of cations were doped and their solution energies were calculated using classical simulation. We provide Buckingham potentials used for dopants in the Supplementary Information (see Table S1).

3.4.1. Isovalent Doping

First, monovalent dopants (M = Na, K, and Rb) were considered on the Li site and the following reaction equation was used to calculate the solution energy.
M 2 O + Li Li   X 2   M Li   X + Li 2 O
Solution energies are reported in Figure 4a. An exothermic solution energy of –0.24 eV is calculated for Na+, meaning that this dopant can be worth examining experimentally. The ionic radius of Li+ is 0.76 Å [46]. Favourability of Na+ on the Li site is partly owing to the fact that the ionic radius (1.02 Å) [46] of Na+ is closer to that of Li+. Solution energy increases with increasing ionic radius. Doping of K and Rb is not favourable as solution energies are positive for both dopants. The largest solution of energy (5.23 eV) is calculated for Rb and this dopant is highly unlikely to be considered for doping at room temperature.
Next, trivalent dopants (M = Ga, Sc, In, Y, Gd, and La) were doped on the Al site. We describe the reaction process using the following equation:
M 2 O 3 + 2   Al Al X     2   M Al X   + Al 2 O 3
The lowest solution energy is calculated for Ga with an exothermic solution energy of –0.14 eV (refer to Figure 4b). The preference of Ga is partly due to the fact that the ionic radius of Al3+ (0.54 Å) matches reasonably with the ionic radius of Ga3+ (0.62 Å) [46]. Other dopants have endoergic solution energies. Solution energy increases gradually with ionic radius. The La is the most unlikely dopant as it has the highest solution energy of 1.91 eV.
Finally, the solution of tetravalent dopants (M = Ge, Ti, Sn, Zr, and Ce) was examined. Here, tetravalent dopants were substituted on the Si site. The following reaction equation was used to describe the doping process:
MO 2 +   Si Si   X M Si   X + SiO 2
All dopants exhibit endothermic solution energies (refer to Figure 4c). A promising dopant for this process is Ge, with a solution energy of 0.39 eV owing to the ionic radius of Si4+ (0.26 Å) being closer to that of Ge4+ (0.39 Å) [46]. There is an increase in solution energy for Ti (2.53 eV). Then, the solution energy decreases to 1.63 eV. Both Sn and Zr have lower solution energies than that of Ti. The highest positive solution energy is calculated for Ce.

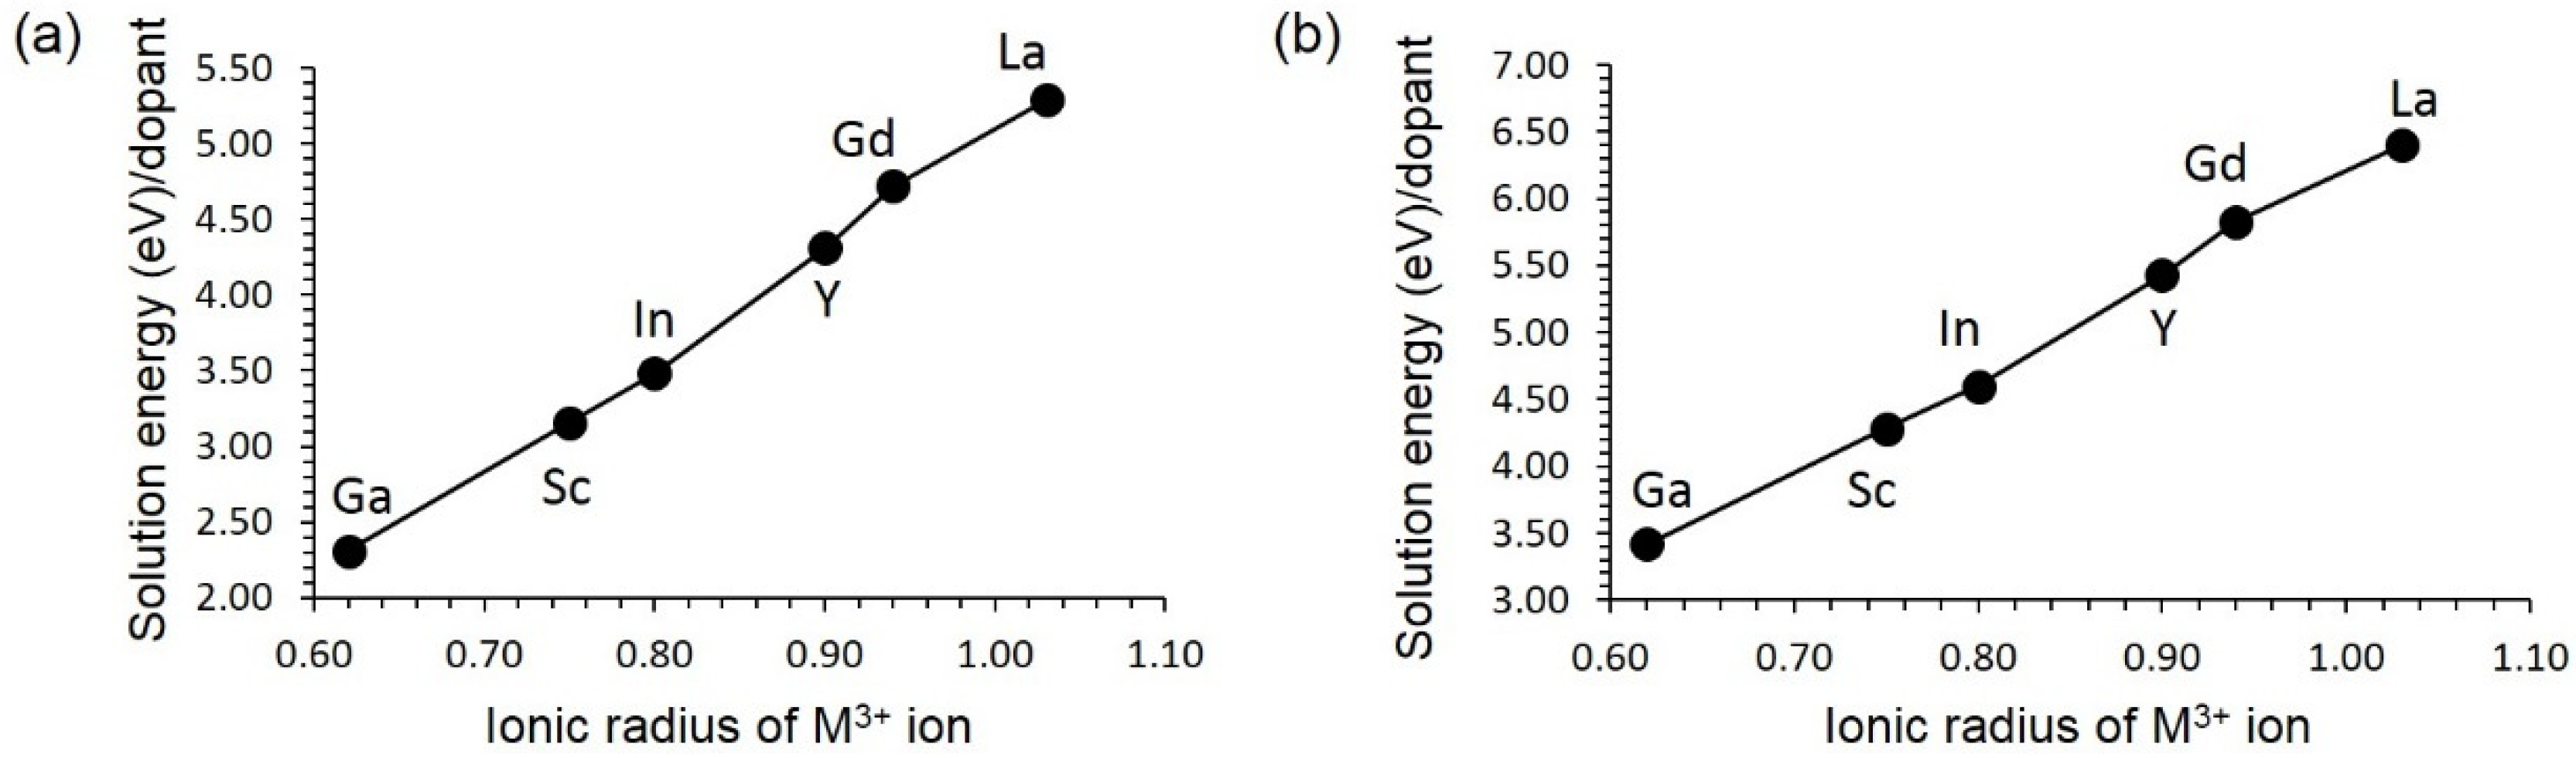
3.4.2. Aliovalent Doping

Trivalent dopants (M = Ga, Sc, In, Y, Gd, and La) were substitutionally doped on the site. This process required charge compensating defects. Two possible such defects (Li interstitial or oxygen vacancy) were considered (refer to Equations (18) and (19)). Additional Li+ ions in this materials would increase its capacity. The formation of oxygen vacancies would enhance the vacancy mediated oxygen ion diffusion. Furthermore, this doping process can lead to the loss of Li2O as Li interstitials and oxygen interstitials as facilitated by the formation oxygen vacancies can aggregate.
M 2 O 3 + 2   Si Si X + Li 2 O     2   M Si + 2   Li i + 2   SiO 2
M 2 O 3 + 2   Si Si X + Li 2 O     2   M Si + V o + 2   SiO 2
Figure 5a reports the solution energies for the trivalent doping in which Li interstitials are the charge compensating defects (refer to Equation (18)). Ga is the most prominent dopant for this process, although its solution energy is 2.31 eV. The solution energy gradually increases with the increasing ionic radius. The dopant La has the highest solution energy of 5.29 eV. A similar trend is observed for the formation of oxygen vacancies, but with slightly high energies (refer to Figure 5b). Overall, Ga is the promising dopant on the Si site for both processes.

3.5. Incorporation of Li into LiAlSi2O6

Li incorporation was examined using DFT simulations. Here, we report the geometries, electronic structures, and volume change upon incorporation. The calculated total DOS plot of bulk LiAlSi2O6 is shown in Figure 6. The calculation shows that LiAlSi2O6 is an insulator with a band gap of 5.50 eV, which is in agreement with the band gap value of 5.575 eV calculated using DFT simulation by He et al. [47]. The total magnetic moment of the bulk LiAlSi2O6 is zero, as evidenced by the total DOS plot, in which spin up states are the mirror image of spin down states about the x-axis.
Incorporation of up to four Li atoms was considered. Figure 7 shows the relaxed structures. Incorporation of first two Li atoms is endoergic with respect to both the gas phase and bulk Li (see Table 6). Incorporation energy calculated using gas phase bulk Li metal is more positive than that calculated using the gas phase Li atom. This is because of the extra energy required to dissociate bulk Li to form Li atoms. Incorporation becomes exothermic for three and four Li atoms with respect to gas phase Li atom. This can be partly owing to the volume expansion introduced by the previous incorporation. Bader charge analysis [48] confirms that all Li atoms exhibit a +1 charge. Positively charged Li atoms strongly interact with negatively charged oxygen atoms in the lattice.
Figure 8 shows the total DOS plots calculated for the Li-incorporated structures. Fermi energy level shifts towards conduction band upon incorporation. This is because of the presence of electrons that were produced during the Li incorporation. The resultant complexes exhibit a metallic character and Fermi levels are occupied by the states associated with Li according to the atomic DOSs plotted for incorporated Li (see Figure 8e–h).

4. Conclusions

Intrinsic disorder mechanisms are investigated in the simulated crystal model of α-LiAlSi2O6 utilizing static atomistic simulation techniques. The Al/Si cation anti-site disorder is found to be the most dominant defect in this material. The formation of Li vacancies is ensured by the Li-Frenkel defect process, which is higher in energy by 0.33 eV than the Al/Si anti-site defect. A slow diffusion of Li-ion is noted with high activation energy of 2.62 eV. Na, Ga, and Ge are the favorite dopants on the Li, Al, and Si sites, respectively. Here, we suggest that the concentration of both Li interstitials and O vacancies can be facilitated by doping of Ga on the Si site. Incorporation of lithium was studied using density functional theory simulations and it is shown that, at a high concentration, incorporation becomes easier and the insulating nature of pure LiAlSi2O6 becomes metallic upon incorporation.

Supplementary Materials

The following are available online at https://www.mdpi.com/article/10.3390/chemengineering5030057/s1, Table S1: Interatomic potential parameters used for dopant in the atomistic simulations of LiAlSi2O6.

Author Contributions

Computation, S.S. and N.K.; Writing, S.S. and N.K.; Analysis, P.I.; Editing, N.K. All authors have read and agreed to the published version of the manuscript.

Funding

This research received no external funding.

Institutional Review Board Statement

Not applicable.

Informed Consent Statement

Not applicable.

Data Availability Statement

Not applicable.

Acknowledgments

We acknowledge Imperial College London for providing high performance computing facilities.

Conflicts of Interest

The authors declare no conflict of interest.

References

  1. Dessemond, C.; Lajoie-Leroux, F.; Soucy, G.; Laroche, N.; Magnan, J.-F. Spodumene: The Lithium Market, Resources and Processes. Minerals 2019, 9, 334. [Google Scholar] [CrossRef] [Green Version]
  2. Benson, T.R.; Coble, M.A.; Rytuba, J.J.; Mahood, G.A. Lithium enrichment in intracontinental rhyolite magmas leads to Li deposits in caldera basins. Nat. Commun. 2017, 8, 270. [Google Scholar] [CrossRef] [PubMed]
  3. Liu, Q.; Zhou, S.; Tang, C.; Zhai, Q.; Zhang, X.; Wang, R. Li-B Alloy as an Anode Material for Stable and Long Life Lithium Metal Batteries. Energies 2018, 11, 2512. [Google Scholar] [CrossRef] [Green Version]
  4. Oruch, R.; Elderbi, M.A.; Khattab, H.A.; Pryme, I.F.; Lund, A. Lithium: A review of pharmacology, clinical uses, and toxicity. Eur. J. Pharmacol. 2014, 740, 464–473. [Google Scholar] [CrossRef]
  5. Beskin, S.M.; Marin, Y.B. Classification of G3ranitic Pegmatites and Pegmatite-Bearing Granitic Systems. Geol. Ore Depos. 2018, 60, 578–586. [Google Scholar] [CrossRef]
  6. Sundelius, H.W. The Peg Claims spodumene pegmatites, Maine. Econ. Geol. 1963, 58, 84–106. [Google Scholar] [CrossRef]
  7. Barros, R.; Menuge, J.F. The Origin of Spodumene Pegmatites Associated with the Leinster Granite in Southeast Ireland. Can. Miner. 2016, 54, 847–862. [Google Scholar] [CrossRef]
  8. Grosjean, C.; Miranda, P.H.; Perrin, M.; Poggi, P. Assessment of world lithium resources and consequences of their geographic distribution on the expected development of the electric vehicle industry. Renew. Sustain. Energy Rev. 2012, 16, 1735–1744. [Google Scholar] [CrossRef]
  9. Kesler, S.E.; Gruber, P.W.; Medina, P.A.; Keoleian, G.A.; Everson, M.P.; Wallington, T.J. Global lithium resources: Relative importance of pegmatite, brine and other deposits. Ore Geol. Rev. 2012, 48, 55–69. [Google Scholar] [CrossRef]
  10. Jie, Z.; Weiqing, W.; Jing, L.; Yang, H.; Qiming, F.; Hong, Z. Fe(III) as an activator for the flotation of spodumene, albite, and quartz minerals. Miner. Eng. 2014, 61, 16–22. [Google Scholar] [CrossRef]
  11. Dessemond, C.; Soucy, G.; Harvey, J.-P.; Ouzilleau, P. Phase Transitions in the α–γ–β Spodumene Thermodynamic System and Impact of γ-Spodumene on the Efficiency of Lithium Extraction by Acid Leaching. Minerals 2020, 10, 519. [Google Scholar] [CrossRef]
  12. Peltosaari, O.; Tanskanen, P.; Heikkinen, E.-P.; Fabritius, T. α→γ→β-phase transformation of spodumene with hybrid microwave and conventional furnaces. Miner. Eng. 2015, 82, 54–60. [Google Scholar] [CrossRef]
  13. Song, Y.; Zhao, T.; He, L.; Zhao, Z.; Liu, X. A promising approach for directly extracting lithium from α-spodumene by alkaline digestion and precipitation as phosphate. Hydrometallurgy 2019, 189, 105141. [Google Scholar] [CrossRef]
  14. Kuganathan, N.; Srikaran, R.; Fossati, C.M.P.; Chroneos, A. Theoretical Modeling of Defects, Dopants, and Diffusion in the Mineral Ilmenite. Minerals 2019, 9, 610. [Google Scholar] [CrossRef] [Green Version]
  15. Suthaharan, S.; Iyngaran, P.; Kuganathan, N.; Chroneos, A. Defects, diffusion and dopants in the ceramic mineral “Lime- Feldspar”. J. Asian Ceram. Soc. 2021, 9, 570–577. [Google Scholar] [CrossRef]
  16. Yuan, K.; Lee, S.S.; Cha, W.; Ulvestad, A.; Kim, H.; Abdilla, B.; Sturchio, N.C.; Fenter, P. Oxidation induced strain and defects in magnetite crystals. Nat. Commun. 2019, 10, 703. [Google Scholar] [CrossRef] [PubMed]
  17. Lowitzer, S.; Wilson, D.J.; Winkler, B.; Milman, V.; Gale, J.D. Defect properties of albite. Phys. Chem. Miner. 2008, 35, 129–135. [Google Scholar] [CrossRef]
  18. Abdullah, A.A.; Oskierski, H.C.; Altarawneh, M.; Senanayake, G.; Lumpkin, G.; Dlugogorski, B.Z. Phase transformation mechanism of spodumene during its calcination. Miner. Eng. 2019, 140, 105883. [Google Scholar] [CrossRef]
  19. Salis, M. Lattice defects in natural α-spodumene. Il Nuovo Cim. D 1995, 17, 649–651. [Google Scholar] [CrossRef]
  20. Gale, J.D. GULP: A computer program for the symmetry-adapted simulation of solids. J. Chem. Soc. Faraday Trans. 1997, 93, 629–637. [Google Scholar] [CrossRef]
  21. Gale, J.D.; Rohl, A.L. The General Utility Lattice Program (GULP). Mol. Simul. 2003, 29, 291–341. [Google Scholar] [CrossRef]
  22. Fisher, C.A.J.; Hart Prieto, V.M.; Islam, M.S. Lithium Battery Materials LiMPO4 (M = Mn, Fe, Co, and Ni): Insights into Defect Association, Transport Mechanisms, and Doping Behavior. Chem. Mater. 2008, 20, 5907–5915. [Google Scholar] [CrossRef]
  23. Sauer, J.; Schroder, K.P.; Termath, V. Comparing the Acidities of Microporous Aluminosilicate and Silico-Aluminophosphate Catalysts: A Combined Quantum Mechanics-Interatomic Potential Function Study. Czech. Chem. Commun. 1998, 63, 1394. [Google Scholar] [CrossRef] [Green Version]
  24. Jones, A.; Slater, P.R.; Islam, M.S. Local Defect Structures and Ion Transport Mechanisms in the Oxygen-Excess Apatite La9.67(SiO4)6O2.5. Chem. Mater. 2008, 20, 5055–5060. [Google Scholar] [CrossRef]
  25. Olson, C.L.; Nelson, J.; Islam, M.S. Defect Chemistry, Surface Structures, and Lithium Insertion in Anatase TiO2. J. Phys. Chem. B 2006, 110, 9995–10001. [Google Scholar] [CrossRef] [PubMed] [Green Version]
  26. Mott, N.F.; Littleton, M.J. Conduction in polar crystals. I. Electrolytic conduction in solid salts. Trans. Faraday Soc. 1938, 34, 485–499. [Google Scholar] [CrossRef]
  27. Grimes, R.W.; Busker, G.; McCoy, M.A.; Chroneos, A.; Kilner, J.A.; Chen, S.-P. The Effect of Ion Size on Solution Mechanism and Defect Cluster Geometry. Ber. Der Bunsenges. Für Phys. Chem. 1997, 101, 1204–1210. [Google Scholar] [CrossRef]
  28. Varotsos, P. Point defect parameters in β-PbF2 revisited. Solid State Ion. 2008, 179, 438–441. [Google Scholar] [CrossRef]
  29. Varotsos, P. Comparison of models that interconnect point defect parameters in solids with bulk properties. J. Appl. Phys. 2007, 101, 123503. [Google Scholar] [CrossRef]
  30. Kresse, G.; Joubert, D. From ultrasoft pseudopotentials to the projector augmented-wave method. Phys. Rev. B 1999, 59, 1758–1775. [Google Scholar] [CrossRef]
  31. Blöchl, P.E. Projector augmented-wave method. Phys. Rev. B 1994, 50, 17953–17979. [Google Scholar] [CrossRef] [Green Version]
  32. Monkhorst, H.J.; Pack, J.D. Special points for Brillouin-zone integrations. Phys. Rev. B 1976, 13, 5188–5192. [Google Scholar] [CrossRef]
  33. Perdew, J.P.; Burke, K.; Ernzerhof, M. Generalized Gradient Approximation Made Simple. Phys. Rev. Lett. 1996, 77, 3865–3868. [Google Scholar] [CrossRef] [Green Version]
  34. Press, W.H.; Teukolsky, S.A.; Vetterling, W.T.; Flannery, B.P. Numerical Recipes in C, 2nd ed.; The Art of Scientific Computing; Cambridge University Press: Cambridge, UK, 1992. [Google Scholar]
  35. Grimme, S.; Antony, J.; Ehrlich, S.; Krieg, H. A consistent and accurate ab initio parametrization of density functional dispersion correction (DFT-D) for the 94 elements H-Pu. J. Chem. Phys. 2010, 132, 154104. [Google Scholar] [CrossRef] [Green Version]
  36. Sasaki, S.; Fujino, K.; Takeuchi, Y.; Sadanaga, R. On the estimation of atomic charges by the X-ray method for some oxides and silicates. Acta Crystallogr. Sect. A 1980, 36, 904–915. [Google Scholar] [CrossRef]
  37. Kröger, F.A.; Vink, H.J. Relations between the Concentrations of Imperfections in Crystalline Solids. In Solid State Physics; Seitz, F., Turnbull, D., Eds.; Academic Press: Cambridge, MA, USA, 1956; Volume 3, pp. 307–435. [Google Scholar]
  38. Armstrong, A.R.; Kuganathan, N.; Islam, M.S.; Bruce, P.G. Structure and Lithium Transport Pathways in Li2FeSiO4 Cathodes for Lithium Batteries. J. Am. Chem. Soc. 2011, 133, 13031–13035. [Google Scholar] [CrossRef] [Green Version]
  39. Liu, H.; Choe, M.-J.; Enrique, R.A.; Orvañanos, B.; Zhou, L.; Liu, T.; Thornton, K.; Grey, C.P. Effects of Antisite Defects on Li Diffusion in LiFePO4 Revealed by Li Isotope Exchange. J. Phys. Chem. C 2017, 121, 12025–12036. [Google Scholar] [CrossRef]
  40. Politaev, V.V.; Petrenko, A.A.; Nalbandyan, V.B.; Medvedev, B.S.; Shvetsova, E.S. Crystal structure, phase relations and electrochemical properties of monoclinic Li2MnSiO4. J. Solid State Chem. 2007, 180, 1045–1050. [Google Scholar] [CrossRef]
  41. Kuganathan, N.; Kordatos, A.; Kelaidis, N.; Chroneos, A. Defects, Lithium Mobility and Tetravalent Dopants in the Li3NbO4 Cathode Material. Sci. Rep. 2019, 9, 2192. [Google Scholar] [CrossRef] [Green Version]
  42. Islam, M.S.; Driscoll, D.J.; Fisher, C.A.J.; Slater, P.R. Atomic-Scale Investigation of Defects, Dopants, and Lithium Transport in the LiFePO4 Olivine-Type Battery Material. Chem. Mater. 2005, 17, 5085–5092. [Google Scholar] [CrossRef]
  43. Kuganathan, N.; Ganeshalingam, S.; Chroneos, A. Defects, Dopants and Lithium Mobility in Li9V3(P2O7)3(PO4)2. Sci. Rep. 2018, 8, 8140. [Google Scholar] [CrossRef]
  44. Kuganathan, N.; Kordatos, A.; Anurakavan, S.; Iyngaran, P.; Chroneos, A. Li3SbO4 lithium-ion battery material: Defects, lithium ion diffusion and tetravalent dopants. Mater. Chem. Phys. 2019, 225, 34–41. [Google Scholar] [CrossRef]
  45. Tealdi, C.; Saiful Islam, M.; Malavasi, L.; Flor, G. Defect and dopant properties of MgTa2O6. J. Solid State Chem. 2004, 177, 4359–4367. [Google Scholar] [CrossRef]
  46. Shannon, R. Revised effective ionic radii and systematic studies of interatomic distances in halides and chalcogenides. Acta Crystallogr. Sect. A 1976, 32, 751–767. [Google Scholar] [CrossRef]
  47. He, G.-C.; Xiang, H.-M.; Jiang, W.; Kang, Q.; Chen, J.-H. First-principles theory on electronic structure and floatability of spodumene. Rare Met. 2014, 33, 742–748. [Google Scholar] [CrossRef]
  48. Henkelman, G.; Arnaldsson, A.; Jónsson, H. A fast and robust algorithm for Bader decomposition of charge density. Comput. Mater. Sci. 2006, 36, 354–360. [Google Scholar] [CrossRef]
Figure 1. Crystal structure of α-LiAlSi2O6.
Chemengineering 05 00057 g001
Figure 2. Calculated Li-ion diffusion pathways. Yellow, purple, green, and pink color atoms correspond to different Li hops.
Chemengineering 05 00057 g002
Figure 3. Energy profile diagrams showing activation energies calculated for local Li hops as shown in Figure 2.
Chemengineering 05 00057 g003
Figure 4. Solution energies calculated for (a) monovalant, (b) trivalent, and (c) tetravalent dopants on the Li, Al, and Si, respectively.
Chemengineering 05 00057 g004
Figure 5. Solution energies calculated for trivalent doping on the Si site for generating (a) Li interstitials and (b) oxygen vacancies.
Chemengineering 05 00057 g005
Figure 6. Total DOS plot of LiAlSi2O6. Vertical blue dot line corresponds to the Fermi energy level.
Chemengineering 05 00057 g006
Figure 7. Relaxed structures of (a) a single Li, (b) 2Li, (c) 3Li, and (d) 4Li incorporated into LiAlSi2O6.
Chemengineering 05 00057 g007
Figure 8. Total DOS plots of (a) a single Li, (b) 2Li, (c) 3Li, and (d) 4Li incorporated into LiAlSi2O6. Corresponding Li atomic DOS plots (eh) are also shown.
Chemengineering 05 00057 g008
Table 1. Buckingham potential parameters used in the atomistic simulations of α-LiAlSi2O6.
Two-Body [Φij (rij) = Aij exp (−rij/ρij) − Cij/rij6]
InteractionA/eVρ/ÅC/eV∙Å6Y/eK/eV∙Å−2
Li+–O2−632.10180.290600.001.0099,999
Al3+–O2−1109.923810.315400.003.0099,999
Si4+‒O2−1283.910.3205210.664.0099,999
O2−–O2−12,420.50.2215029.07–2.9665.0
Table 2. Calculated and experimental lattice parameters of α-LiAlSi2O6.
ParameterCalculatedExperiment [36]|Δ|(%)
ClassicalDFTForce FieldDFT
a (Å)9.3739.5579.4610.931.01
b (Å)8.3238.4178.3950.860.26
c (Å)5.2715.2495.2171.030.61
α = γ (°)90.0090.0090.000.000.00
β (°)109.03110.42110.090.960.30
V (Å3)388.73395.73389.150.101.69
Table 3. Calculated point defect energies.
SitePoint Defect Energy (eV)
VacancyInterstitial
Li7.77–4.95
Al53.63–42.69
Si96.44–79.27
O23.53–15.14
Table 4. Formation energies of intrinsic defect process in monoclinic α-LiAlSi2O6.
Defect ProcessEquation NumberDefect Energy (eV)/Defect
Li Frenkel11.41
Al Frenkel25.47
Si Frenkel38.59
O Frenkel44.31
Full Schottky54.16
Li2O partial Schottky62.62
Al2O3 partial Schottky74.03
SiO2 partial Schottky84.97
Li-Al anti-site (isolated)92.26
Li-Al anti-site (cluster)101.17
Li-Si anti-site (isolated)116.37
Li-Si anti-site (cluster)122.70
Al-Si anti-site (isolated)131.39
Al-Si anti-site (cluster)141.08
Table 5. Activation energies calculated for local Li hops together with activation energies.
Migration PathLi-Li Separation (Å)Activation Energy (eV)
A4.423.20
B4.612.61
C5.446.58
D6.115.21
Table 6. Incorporation energies, Bader charges on the Li atoms, and volume change upon successive incorporation.
ReactionIncorporation Energy (eV)/LiBader Charge (|e|)ΔV (%)
Li + LiAlSi2O6 → Li.LiAlSi2O60.10 eV (1.77 eV)+1.000.34
2 Li + LiAlSi2O6 → 2 Li.LiAlSi2O60.59 eV (2.26 eV)+1.00 (2)2.16
3 Li + Li.LiAlSi2O6 → 3 Li.LiAlSi2O6–0.71 eV (1.04 eV)+1.00 (3)2.37
4 Li + Li.LiAlSi2O6 → 4 Li.LiAlSi2O6–0.85 eV (0.82 eV)+1.00 (4)2.73
Publisher’s Note: MDPI stays neutral with regard to jurisdictional claims in published maps and institutional affiliations.

