
Performance Evaluation of the Electric Machine Cooling System Employing Nanofluid as an Advanced Coolant


Abstract
:1. Introduction
2. Modeling
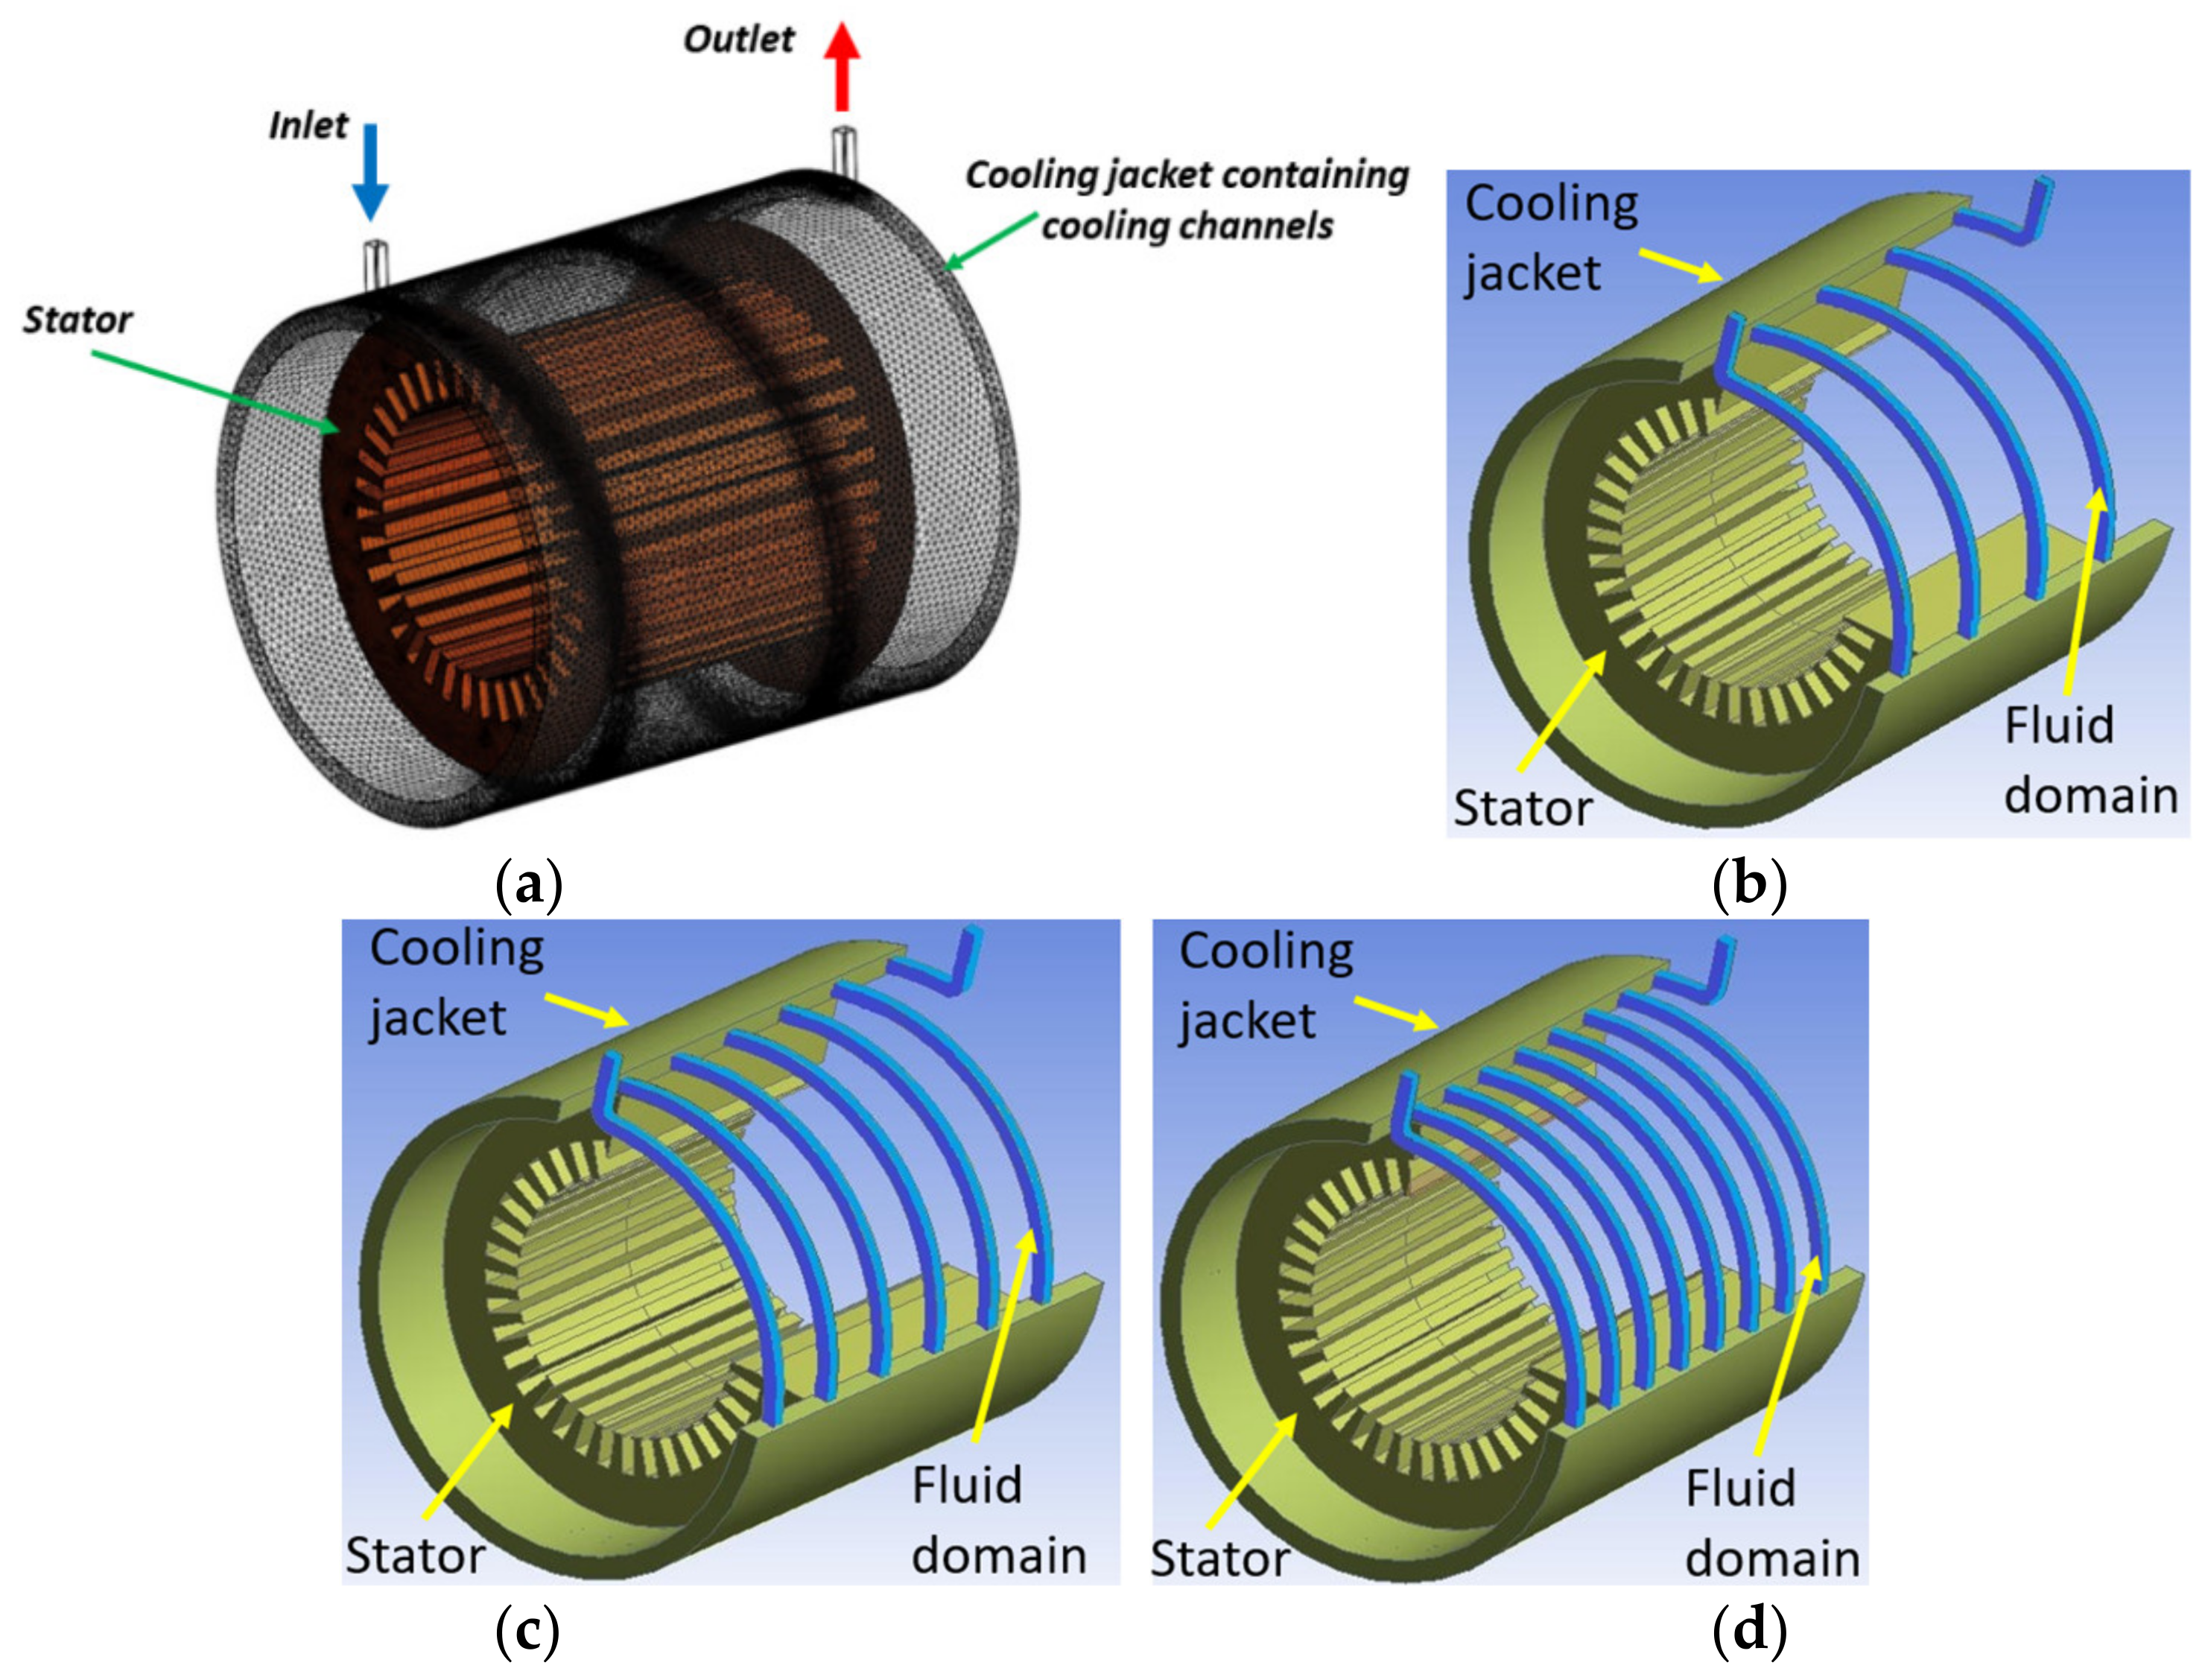
2.1. Geometry
2.2. Mathematical Model
2.3. Numerical Model
2.3.1. Grid Independence Validation
2.3.2. Validation of the Numerical Model
2.3.3. Boundary Conditions
3. Results
3.1. Heat Transfer Characteristics
3.2. Fluid Flow Characteristics
3.3. Overall Performance Evaluation
4. Conclusions
- (a)
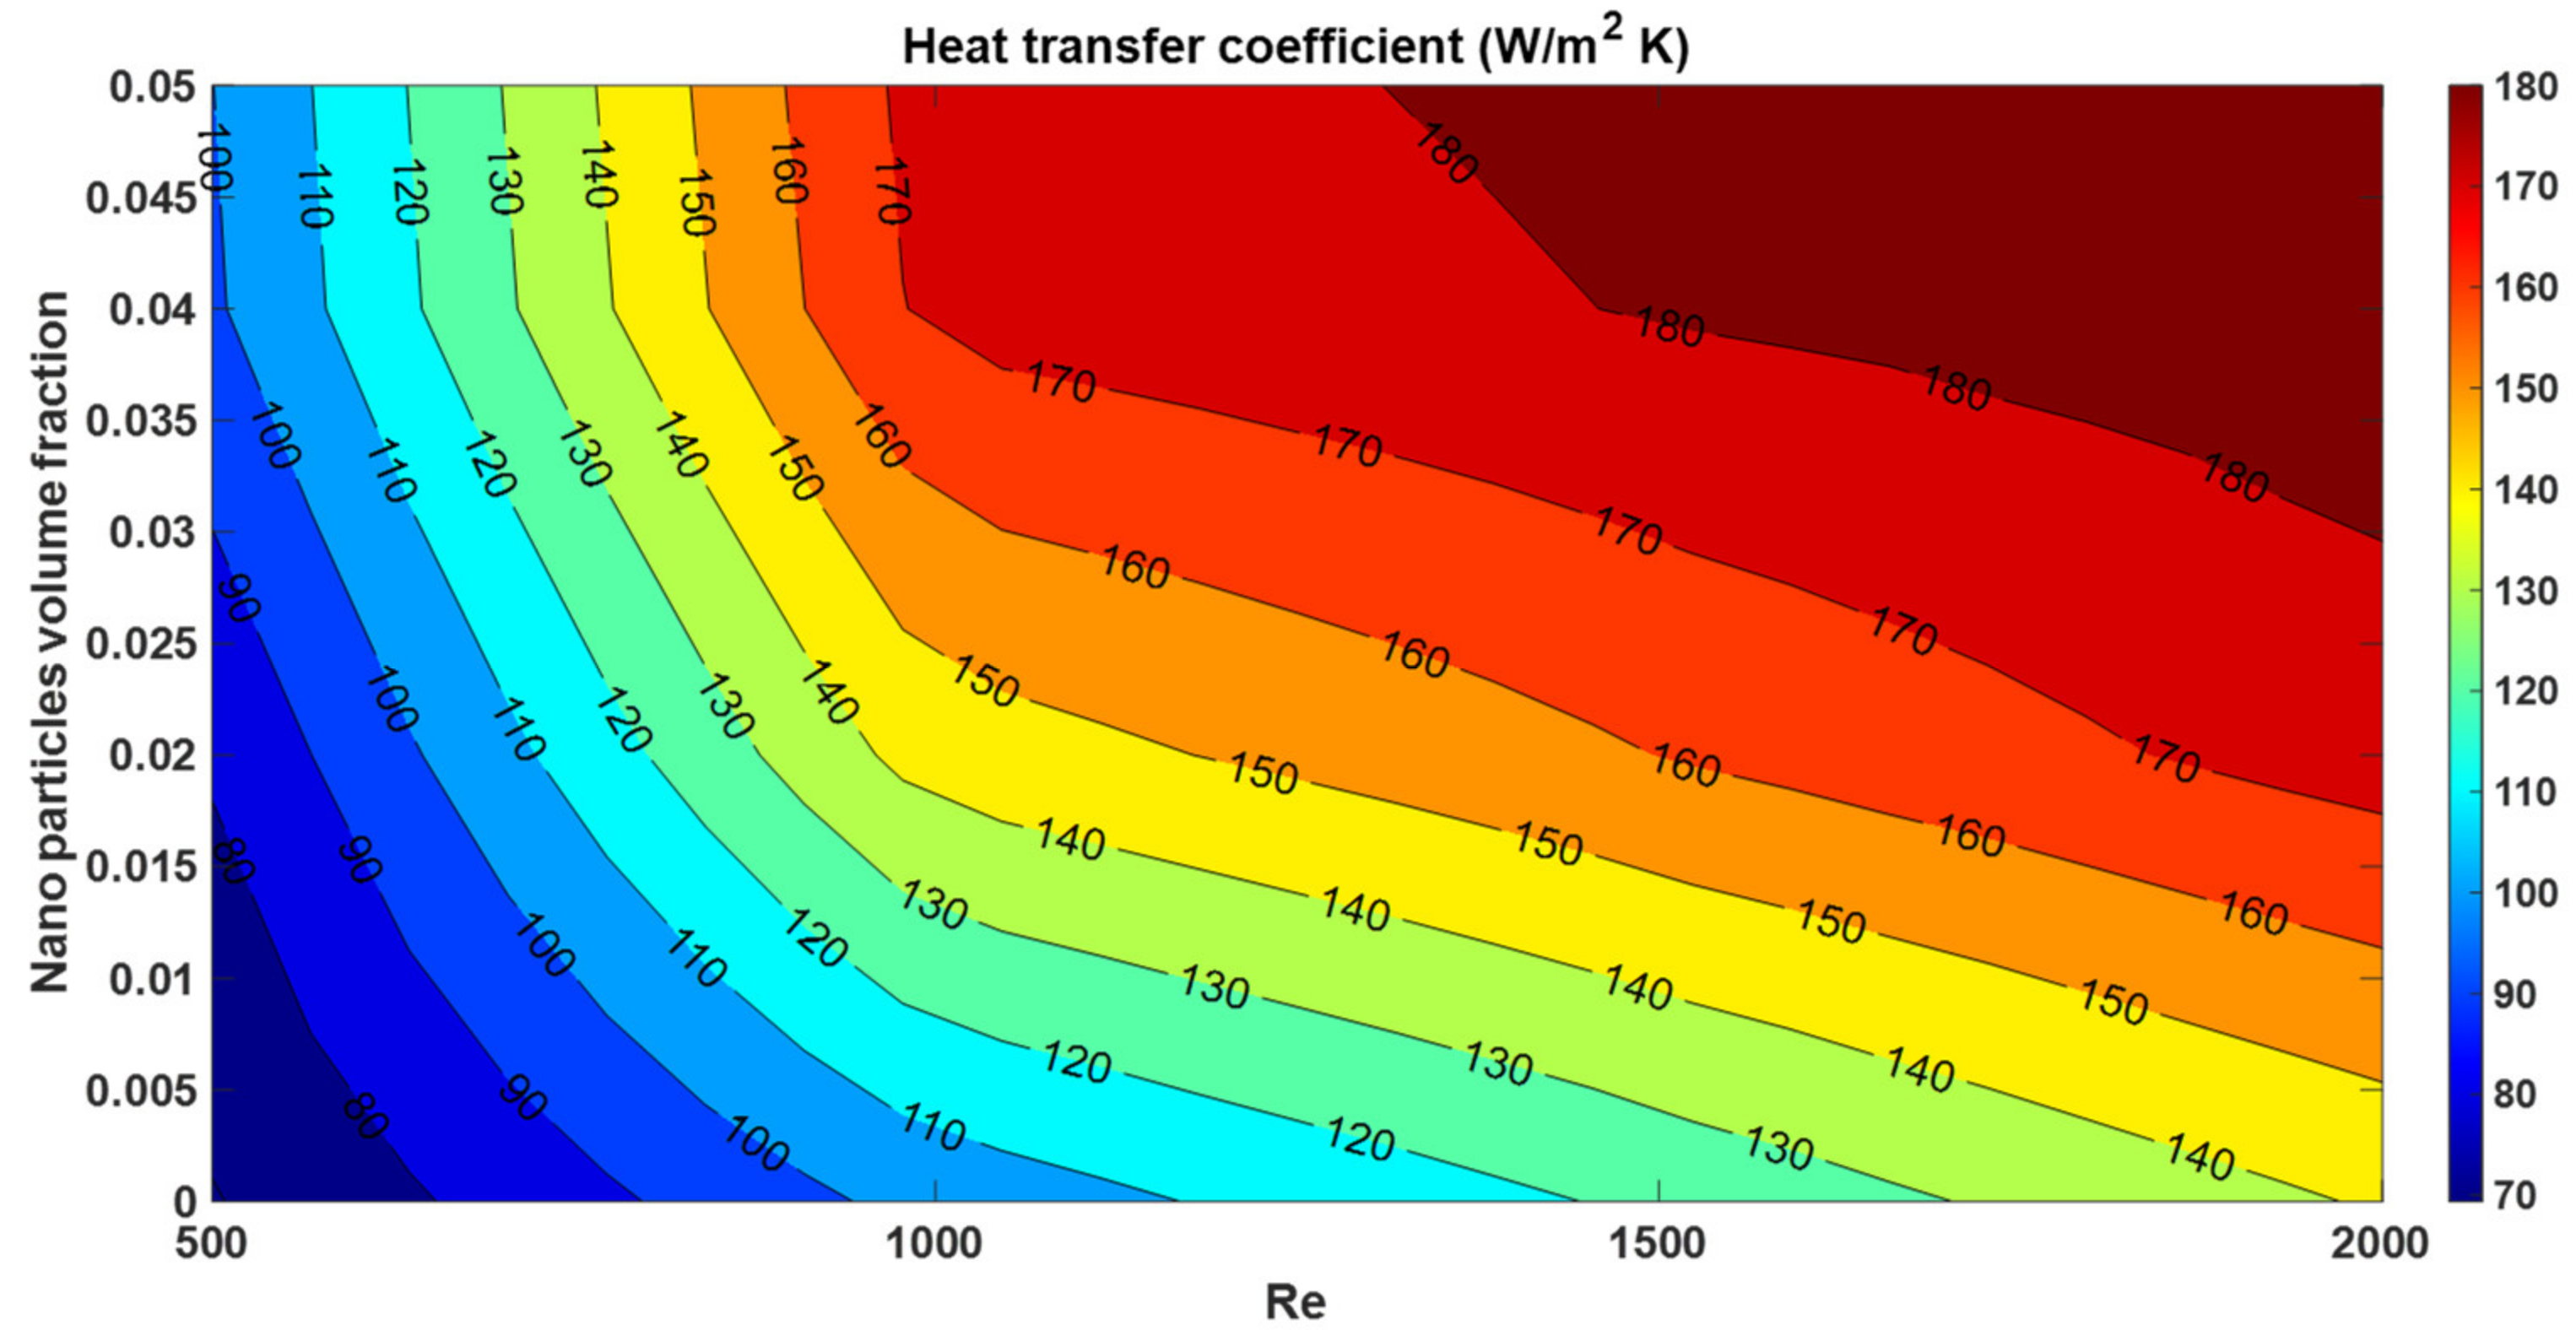
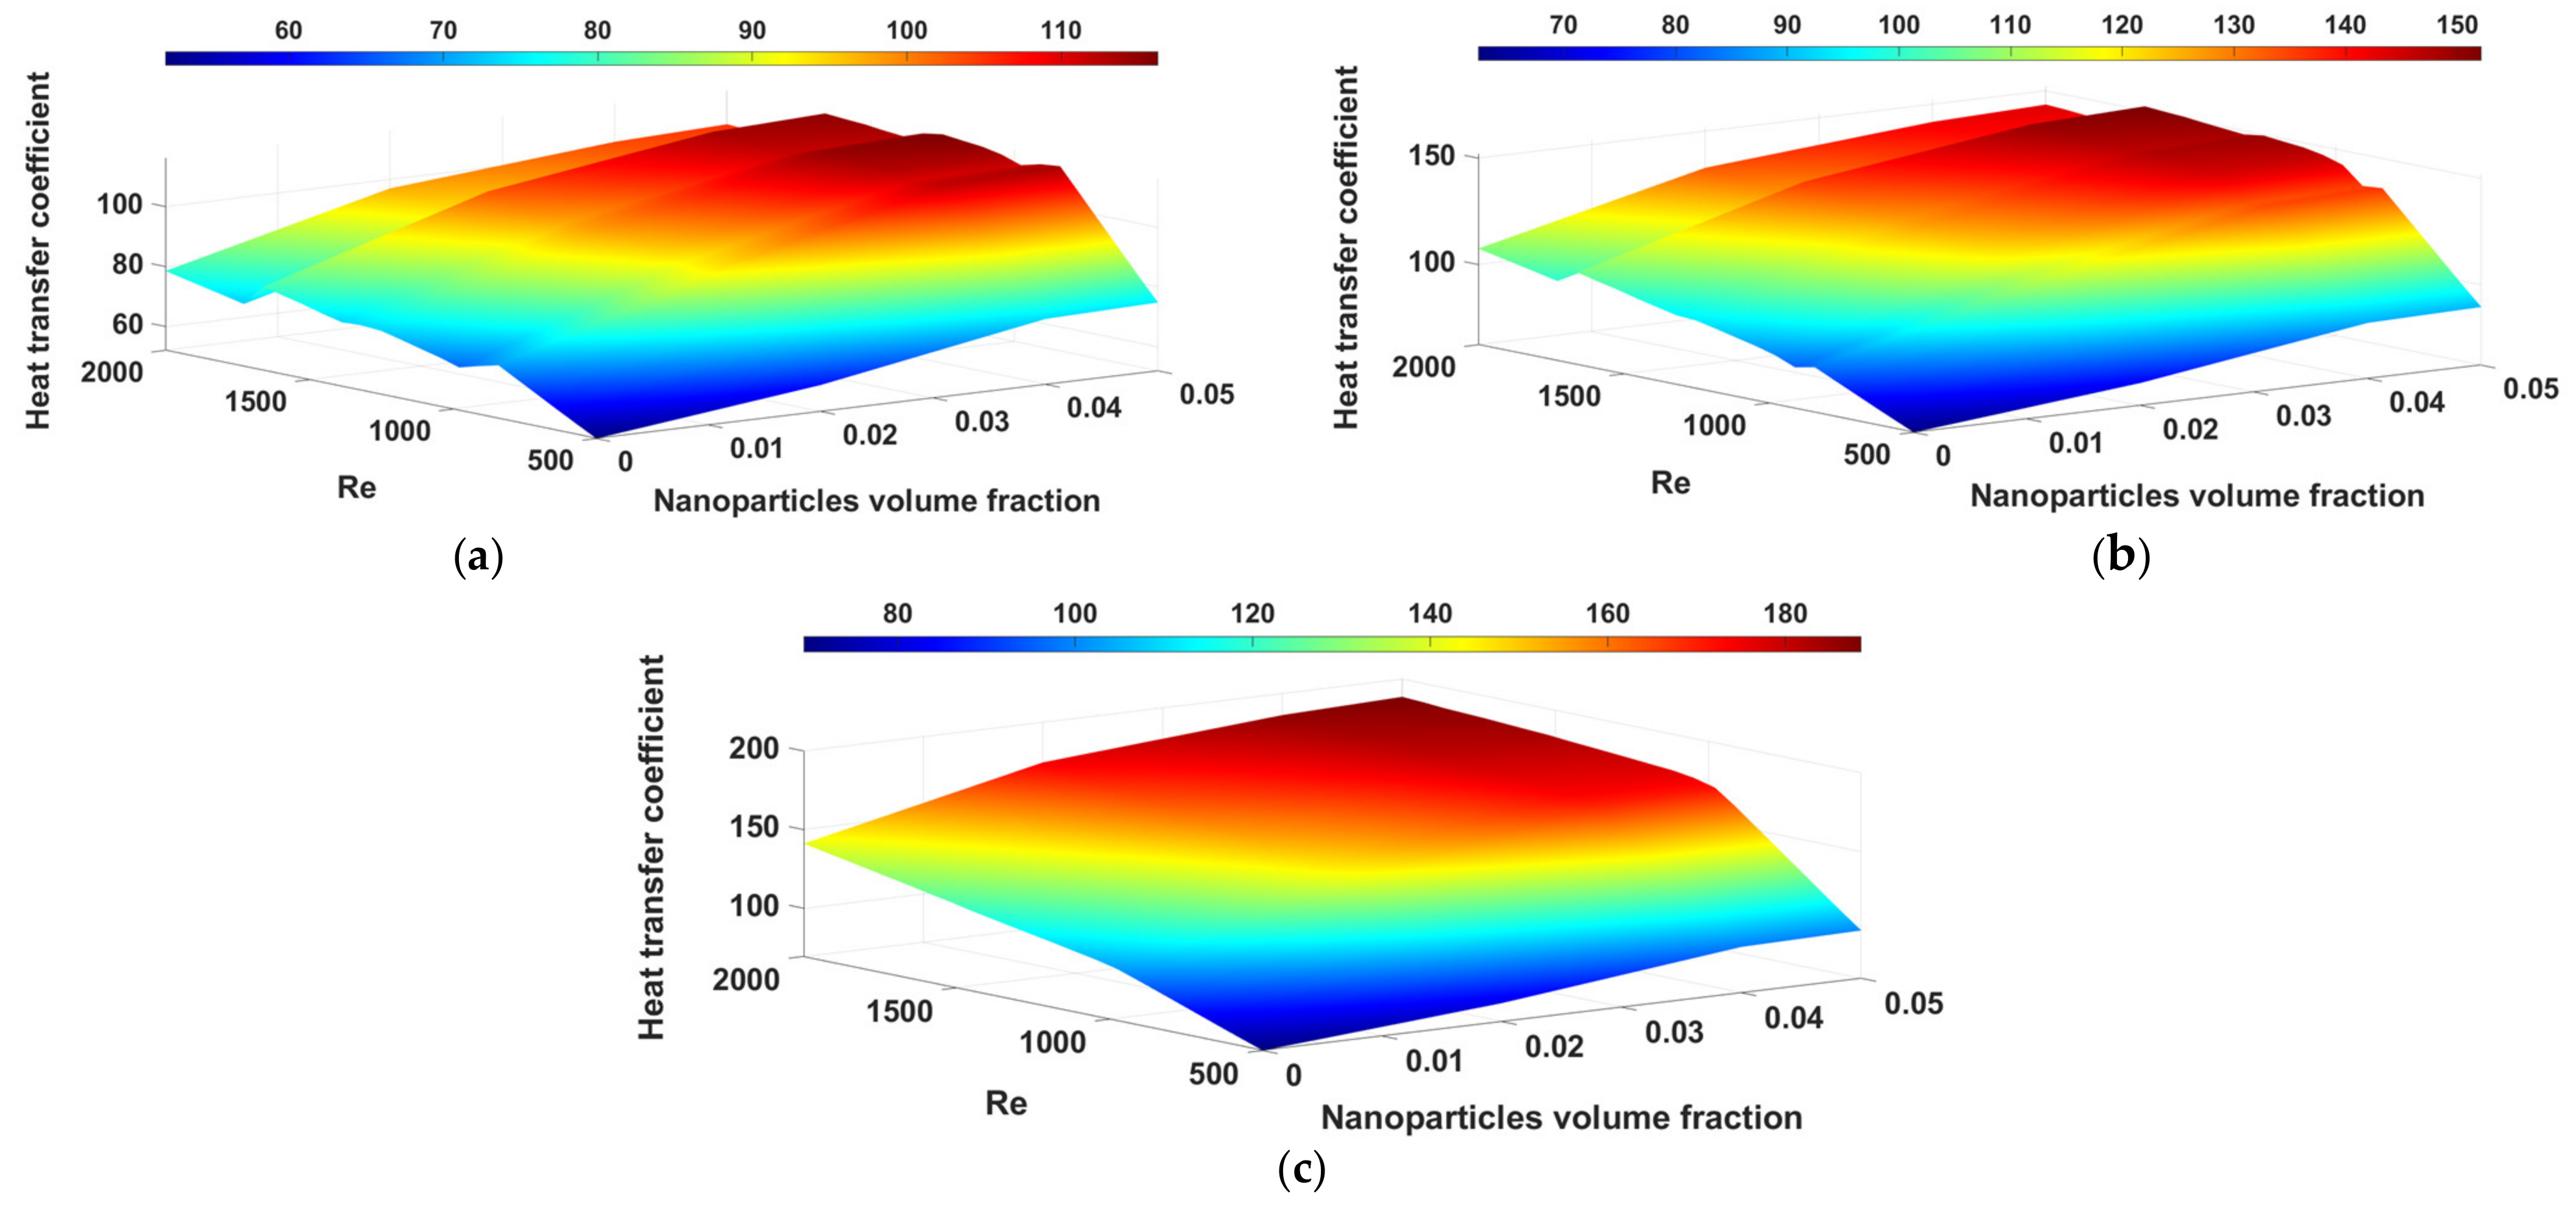
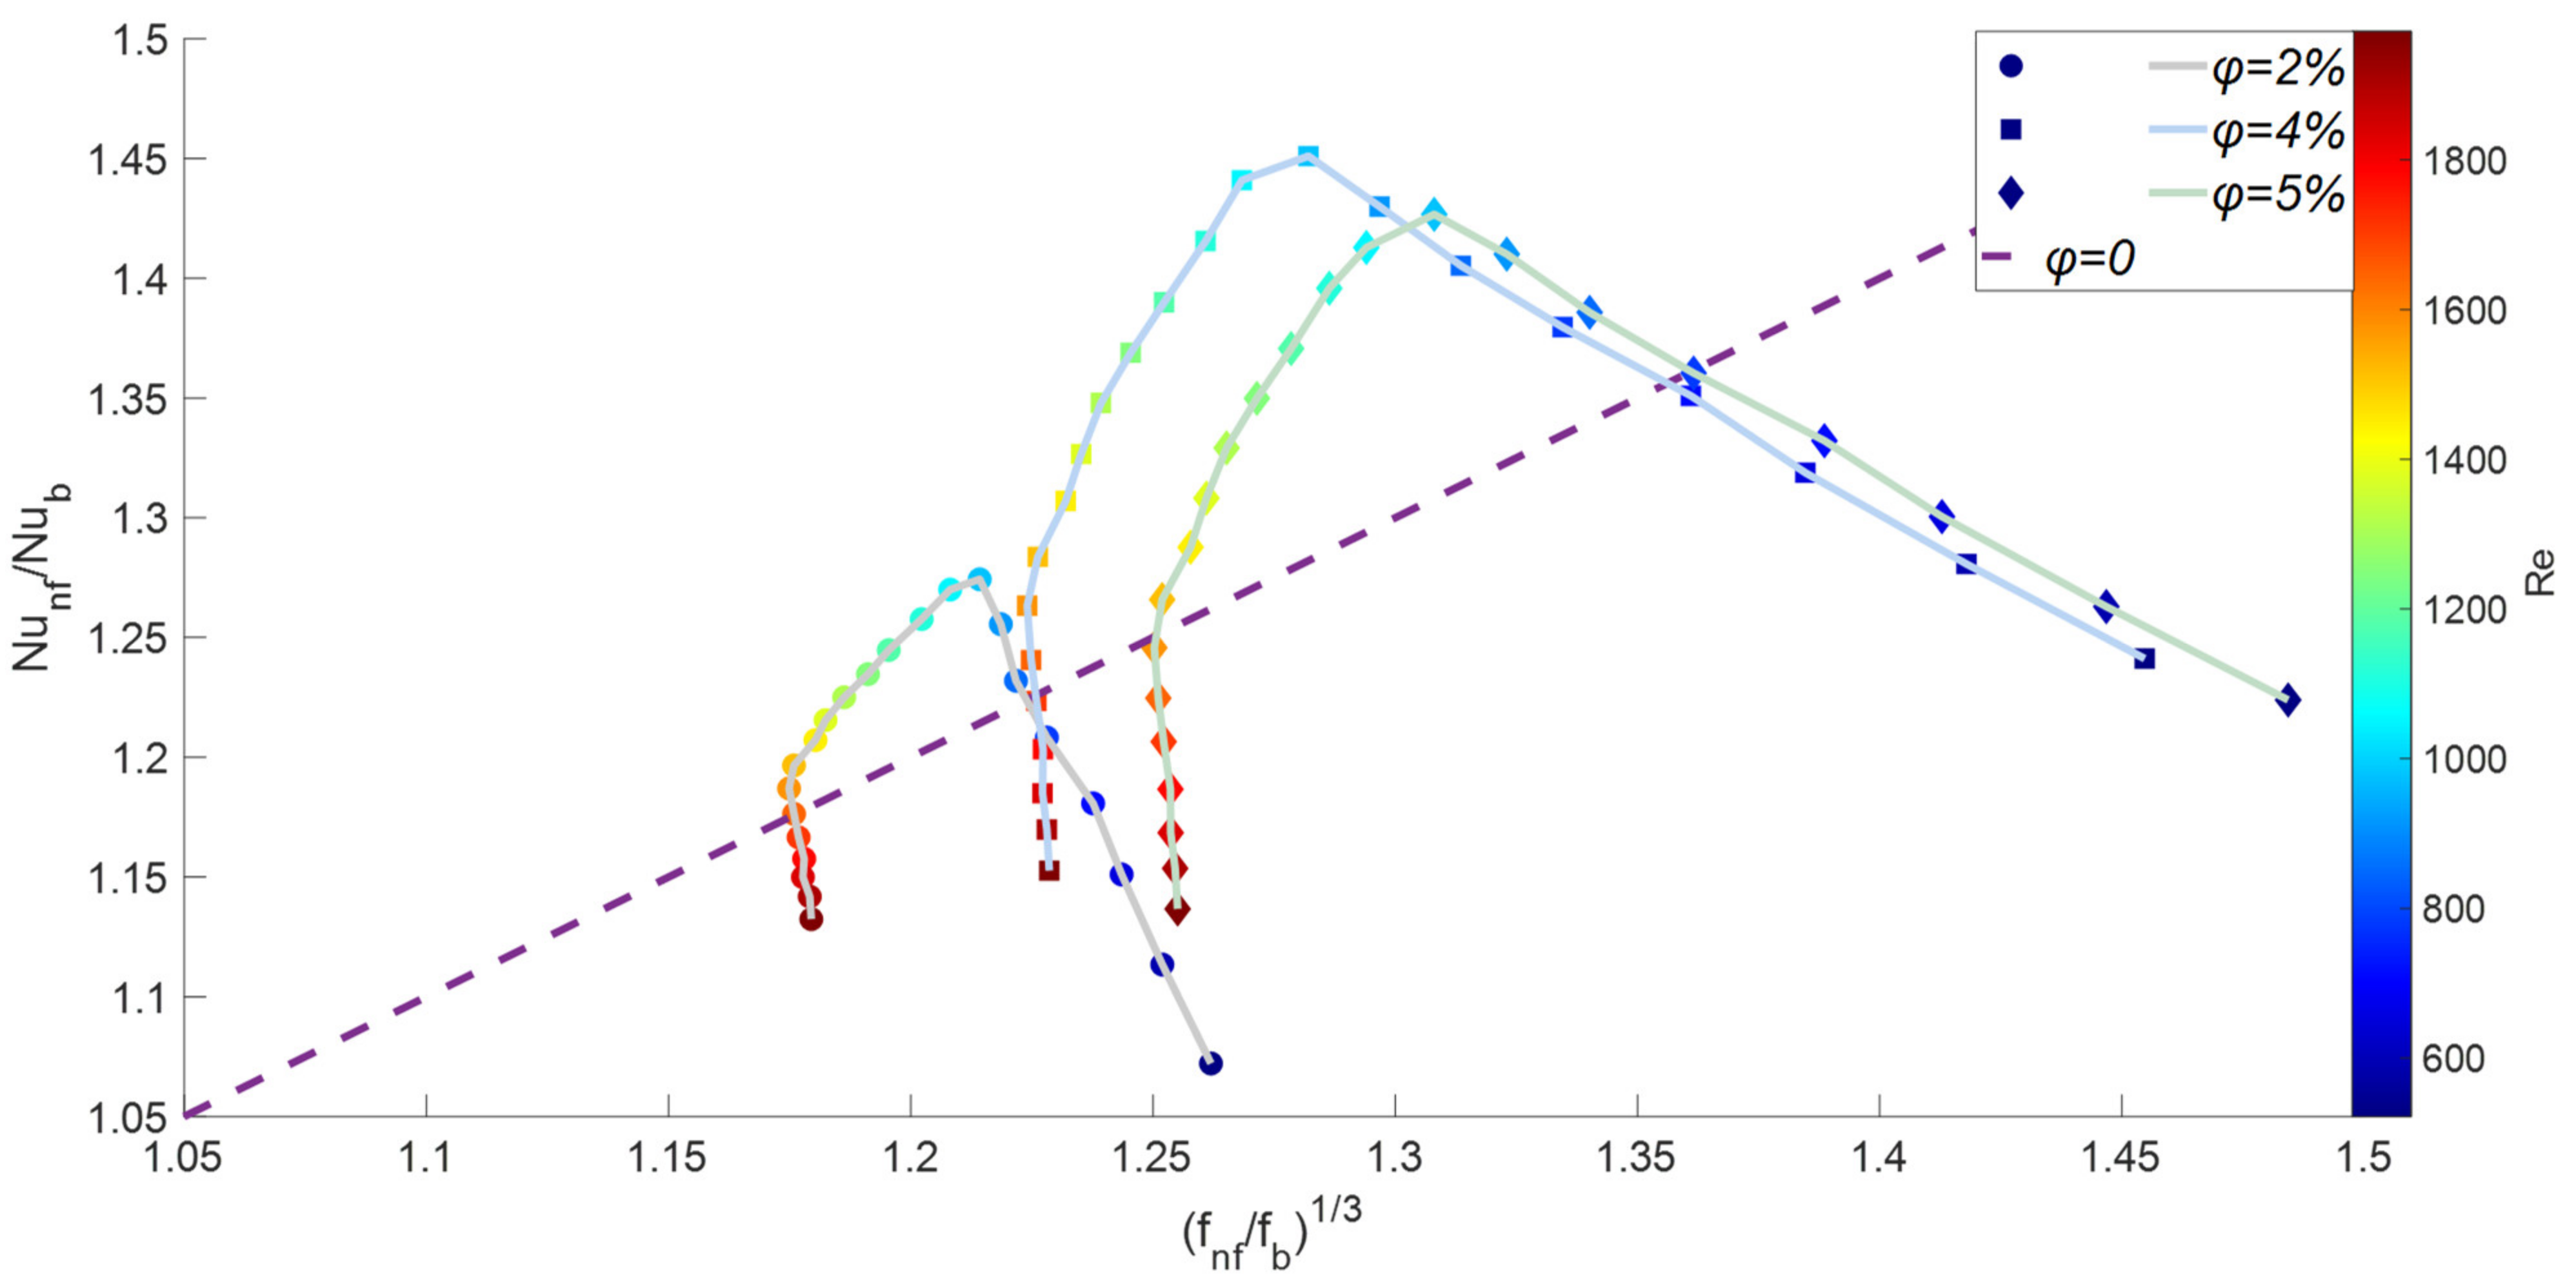
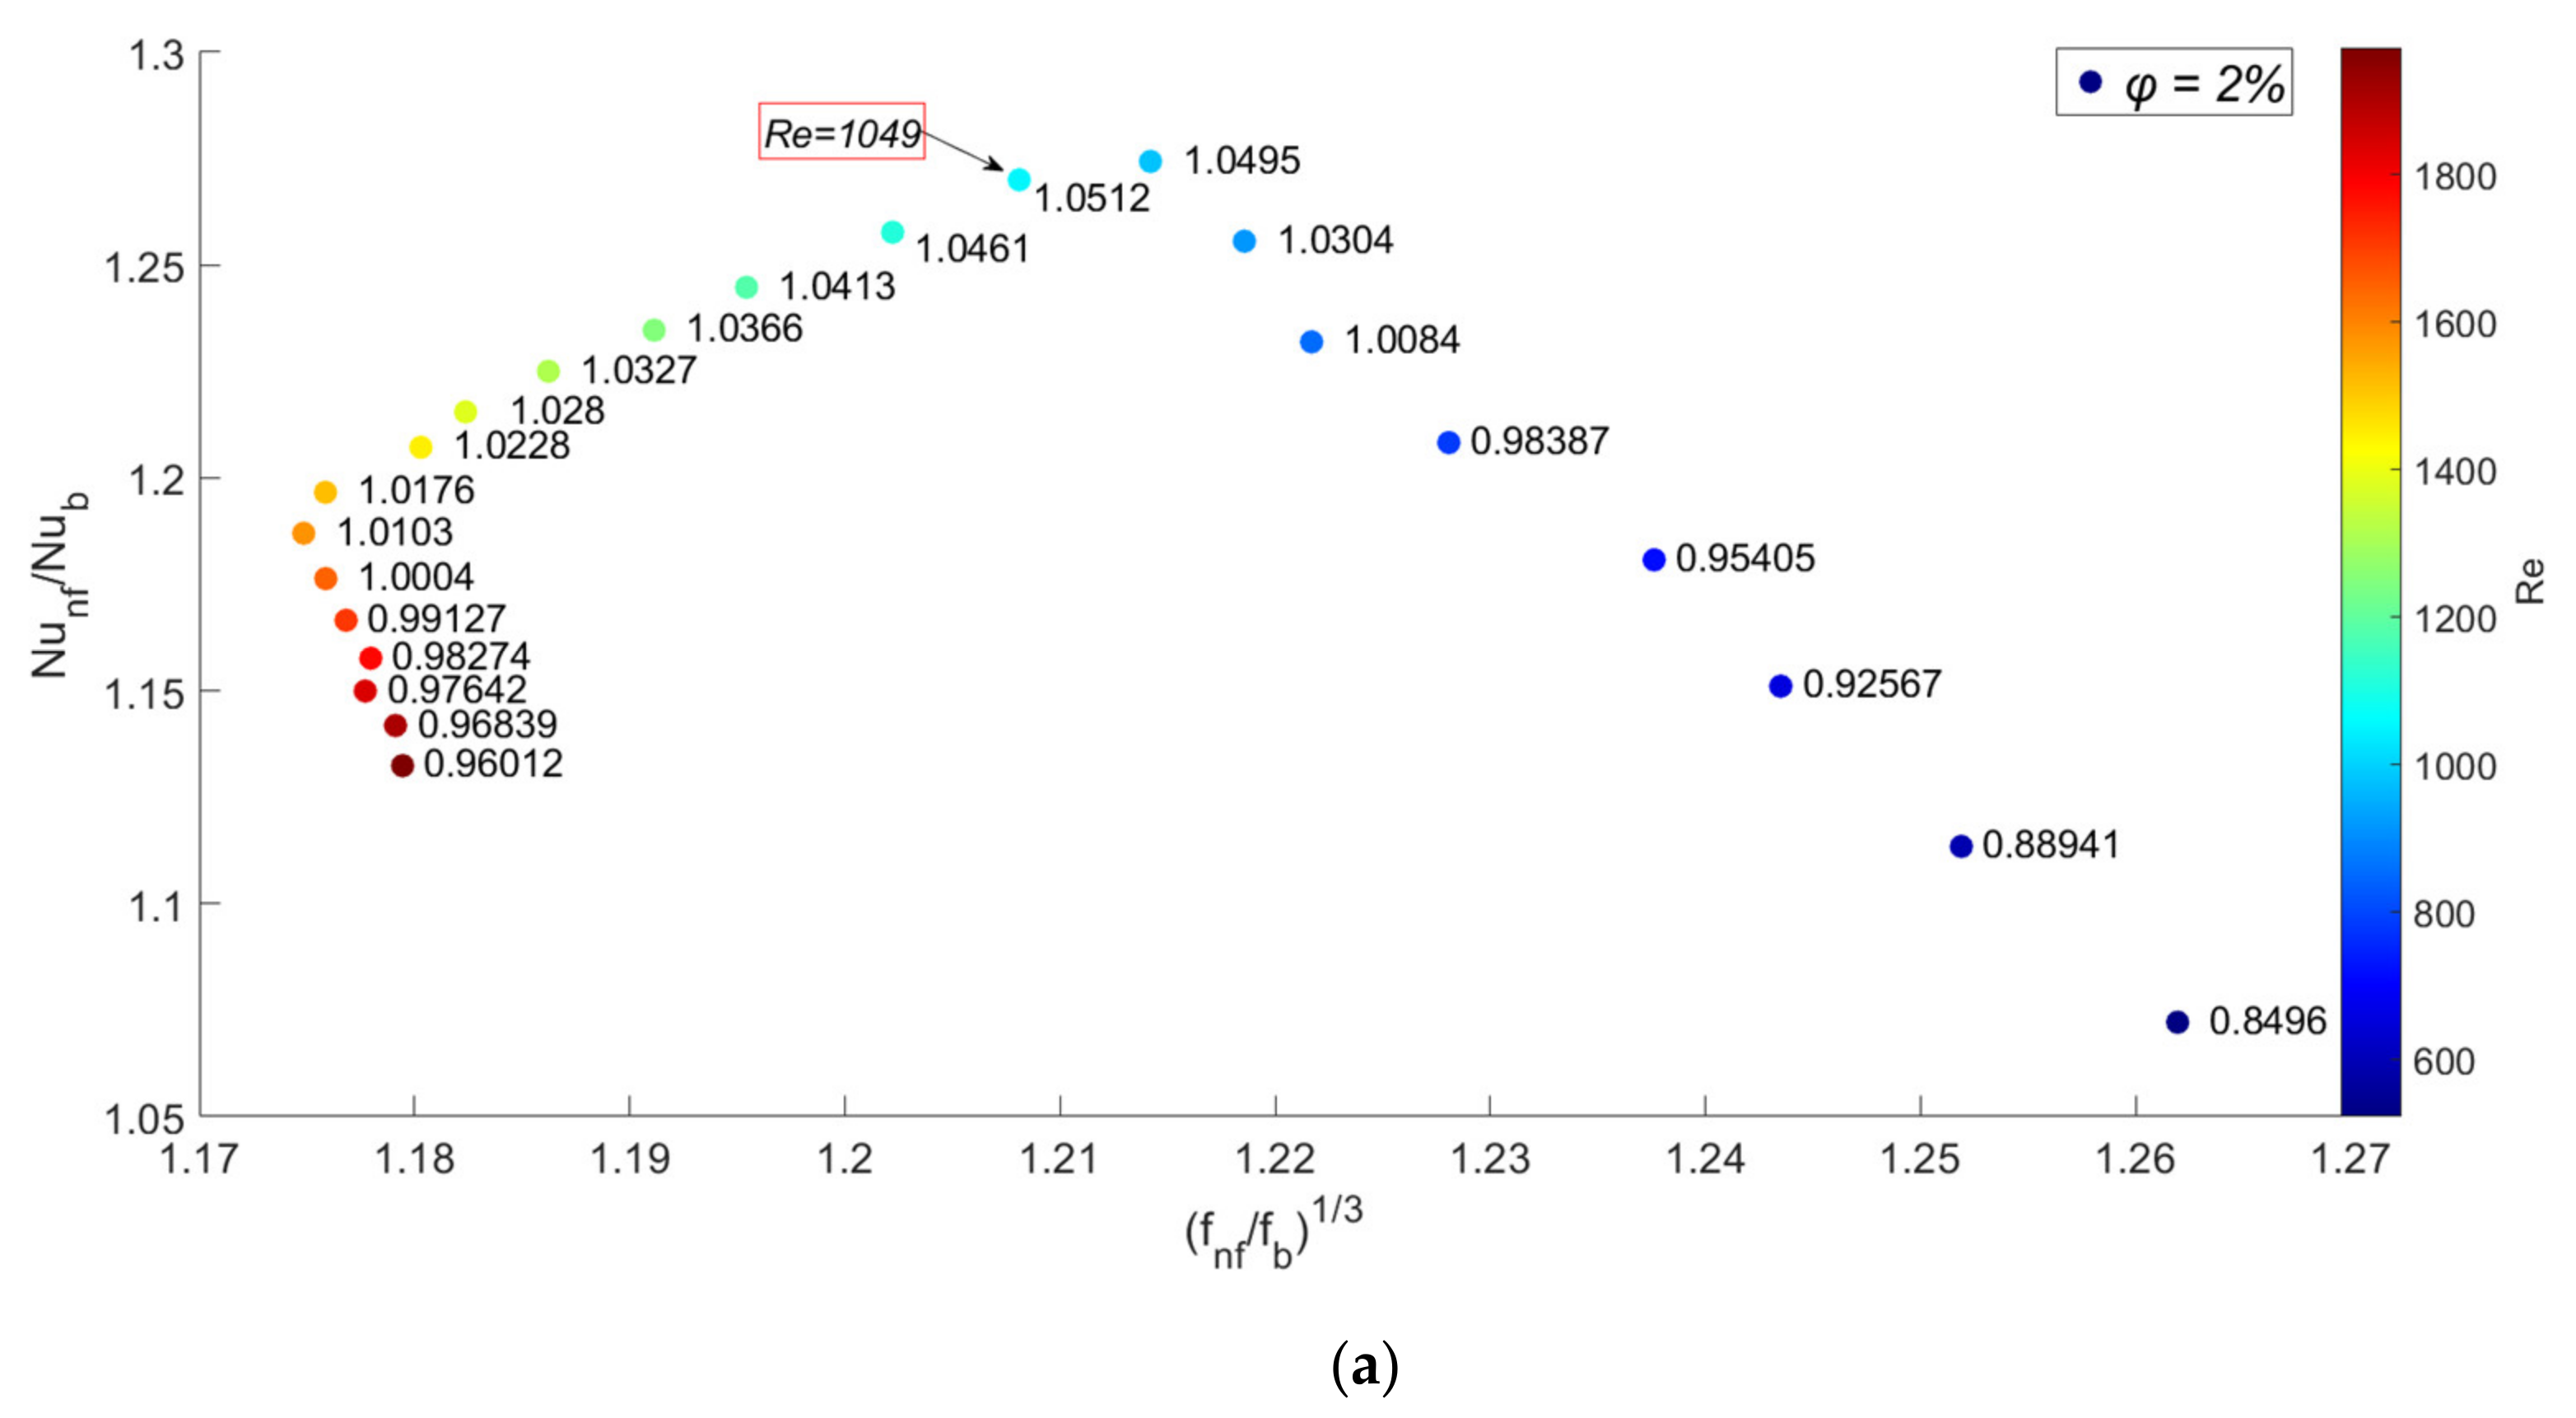
- For the same structural geometry, the heat transfer coefficient increases with the increase in Reynolds number. In addition, at any pumping power, the increase in the concentration of nanoparticles increases the heat transfer coefficient.
- (b)
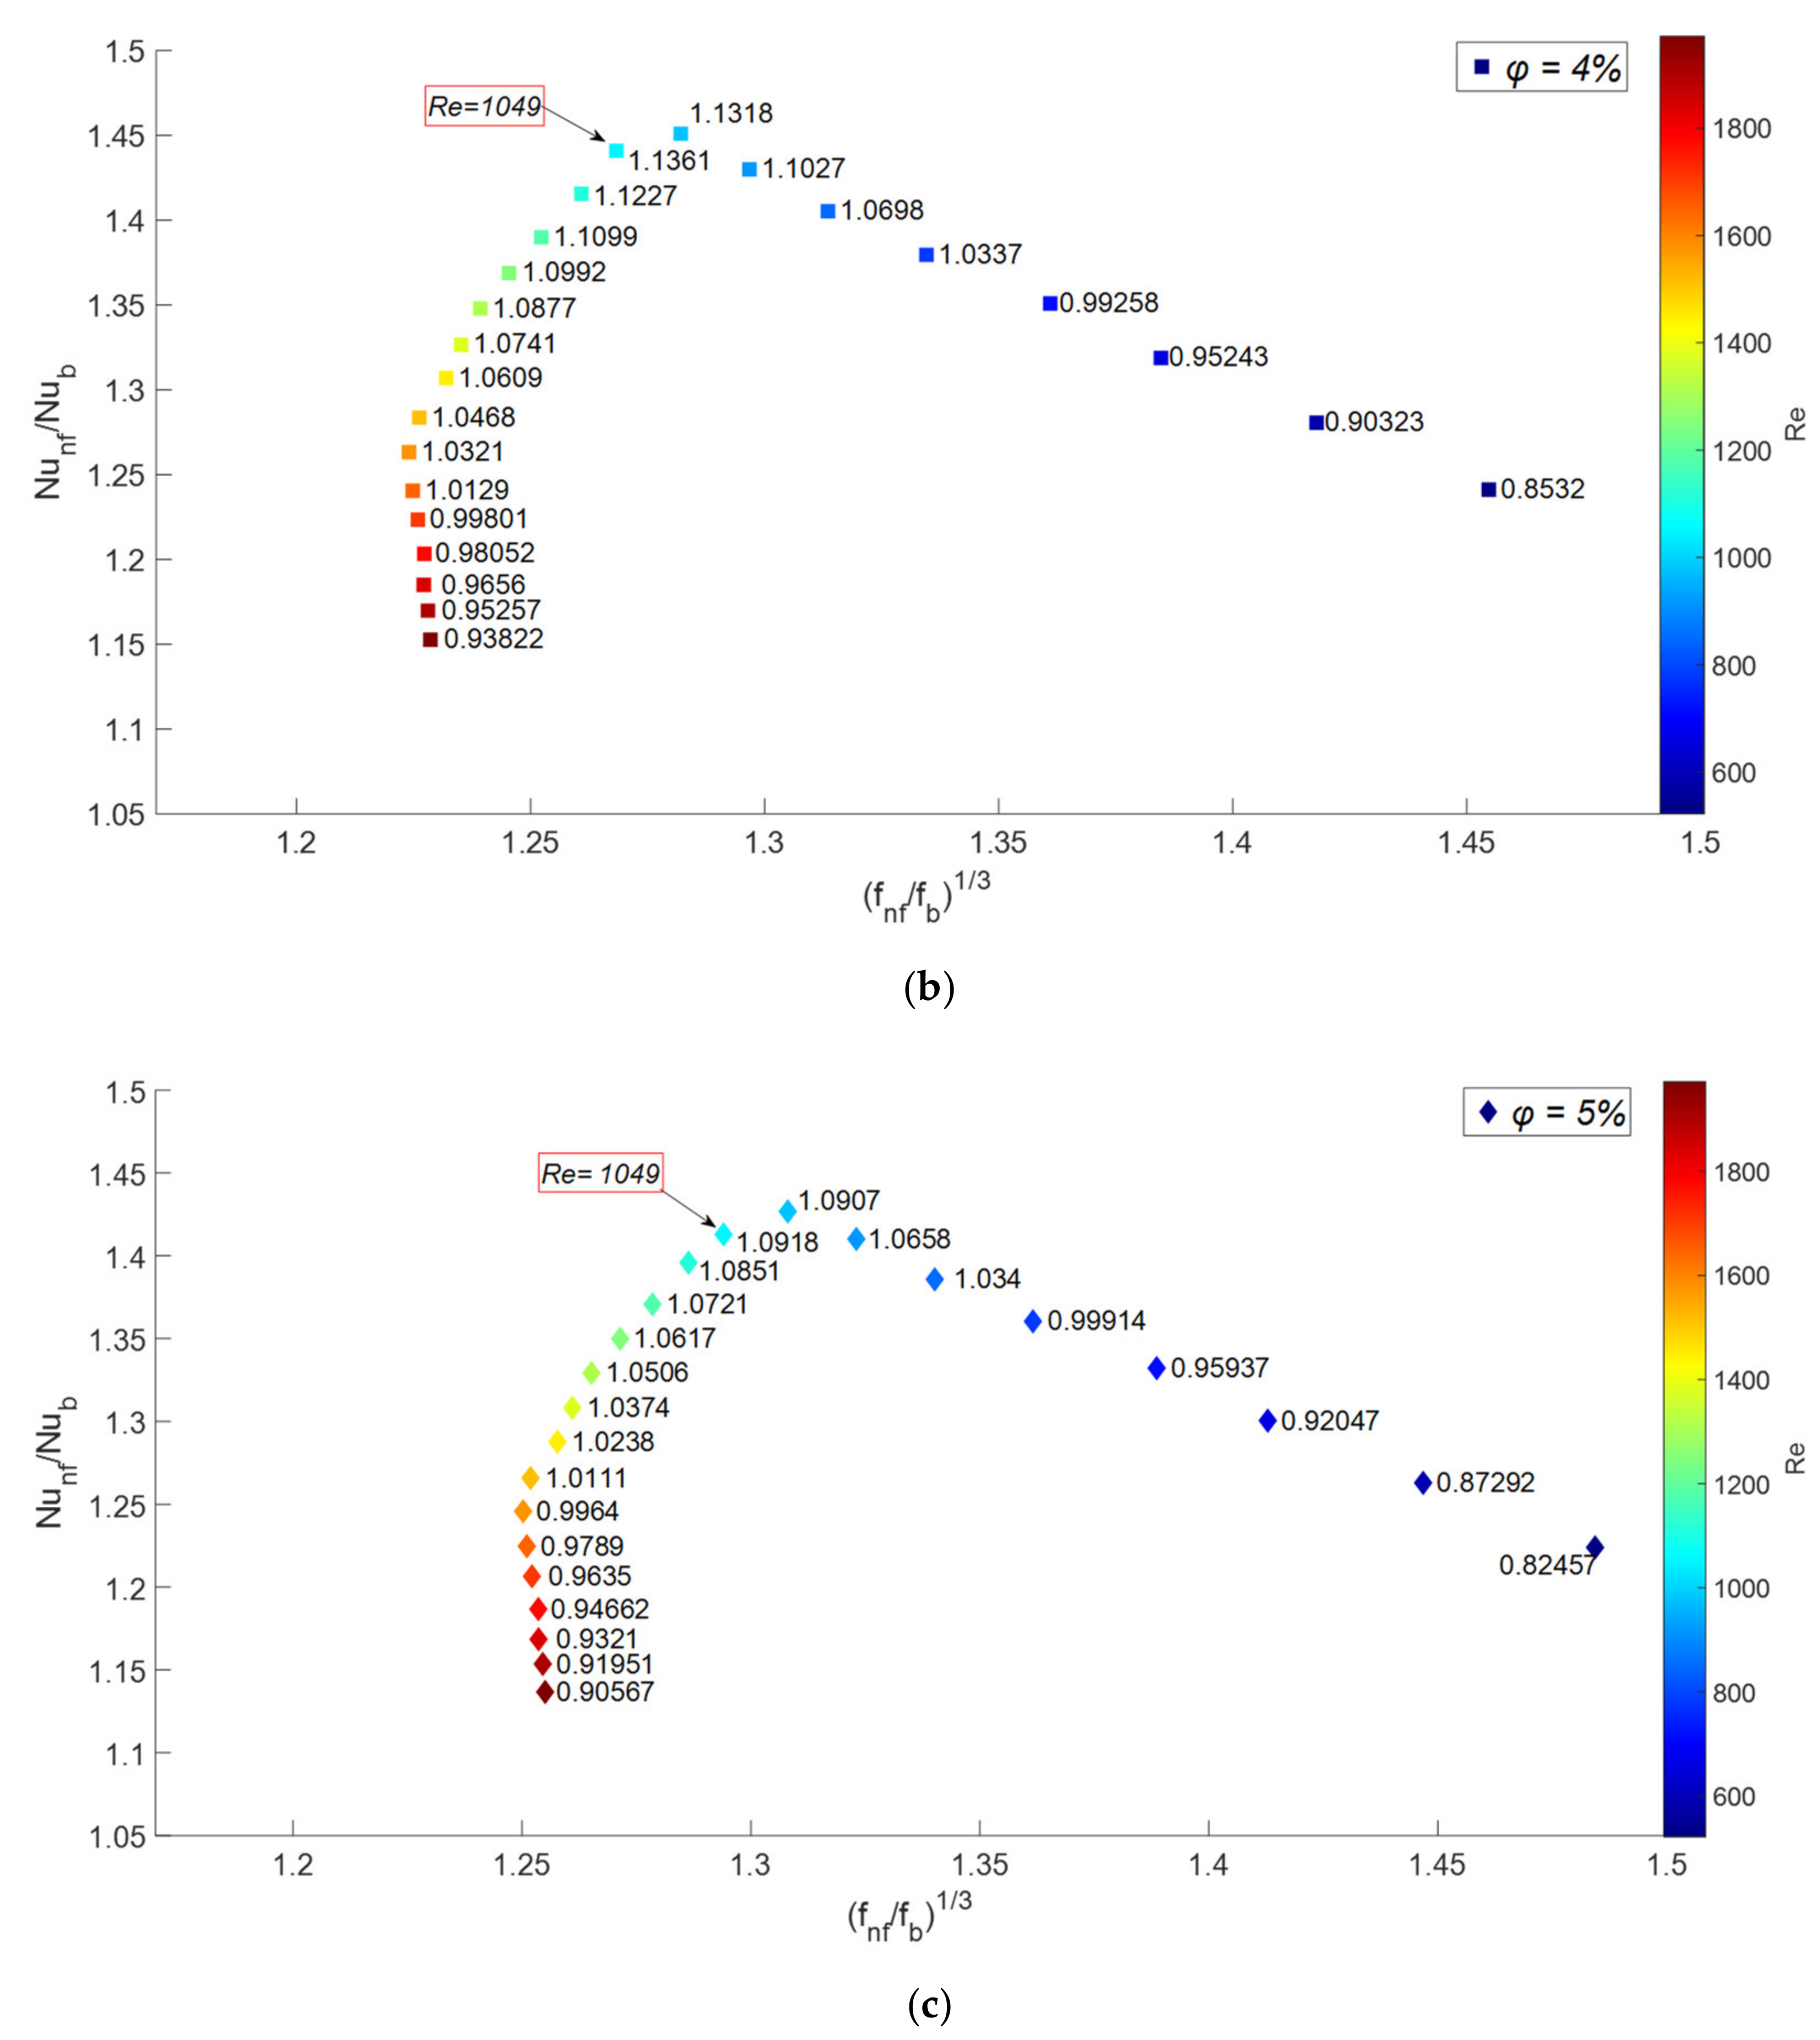
- In reference to (a), from a specific Reynolds number onward, due to the viscosity, the slope of the friction resistance changes decreases. Therefore, the heat transfer coefficient increases with the Reynolds number, and at higher Reynolds numbers, the slope of the increasing heat transfer coefficient decreases.
- (c)
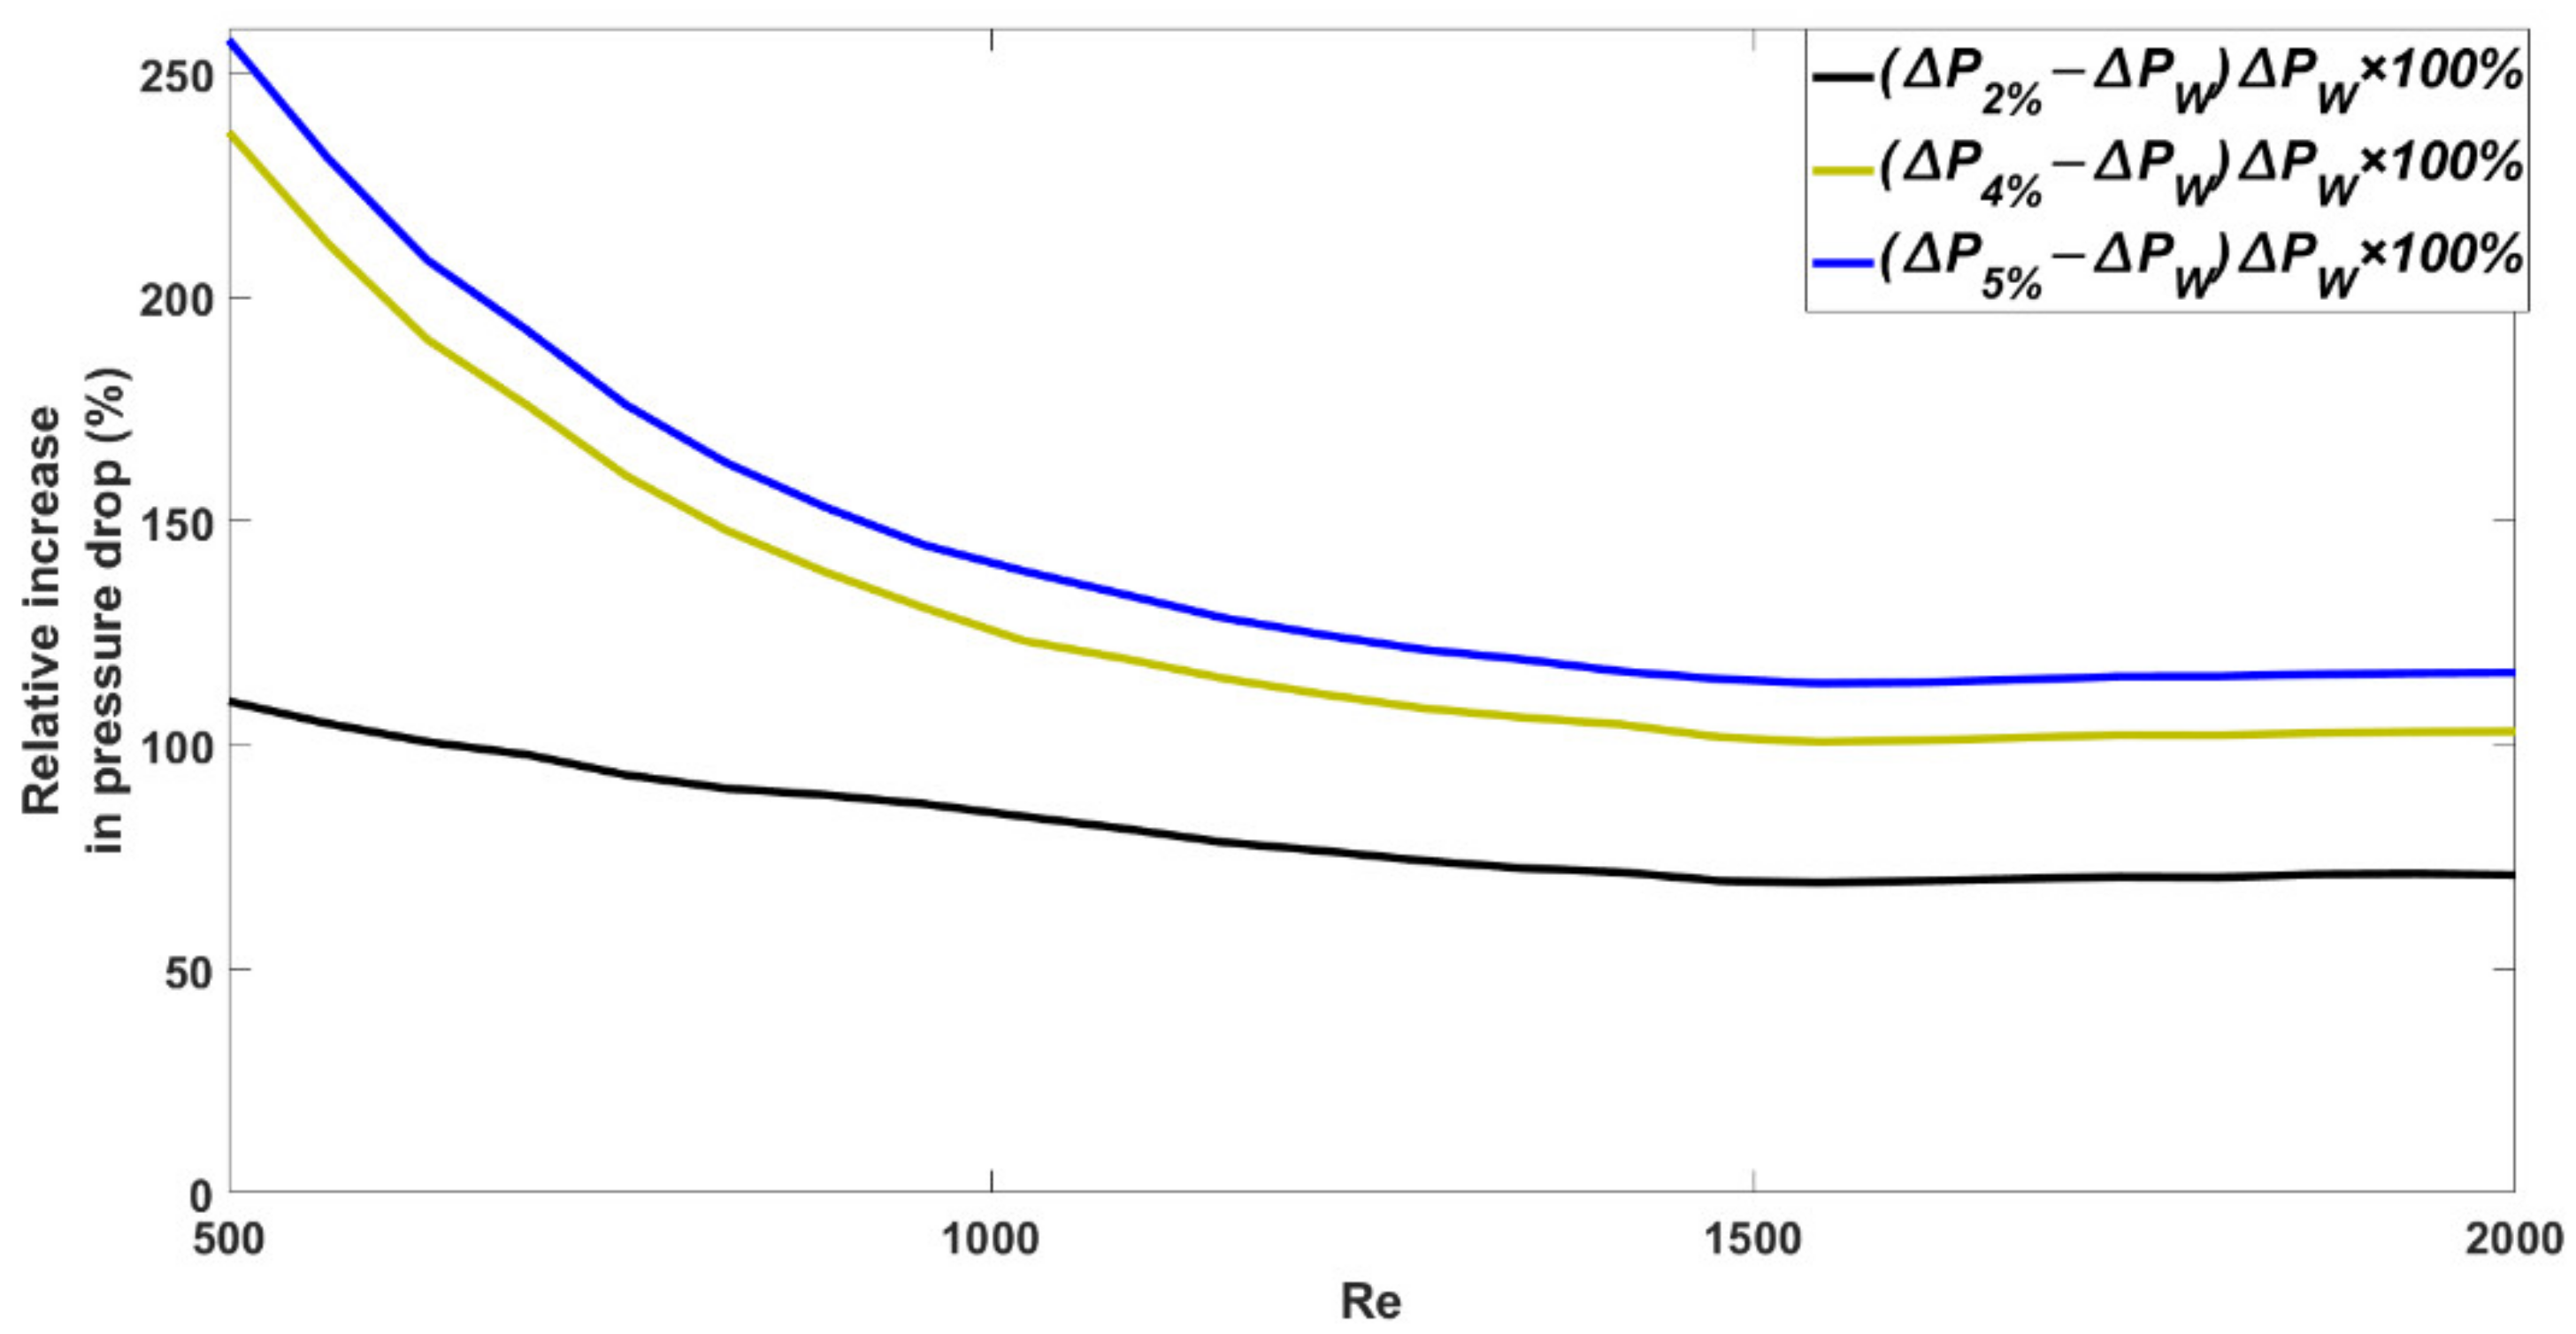
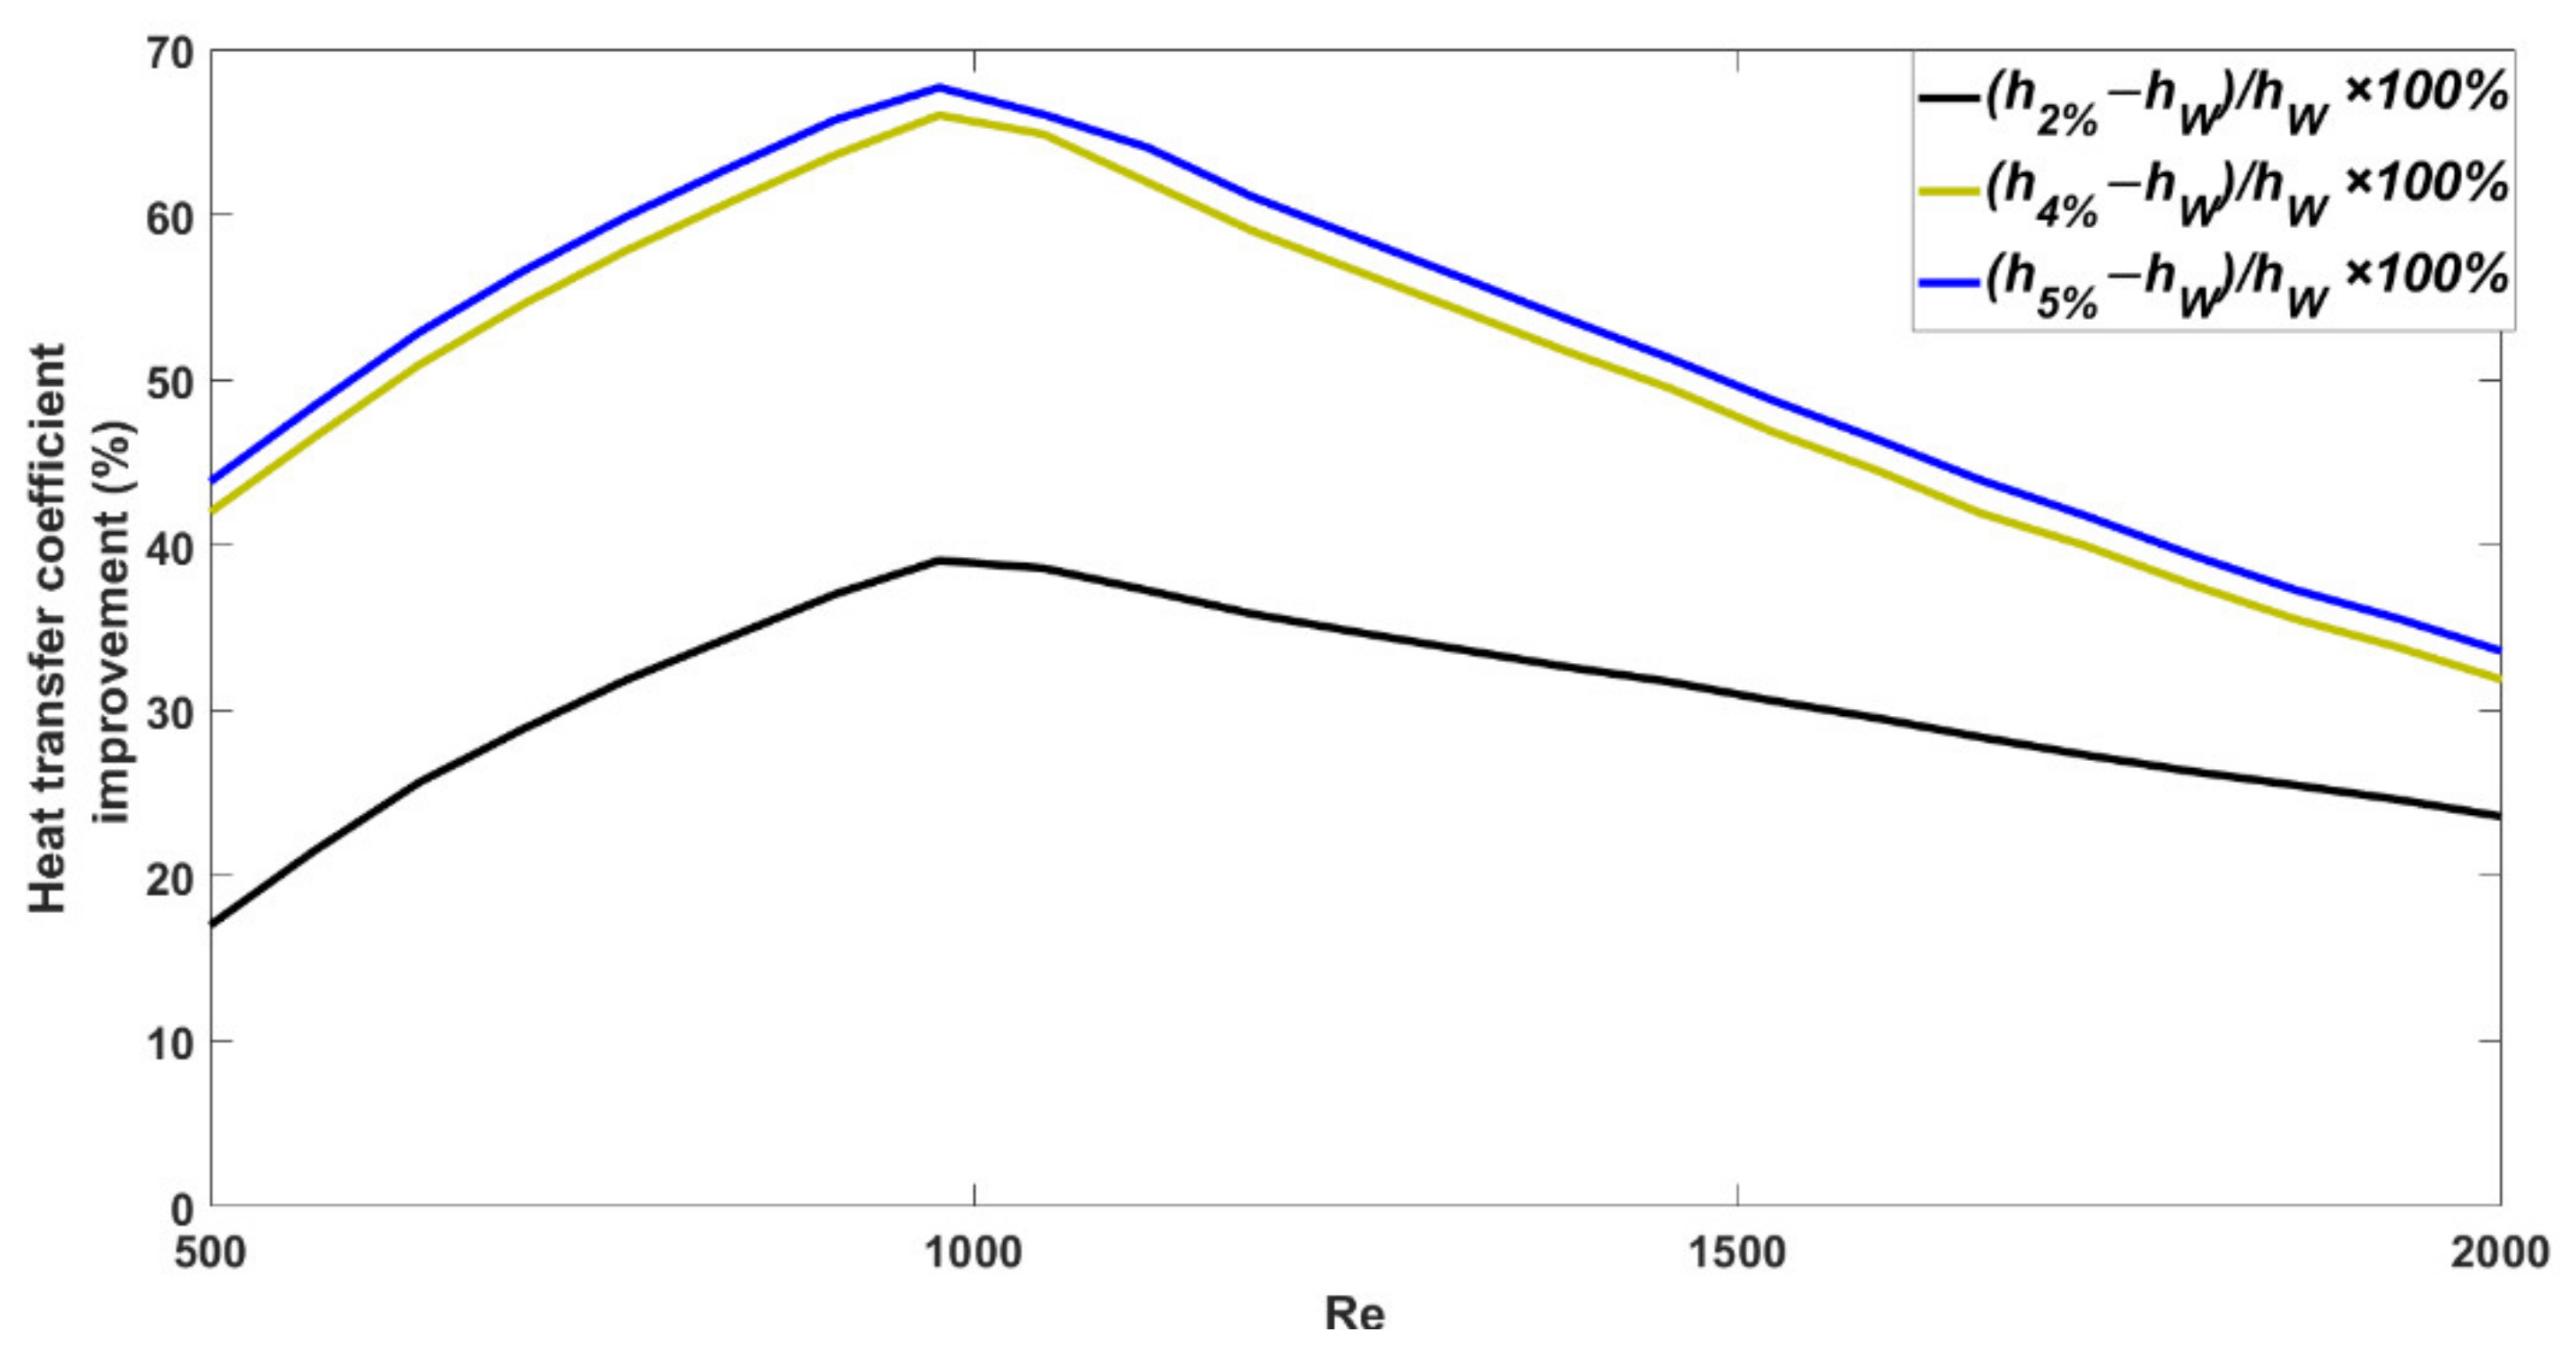
- Adding nanoparticles to a base fluid affects the heat transfer coefficient in two different ways. While increasing the nanoparticle concentration enhances the heat transfer coefficient by increasing the thermal conductivity of the nanofluid, increasing the nanoparticle concentration can lead to a reduction in the temperature gradient at the wall of the channels. In this study, numerical results for the nanofluid with a volume fraction of 5% in the cooling jacket channels with 8 turns show a very small heat transfer coefficient enhancement resulting from a significant decrease in temperature gradient at the channel walls.
- (d)
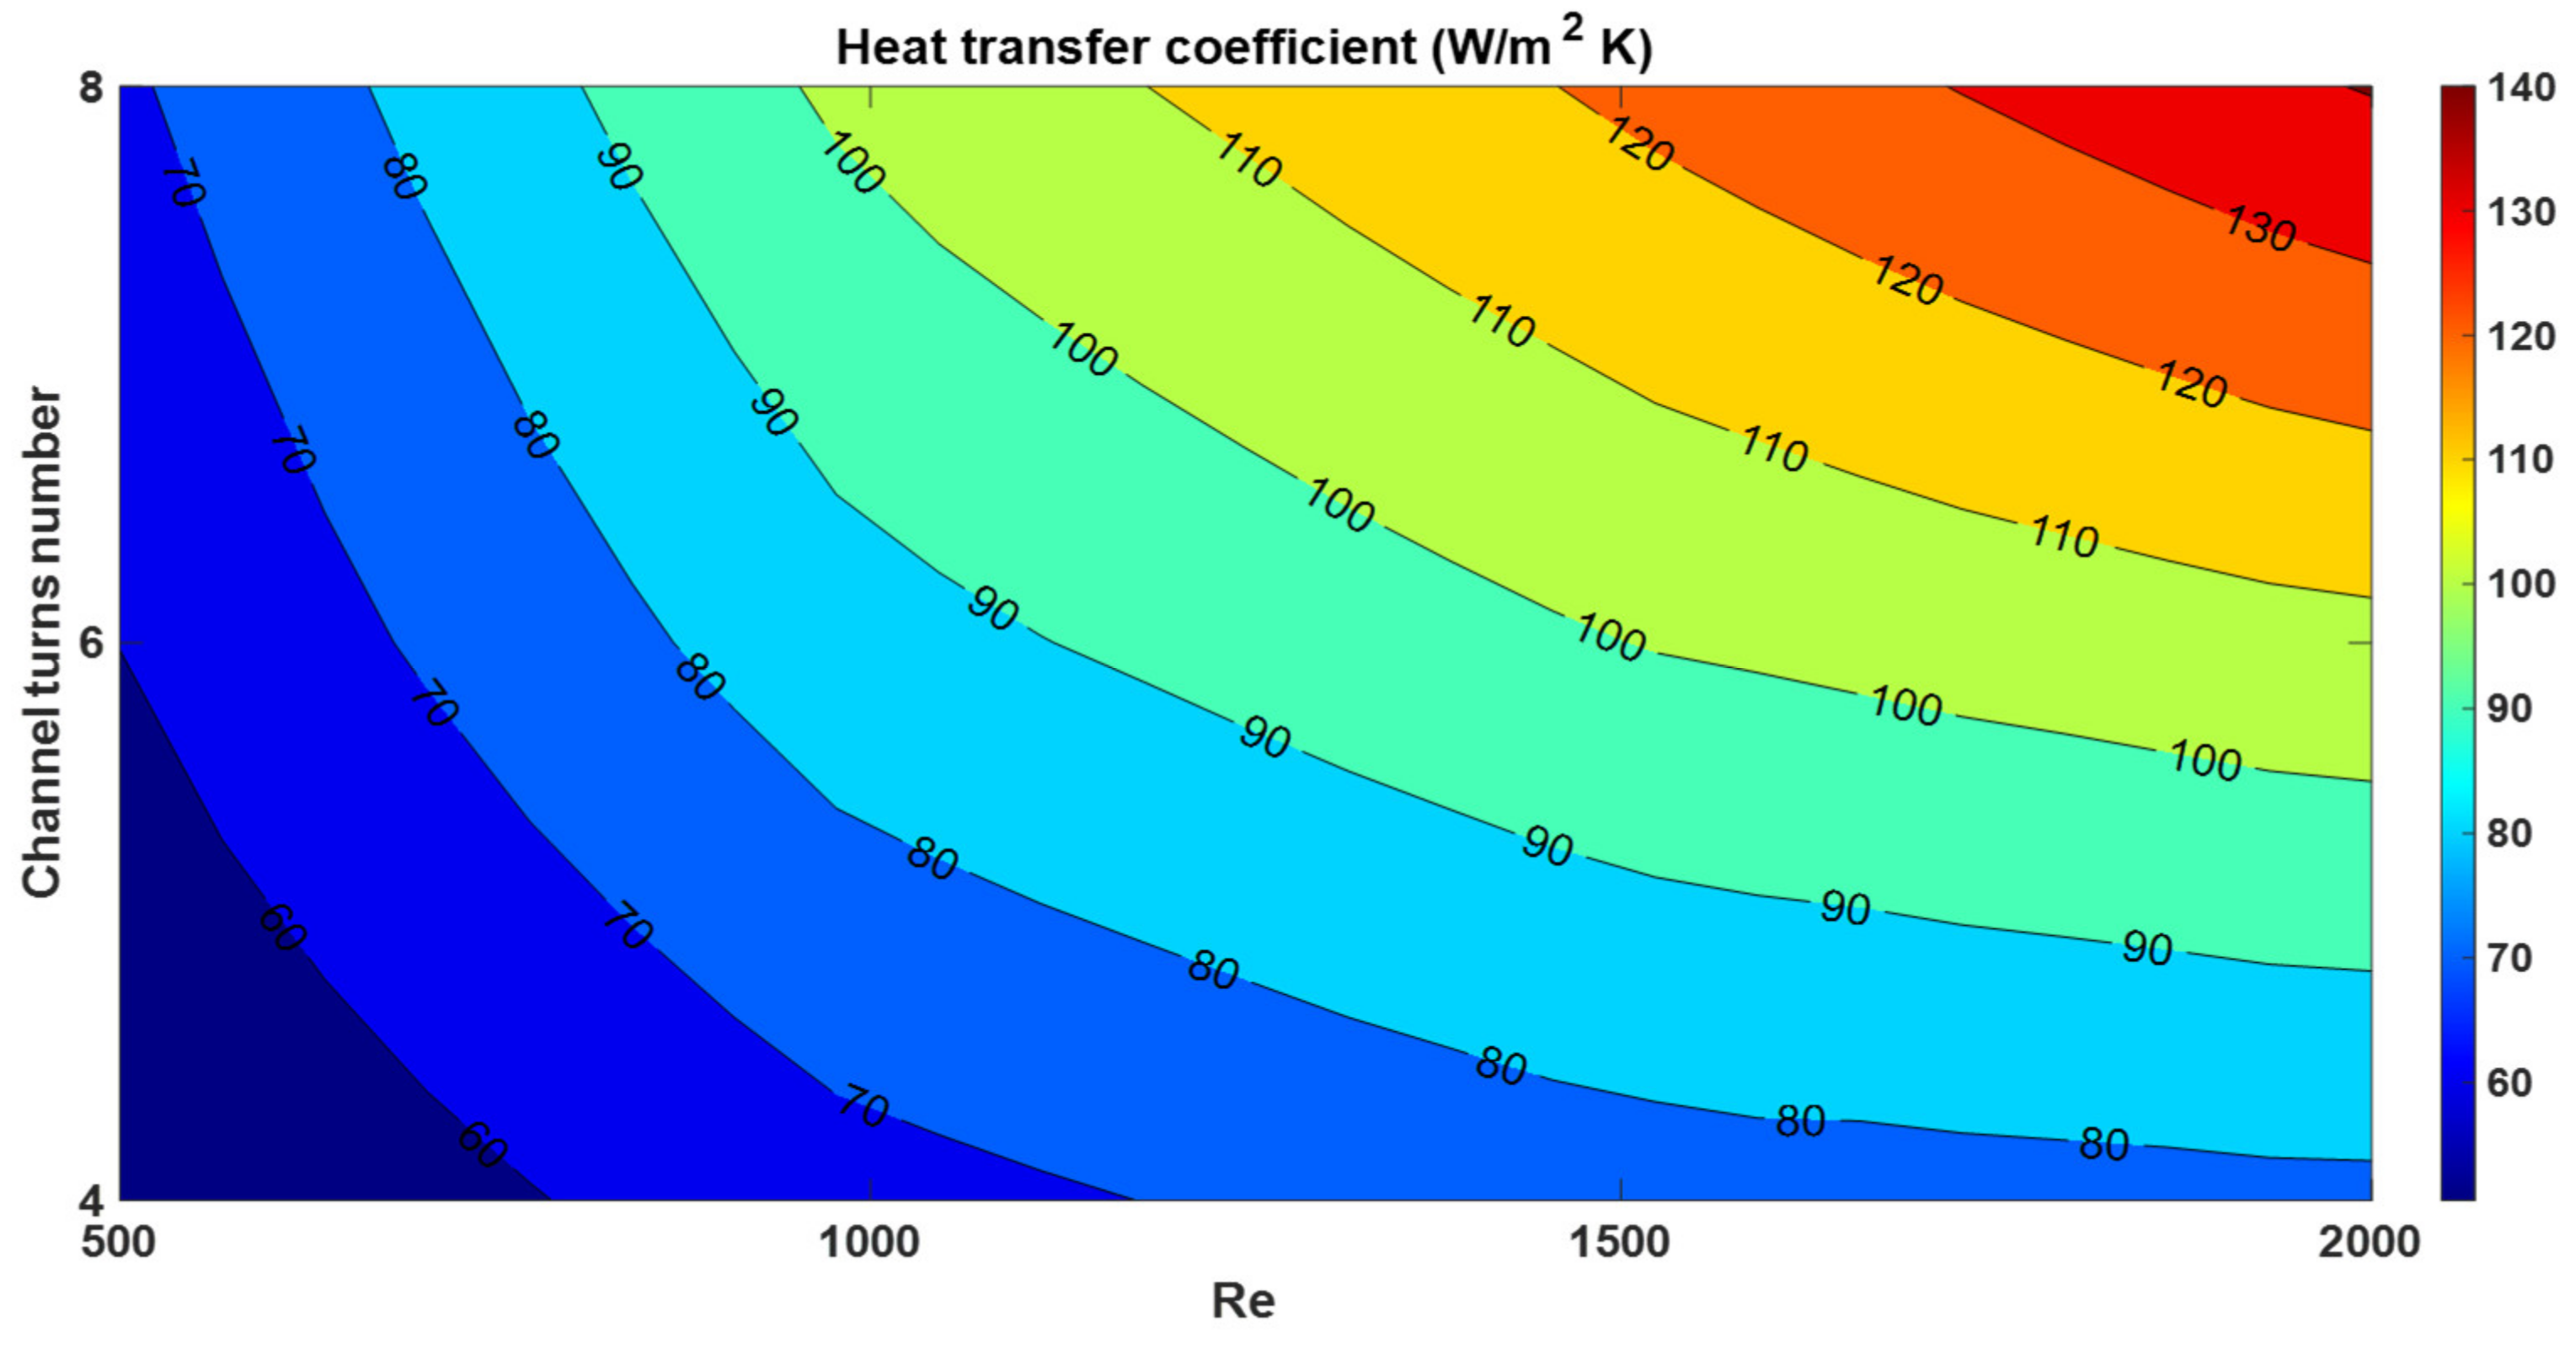
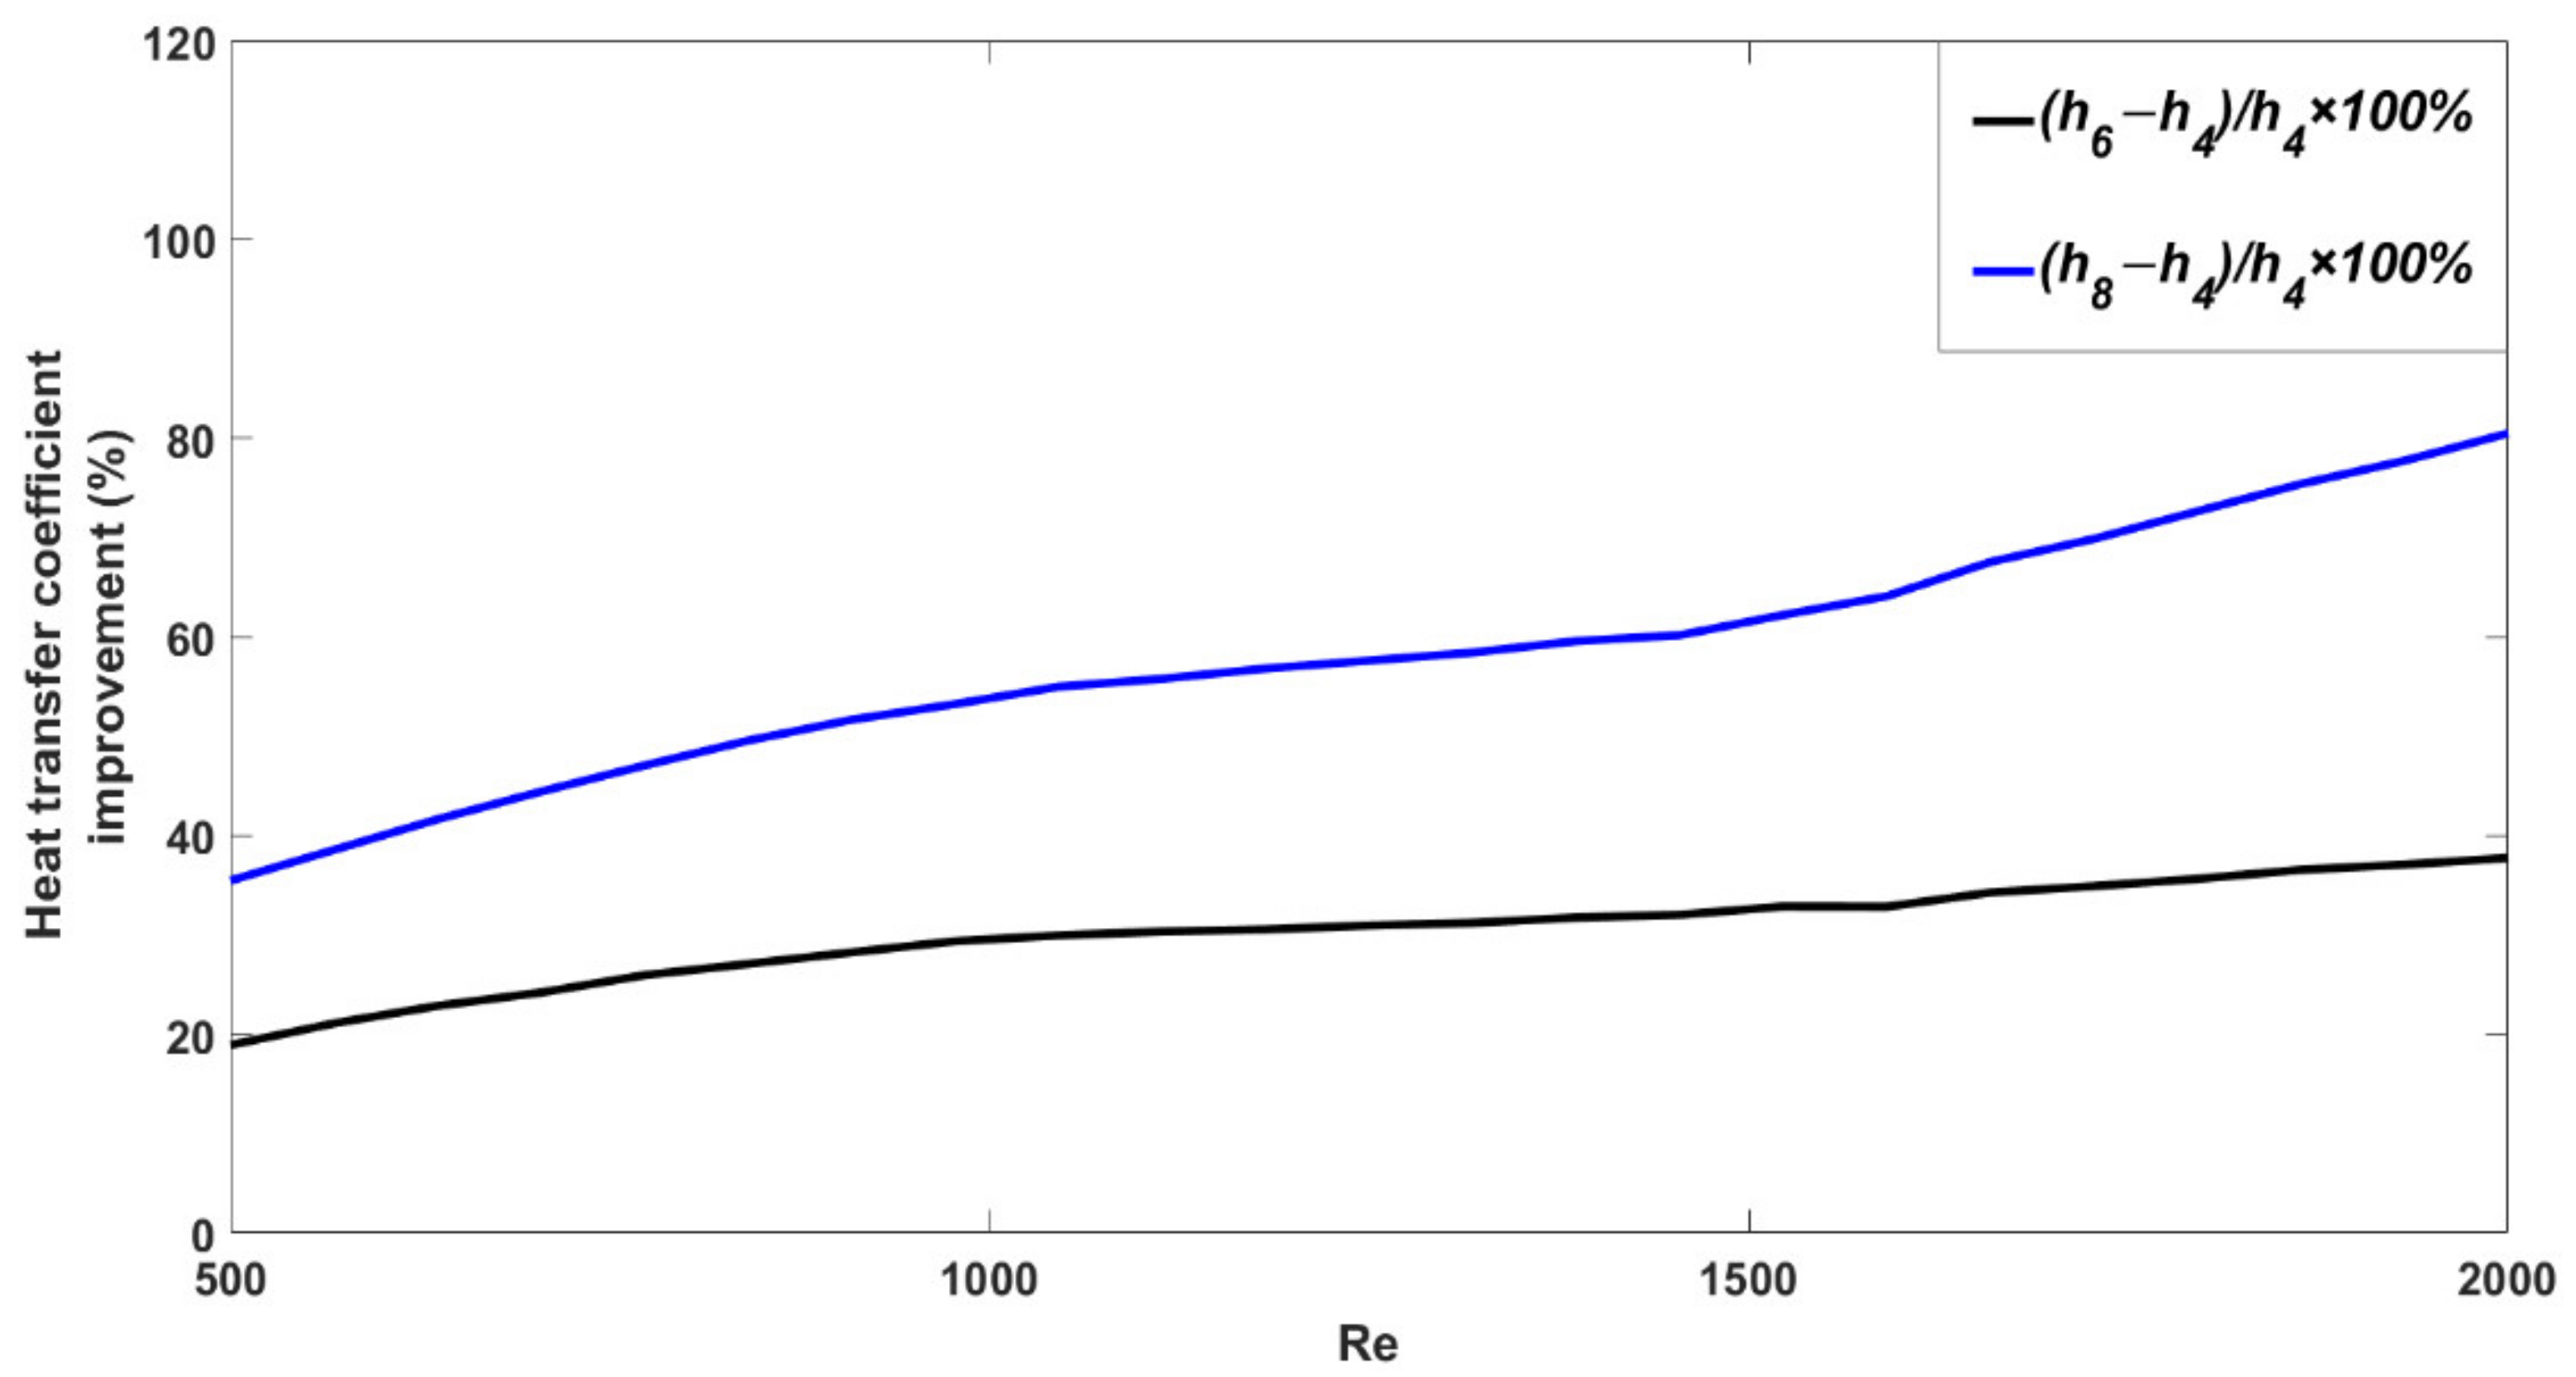
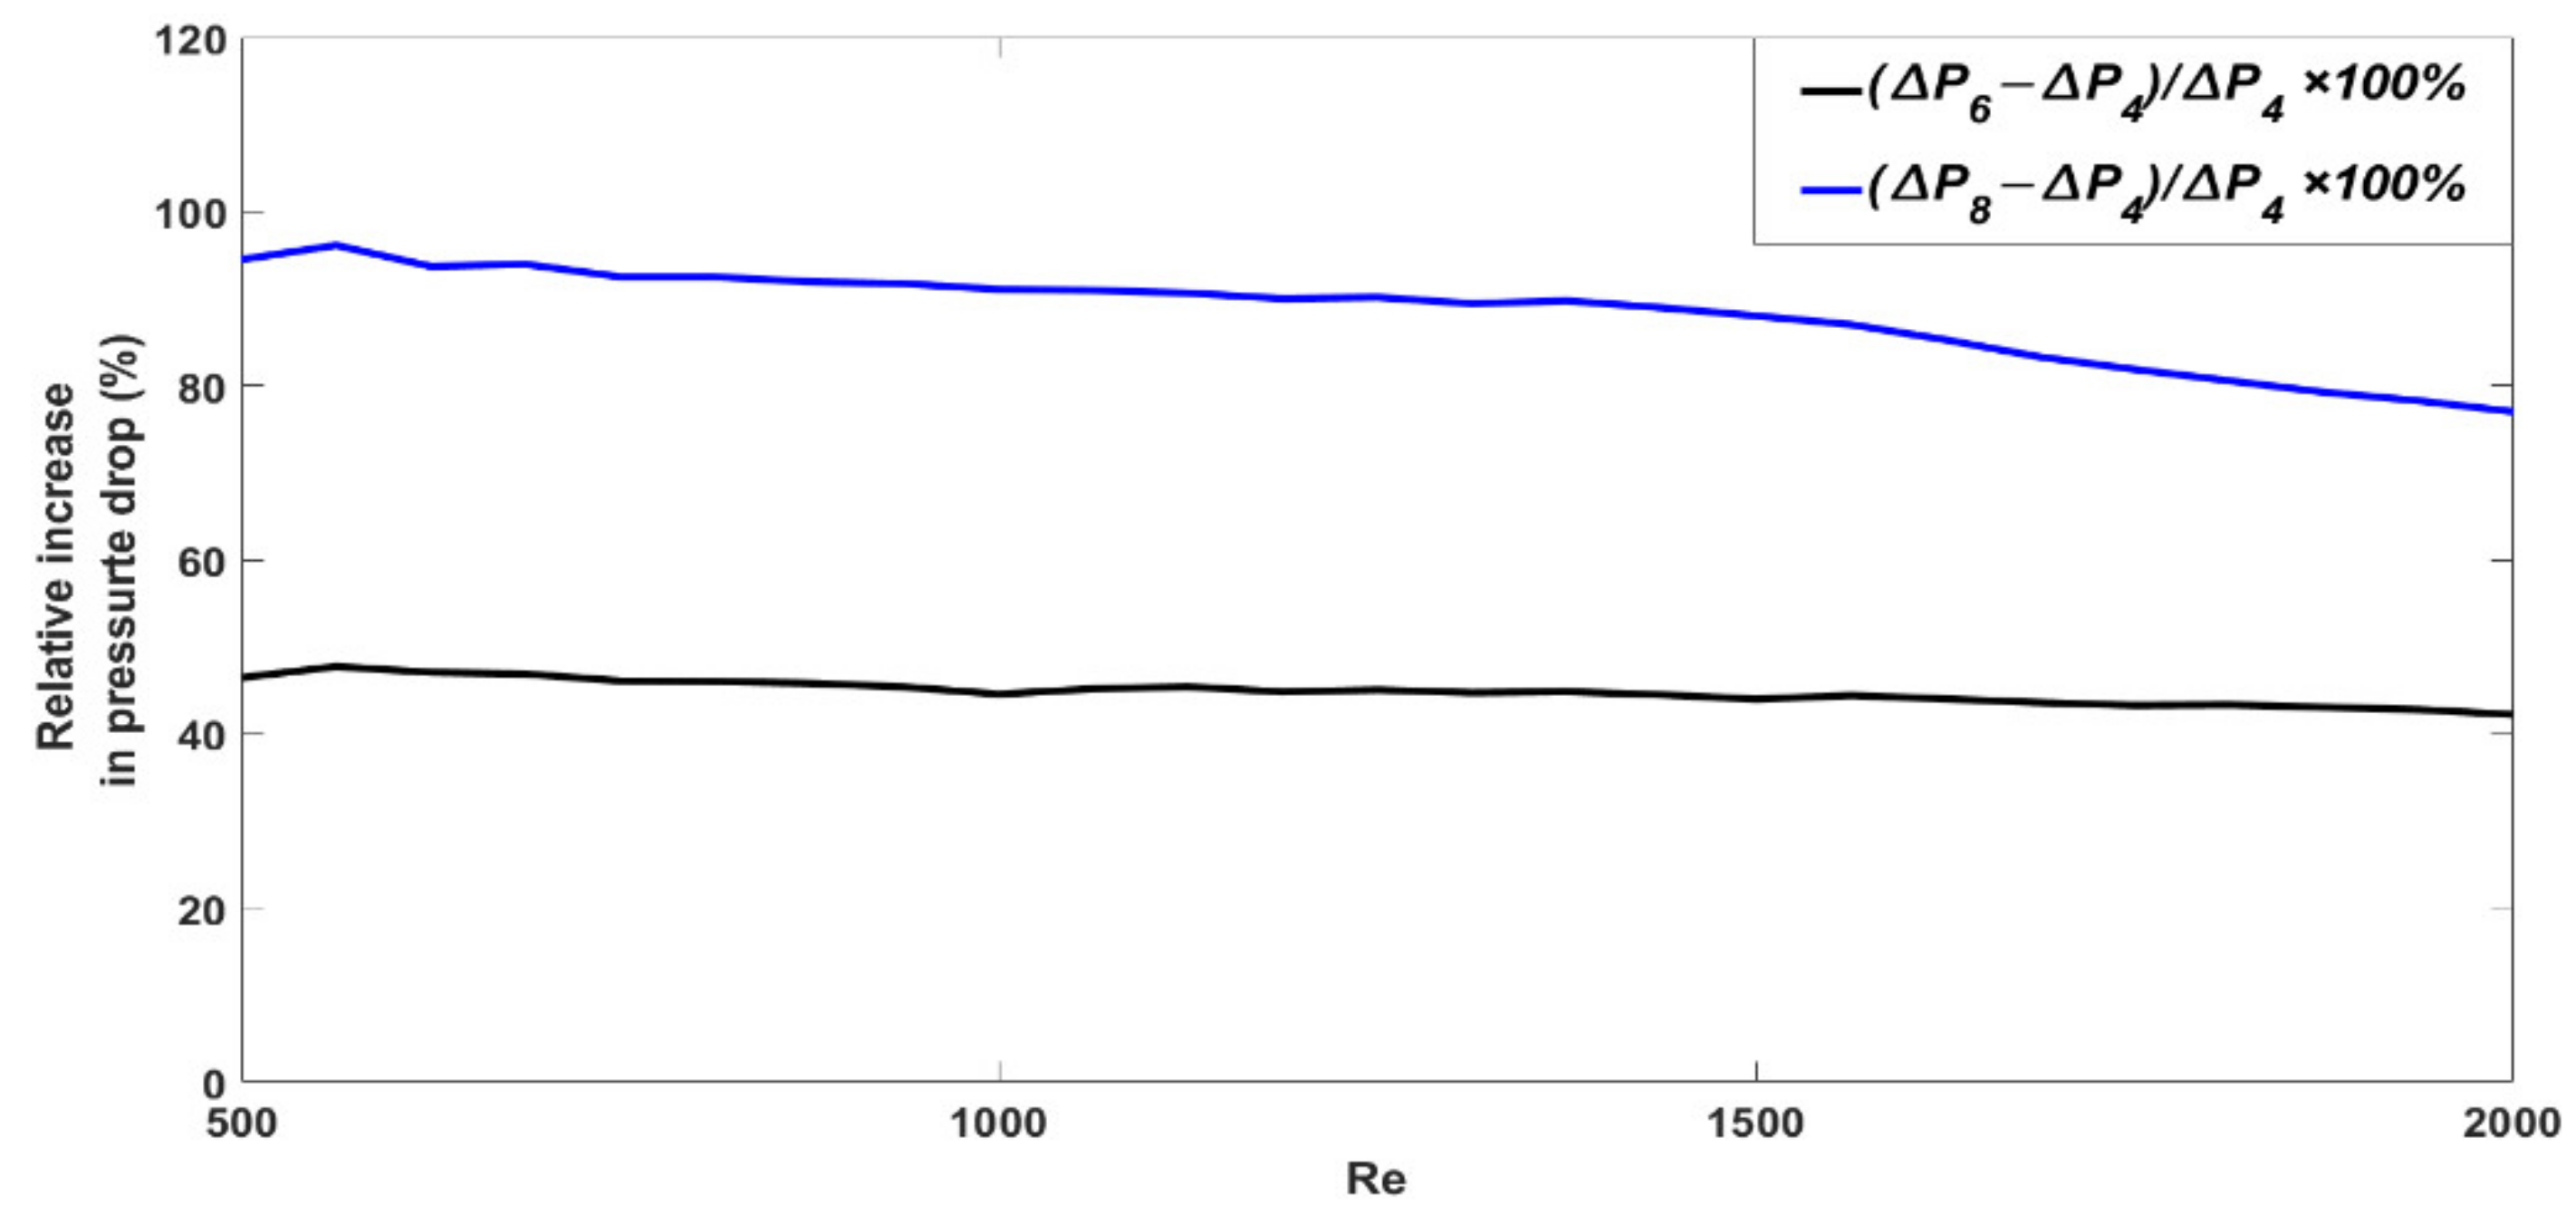
- Due to the increase in the cooling cross-sectional area, increasing the turns number of the channel improves the heat transfer from the electric motor to the coolant fluid, thus increasing the heat transfer coefficient.
- (e)
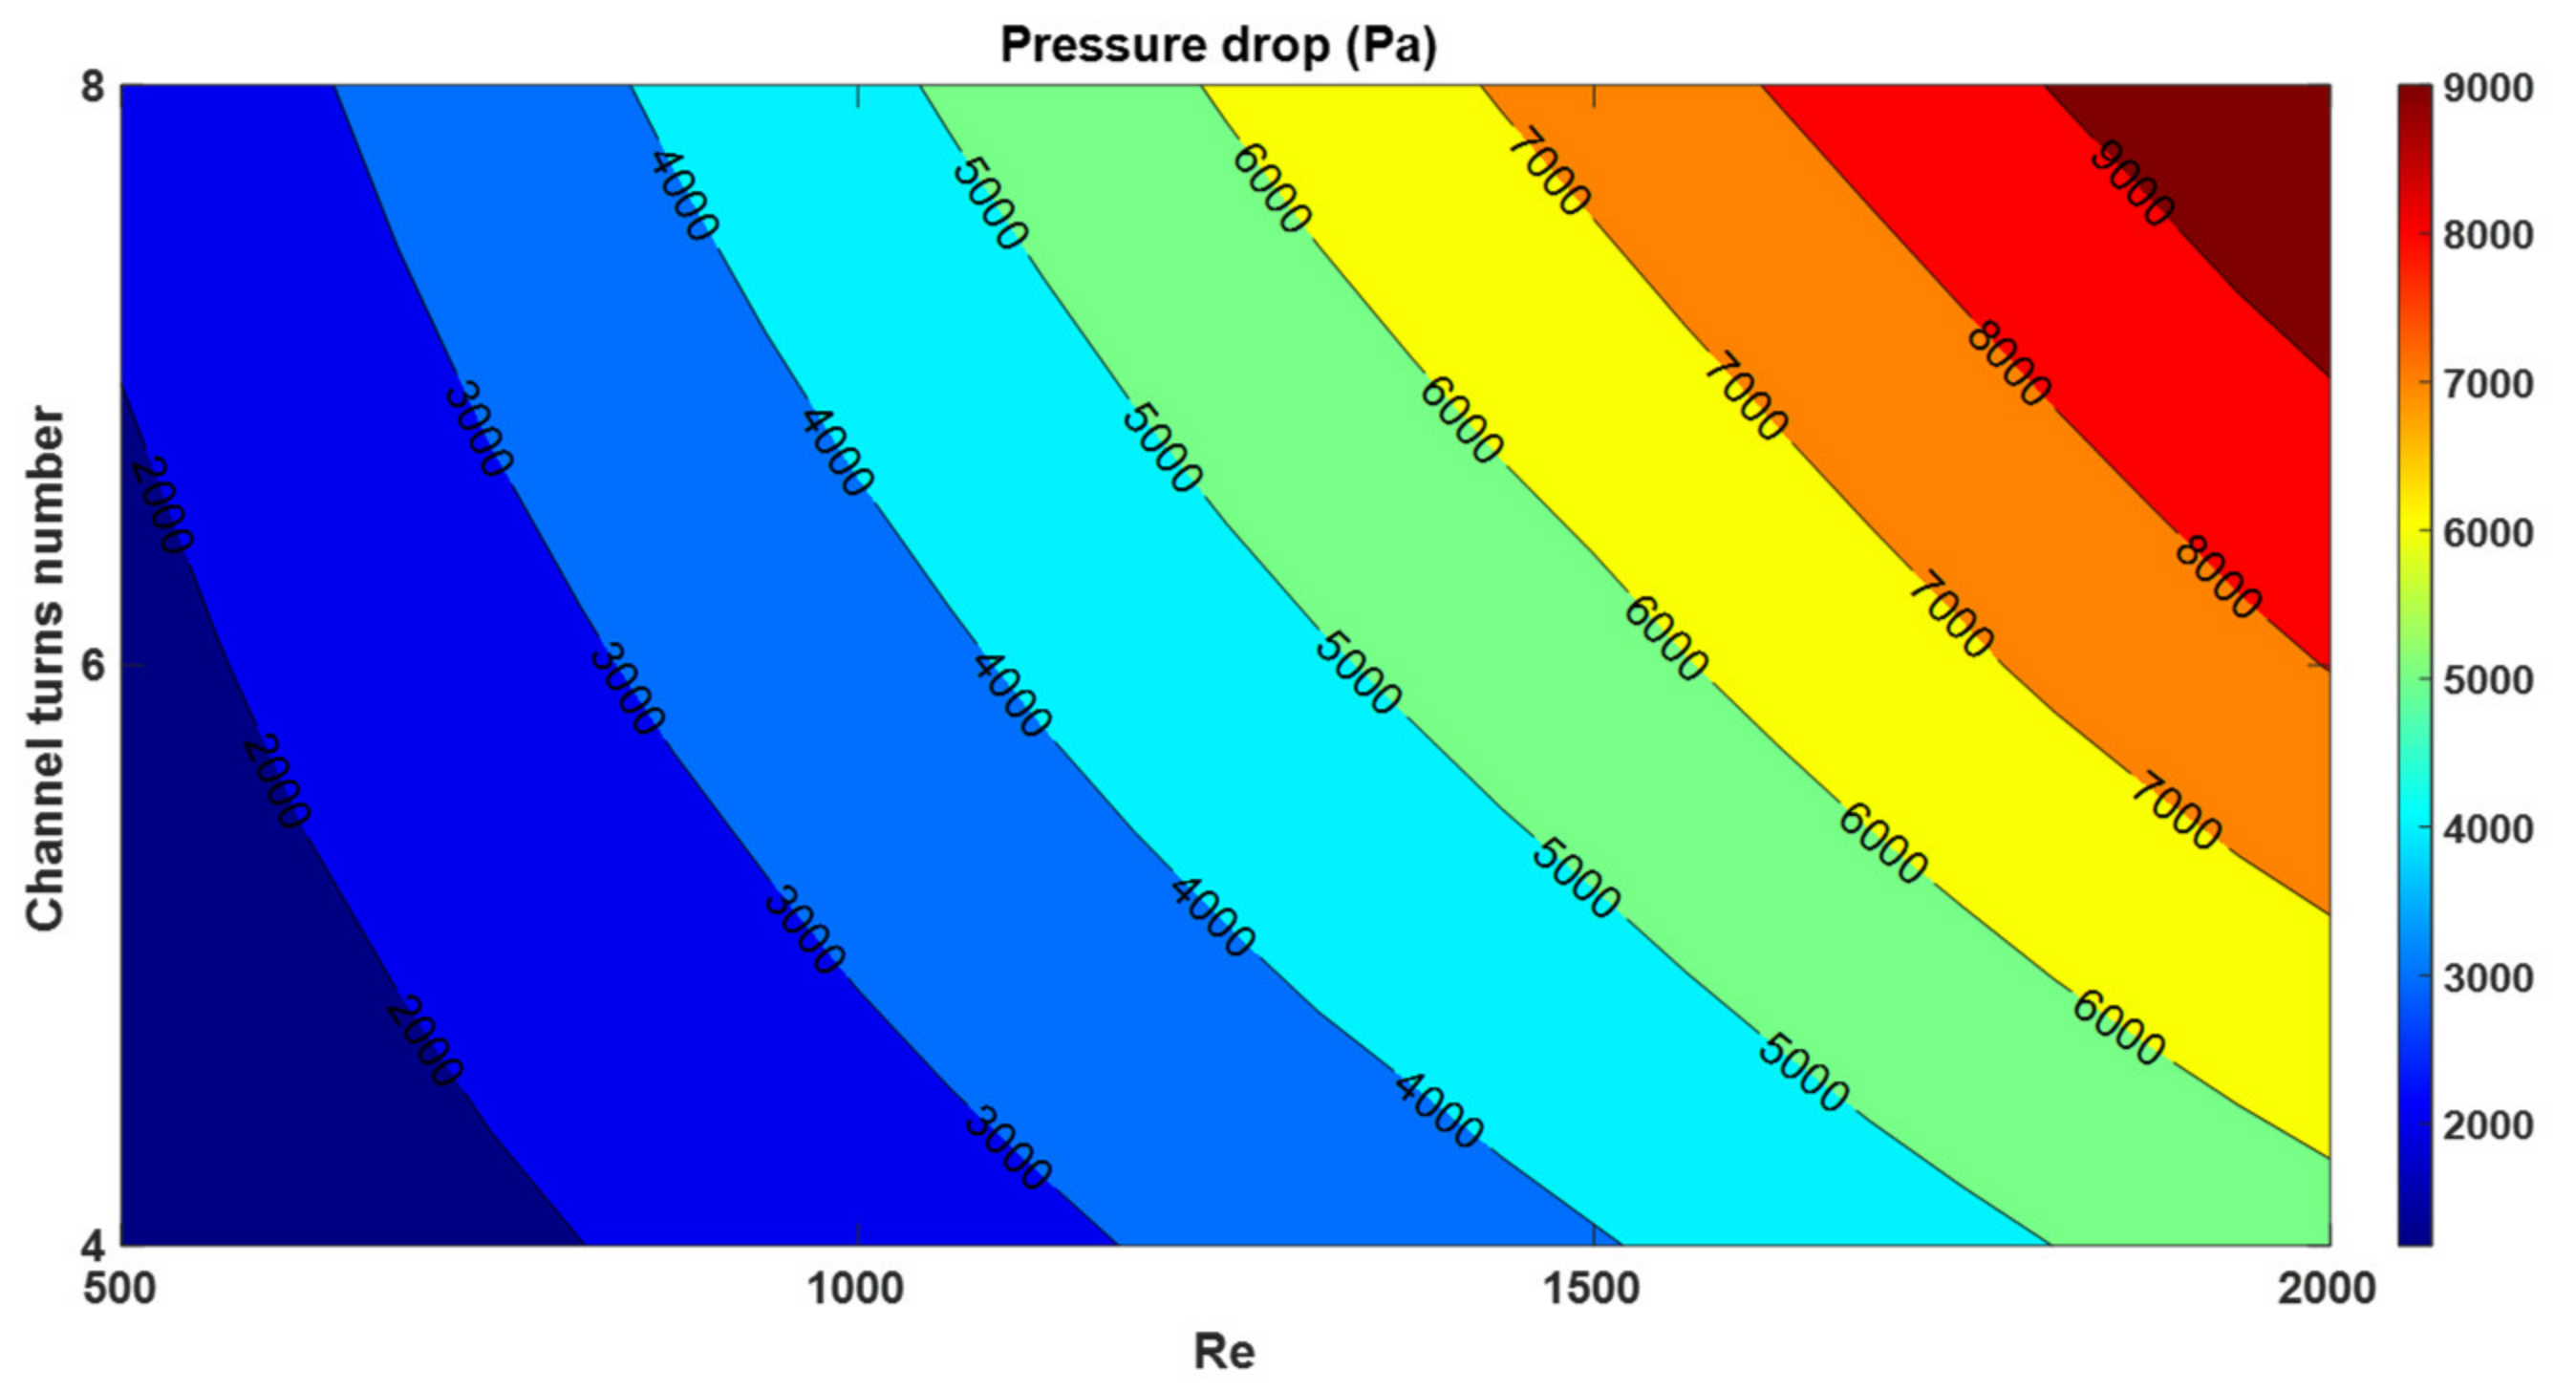
- Increasing the turns number of channels leads to a greater enhancement of heat transfer coefficient at larger Reynolds numbers. This is due to the fact that the pitch of the channel decreases with the turns number. As the smaller pitch of spiral channels causes the friction factor to decrease further by increasing the Reynolds number, a greater enhancement of the heat transfer coefficient is achieved.
- (f)
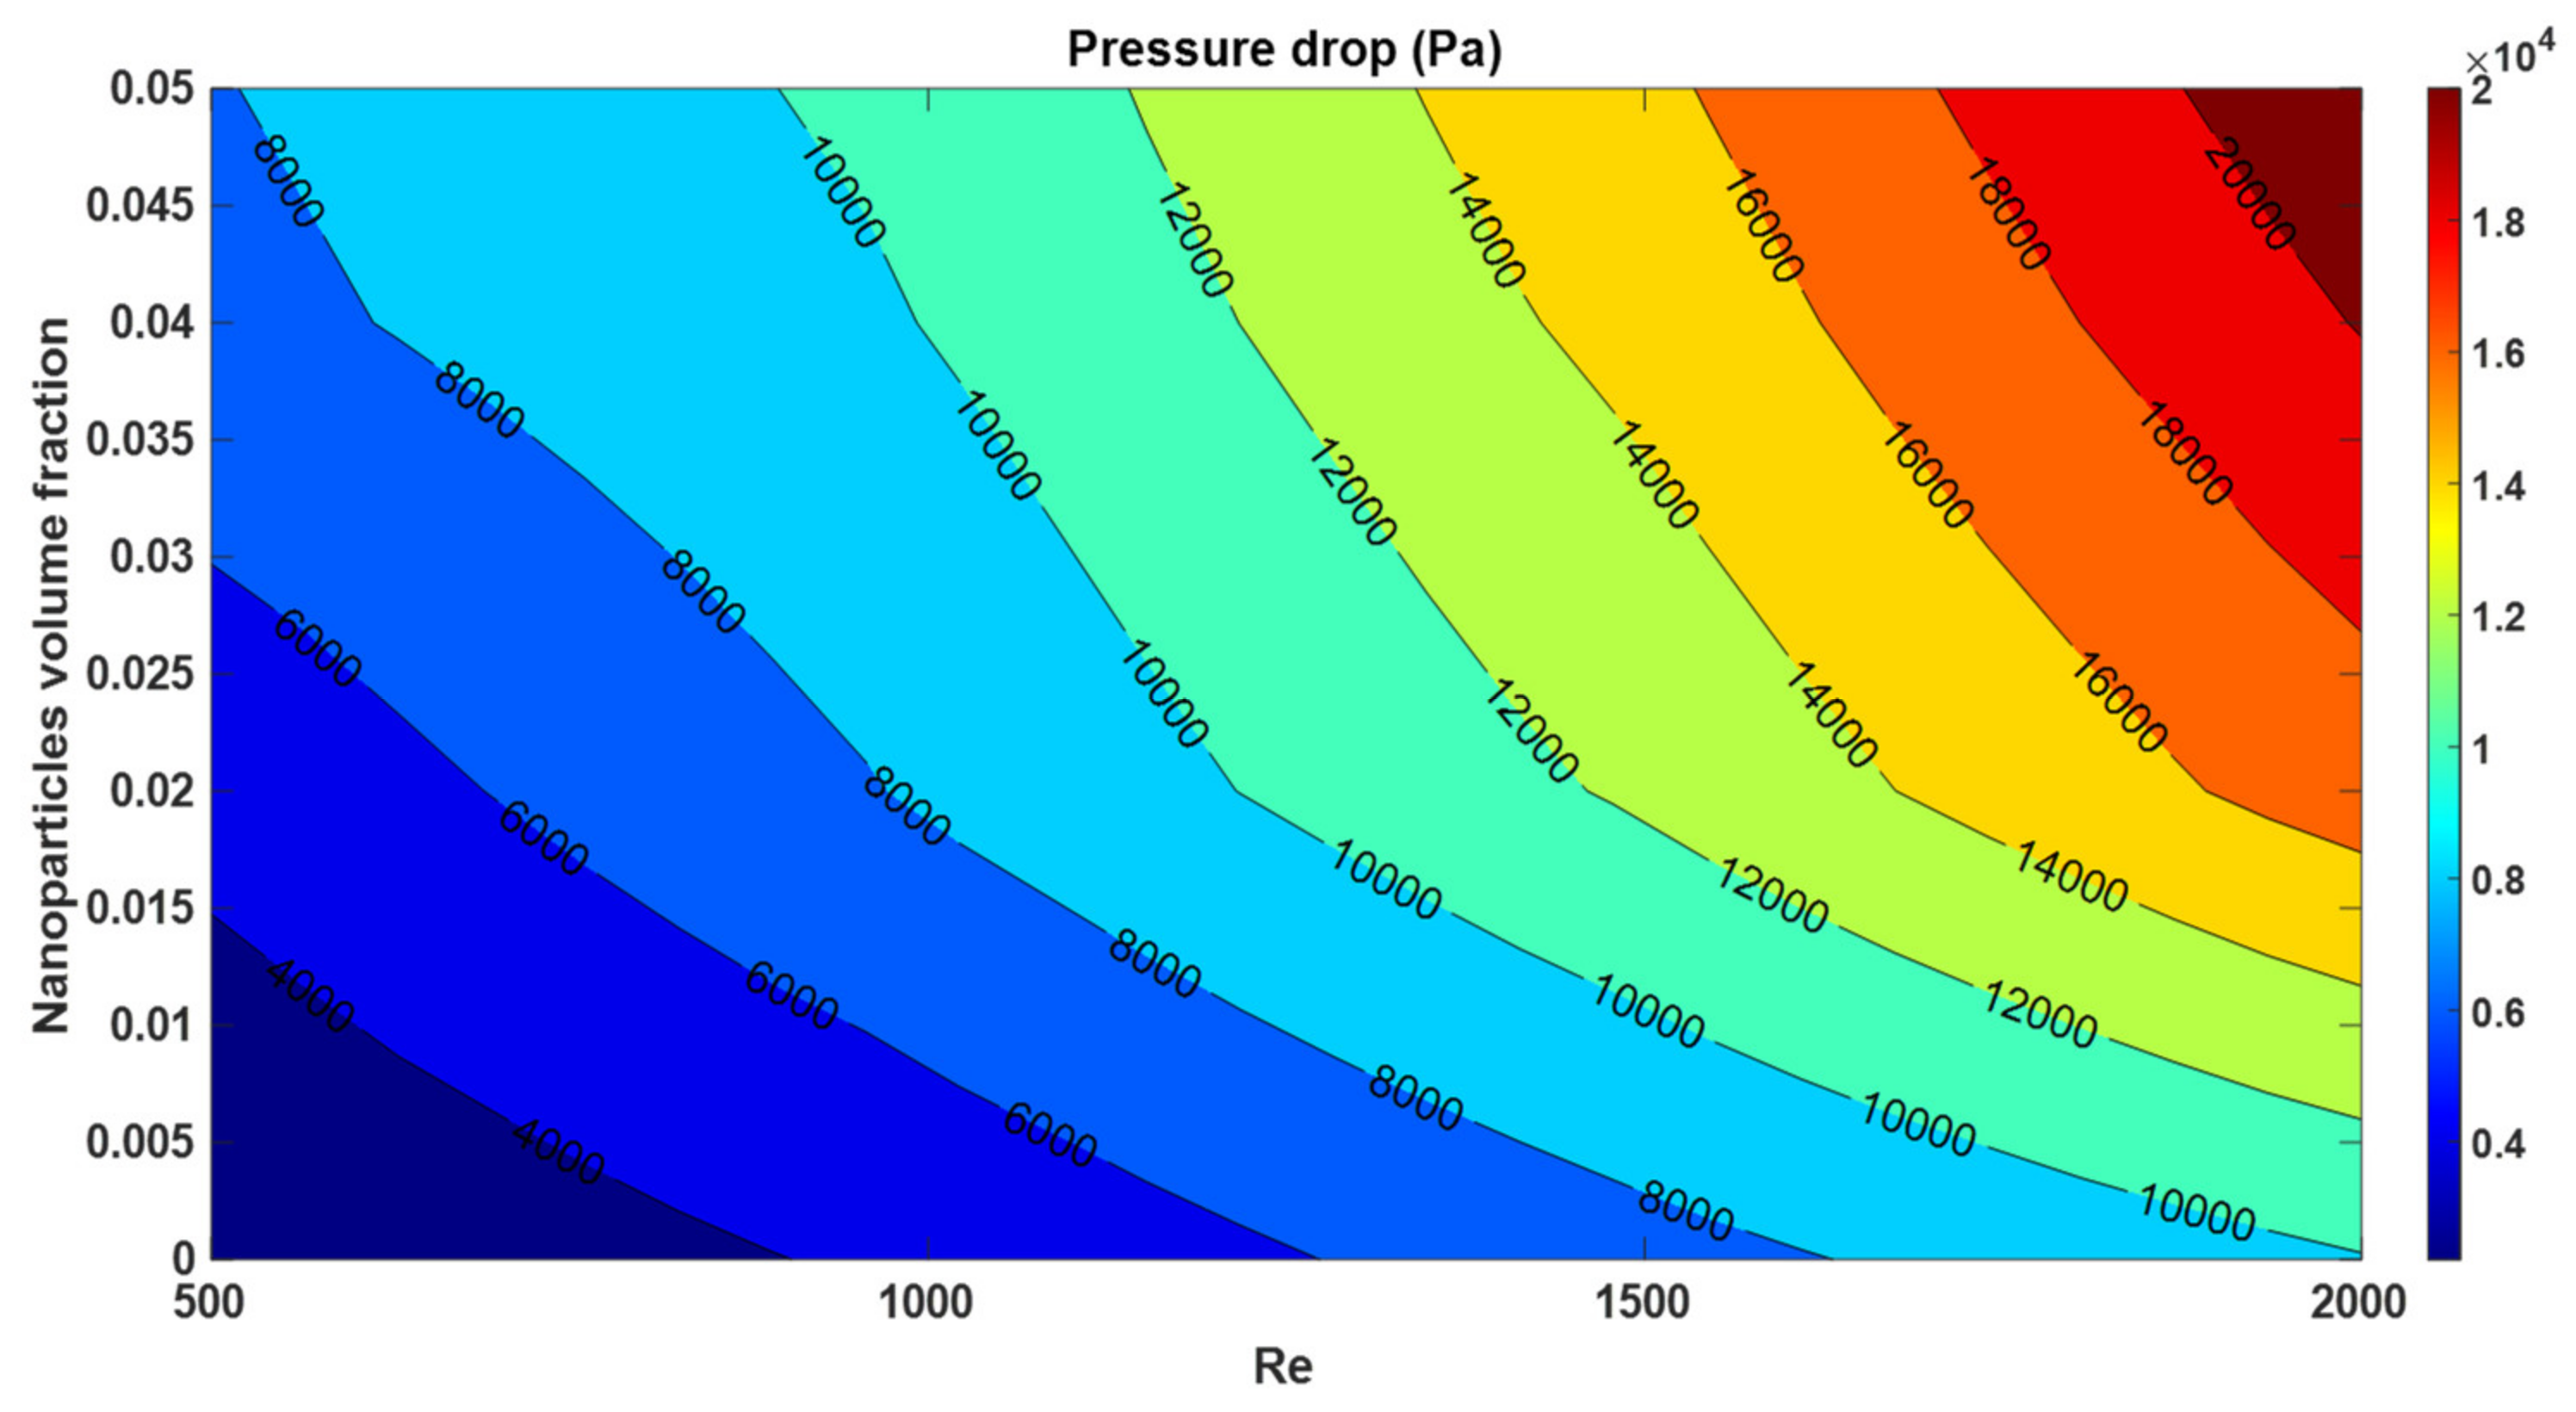
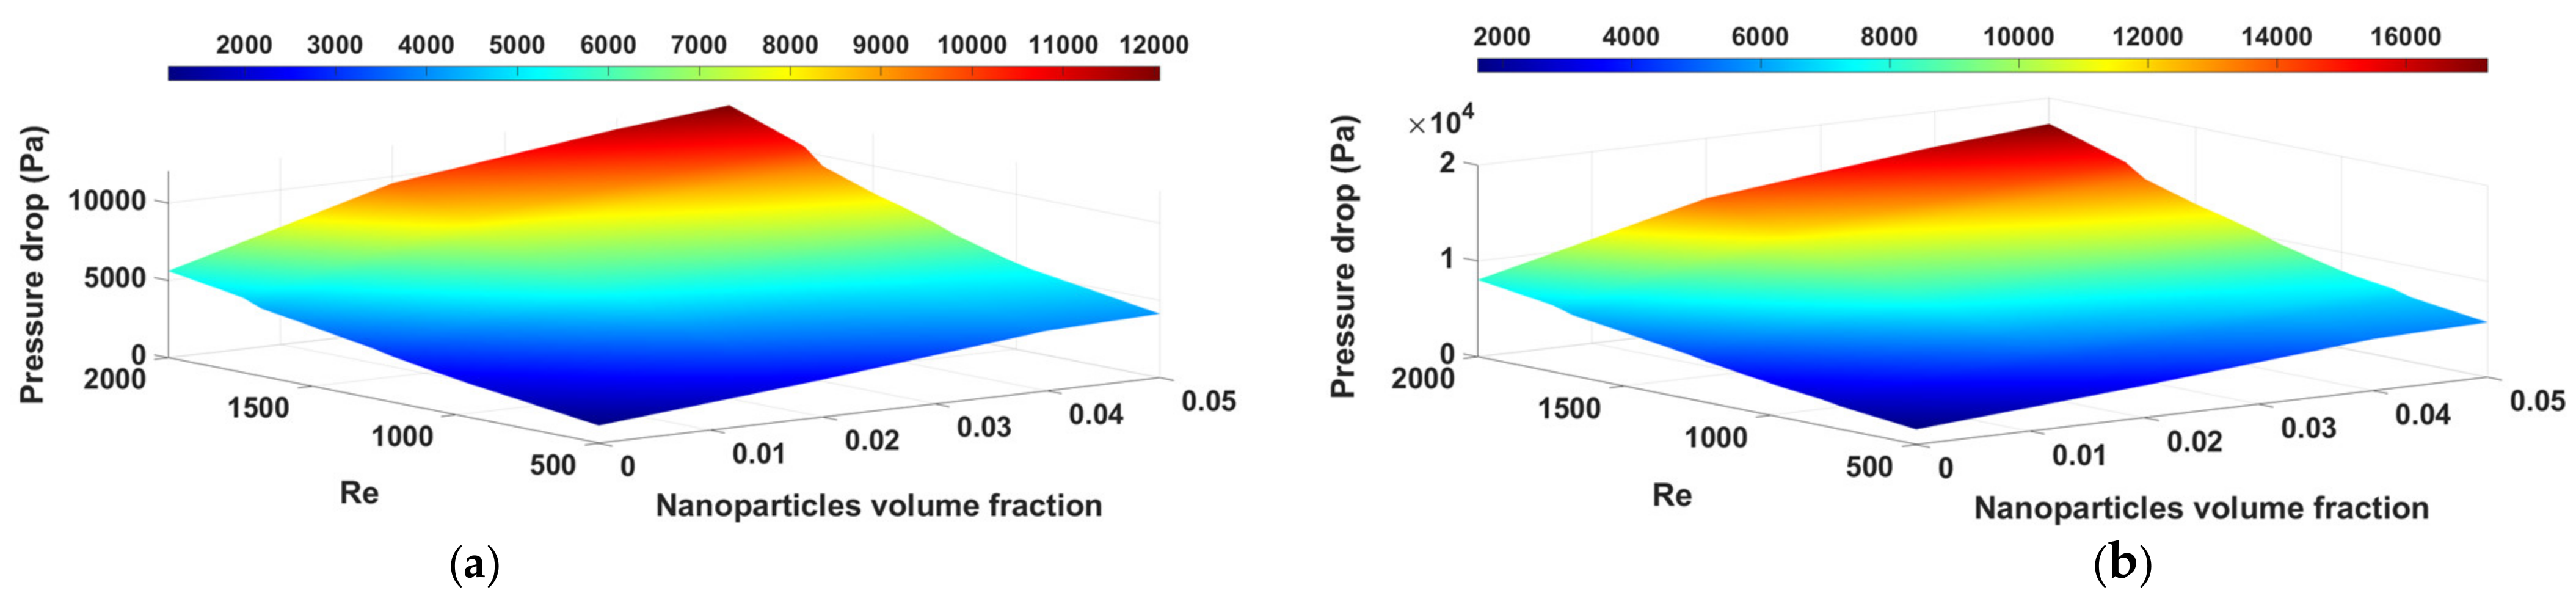
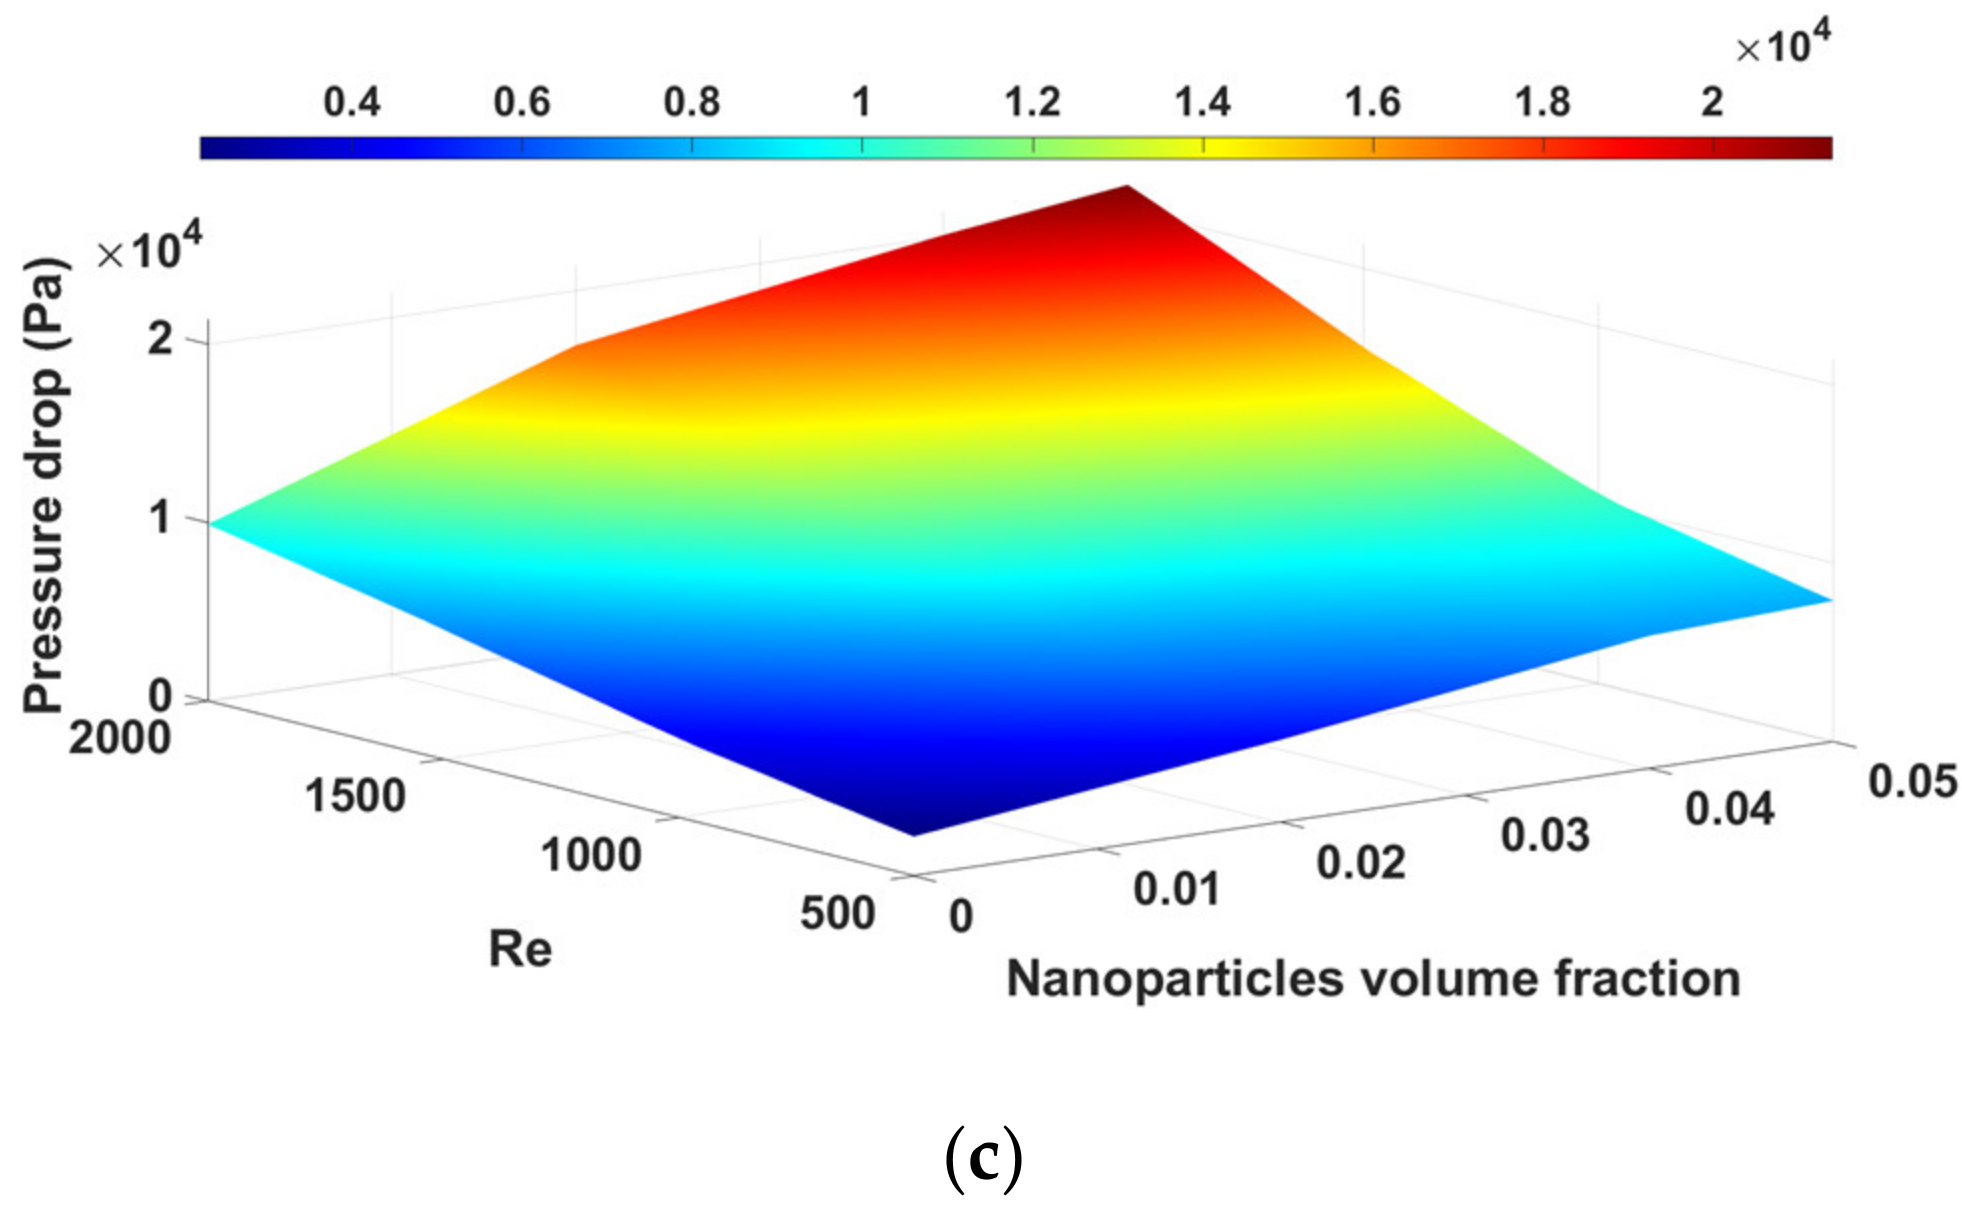
- Due to the smaller pitch of the channel with a higher number of turns, at larger Reynolds numbers, the friction factor decreases more than in the channel with a lower number of turns, so the percentage of the relative increase in pressure drop decreases at larger Reynolds numbers for spiral channels with a higher number of turns.
- (g)
- According to the results and discussions, it was demonstrated that the main factor in improving the overall performance of the cooling system is the increase in its heat transfer performance. Therefore, the key factor that causes nanofluids with excessive nanoparticle concentrations to have a lower overall performance is the dual effect of adding nanoparticles on the heat transfer rather than the negative effect of increasing pressure drop.
Author Contributions
Funding
Acknowledgments
Conflicts of Interest
References
- Naidu, M.; Nehl, T.W.; Gopalakrishnan, S.; Wurth, L. Keeping cool while saving space and money: A semi-integrated, sensorless PM brushless drive for a 42-V automotive HVAC compressor. IEEE Ind. Appl. Mag. 2005, 11, 20–28. [Google Scholar] [CrossRef]
- Chen, Q.; Shao, H.; Huang, J.; Sun, H.; Xie, J. Analysis of temperature field and water cooling of outer rotor in-wheel motor for electric vehicle. IEEE Access 2019, 7, 140142–140151. [Google Scholar] [CrossRef]
- Lindh, P.; Petrov, I.; Immonen, P.; Pyrhönen, J.; Niemelä, M.; Anttila, J.; Paakkinen, M.; Scherman, E. Performance of a direct-liquid-cooled motor in an electric bus under different load cycles. IEEE Access 2019, 7, 86897–86905. [Google Scholar] [CrossRef]
- Gundabattini, E.; Kuppan, R.; Solomon, D.G.; Kalam, A.; Kothari, D.P.; Bakar, R.A. A review on methods of finding losses and cooling methods to increase efficiency of electric machines. Ain Shams Eng. J. 2021, 12, 497–505. [Google Scholar] [CrossRef]
- Huang, J.; Naini, S.S.; Miller, R.; Rizzo, D.; Sebeck, K.; Shurin, S.; Wagner, J. A hybrid electric vehicle motor cooling system—Design, model, and control. IEEE Trans. Veh. Technol. 2019, 68, 4467–4478. [Google Scholar] [CrossRef]
- Canders, W.-R.; Hoffmann, J.; Henke, M. Cooling technologies for high power density electrical machines for aviation applications. Energies 2019, 12, 4579. [Google Scholar] [CrossRef] [Green Version]
- Tikadar, A.; Johnston, D.; Kumar, N.; Joshi, Y.; Kumar, S. Comparison of electro-thermal performance of advanced cooling techniques for electric vehicle motors. Appl. Therm. Eng. 2021, 183, 116182. [Google Scholar] [CrossRef]
- Galloni, E.; Parisi, P.; Marignetti, F.; Volpe, G. CFD analyses of a radial fan for electric motor cooling. Therm. Sci. Eng. Prog. 2018, 8, 470–476. [Google Scholar] [CrossRef]
- Fujita, H.; Itoh, A.; Urano, T. Newly developed motor cooling method using refrigerant. World Electr. Veh. J. 2019, 10, 38. [Google Scholar] [CrossRef] [Green Version]
- Lim, D.H.; Lee, M.-Y.; Lee, H.-S.; Kim, S.C. Performance evaluation of an in-wheel motor cooling system in an electric vehicle/hybrid electric vehicle. Energies 2014, 7, 961–971. [Google Scholar] [CrossRef] [Green Version]
- Grabowski, M.; Urbaniec, K.; Wernik, J.; Wołosz, K.J. Numerical simulation and experimental verification of heat transfer from a finned housing of an electric motor. Energy Convers. Manag. 2016, 125, 91–96. [Google Scholar] [CrossRef]
- Zeinali, S.; Heris, M.; Shokrgozar, S.; Poorpharhang, M.; Shanbedi, S.H. Noie experimental study of heat transfer of a car radiator with cuo/ethylene glycol-water as a coolant. J. Dispers. Sci. Technol. 2014, 35, 677–684. [Google Scholar]
- Davin, T.; Pellé, J.; Harmand, S.; Yu, R. Experimental study of oil cooling systems for electric motors. Appl. Therm. Eng. 2015, 75, 1–13. [Google Scholar] [CrossRef]
- Cavazzuti, M.; Gaspari, G.; Pasquale, S.; Stalio, E. Thermal management of a Formula E electric motor: Analysis and optimization. Appl. Therm. Eng. 2019, 157, 113733. [Google Scholar] [CrossRef]
- Tian, Z.; Gan, W.; Zhang, X.; Gu, B.; Yang, L. Investigation on an integrated thermal management system with battery cooling and motor waste heat recovery for electric vehicle. Appl. Therm. Eng. 2018, 136, 16–27. [Google Scholar] [CrossRef]
- Farsane, K.; Desevaux, P.; Panday, P.K. Experimental study of the cooling of a closed type electric motor. Appl. Therm. Eng. 2000, 20, 1321–1334. [Google Scholar] [CrossRef]
- Rehman, Z.; Seong, K. Three-D Numerical thermal analysis of electric motor with cooling jacket. Energies 2018, 11, 92. [Google Scholar] [CrossRef] [Green Version]
- Richmond, C.; Kuppuswamy, R.; Khan, A. The effect of coolant velocity for enhancing the high-speed permanent magnet generator efficiency. Procedia CIRP 2020, 91, 21–26. [Google Scholar] [CrossRef]
- De Gennaro, M.; Juergens, J.; Zanon, A.; Gragger, J.; Schlemmer, E.; Fricasse, A.; Marengo, L.; Ponick, B.; Olabarri, E.T.; Kinder, J.; et al. Designing, prototyping and testing of a ferrite permanent magnet assisted synchronous reluctance machine for hybrid and electric vehicles applications. Sustain. Energy Technol. Assess. 2019, 31, 86–101. [Google Scholar] [CrossRef]
- Silwal, B.; Mohamed, A.H.; Nonneman, J.; De Paepe, M.; Sergeant, P. Assessment of different cooling techniques for reduced mechanical stress in the windings of electrical machines. Energies 2019, 12, 1967. [Google Scholar] [CrossRef] [Green Version]
- Siricharoenpanich, A.; Wiriyasart, S.; Naphon, P. Study on the thermal dissipation performance of GPU cooling system with nanofluid as coolant. Case Stud. Therm. Eng. 2021, 25, 100904. [Google Scholar] [CrossRef]
- Zhang, L.; Yan, X.; Zhang, Y.; Feng, Y.; Li, Y.; Meng, H.; Zhang, J.; Wu, J. Heat transfer enhancement by streamlined winglet pair vortex generators for helical channel with rectangular cross section. Chem. Eng. Process. Process Intensif. 2020, 147, 107788. [Google Scholar] [CrossRef]
- Biswas, G.; Chattopadhyay, H.; Sinha, A. Augmentation of heat transfer by creation of streamwise longitudinal vortices using vortex generators. Heat Transf. 2012, 33, 406–424. [Google Scholar] [CrossRef]
- Tiggelbeck, S.; Mitra, N.K.; Fiebig, M. Comparison of wing-type vortex generators for heat transfer enhancement in channel flows. J. Heat Transf. 1994, 116, 880–885. [Google Scholar] [CrossRef]
- Li, Y.; Wang, X.; Zhang, J.; Zhang, L.; Wu, J.H. Comparison and analysis of the arrangement of delta winglet pair vortex generators in a half coiled jacket for heat transfer enhancement. Int. J. Heat Mass Transf. 2019, 129, 287–298. [Google Scholar] [CrossRef]
- Sarafraz, M.M.; Safaei, M.R.; Leon, A.S.; Tlili, I.; Alkanhal, T.A.; Tian, Z.; Goodarzi, M.; Arjomandi, M. Experimental Investigation on Thermal Performance of a PV/T-PCM (Photovoltaic/Thermal) System Cooling with a PCM and Nanofluid. Energies 2019, 12, 2572. [Google Scholar] [CrossRef] [Green Version]
- Almurtaji, S.; Ali, N.; Teixeira, J.A.; Addali, A. On the role of nanofluids in thermal-hydraulic performance of heat exchangers—A review. Nanomaterials 2020, 10, 734. [Google Scholar] [CrossRef] [Green Version]
- Shah, T.R.; Ali, H.M.; Janjua, M.M. On aqua-based silica (sio2–water) nanocoolant: Convective thermal potential and experimental precision evaluation in aluminum tube radiator. Nanomaterials 2020, 10, 1736. [Google Scholar] [CrossRef]
- Benedict, F.; Kumar, A.; Kadirgama, K.; Mohammed, H.A.; Ramasamy, D.; Samykano, M.; Saidur, R. Thermal performance of hybrid-inspired coolant for radiator application. Nanomaterials 2020, 10, 1100. [Google Scholar] [CrossRef] [PubMed]
- Li, Z.; Li, W.; Chen, Z. Performance analysis of thermoelectric based automotive waste heat recovery system with nanofluid coolant. Energies 2017, 10, 1489. [Google Scholar] [CrossRef] [Green Version]
- Deriszadeh, A.; de Monte, F. On heat transfer performance of cooling systems using nanofluid for electric motor applications. Entropy 2020, 22, 99. [Google Scholar] [CrossRef] [PubMed] [Green Version]
- Parsaiemehr, M.; Pourfattah, F.; Ali Akbari, O.; Toghraie, D.; Sheikhzadeh, G. Turbulent flow and heat transfer of Water/Al2O3 nanofluid inside a rectangular ribbed channel. Phys. E Low Dimens. Syst. Nanostruct. 2018, 96, 73–84. [Google Scholar] [CrossRef]
- Shukla, K.N.; Koller, T.M.; Rausch, M.H.; Fröba, A.P. Effective thermal conductivity of nanofluids—A new model taking into consideration Brownian motion. Int. J. Heat Mass Transf. 2016, 99, 532–540. [Google Scholar] [CrossRef]
- Das, S.K.; Choi, S.U.; Yu, W.; Pradeep, T. Nanofluids Science and Technology; John Wiley & Sons: Hoboken, NJ, USA, 2008. [Google Scholar]
- Helvaci, H.U.; Khan, Z.A. Heat transfer and entropy generation analysis of HFE 7000 based nanorefrigerants. Int. J. Heat Mass Transf. 2017, 104, 318–327. [Google Scholar] [CrossRef]
- Albojamal, A.; Vafai, K. Analysis of single phase, discrete and mixture models, in predicting nanofluid transport. Int. J. Heat Mass Transf. 2017, 114, 225–237. [Google Scholar] [CrossRef]
- Salim, S.M.; Cheah, S. Wall y+ Strategy for Dealing with Wall-bounded Turbulent Flows. In Proceedings of the International Multiconference of Engineers and Computer Scientists, IMECS 2009, Hong Kong, China, 18–20 March 2009. [Google Scholar]
- Kahani, M.; Heris, S.Z.; Mousavi, S.M. Effects of curvature ratio and coil pitch spacing on heat transfer performance of Al2O3/water nanofluid laminar flow through helical coils. J. Dispers. Sci. Technol. 2013, 34, 1704–1712. [Google Scholar] [CrossRef]
- Akbari, O.A.; Toghraie, D.; Karimipour, A. Impact of ribs on flow parameters and laminar heat transfer of water–aluminum oxide nanofluid with different nanoparticle volume fractions in a three-dimensional rectangular microchannel. Adv. Mech. Eng. 2015, 7, 1687814015618155. [Google Scholar] [CrossRef] [Green Version]
- Tang, L.; Tang, Y.; Parameswaran, S. A numerical study of flow characteristics in a helical pipe. Adv. Mech. Eng. 2016, 8, 1687814016660242. [Google Scholar] [CrossRef] [Green Version]
- Li, P.; Zhang, D.; Xie, Y. Heat transfer and flow analysis of Al2O3–water nanofluids in microchannel with dimple and protrusion. Int. J. Heat Mass Transf. 2014, 73, 456–467. [Google Scholar] [CrossRef]


| Cooling Jacket | Electric Motor | |
|---|---|---|
| Length (mm) | 240 | 240 with coils |
| Diameter (mm) | 210 | 190 |
| Thickness (mm) | 10 | ― |
| Coil pitch (mm) | 26 | ― |
| Channel dimensions (mm) | 6 × 6 | ― |
| Number of Nodes | Computed Heat Transfer Coefficient | Percentage Variation |
|---|---|---|
| 2 × 10⁶ | 119.93 | — |
| 4 × 10⁶ | 133.52 | 11.33 |
| 6 × 10⁶ | 131.92 | 1.2% |
| 8 × 10⁶ | 131.78 | 0.11% |
| Re | 1000 | 1500 | 2000 |
|---|---|---|---|
| Simulated Nu | 16.7615 | 21.5649 | 24.5844 |
| Calculated Nu by the correlation proposed in [38] | 16.226 | 19.986 | 23.171 |
| Deviation | 3.3% | 7.9% | 6.1% |
| φ | ρ (kg/m3) | Cp (J/kg K) | k (W/m K) | μ (Pa s) |
|---|---|---|---|---|
| 0.01 | 1026.8 | 4047 | 0.6408 | 9.13 × 10⁻⁴ |
| 0.02 | 1056.6 | 3922.4 | 0.6691 | 9.37 × 10⁻⁴ |
| 0.04 | 1116 | 3693.2 | 0.7014 | 9.86 × 10⁻⁴ |
| 0.05 | 1140.15 | 3466.95 | 0.7205 | 9.96 × 10⁻⁴ |
| Al2O3 | 3970 | 765 | 40 | — |
| Water | 997.1 | 4179 | 0.613 | 8.91 × 10⁻⁴ |
Publisher’s Note: MDPI stays neutral with regard to jurisdictional claims in published maps and institutional affiliations. |
© 2021 by the authors. Licensee MDPI, Basel, Switzerland. This article is an open access article distributed under the terms and conditions of the Creative Commons Attribution (CC BY) license (https://creativecommons.org/licenses/by/4.0/).
Share and Cite
Deriszadeh, A.; de Monte, F. Performance Evaluation of the Electric Machine Cooling System Employing Nanofluid as an Advanced Coolant. ChemEngineering 2021, 5, 53. https://doi.org/10.3390/chemengineering5030053
Deriszadeh A, de Monte F. Performance Evaluation of the Electric Machine Cooling System Employing Nanofluid as an Advanced Coolant. ChemEngineering. 2021; 5(3):53. https://doi.org/10.3390/chemengineering5030053
Chicago/Turabian StyleDeriszadeh, Ali, and Filippo de Monte. 2021. "Performance Evaluation of the Electric Machine Cooling System Employing Nanofluid as an Advanced Coolant" ChemEngineering 5, no. 3: 53. https://doi.org/10.3390/chemengineering5030053
APA StyleDeriszadeh, A., & de Monte, F. (2021). Performance Evaluation of the Electric Machine Cooling System Employing Nanofluid as an Advanced Coolant. ChemEngineering, 5(3), 53. https://doi.org/10.3390/chemengineering5030053