Article

Optimization of Exopolysaccharide (EPS) Production by Rhodotorula mucilaginosa sp. GUMS16

by
Oseweuba Valentine Okoro
1,*,
Amir Reza Gholipour
2,
Faezeh Sedighi
2,
Amin Shavandi
1,* and
Masoud Hamidi
1,2,*
1
BioMatter-Biomass Transformation Lab (BTL), École Polytechnique de Bruxelles, Université Libre de Bruxelles, Avenue F.D. Roosevelt, 50-CP 165/61, 1050 Brussels, Belgium
2
Department of Medical Biotechnology, Faculty of Paramedicine, Guilan University of Medical Sciences, Rasht 4477166595, Iran
*
Authors to whom correspondence should be addressed.
ChemEngineering 2021, 5(3), 39; https://doi.org/10.3390/chemengineering5030039
Submission received: 11 June 2021 / Revised: 19 July 2021 / Accepted: 20 July 2021 / Published: 21 July 2021
(This article belongs to the Special Issue Feature Papers in Chemical Engineering)

Abstract

:
Exopolysaccharides (EPSs) are important biopolymers with diverse applications such as gelling compounds in food and cosmetic industries and as bio-flocculants in pollution remediation and bioplastics production. This research focuses on enhancing crude EPS production from Rhodotorula mucilaginosa sp. GUMS16 using the central composite design method in which five levels of process variables of sucrose, pH, and ammonium sulfate were investigated with sucrose and ammonium sulfate serving as carbon and nitrogen sources during microbial incubation. The optimal crude EPS production of 13.48 g/100 mL was achieved at 1 g/100 mL of sucrose concentration, 14.73 g/100 mL of ammonium sulfate at pH 5. Variations in ammonium sulfate concentrations (1.27–14.73 g/100 mL) presented the most significant effects on the crude EPS yield, while changes in sucrose concentrations (1–5 g/100 mL) constituted the least important process variable influencing the EPS yield. The Rhodotorula mucilaginosa sp. GUMS16 may have the potential for large-scale production of EPS for food and biomedical applications.

Graphical Abstract

1. Introduction

The use of polysaccharides, in the production of hydrogels, films, aerogels etc. for application in tissue engineering, is well known [1,2,3,4,5,6]. The current study, therefore, proposes the biosynthesis of valuable exopolysaccharides (EPSs), from carbon and nitrogen substrates, under the action of microbes by enabling the chemical condensation of intracellular nucleotide sugars and starter precursors in several metabolic pathways [7,8]. The biosynthesis of high molecular weight EPS incorporates the biosorption of nutrients [7,8]. The produced EPSs are water-soluble long-chain branched sugar derivatives that may exist as homopolymers or heteropolymers and are characterized by a wide diversity of chemical structures [9,10]. These branched sugar derivatives may also contain non-polysaccharide substituents such as phosphate, acetyl, and glycerol [10,11]. Compared to conventional plant or algal sourced polysaccharides, EPSs are characterized by lower production costs and more efficient downstream processing, illustrated by the potential for continuous harvesting from the cell-free culture supernatant [12]. EPSs are also characterized by unique amphiphilic, gelling, biocompatibility, biodegradability, bioactivity properties have diverse biomedical, environmental and food applications [2,7,13,14]. These properties highlight that EPS may be particularly useful in tissues engineering [15,16]. Despite the benefits, the commercial viability of EPS production has thus far been limited due to the low yields of typically <9 g/100 mL [3,17]. It is, therefore, necessary to explore opportunities for enhanced EPS production via proper microbial strain selection and EPS production optimization. In line with the need for appropriate microbial strain selection, a previous study identified that the new cold-adapted yeast of Rhodotorula mucilaginosa sp. GUMS16 has biomedical application for skin wound healing [18]. The quantitative variation of fungal EPS yields is largely dependent on the processing conditions of culture medium composition and fermentation conditions [19]. Therefore, the present study investigates the preferred culture medium composition (i.e., carbon and nitrogen content) and fermentation conditions (i.e., pH) for enhanced EPS production from the Rhodotorula mucilaginosa sp. GUMS16 [20] using sucrose and ammonium sulfate as carbon and nitrogen precursors. Additionally, given the important role of pH in regulating microbial functions [21,22], the effect of pH value on EPS yield was also investigated. Previous studies reported optimizing EPS production from different bacteria such as Micrococcus roseus and Lactobacillus plantarum, respectively [23,24]. For instance, Ermiş et al. [25], optimized the EPS yield from Lactobacillus brevis and showed that the optimal EPS yield of 3.5 g/100 mL was obtained when the initial process pH of the medium was 6.5 with 18 h incubation time at 35 °C. The novelty of the present study is to focus on the optimization of the yield of EPS from the cold-adapted yeast of Rhodotorula mucilaginosa sp. GUMS16. The central composite design (CCD) method was employed to optimize EPS yield and the significance of the process parameters on EPS yield are also assessed in this study.

2. Materials and Methods
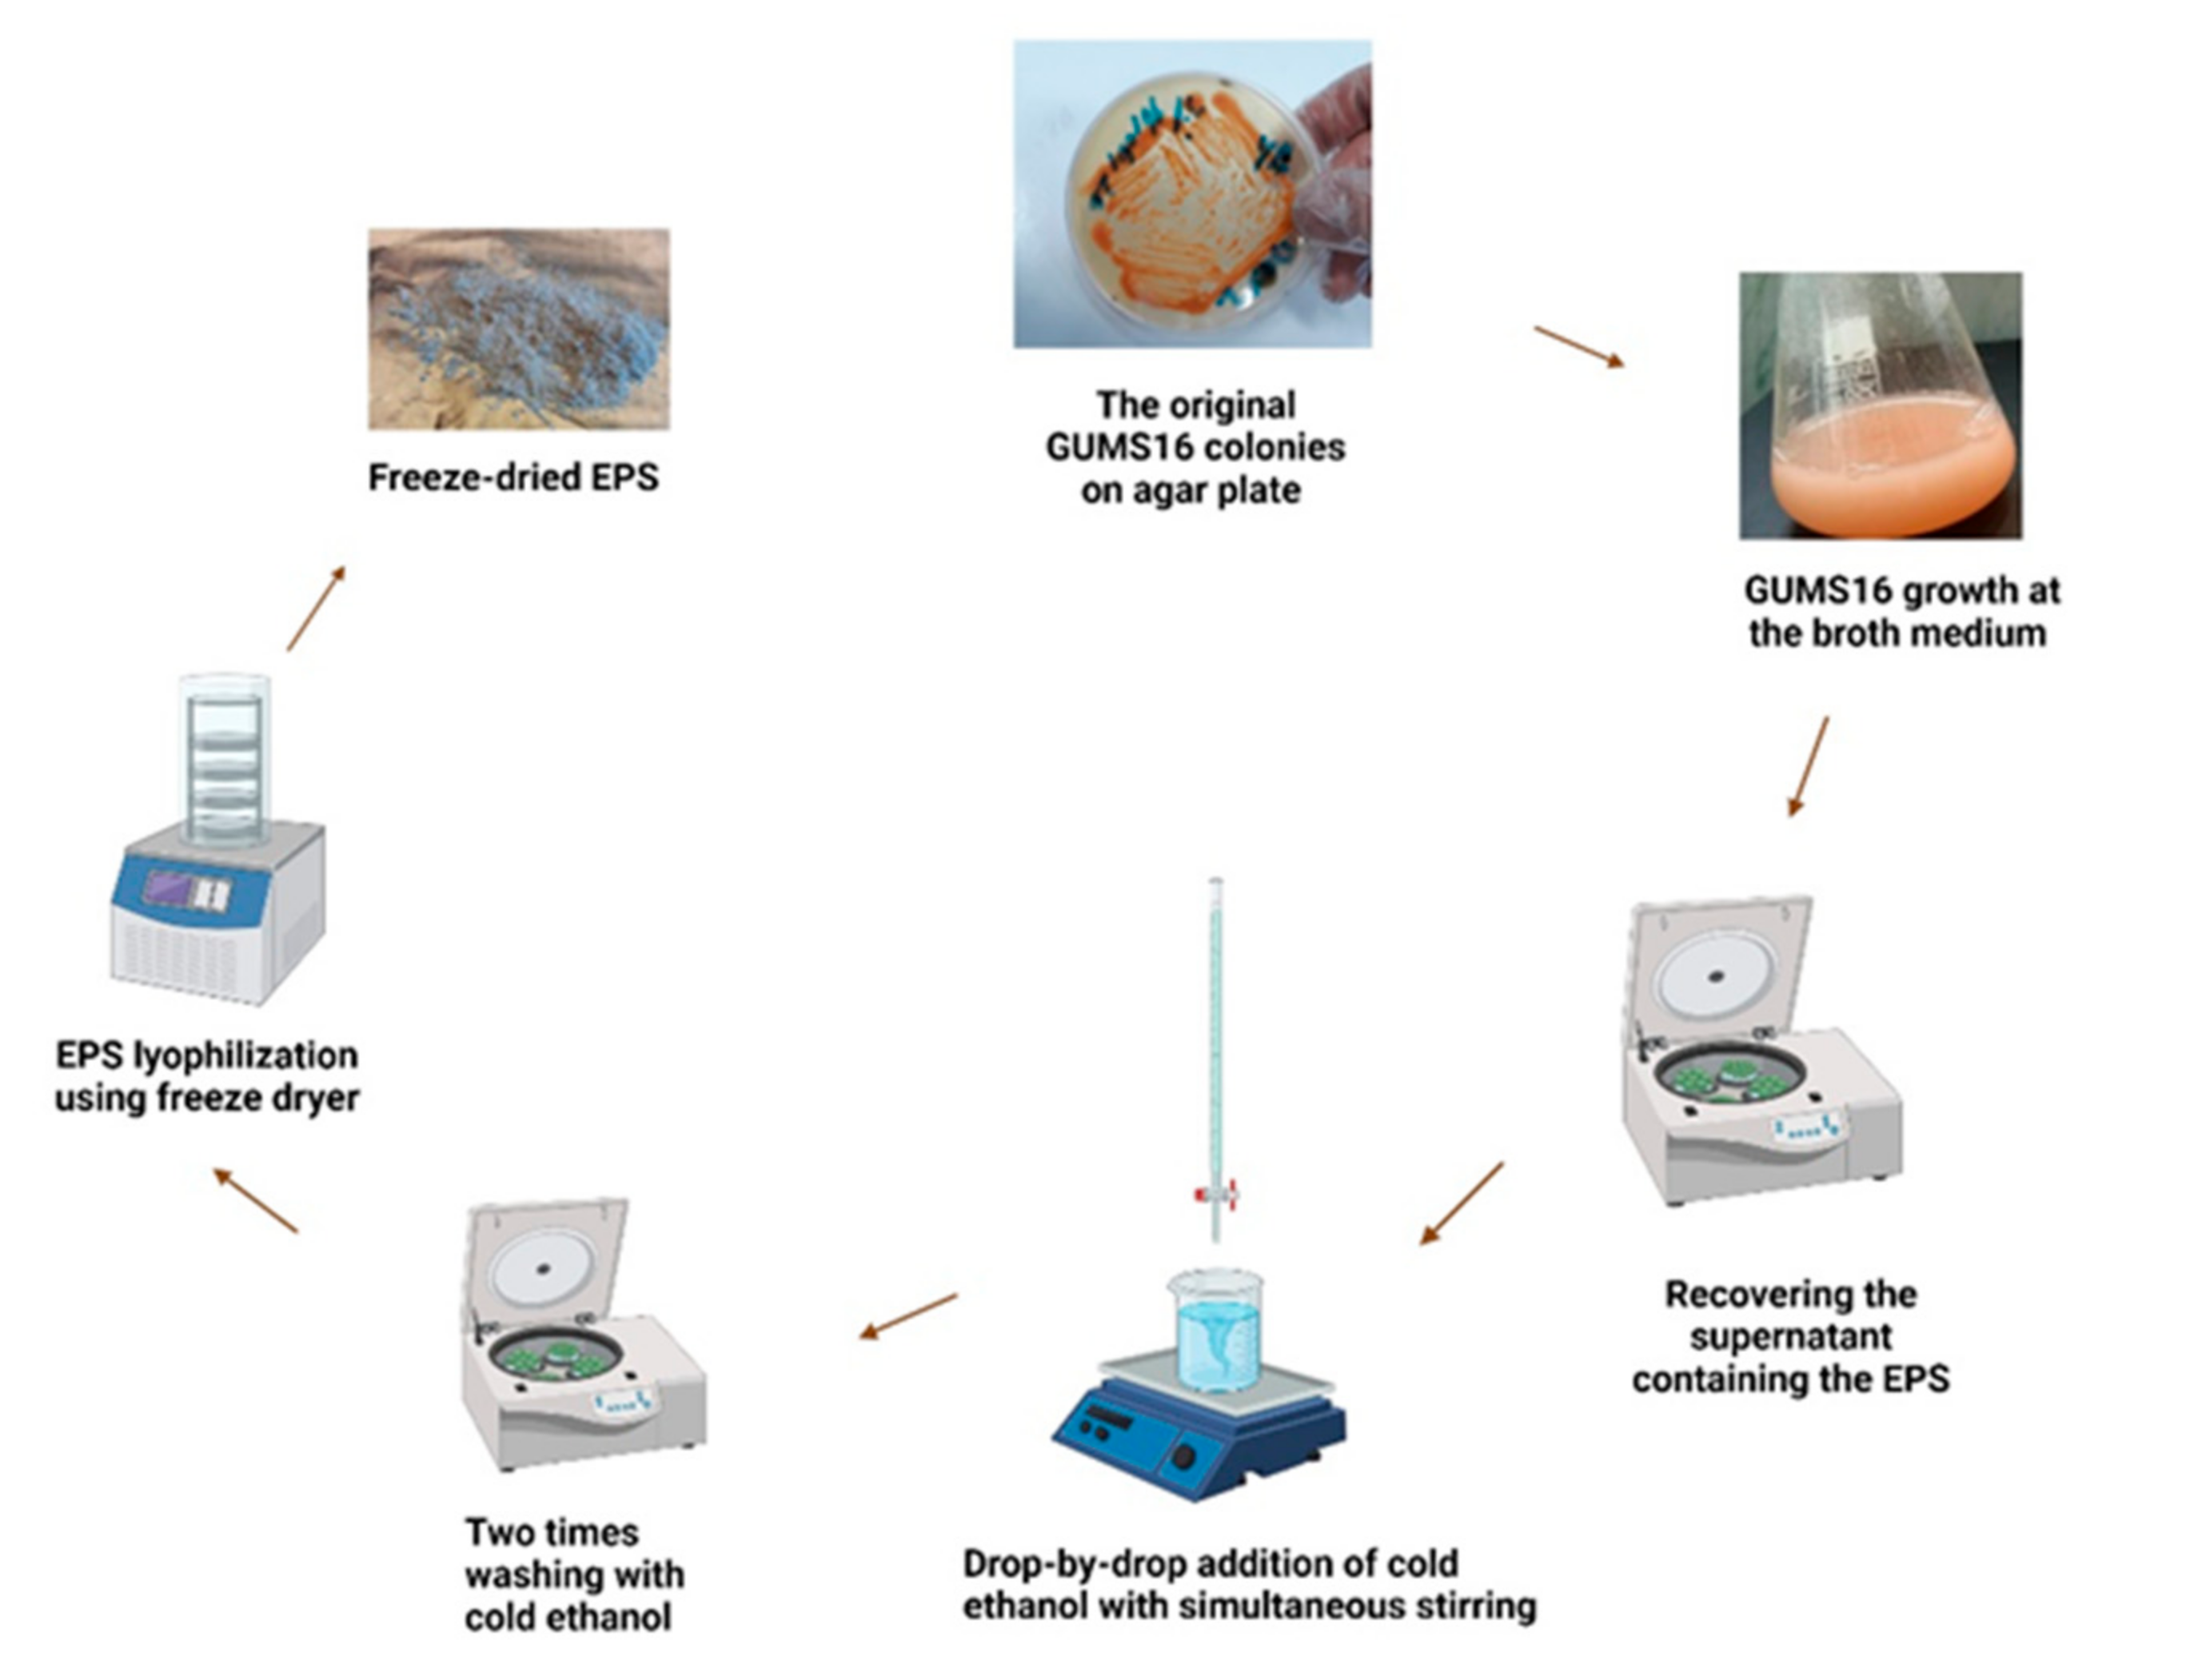
2.1. Microorganism

The Rhodotorula mucilaginosa sp. GUMS16, a cold-adapted yeast we previously reported in [26] was employed. Briefly, Rhodotorula mucilaginosa sp. GUMS16 was isolated from leaf debris of Deylaman jungle, Guilan, Iran and then initially cultured using standard potato dextrose agar (PDA) plates (HiMedia, New Delhi) containing the culture medium. The incubation was undertaken at the temperature of 25 °C for 24 h. The resulting Rhodotorula mucilaginosa sp. GUMS16 was manifested as orange-colored colonies.

2.2. Preparation of Inoculum

The 24 h-old culture, at the logarithmic stage of growth, with an optical density (600 nm) of 0.8, was used as the inoculum in all experiments. These cultures were used as inoculum at 10% (v/v) for all the experiments.

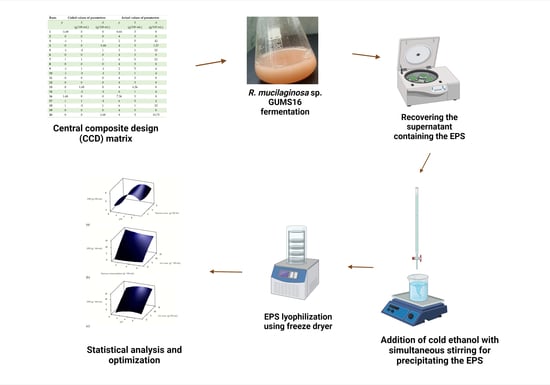
2.3. Experimental Design, Statistical Analysis, and Optimization

CCD methodology based on using a five-level rotatable central composite design was employed to optimize the culture conditions of pH, sucrose, and ammonium sulfate concentrations for enhanced EPS production by Rhodotorula mucilaginosa sp. GUMS16. A total of 20 experiments were conducted. Based on the ranges of the process variables specified above, the coded values were determined as follows [27];
X i = X i X 0 Δ X
where Xi denotes the coded value of the process variable; Xi is the process variable’s actual value; X0 denotes the actual value of Xi at the center point with the step change value denoted as ΔX.
The values of the process variables and their associated coded values are presented in Table 1.
The significance of each process variable on the EPS yield was assessed based on the analysis of the associated student F-value of the process variable compared to the critical F-value (determined to be 3.37 for a 95% confidence level) of the experimental data as described in the literature [28,29]. In this approach, the significance of a process variable is determined by the magnitude by which the statistical student F-value exceeds the critical F-value. The significance of the variables was also assessed using the p-value of each process variable such that the level of significance was determined by the magnitude of difference of p-value from 0.05 for a 95% confidence level. The experimental results of the central composite design were then employed to generate an empirical relation in accordance with the second-order polynomial equation as follows:
Y E P S = X 0 + i = 1 3 b i X i + i = 1 3 b i i X i 2 + i = 1 3 j = 1 b i j X i X j
where YEPS denotes the EPS yield, g/100 mL, X0 represents the model intercept, Xi (Xj) represents the ith (jth) system variable (pH, sucrose, and ammonium sulfate concentrations, g/100 mL), bi, bii, and bij represent the model regression coefficients.
The sufficiency of the developed empirical model was initially assessed via the determination of the associated correlation coefficient (R2) [30]. Further assessments involved statistical analysis using analysis of variance (ANOVA). Statistical analysis of the data was performed using the statistical software of Minitab® 17.1.0 (Minitab, Inc., State College, PA, USA). The empirical model was subsequently employed to determine the values of the process variables that will facilitate an optimal EPS yield via the numerical optimization algorithm method available in Minitab software. The estimated operating conditions for the optimal EPS yield were then validated experimentally. The predicted optimal EPS yield and the experimentally optimal EPS yield were subsequently compared.

2.4. Culture Conditions

The Potato Dextrose Broth (PDB) (HiMedia, New Delhi) containing 2.4 g/100 mL of dextrose was modified with different combinations of the independent variables (pH, sucrose, and ammonium sulfate concentrations), following the experimental design. The ranges of the pH value, sucrose, and ammonium sulfate concentrations investigated were specified as 2–6, 1–5 (g/100 mL) and 4–12 (g/100 mL), respectively. All experiments were conducted in 250 mL Erlenmeyer flasks containing 90 mL of the growth medium. After inoculation, the flasks were incubated with shaking at 150 rpm in the dark for 5 days at 25 °C. The sucrose was added in addition to the dextrose which present in PDB, since sucrose has reported as the preferred carbon source for EPS production [31,32]. Furthermore, most microorganisms have been reported to use ammonium salts or amino acids as nitrogen sources for polysaccharide production [33], and several studies had previously demonstrated the sufficiency of the use of ammonium sulfate to achieve optimal EPS yields [23,34]. Therefore, ammonium sulfate was selected as the preferred nitrogen source.

2.5. Recovery of the EPS

After incubation, the EPS containing media was centrifuged at 8500× g for 30 min at 4 °C and the supernatant containing the EPS was kept. The EPS was precipitated from the supernatant using the drop-by-drop addition of cold 96 wt.% ethanol with simultaneous stirring followed by overnight incubation at 4 °C. The precipitated EPS was also washed with cold ethanol followed by 8500× g centrifugation for 20 min at 4 °C. After evaporation of ethanol (i.e., when the mass of the EPS pellets remained constant), the resulting EPS pellet was dissolved in distilled water, frozen and lyophilized using a freeze dryer instrument (Christ Alpha 1-2 LDplus, Nemacka, Germany). Finally, the mass of EPS produced was measured using a precision analytical balance (Sartorius Quintix®, Göttingen, Germany), in g. The yield was reported as the mass of EPS in g per 100 mL of the substrate and denoted as YEPS. Figure 1 shows the schematic diagram of the EPS extraction and recovery process.

3. Results and Discussions

3.1. Model Fitting

The CCD and the yields for the different levels of the process variables investigated are shown in Table 2. Table 2 shows that the highest EPS yield is 13.05 g/100 mL at pH, sucrose concentration and ammonium sulfate concentration conditions of 4, 3 g/100 mL and 14.73 g/100 mL, respectively. Table 2 highlights the favorable impact of the nitrogen source in EPS yield when Rhodotorula mucilaginosa sp. GUMS16 was employed. Therefore, EPS yield positively correlates with a higher nitrogen source concentration, highlighting the important role of nitrogen in the biosynthesis of proteins and polysaccharides by the yeast [35,36].
Employing the experimental results presented in Table 2 in conjunction with the model form highlighted in Equation (3), to generate a fitted empirical relation describing EPS yield as a function of the process variables as follows.
Y E P S = 4.82 + 1.641 p 0.447 S + 1.310 A 0.1726 p 2 + 0.0821 S 2 0.0138 A 2 + 0.0266 p × S + 0.0039 p × A 0.0414 s × A
This fitted relation was determined to have a coefficient of determination (R2) value of 0.9615, indicating that the fitted relation did not sufficiently describe only 3.85% of the experimental dates data and that the model is sufficient to describe the experimental results given the R2 value exceeds the lowest acceptable R2 value of 0.7 for scientific studies [37,38]. The fitted relation in Equation (3) was therefore employed in assessing the effects of the process variables using surface plots in the subsequent section.

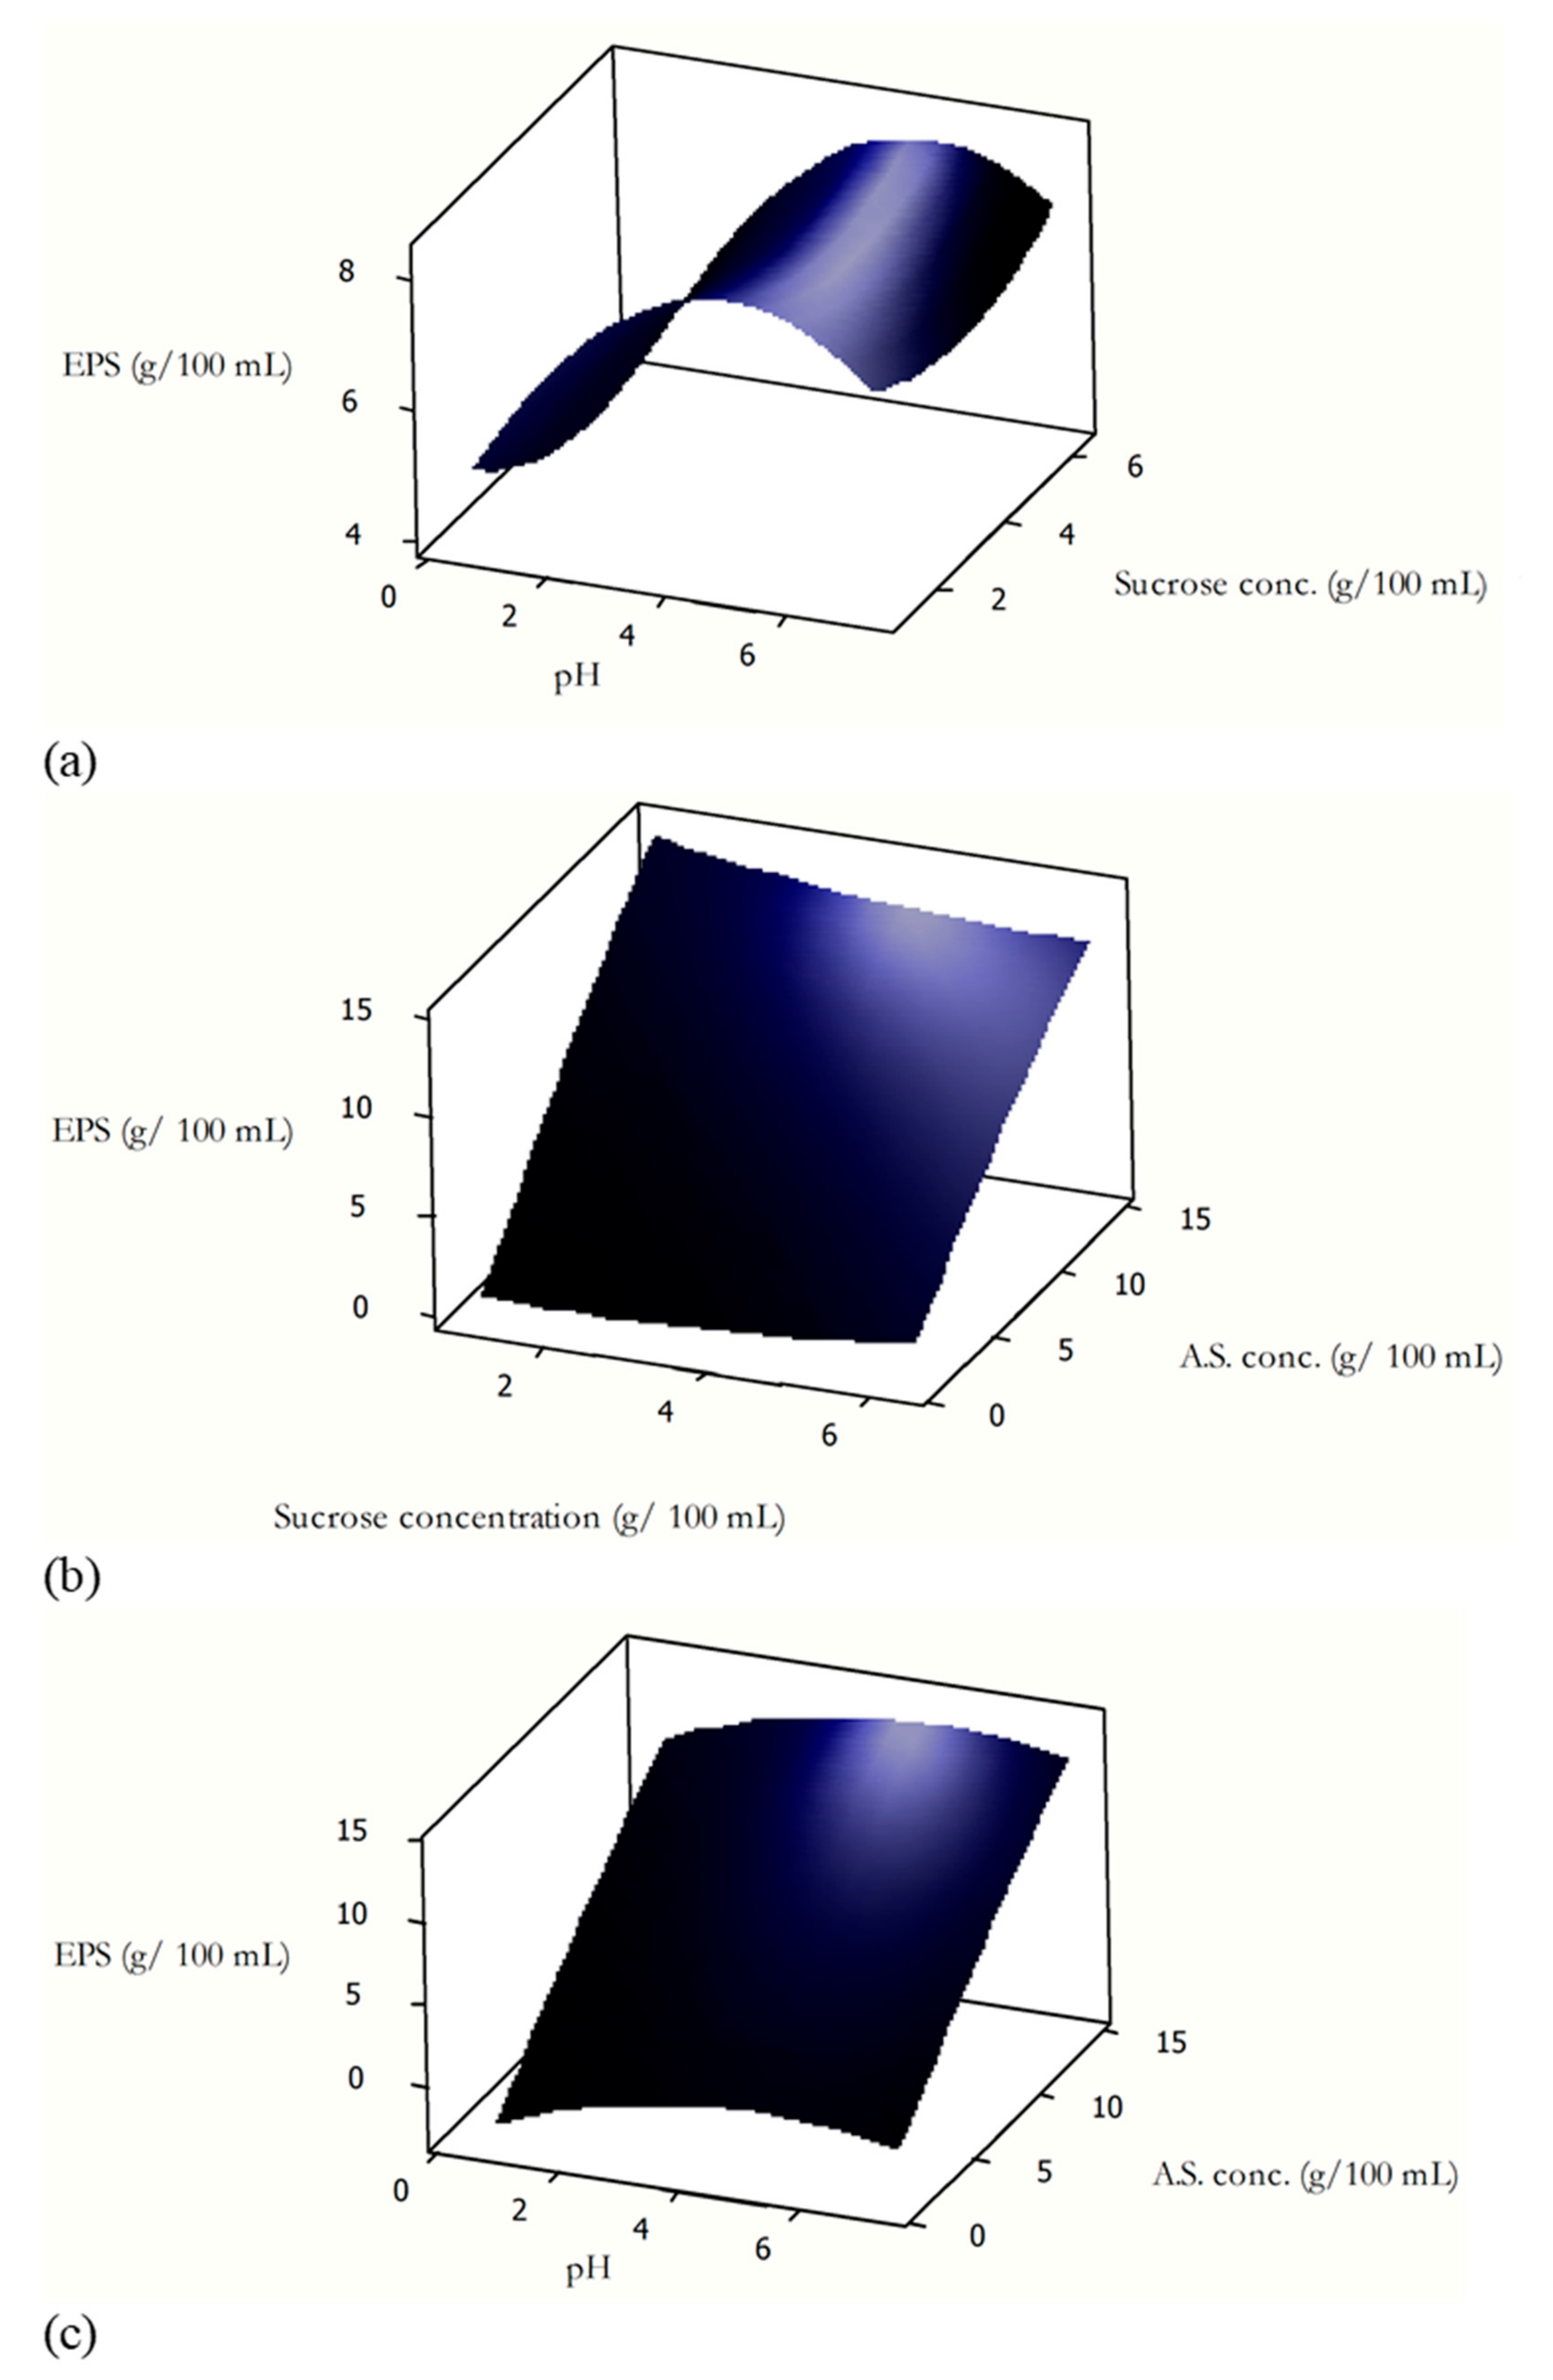
3.2. Effects of the Process Variables

3.2.1. Effect of pH

Figure 2a shows that EPS yield initially increased from 5 g/100 mL to 8 g/100 mL as the pH increases from 0.64 to 4, with the EPS yield decreasing with further increments in the pH value. This observation is indicative of the unfavorable impact of alkaline environments on EPS yield. It is consistent with the literature since the EPS chemical structure is modified and disrupted at high pH conditions [39]. The preference for lower pH values to enable EPS production is also consistent with earlier studies that showed enhanced EPS production by microbes of Cryptococcus genus, Lactobacillus casei CRL 87 and Lactobacillus confusus TISTR 1498 at pH values of 4, 6, and 5.5, respectively [31,40]. Notably, while low pH values may favor EPS production [41], the result suggests that highly acidic conditions (i.e., pH < 4) may lead to unwanted excessive acidification during EPS accumulation, which may negatively impact the yeast growth.

3.2.2. Effect of Ammonium Sulfate Concentration

Figure 2b highlights a positive correlation between the ammonium sulfate concentration (i.e., nitrogen source) and the EPS yield since EPS yield increases from ~0.19 to ~13 g/100 mL as the concentration of ammonium sulfate increases from ~1.27 to ~14.73 g/100 mL. This observation indicates the favorable role of nitrogen on EPS production by Rhodotorula mucilaginosa sp. GUMS16. However, a critical review of existing literature shows significant variations in the effect of higher nitrogen concentrations on EPS yield. Some previous reports showed that higher nitrogen presented unfavorable effects on the EPS yield by P. acidipropionici and on the other hand, favorable effects on EPS production by S. thermophilus [42].
These observations suggested that the effect of nitrogen on EPS yield is microbe microbe-specific and that there is a need to determine the ideal nitrogen concentration for enhanced EPS yield on a ‘case by case’ basis [42].

3.2.3. Effect of Sucrose Concentration

Figure 2c highlights the marginal effect of increments in sucrose concentrations (i.e., carbon source) on the yield of EPS produced by Rhodotorula mucilaginosa sp. GUMS16. This observation is consistent with the literature, which showed positive correlations between EPS production and carbon concentration [41,43,44]. Some studies have highlighted that the positive effect of carbon on EPS yield is not sustained, with excessive carbon leading to a reduction in the EPS yield due to catabolite repression [45]. The absence of this effect (i.e., increasing carbon leading to decrease in EPS yield) suggests that the maximum carbon concentration may yet to be attained, with higher sucrose concentrations proposed to be studied in future investigations. Given that the results show that while higher ammonium sulfate (i.e., nitrogen source) concentrations enable higher EPS yields, higher sucrose concentrations (i.e., carbon source) lead to marginal improvements in EPS yield overall. This observation implies that lower carbon to nitrogen ratios favor enhanced EPS productivity when Rhodotorula mucilaginosa sp is employed. This observation is consistent with the study by [36] in which the EPS yield by Haloferax mediterranei was shown to present a linear and negative correlation with the C/N ratio. In another study, variations in the C/N ratio did not lead to changes in the EPS productivity [46], thus suggesting that the effect of the C/N ratio on EPS yield is also microbe-specific.
Table 3 shows that variations in the ammonium sulfate (A) constitutes will present the most significant independent effect on EPS yield as illustrated by the highest F-value of 208.80 compared to the F-values of 7.46 and 1.15 for pH value (p) and sucrose concentration (S) respectively. The results also imply that variations in pH constitute the next most significant parameter that influences EPS production, given that the associated F-value is greater than the critical F-value of 3.37. These results also indicate that the effect of variations in sucrose concentration (S) present the least significant process variable given that its F-value of 1.15 is less than the critical F-value of 3.37. The calculated F-values of the interactions of the process variables of p × S, p × A and A × S terms were not shown to be significant since the F-values were determined to be less than critical F-value of 3.37.
The empirical relation in Equation (3) and the optimization algorithm in Minitab were employed in determining the conditions that facilitate optimum EPS production by Rhodotorula mucilaginosa sp. GUMS16. The conditions of pH, sucrose concentration and ammonium sulfate concentration will facilitate the predicted optimal EPS yield of 14.83 g/100 mL were 5, 1 g/100 mL and 14.73 g/100 mL, respectively. The validation of these process conditions for optimal EPS yield was undertaken, and the experimentally determined results are presented in Table 4.
Table 4 shows that the predicted optimal EPS yield at the determined conditions is comparable with the experimentally determined EPS yield, with a relative absolute error of 0.09 calculated.
A comparison of the optimum EPS of 13.48 g/100 mL as determined in the current study with the EPS reported in previously reported works demonstrates the high productivity of the EPS from Rhodotorula mucilaginosa sp. GUMS16. Of course, the dextrose content of the PDB of 2.4 g/100 mL may also contribute as a carbon source, thus may partly explain the high yield of crude EPS recorded. The yield of crude EPS from Rhodotorula mucilaginosa sp. GUMS16 may be indicative of its commercial potential since its EPS yield exceeded the reported optimal EPS yields of 2.2 g/100 mL, 11.8 g/100 mL and 12.6 g/100 mL generated from Bacillus mucilaginosus CGMCC5766, Cupriavidus pauculus KPS 201 and Spirulina Platensis, respectively, reported in the literature [47,48,49]. The total sugar content of the optimally generated EPS was also determined using the phenol sulfuric acid method [50,51]. It was determined that the mean sugar content was 60% mass basis and was comparable to the sugar content of EPS reported in a previous work that ranges from 34–71% mass basis [52]. Other components in EPS such as proteins and macro-molecules such as DNA, lipids, and humic substances were not measured in the current study. The current study acknowledges that further purification processes involving ion-exchange chromatography and size exclusion chromatography may be required to enhance the purity of the EPS extract [53]. These additional purification steps have not been considered in the present study, implying that the EPS yield reported in the current study may be referred to as ‘crude EPS’. We also acknowledge that further purification may lead to a change in the EPS yield. The impacts of such purifications on EPS yield will be investigated in future studies. Nevertheless, the present study establishes the potential of employing Rhodotorula mucilaginosa sp. GUMS16, to facilitate optimal production of useful EPS. Crucially, the current study also aligns with current research interest in the exploration of the circular economy paradigm [54], which involves the recovery of high value products (i.e., EPS) from low value feeds (i.e., ‘soft’ carbon sources like sucrose).

4. Conclusions

The present study investigated the production of extracellular polysaccharides (EPS) by Rhodotorula mucilaginosa sp. GUMS16, with emphasis on the process conditions that facilitate enhanced EPS yield. In the study, the process conditions of carbon concentration, nitrogen concentration, and pH were assessed, with sucrose and ammonium sulfate employed as carbon and nitrogen precursors, respectively. The study established that changes in ammonium sulfate (nitrogen precursor) constituted the most important factor that influenced EPS yields, with sucrose (carbon precursor) concentration shown to be the least important process variable in the present study. Further investigations also established that the optimal crude EPS yield of 13.48 g/100 mL from Rhodotorula mucilaginosa sp. GUMS16 was achieved at pH, sucrose concentration and ammonium sulfate conditions of 5.1 g/100 mL 14.73 g/100 mL, respectively, were imposed.

Author Contributions

Conceptualization, M.H., A.R.G. and A.S; data generation and validation, A.R.G. and F.S; methodology, O.V.O., A.S. and M.H; software, O.V.O.; validation, M.H.; writing—original draft preparation, A.R.G., O.V.O., M.H. and A.S.; writing—review and editing, A.R.G., F.S., O.V.O., M.H. and A.S. All authors have read and agreed to the published version of the manuscript.

Funding

This research received no external funding.

Institutional Review Board Statement

Not applicable.

Informed Consent Statement

Not applicable.

Acknowledgments

M.H. and A.R.G. acknowledge Guilan University of Medical Sciences and Guilan Science and Technology Park for providing support to this work. O.V.O. gratefully acknowledges the financial support of Wallonia-Brussels International via the Wallonie–Bruxelles International (WBI) excellence Postdoctoral fellowship.

Conflicts of Interest

The authors declare no conflict of interest.

References

  1. Shanmugam, M.; Abirami, R.G. Microbial Polysaccharides—Chemistry and Applications. J. Biol. Act. Prod. Nat. 2019, 9, 73–78. [Google Scholar] [CrossRef]
  2. Luft, L.; Confortin, T.C.; Todero, I.; Zabot, G.L.; Mazutti, M.A. An overview of fungal biopolymers: Bioemulsifiers and biosurfactants compounds production. Crit. Rev. Biotechnol. 2020, 40, 1059–1080. [Google Scholar] [CrossRef]
  3. Castillo, N.A.; Valdez, A.L.; Farina, J.I. Microbial production of Scleroglucan and downstream processing. Front. Microbiol. 2015, 6, 1106. [Google Scholar] [CrossRef] [PubMed]
  4. Sugumaran, K.; Ponnusami, V. Review on production, downstream processing and characterization of microbial pullulan. Carbohydr. Polym. 2017, 173, 573–591. [Google Scholar]
  5. Hamidi, M.; Mirzaei, R.; Delattre, C.; Khanaki, K.; Pierre, G.; Gardarin, C.; Petit, E.; Karimitabar, F.; Faezi, S. Characterization of a new exopolysaccharide produced by Halorubrum sp. TBZ112 and evaluation of its anti-proliferative effect on gastric cancer cells. 3 Biotech 2019, 9, 1–8. [Google Scholar] [CrossRef] [PubMed]
  6. Smelcerovic, A.; Knezevic-Jugovic, Z.; Petronijevic, Z. Microbial polysaccharides and their derivatives as current and prospective pharmaceuticals. Curr. Pharm. Des. 2008, 14, 3168–3195. [Google Scholar] [CrossRef] [PubMed]
  7. Gupta, J.; Rathour, R.; Medhi, K.; Tyagi, B.; Thakur, I.S. 3-Microbial-derived natural bioproducts for a sustainable environment: A bioprospective for waste to wealth. In Refining Biomass Residues for Sustainable Energy and Bioproducts; Kumar, R.P., Gnansounou, E., Raman, J.K., Baskar, G., Eds.; Academic Press: Cambridge, MA, USA, 2020; pp. 51–85. [Google Scholar]
  8. Schmid, J.; Sieber, V.; Rehm, B. Bacterial exopolysaccharides: Biosynthesis pathways and engineering strategies. Front. Microbiol. 2015, 6, 496. [Google Scholar] [CrossRef] [Green Version]
  9. Ansorena, D.; Astiasarán, I. Fermented Foods: Composition and Health effects. In Encyclopedia of Food and Health; Caballero, B., Finglas, P.M., Toldrá, F., Eds.; Academic Press: Oxford, UK, 2016; pp. 649–655. [Google Scholar]
  10. Bomfeti, C.A.; Florentino, L.A.; Guimarães, A.P.; Cardoso, P.G.; Guerreiro, M.C.; Moreira, F.M.d.S. Exopolysaccharides produced by the symbiotic nitrogen-fixing bacteria of leguminosae. Revista Brasileira Ciência Solo 2011, 35, 657–671. [Google Scholar] [CrossRef] [Green Version]
  11. Ziadi, M.; Bouzaiene, T.; M’Hir, S.; Zaafouri, K.; Mokhtar, F.; Hamdi, M.; Boisset-Helbert, C. Evaluation of the Efficiency of Ethanol Precipitation and Ultrafiltration on the Purification and Characteristics of Exopolysaccharides Produced by Three Lactic Acid Bacteria. BioMed Res. Int. 2018, 2018, 1896240. [Google Scholar] [CrossRef] [Green Version]
  12. Banerjee, A.; Rudra, S.G.; Mazumder, K.; Nigam, V.; Bandopadhyay, R. Structural and Functional Properties of Exopolysaccharide Excreted by a Novel Bacillus anthracis (Strain PFAB2) of Hot Spring Origin. Indian J. Microbiol. 2018, 58, 39–50. [Google Scholar] [CrossRef]
  13. Freitas, F.; Torres, C.A.; Reis, M.A. Engineering aspects of microbial exopolysaccharide production. Bioresour. Technol. 2017, 245, 1674–1683. [Google Scholar] [CrossRef] [PubMed]
  14. Osemwegie, O.O.; Adetunji, C.O.; Ayeni, E.A.; Adejobi, O.I.; Arise, R.O.; Nwonuma, C.O.; Oghenekaro, A.O. Exopolysaccharides from bacteria and fungi: Current status and perspectives in Africa. Heliyon 2020, 6, e04205. [Google Scholar] [CrossRef] [PubMed]
  15. Mirzaei, M.; Okoro, O.V.; Nie, L.; Petri, D.F.S.; Shavandi, A. Protein-Based 3D Biofabrication of Biomaterials. Bioengineering 2021, 8, 48. [Google Scholar] [CrossRef]
  16. Shavandi, A.; Hosseini, S.; Okoro, O.V.; Nie, L.; Eghbali Babadi, F.; Melchels, F. 3D Bioprinting of Lignocellulosic Biomaterials. Adv. Healthc. Mater. 2020, 9, 2001472. [Google Scholar] [CrossRef] [PubMed]
  17. Donot, F.; Fontana, A.; Baccou, J.C.; Schorr-Galindo, S. Microbial exopolysaccharides: Main examples of synthesis, excretion, genetics and extraction. Carbohydr. Polym. 2012, 87, 951–962. [Google Scholar] [CrossRef]
  18. Hivechi, A.; Milan, P.B.; Modabberi, K.; Amoupour, M.; Ebrahimzadeh, K.; Gholipour, A.R.; Sedighi, F.; Amini, N.; Bahrami, S.H.; Rezapour, A.; et al. Synthesis and Characterization of Exopolysaccharide Encapsulated PCL/Gelatin Skin Substitute for Full-Thickness Wound Regeneration. Polymers 2021, 13, 854. [Google Scholar] [CrossRef]
  19. Mahapatra, S.; Banerjee, D. Fungal Exopolysaccharide: Production, Composition and Applications. Microbiol. Insights 2013, 6, 1–16. [Google Scholar] [CrossRef] [Green Version]
  20. Bhattacharyya, C.; Roy, R.; Tribedi, P.; Ghosh, A.; Ghosh, A. Chapter 11-Biofertilizers as substitute to commercial agrochemicals. In Agrochemicals Detection, Treatment and Remediation; Prasad, M.N.V., Ed.; Butterworth-Heinemann: Oxford, UK, 2020; pp. 263–290. [Google Scholar]
  21. Zisu, B.; Shah, N.P. Effects of pH, Temperature, Supplementation with Whey Protein Concentrate, and Adjunct Cultures on the Production of Exopolysaccharides by Streptococcus thermophilus 1275. J. Dairy Sci. 2003, 86, 3405–3415. [Google Scholar] [CrossRef] [Green Version]
  22. Torres, C.A.V.; Antunes, S.; Ricardo, A.R.; Grandfils, C.; Alves, V.D.; Freitas, F.; Reis, M.A.M. Study of the interactive effect of temperature and pH on exopolysaccharide production by Enterobacter A47 using multivariate statistical analysis. Bioresour. Technol. 2012, 119, 148–156. [Google Scholar] [CrossRef]
  23. Hereher, F.; ElFallal, A.; Abou-Dobara, M.; Toson, E.; Abdelaziz, M.M. Cultural optimization of a new exopolysaccharide producer “Micrococcus roseus”. Beni-Suef Univ. J. Basic Appl. Sci. 2018, 7, 632–639. [Google Scholar] [CrossRef]
  24. Imran, M.Y.M.; Reehana, N.; Jayaraj, K.A.; Ahamed, A.A.P.; Dhanasekaran, D.; Thajuddin, N.; Alharbi, N.S.; Muralitharan, G. Statistical optimization of exopolysaccharide production by Lactobacillus plantarum NTMI05 and NTMI20. Int. J. Biol. Macromol. 2016, 93, 731–745. [Google Scholar] [CrossRef]
  25. Ermiş, E.; Poyraz, E.; Dertli, E.; Yılmaz, M.T. Optimization of exopolysaccharide production of Lactobacillus brevis E25 using RSM and characterization. Sakarya Üniversitesi Fen Bilimleri Enstitüsü Dergisi 2020, 24, 151–160. [Google Scholar] [CrossRef]
  26. Hamidi, M.; Gholipour, A.R.; Delattre, C.; Sesdighi, F.; Seveiri, R.M.; Pasdaran, A.; Kheirandish, S.; Pierre, G.; Kozani, P.S.; Kozani, P.S. Production, characterization and biological activities of exopolysaccharides from a new cold-adapted yeast: Rhodotorula mucilaginosa sp. GUMS16. Int. J. Biol. Macromol. 2020, 151, 268–277. [Google Scholar] [CrossRef]
  27. Mohammadi, R.; Mohammadifar, M.A.; Mortazavian, A.M.; Rouhi, M.; Ghasemi, J.B.; Delshadian, Z. Extraction optimization of pepsin-soluble collagen from eggshell membrane by response surface methodology (RSM). Food Chem. 2016, 190, 186–193. [Google Scholar] [CrossRef] [PubMed]
  28. Okoro, O.V.; Sun, Z.; Birch, J. Experimental evaluation of a polystyrene sulphonic acid resin catalyst in the hydrolysis of low-grade lipids from the meat processing industry. Biomass Bioenergy 2018, 116, 49–59. [Google Scholar] [CrossRef]
  29. Roosta, M.; Ghaedi, M.; Asfaram, A. Simultaneous ultrasonic-assisted removal of malachite green and safranin O by copper nanowires loaded on activated carbon: Central composite design optimization. RSC Adv. 2015, 5, 57021–57029. [Google Scholar] [CrossRef]
  30. Nie, L.; Chang, P.; Liang, S.; Hu, K.; Hua, D.; Liu, S.; Sun, J.; Sun, M.; Wang, T.; Okoro, O.V.; et al. Polyphenol rich green tea waste hydrogel for removal of copper and chromium ions from aqueous solution. Clean. Eng. Technol. 2021, 4, 100167. [Google Scholar] [CrossRef]
  31. Pavlova, K.; Koleva, L.; Kratchanova, M.; Panchev, I. Production and characterization of an exopolysaccharide by yeast. World J. Microbiol. Biotechnol. 2004, 20, 435–439. [Google Scholar] [CrossRef]
  32. Pavlova, K.; Panchev, I.; Krachanova, M.; Gocheva, M. Production of an exopolysaccharide by Antarctic yeast. Folia Microbiol. 2009, 54, 343. [Google Scholar] [CrossRef] [PubMed]
  33. Sutherland, I.W. Biosynthesis of Microbial Exopolysaccharides. In Advances in Microbial Physiology; Rose, A.H., Morris, J.G., Eds.; Academic Press: Cambridge, MA, USA, 1982; Volume 23, pp. 79–150. [Google Scholar]
  34. Wang, Y.-C.; Lin, F.-Y.; Hsu, T.-H. Effects of Nitrogen from Different Sources on Mycelial Biomass and Polysaccharide Production and Pellet Morphology in Submerged Cultures of Grifola frondosa. BioResources 2021, 16, 2937–2952. [Google Scholar] [CrossRef]
  35. Valentino, F.; Karabegovic, L.; Majone, M.; Morgan-Sagastume, F.; Werker, A. Polyhydroxyalkanoate (PHA) storage within a mixed-culture biomass with simultaneous growth as a function of accumulation substrate nitrogen and phosphorus levels. Water Res. 2015, 77, 49–63. [Google Scholar] [CrossRef]
  36. Cui, Y.-W.; Shi, Y.-P.; Gong, X.-Y. Effects of C/N in the substrate on the simultaneous production of polyhydroxyalkanoates and extracellular polymeric substances by Haloferax mediterranei via kinetic model analysis. RSC Adv. 2017, 7, 18953–18961. [Google Scholar] [CrossRef] [Green Version]
  37. Braun, M.; Altan, H.; Beck, S.J.A.E. Using regression analysis to predict the future energy consumption of a supermarket in the UK. Appl. Energy 2014, 130, 305–313. [Google Scholar] [CrossRef] [Green Version]
  38. Okoro, O.V.; Sun, Z.; Birch, J.J.S. Catalyst-free biodiesel production methods: A comparative technical and environmental evaluation. Sustainability 2018, 10, 127. [Google Scholar] [CrossRef] [Green Version]
  39. Goh, K.K.T. Isolation and Characterisation of Bacterial Exopolysaccharide Produced by Lactobacillus Delbrueckii Subsp Bulgaricus NCFB 2483 and Sphingomonas Elodea ATCC31461. Ph.D. Thesis, Massey University, Palmerston North, New Zealand, 30 July 2004. [Google Scholar]
  40. Seesuriyachan, P.; Kuntiya, A.; Techapun, C. Exopolysaccharide production by Lactobacillus confusus TISTR 1498 using coconut water as an alternative carbon source: The effect of peptone, yeast extract and beef extract. Sonklanakarin J. Sci. Technol. 2011, 33, 379. [Google Scholar]
  41. Cho, D.H.; Chae, H.J.; Kim, E.Y. Synthesis and characterization of a novel extracellular polysaccharide by Rhodotorula glutinis. Appl. Biochem. Biotechnol. 2001, 95, 183–193. [Google Scholar] [CrossRef]
  42. Lo, Y.M.; Argin-Soysal, S.; Hsu, C.-H. Chapter 22-Bioconversion of Whey Lactose into Microbial Exopolysaccharides. In Bioprocessing for Value-Added Products from Renewable Resources; Yang, S.-T., Ed.; Elsevier: Amsterdam, The Netherlands, 2007; pp. 559–583. [Google Scholar]
  43. Kaditzky, S.; Vogel, R.F. Optimization of exopolysaccharide yields in sourdoughs fermented by Lactobacilli. Eur. Food Res. Technol. 2008, 228, 291. [Google Scholar] [CrossRef]
  44. Ryan, P.; Ross, R.; Fitzgerald, G.; Caplice, N.; Stanton, C. Sugar-coated: Exopolysaccharide producing lactic acid bacteria for food and human health applications. Food Funct. 2015, 6, 679–693. [Google Scholar] [CrossRef]
  45. Maalej, H.; Hmidet, N.; Boisset, C.; Buon, L.; Heyraud, A.; Nasri, M. Optimization of exopolysaccharide production from Pseudomonas stutzeri AS22 and examination of its metal-binding abilities. J. Appl. Microbiol. 2015, 118, 356–367. [Google Scholar] [CrossRef] [PubMed]
  46. Van Dyk, J.S.; Kee, N.L.A.; Frost, C.L.; Pletschke, B.I. Extracellular polysaccharide production in Bacillus licheniformis SVD1 and its immunomodulatory effect. BioResources 2012, 7, 4976–4993. [Google Scholar] [CrossRef] [Green Version]
  47. Pal, A.; Paul, A.K. Optimization of Cultural Conditions for Production of Extracellular Polymeric Substances (EPS) by Serpentine Rhizobacterium Cupriavidus pauculus KPS 201. J. Polym. 2013, 2013, 692374. [Google Scholar] [CrossRef] [Green Version]
  48. Li, H.; Li, J.; Dou, W.; Shi, J.; Xu, Z. Enhancing the production of a novel exopolysaccharide by Bacillus mucilaginosus CGMCC5766 Using Statistical experiment design. Trop. J. Pharm. Res. 2013, 12, 711–718. [Google Scholar] [CrossRef] [Green Version]
  49. Nagananthini, G.; Rajapriya, S.; Arivuvel, P.S. Extraction And Optimization Of Extracellular Polysaccharide Production In Spirulina Platensis MK 343101. Int. J. Sci. Technol. Res. 2020, 9, 1–5. [Google Scholar]
  50. Vinothini, G.; Latha, S.; Arulmozhi, M.; Dhanasekaran, D. Statistical optimization, physio-chemical and bio-functional attributes of a novel exopolysaccharide from probiotic Streptomyces griseorubens GD5. Int. J. Biol. Macromol. 2019, 134, 575–587. [Google Scholar] [CrossRef]
  51. Wang, B.; Song, Q.; Zhao, F.; Han, Y.; Zhou, Z. Production optimization, partial characterization and properties of an exopolysaccharide from Lactobacillus sakei L3. Int. J. Biol. Macromol. 2019, 141, 21–28. [Google Scholar] [CrossRef] [PubMed]
  52. Gomaa, M.; Yousef, N. Optimization of production and intrinsic viscosity of an exopolysaccharide from a high yielding Virgibacillus salarius BM02: Study of its potential antioxidant, emulsifying properties and application in the mixotrophic cultivation of Spirulina platensis. Int. J. Biol. Macromol. 2020, 149, 552–561. [Google Scholar] [CrossRef]
  53. Leroy, F.; De Vuyst, L. Advances in production and simplified methods for recovery and quantification of exopolysaccharides for applications in food and health1. J. Dairy Sci. 2016, 99, 3229–3238. [Google Scholar] [CrossRef] [PubMed] [Green Version]
  54. Okoro, O.V.; Sun, Z. The characterisation of biochar and biocrude products of the hydrothermal liquefaction of raw digestate biomass. Biomass Convers. Biorefin. 2020. [Google Scholar] [CrossRef]
Figure 1. Exopolysaccharide extraction and recovery process from Rhodotorula mucilaginosa sp. GUMS16.
Chemengineering 05 00039 g001
Figure 2. Surface plot highlighting the effect of process variables on the crude EPS yield (EPS, g/100 mL). (a) denotes the 3D surface plot showing variations in crude EPS yield as pH and sucrose concentration changes at constant ammonium sulfate concentration of 8 g/ 100 mL. (b) denotes the 3D surface plot showing variations in crude EPS yield as sucrose concentration and ammonium sulfate concentration changes at a constant pH of 4. (c) denotes the 3D surface plot showing variations in crude EPS yield as pH and ammonium sulfate concentration changes at a constant sucrose concentration of 3 g/ 100 mL.
Chemengineering 05 00039 g002
Table 1. Coded and actual levels used in the CCD experimental method.
ParametersCoded and Actual Values for the
Levels in the Experimental Design
Low axial LowCenterHighHigh axial
Levels−2−10+1+2
pH value, p (dimensionless)0.642467.36
Sucrose concentration, S (g/100 mL)01356.36
Ammonium sulfate concentration, A (g/100 mL)1.27481214.73
Table 2. The yield of crude exopolysaccharides (EPSs) generated at the different process conditions.
RunsCoded Values of ParametersActual Values of ParametersResponse
pS
(g/100 mL)
A
(g/100 mL)
pS
(g/100 mL)
A
(g/100 mL)
YEPS
(g/100 mL)
1−1.68000.64382.59
20004388.13
3−111251210.09
400−1.68431.270.19
5−1−11211211.54
60004387.23
7111651210.64
80004387.00
9−11−12542.83
10−1−1−12142.93
110004387.53
120004386.84
1301.68046.3687.38
141−1−16142.93
161.68007.36387.99
1711−16543.23
181−11611211.64
190004387.91
20001.684314.7313.05
p denotes pH value, S denotes sucrose concentration, A denotes ammonium sulfate concentration and YEPS denotes crude EPS yield.
Table 3. Analysis of variance (ANOVA) of the model for the EPS production.
SourceDFAdj SSAdj MSF-Valuep-ValueRemarks
Model9226.5225.1724.960.00**
p17.527.527.460.02**
S11.161.161.150.31*
A1210.51210.51208.800.00**
p216.546.546.480.03**
S210.910.910.900.37*
A210.670.670.660.44*
p × S10.090.090.090.77*
p × A10.010.010.010.93*
A × S10.880.880.870.38*
In Table 3, * denotes low significance when the F-value is less than 3.37 while ** denotes high significance, i.e., when the F-value is greater than 3.37.
Table 4. Predicted and experimentally determined optimum EPS yields.
YEPS, (g/100 mL)
(Predicted. Yield)
YEPS, (g/100 mL)
(Exp. Yield)
Relative Absolute Error
14.8313.480.09
YEPS denotes the yield of exopolysaccharide.
Publisher’s Note: MDPI stays neutral with regard to jurisdictional claims in published maps and institutional affiliations.

