3.1. Model Validation: Standard Simulation
In this work, several simulations of the intraparticle model with non-uniform active phase distribution in a batch reactor were conducted. The same simulations were developed using three different categories of spherical catalysts, which are distinguished from each other by the distribution of the active phase, in order to observe a high production of the main product, the reaction intermediate B.
Starting from a standard simulation, obtained by selecting a set of parameters that could well describe the reactive process, the subsequent simulations were performed by decreasing and increasing (lower and higher value, respectively) every single coefficient significantly influencing the reaction environment. Parameters were set taking inspiration, as in our previous work [
5], by the physico-chemical properties of the components involved in the catalytic reaction of synthesis of ethylene oxide [
5,
6]. The coefficients used for the standard simulation are shown in
Table 1.
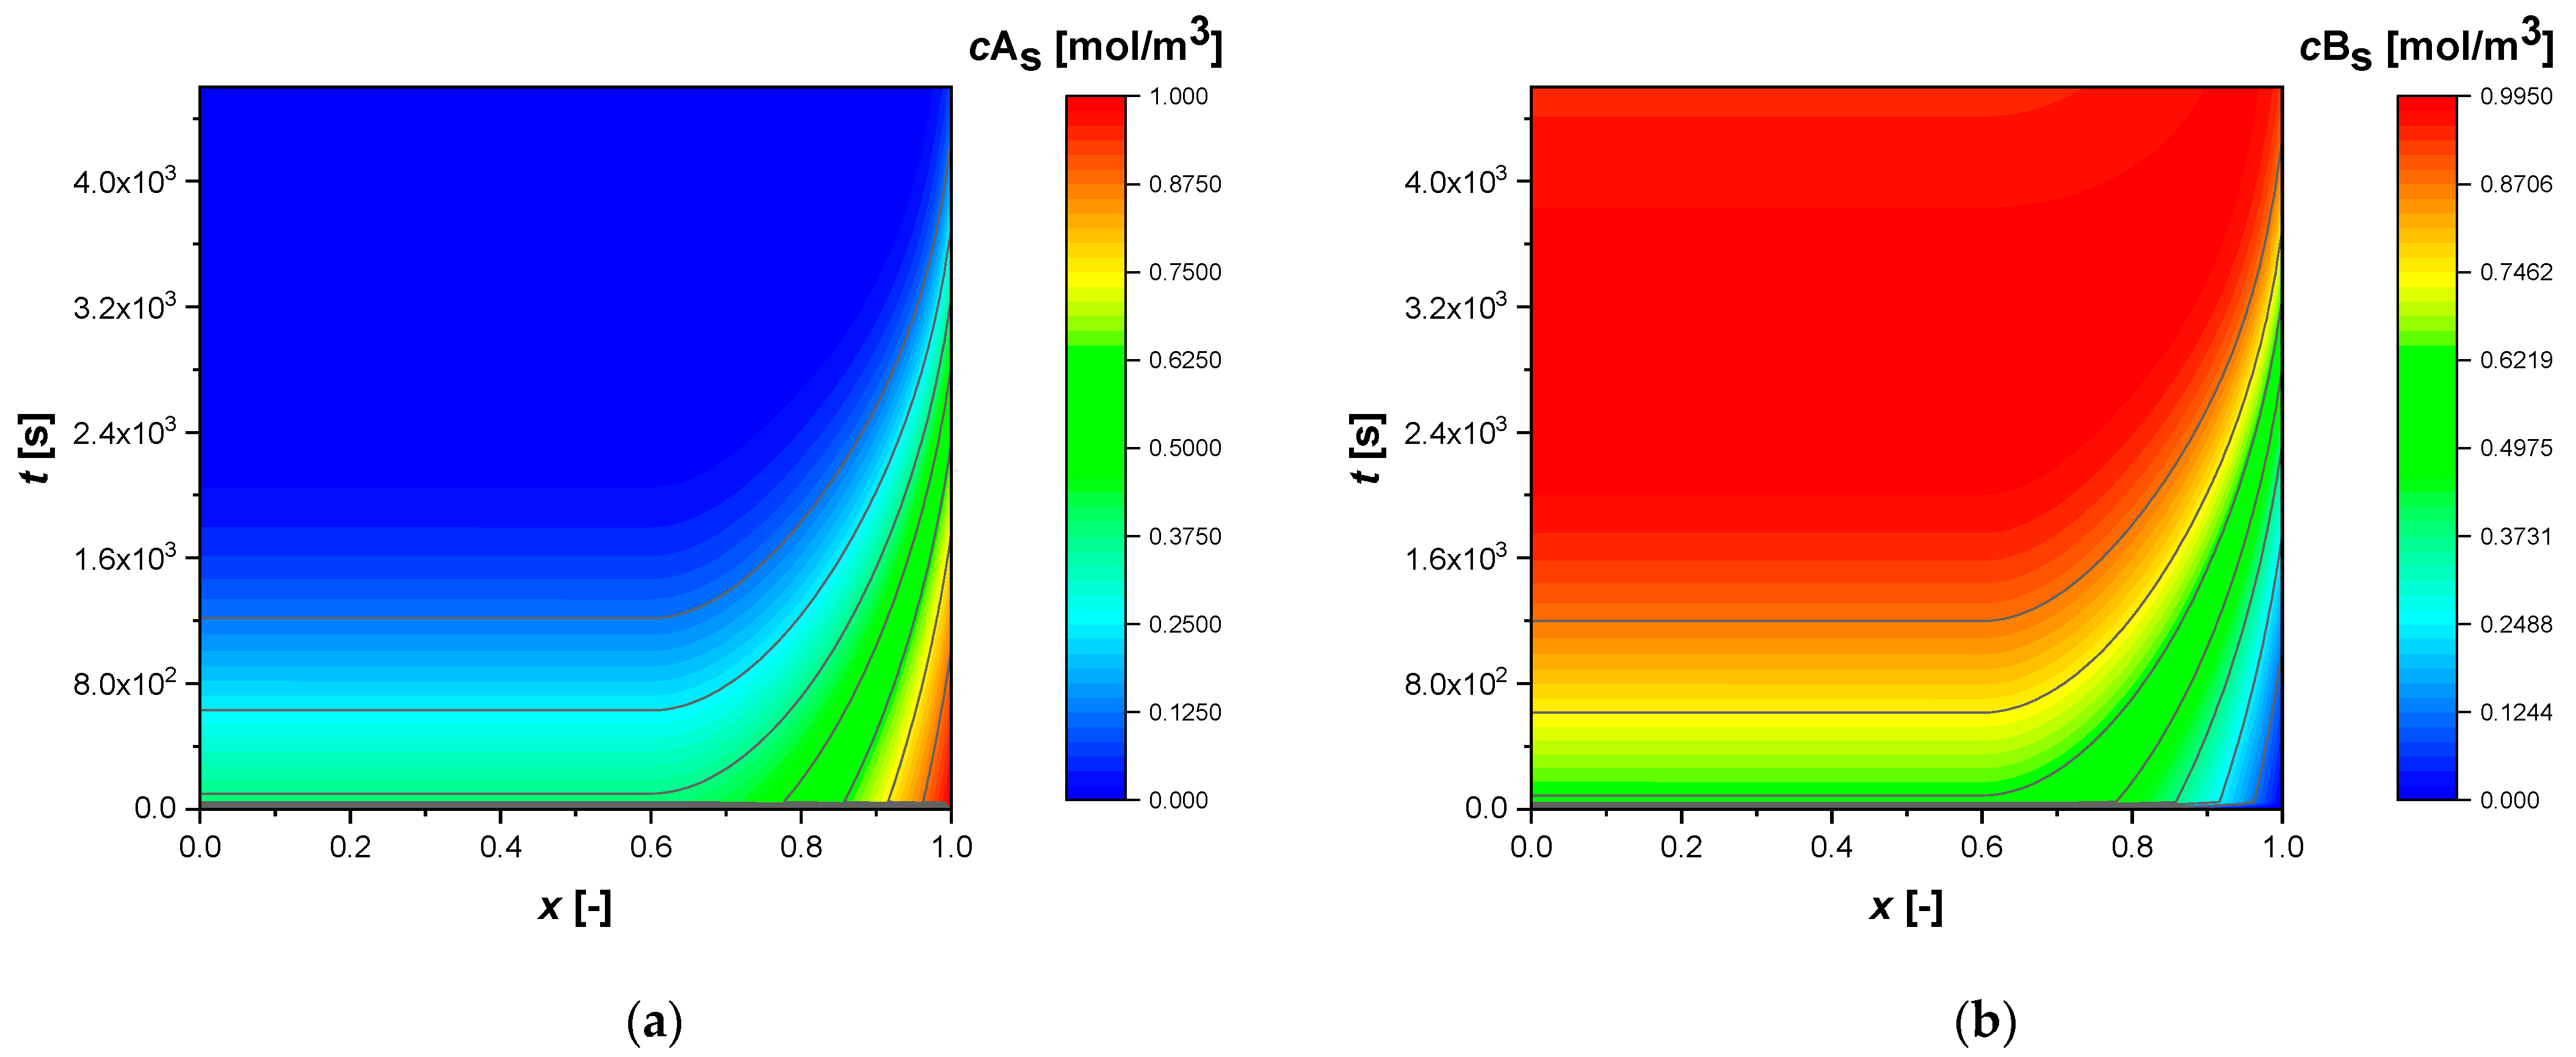
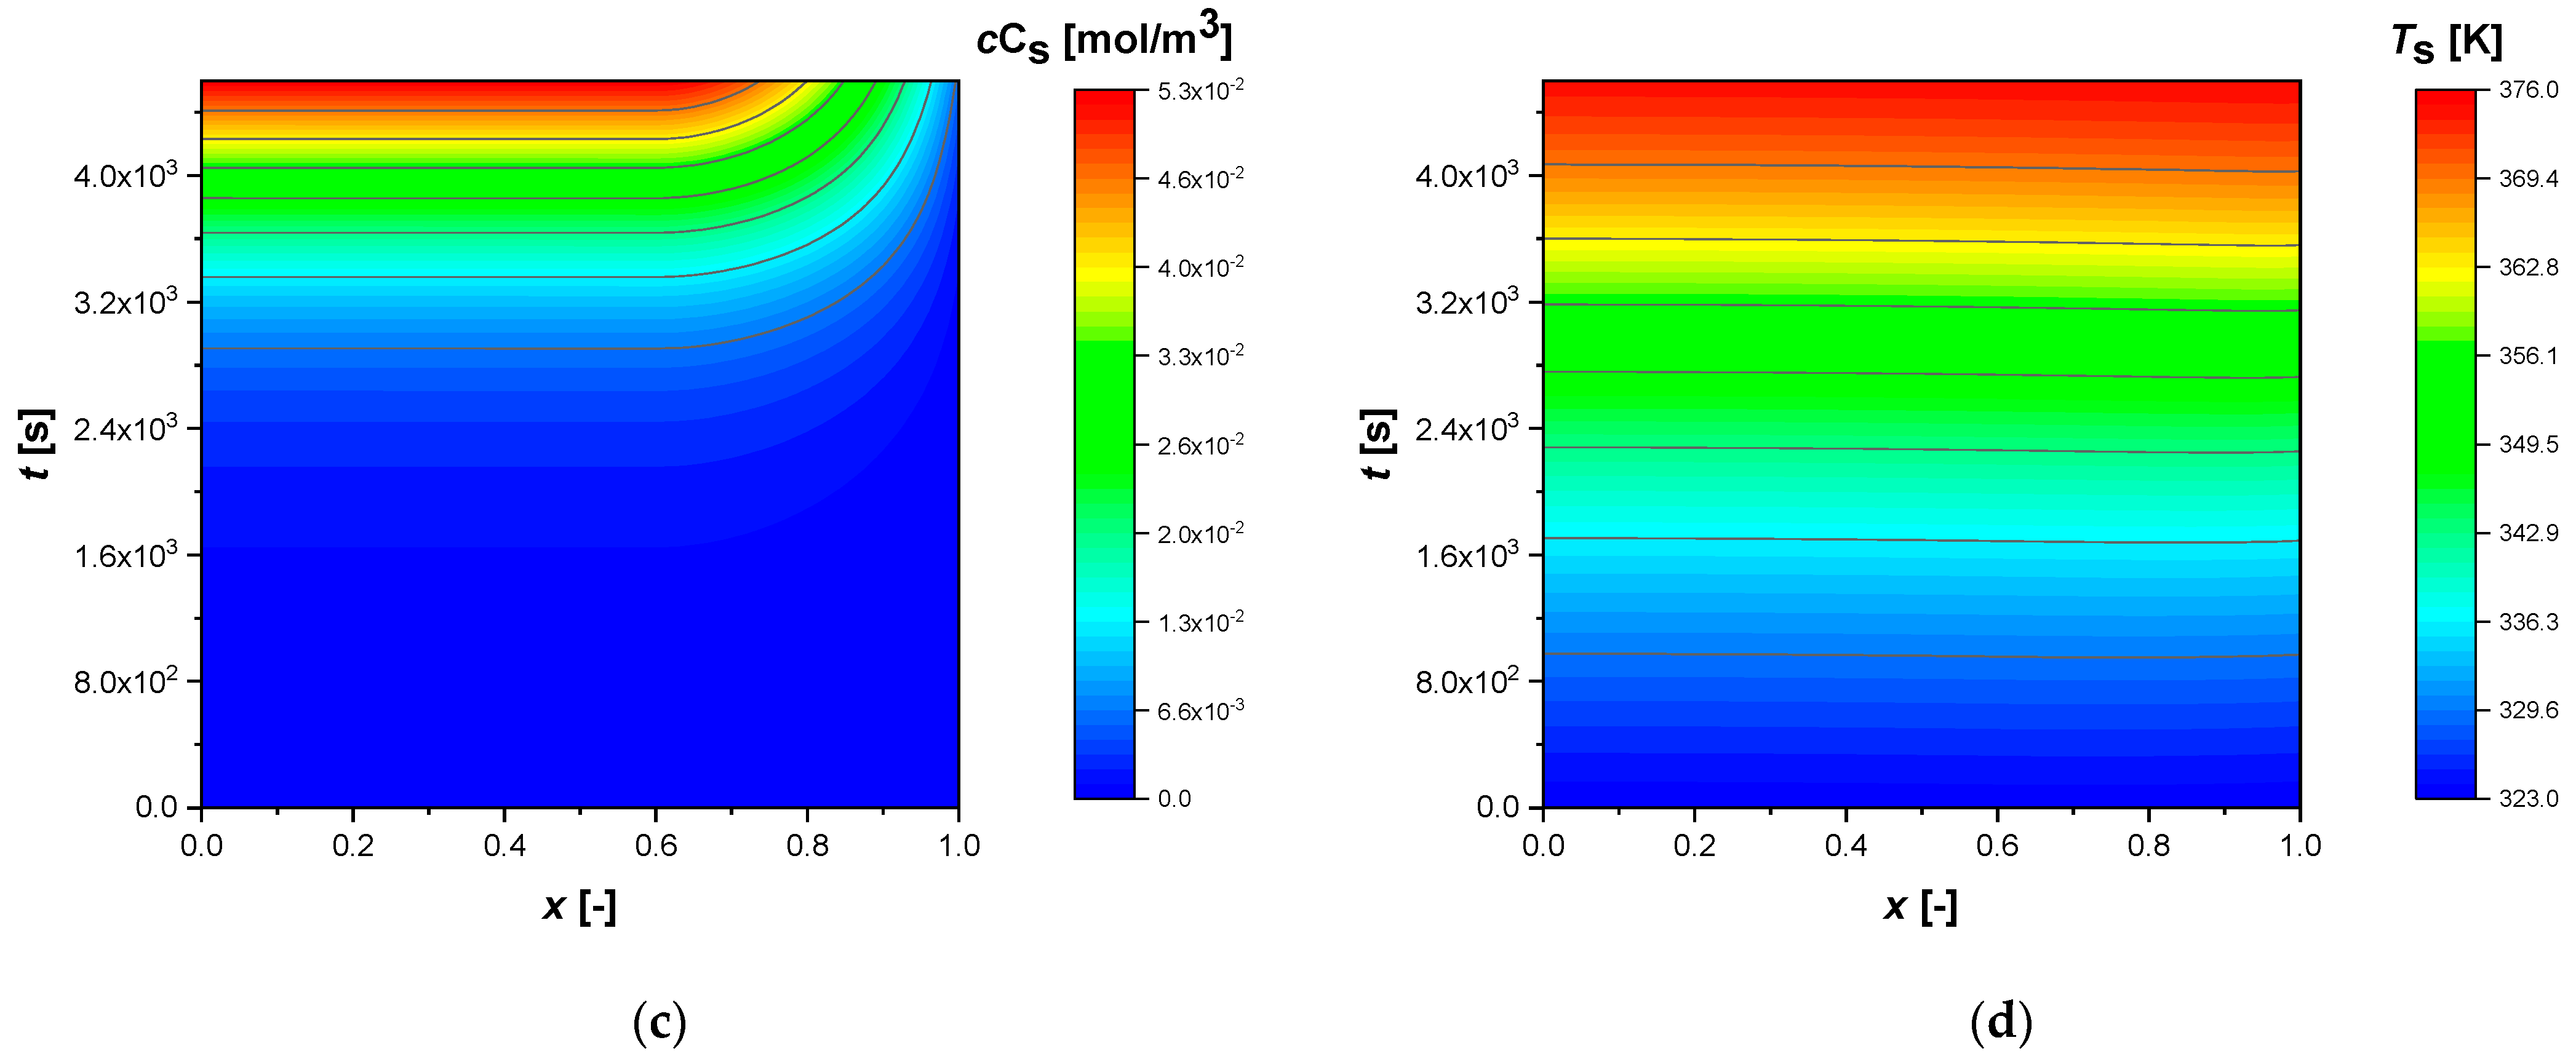
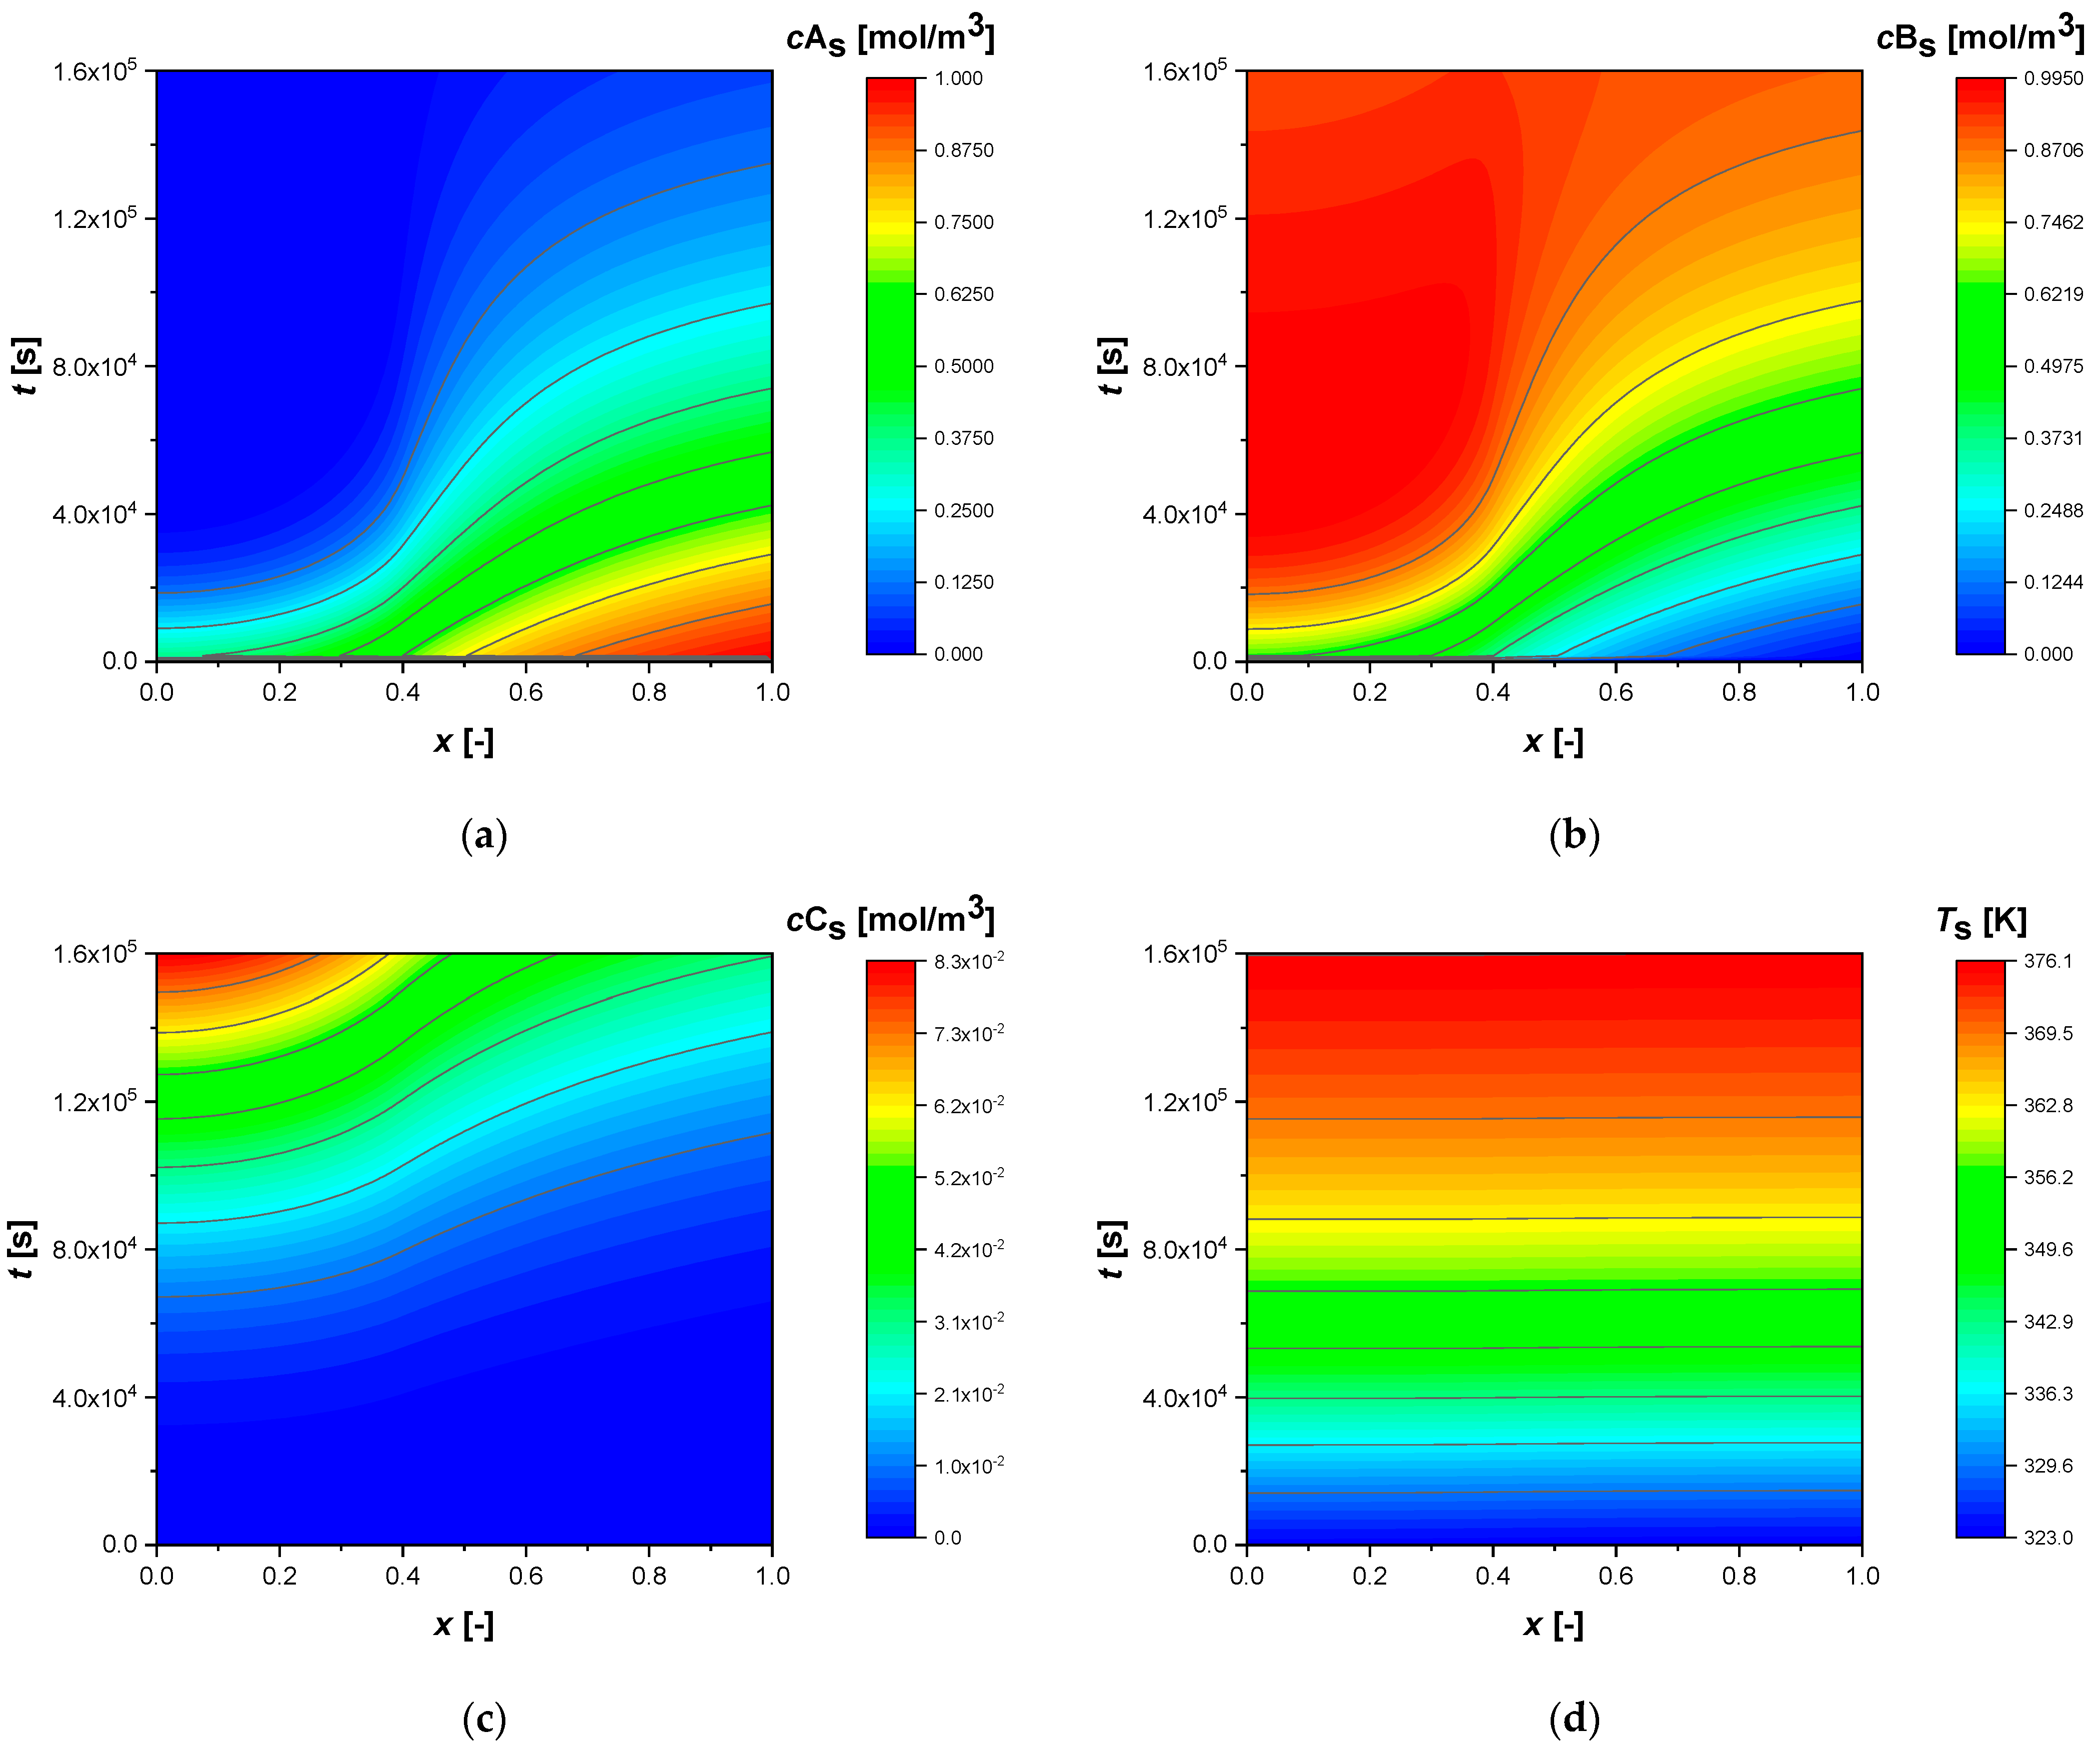
All simulations were conducted until a conversion of approximately 92% of reactant A was achieved. The intraparticle concentrations and temperature profiles, from the standard simulation, calculated for egg shell, egg white, and egg yolk, respectively, are shown in the contour plots,
Figure 1,
Figure 2 and
Figure 3.
As revealed, egg shell catalysts (
Figure 1) lead to flat profiles in the inner core of the catalyst, where the reaction does not occur due to the absence of the active phase, while strong concentration gradients are expected in the outer shell where the chemical reaction is promoted by the active phase. Egg white NUD modelling, allow to predict high gradients only where the active phase is present (
Figure 2). The reaction time increases dramatically when the catalytic phase is located in the innermost parts of the particle (egg yolk case,
Figure 3), due to the internal diffusive phenomena (non-flat intraparticle profiles). The external mass transfer coefficient (
km), on the other hand, is sufficiently high to make the resistance to diffusion in the stagnant fluid film negligible. The same evaluation can be made with respect to the coefficient of thermal resistance at the liquid–solid interface (
h), which has a value high enough to make its effects negligible. Moreover, it is important to consider that under standard conditions, the system was considered adiabatic (
UA = 0), thus the worse possible situation. In real cases, heat exchange is normally provided, leading to a consequent smoothing of the temperature increase.
In all the simulations, reagent A is consumed in the active region of the catalyst (
Figure 1,
Figure 2 and
Figure 3), spreading and accumulating more in cases where the active phase is located deep in the particle (
Figure 3). Intermediate B is produced and consumed in the same regions, reaching a maximum more or less rapidly, depending on the NUD.
Similarly to B, the component C produced and diffused in the particle, accumulates more in the egg yolk (
Figure 3) case due to the diffusive phenomena that slow down its release in the bulk.
In all cases, the profiles show an increase in temperature throughout the particle of approximately 53 K.
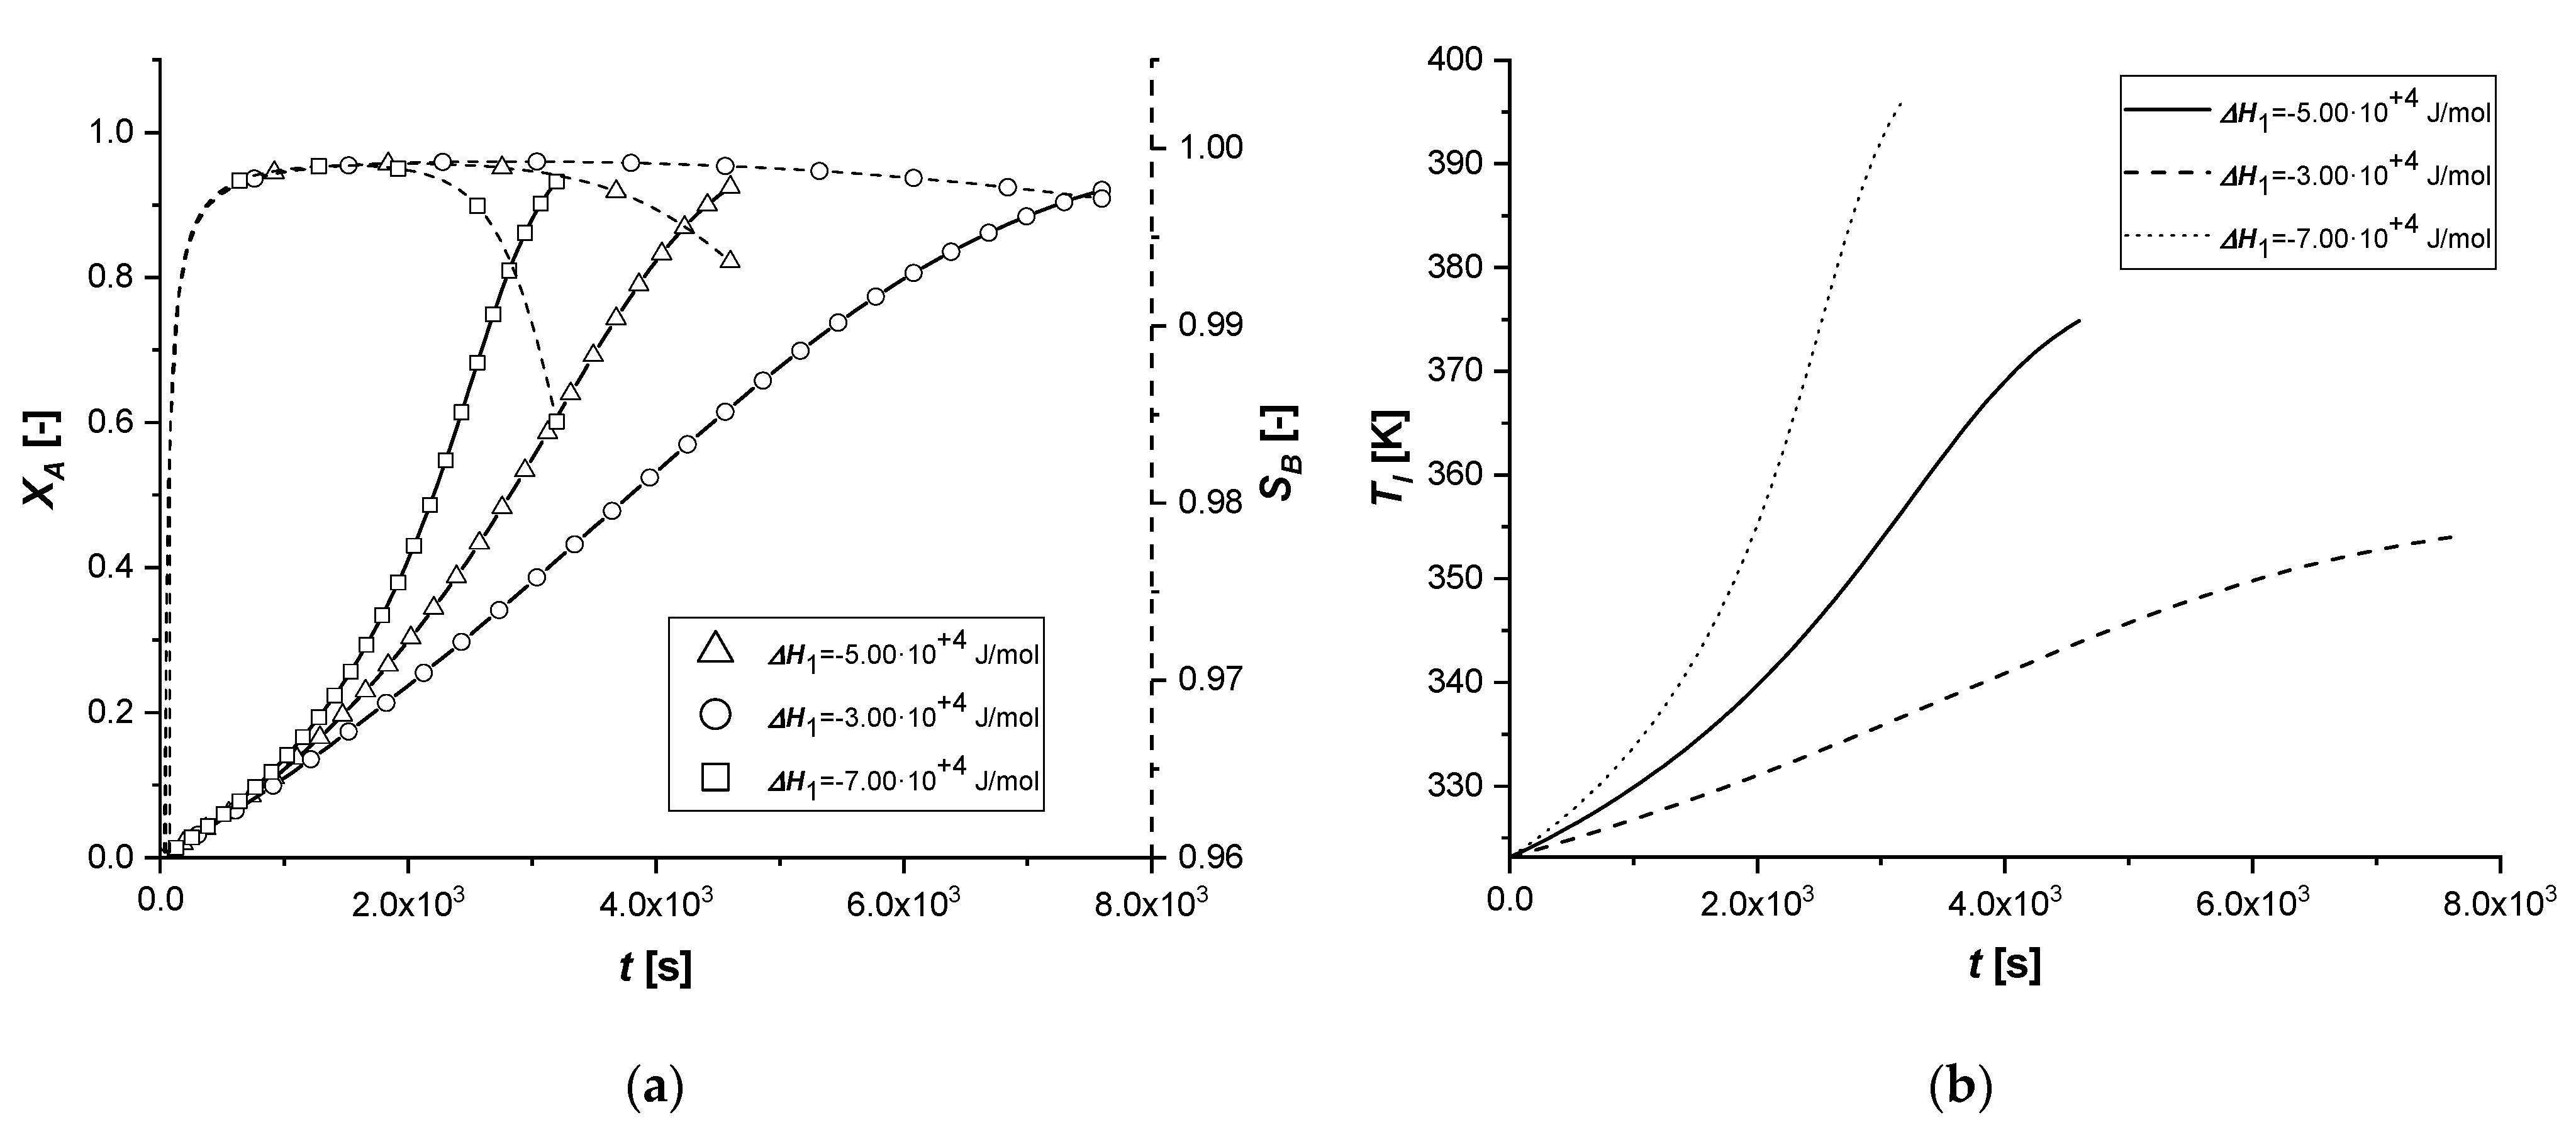
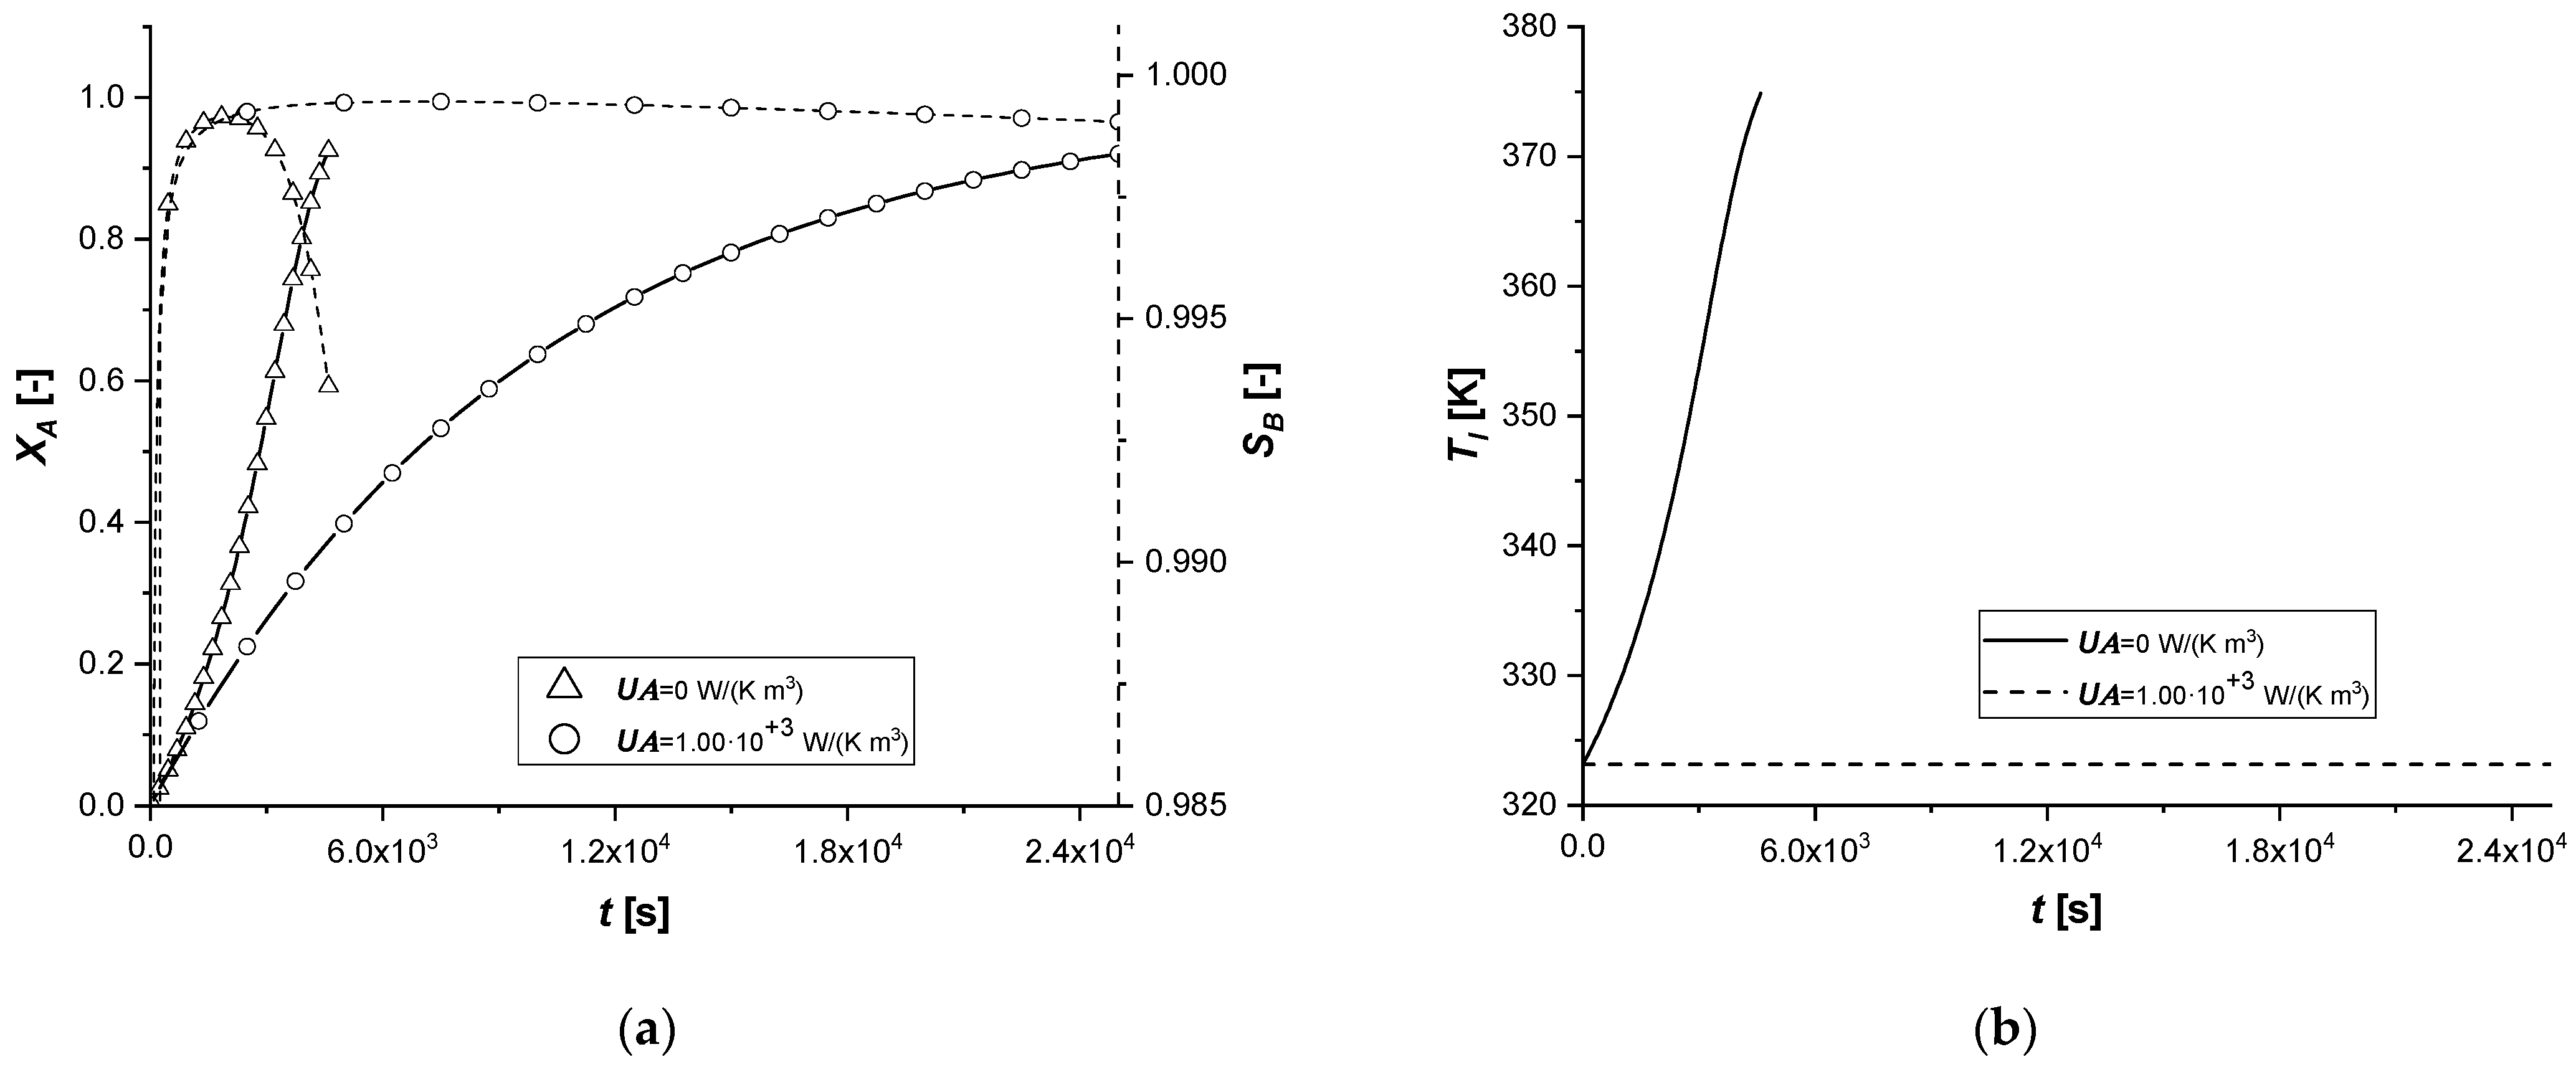
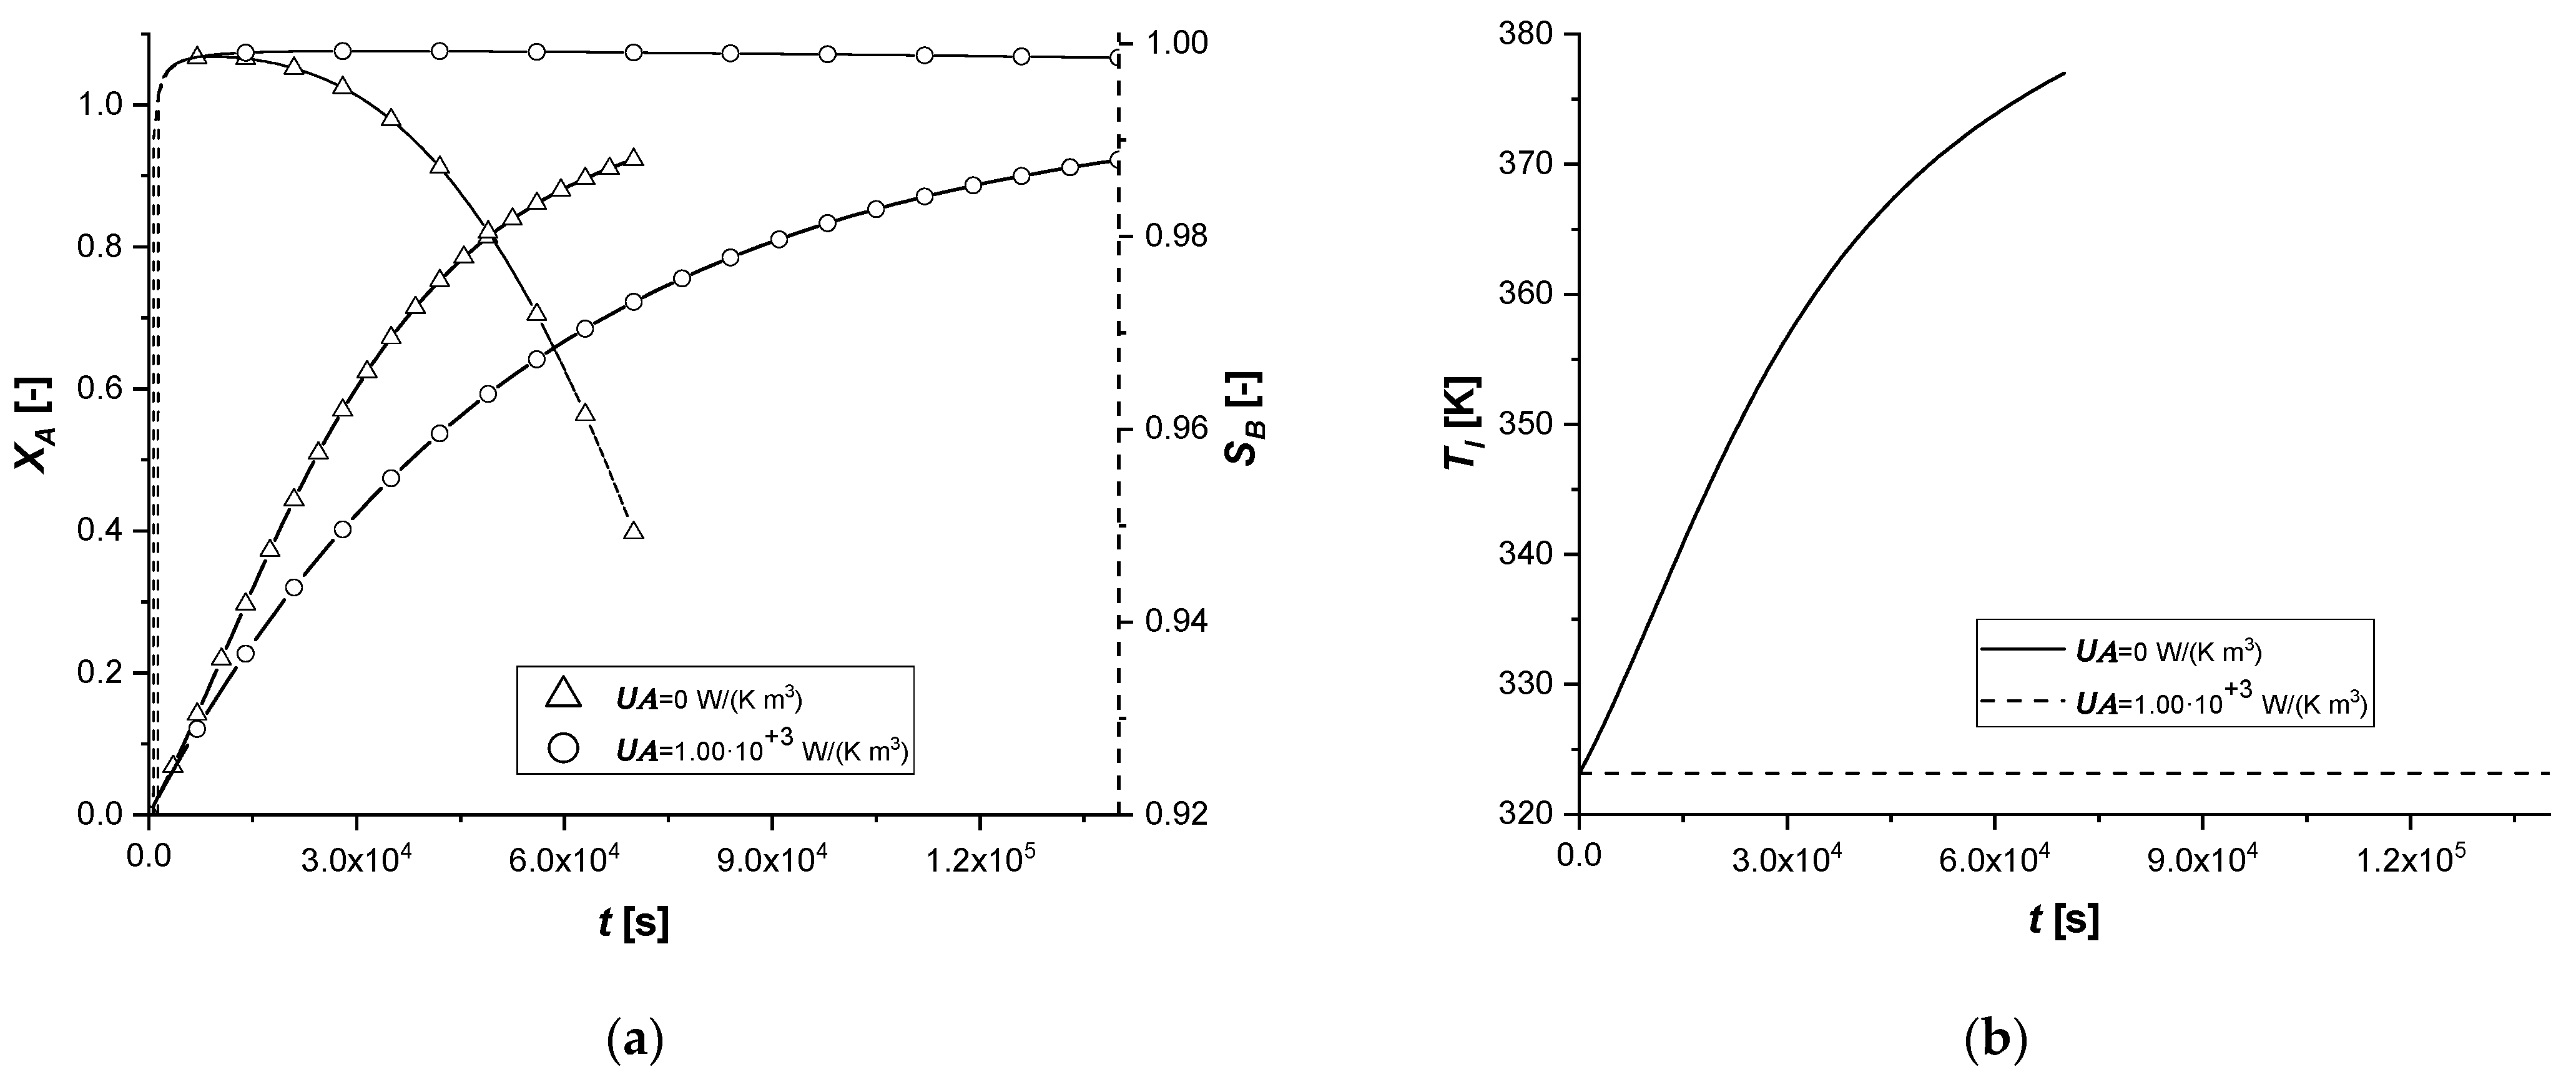
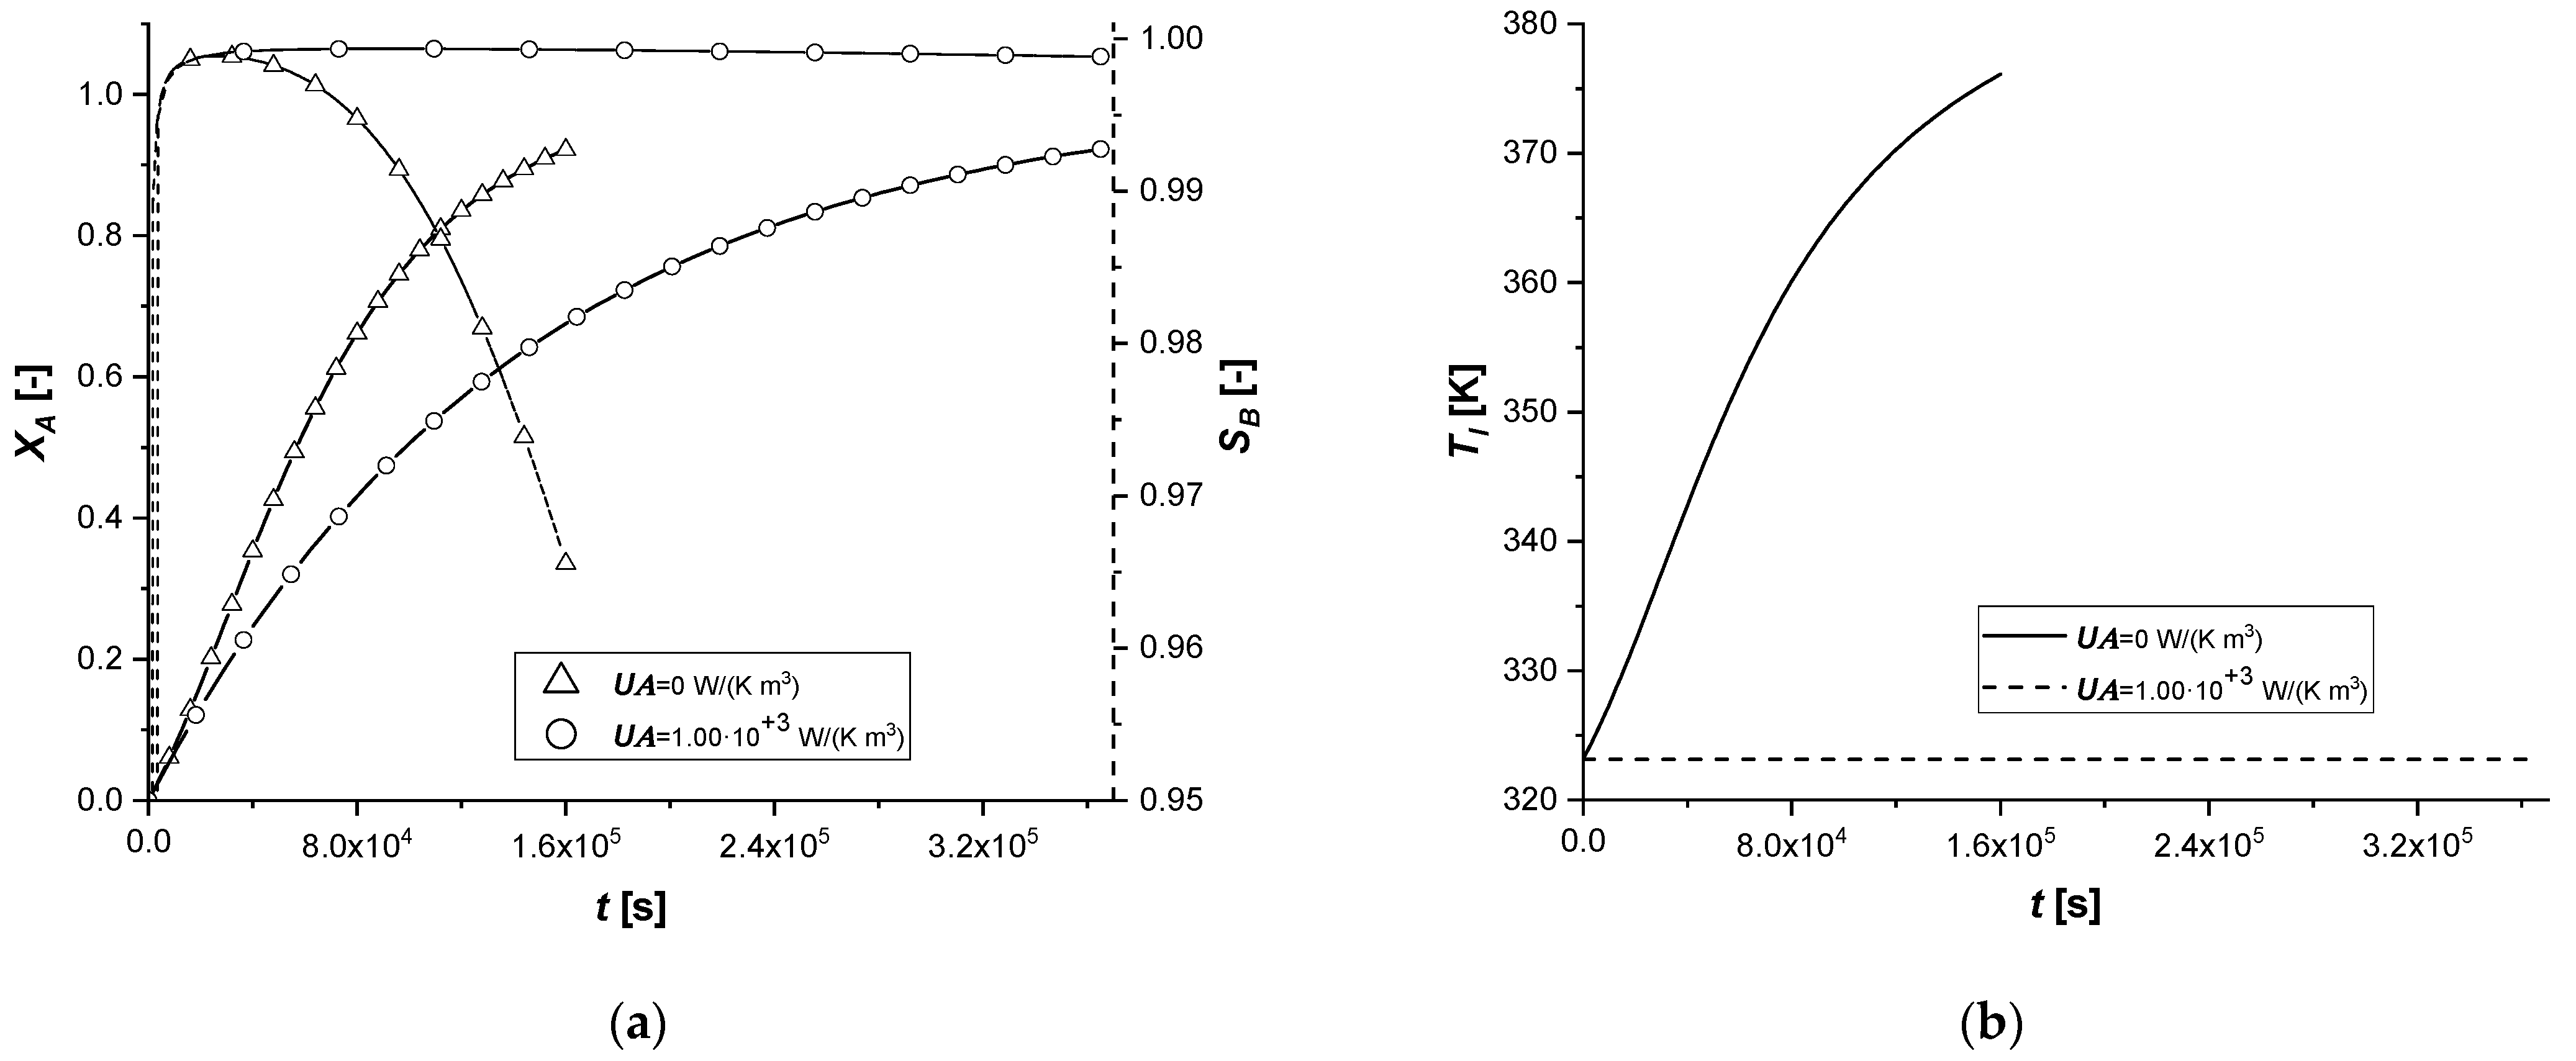
The reactant conversion, the product selectivity and efficiency of the chemical reaction in the liquid phase were calculated for each case studied. Their profiles and temperature over time are shown in
Figure 4, for the egg shell, egg white, and egg yolk cases.
As revealed by the figures, a high selectivity of the intermediate product is observed, which tends to decrease in EW and EY cases (
Figure 4a). Its accumulation in the catalytic zone, caused by the diffusion resistance towards the outside, increases the rate of the second reaction and, consequently, the quantity of C produced.
The yield of the desired product faithfully follows the conversion profile, deviating slightly at high times in the two final simulations. Finally, an increase in the temperature of the liquid phase of about 50 K in all cases was observed (
Figure 4b).
The catalytic efficiency of the egg shell decreases drastically after the initial maximum, while in the other two cases, it settles down to, 0.41 and 0.61 for egg white and egg yolk, respectively (
Figure 4c).
3.2. Parametric Investigation
In order to study the response of the model to parametric variation, several simulations were conducted. For each parameter considered, a lower and a higher value was chosen starting from the standard value. The results were reported as comparison graphs of the bulk concentrations and intraparticle profiles of the components at the steady state. The coefficients used in the parametric study are shown in
Table 2 by decreasing or increasing the values of the parameters with respect to the standard.
3.2.1. Reaction Enthalpy
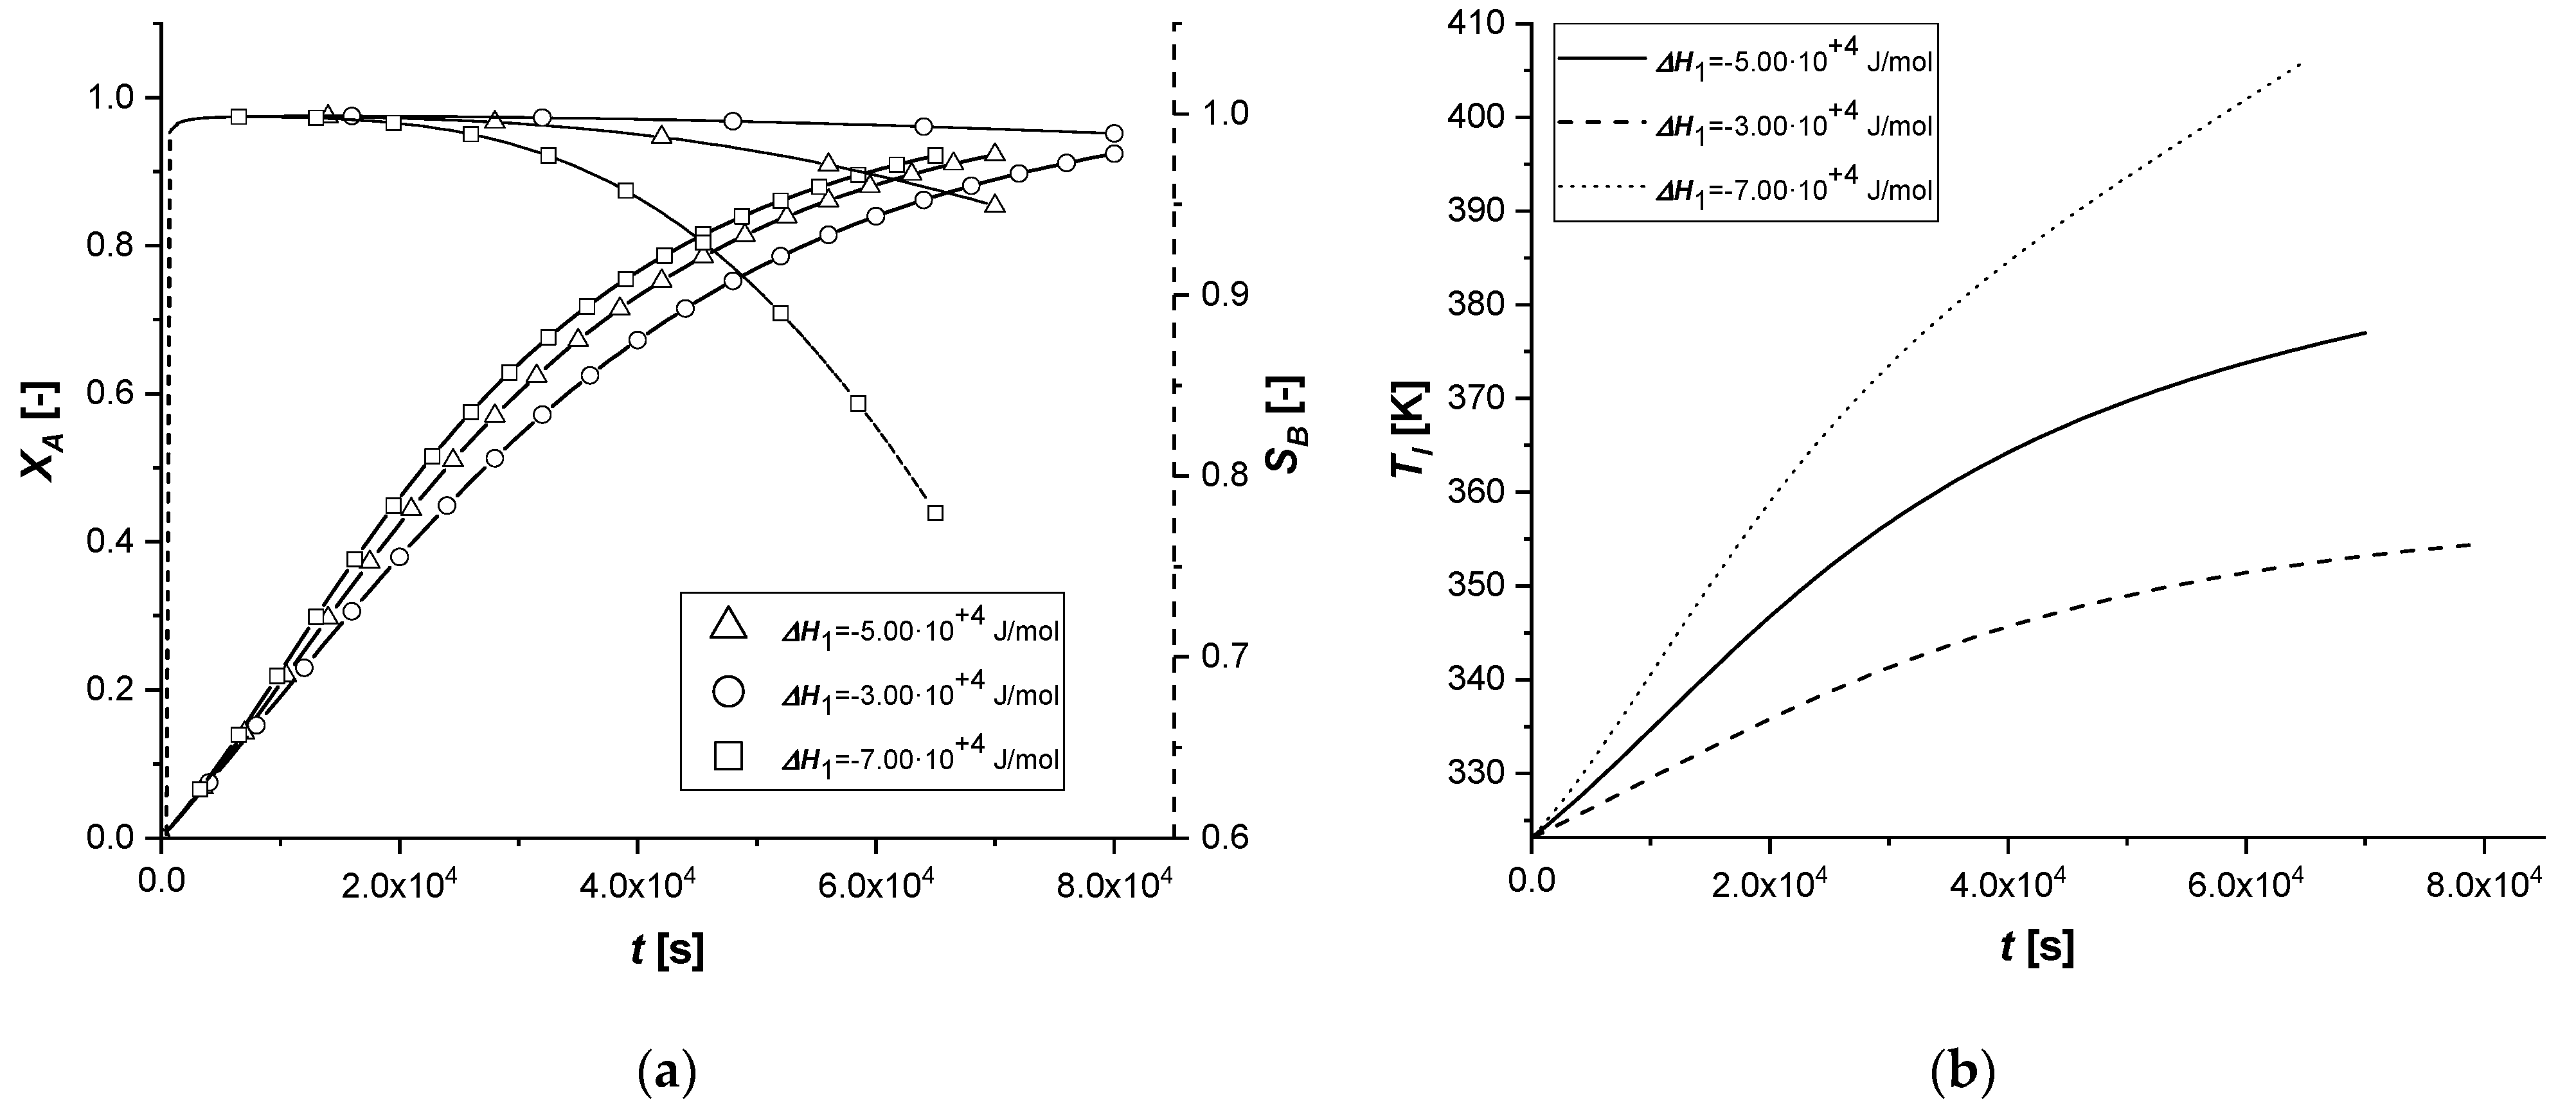
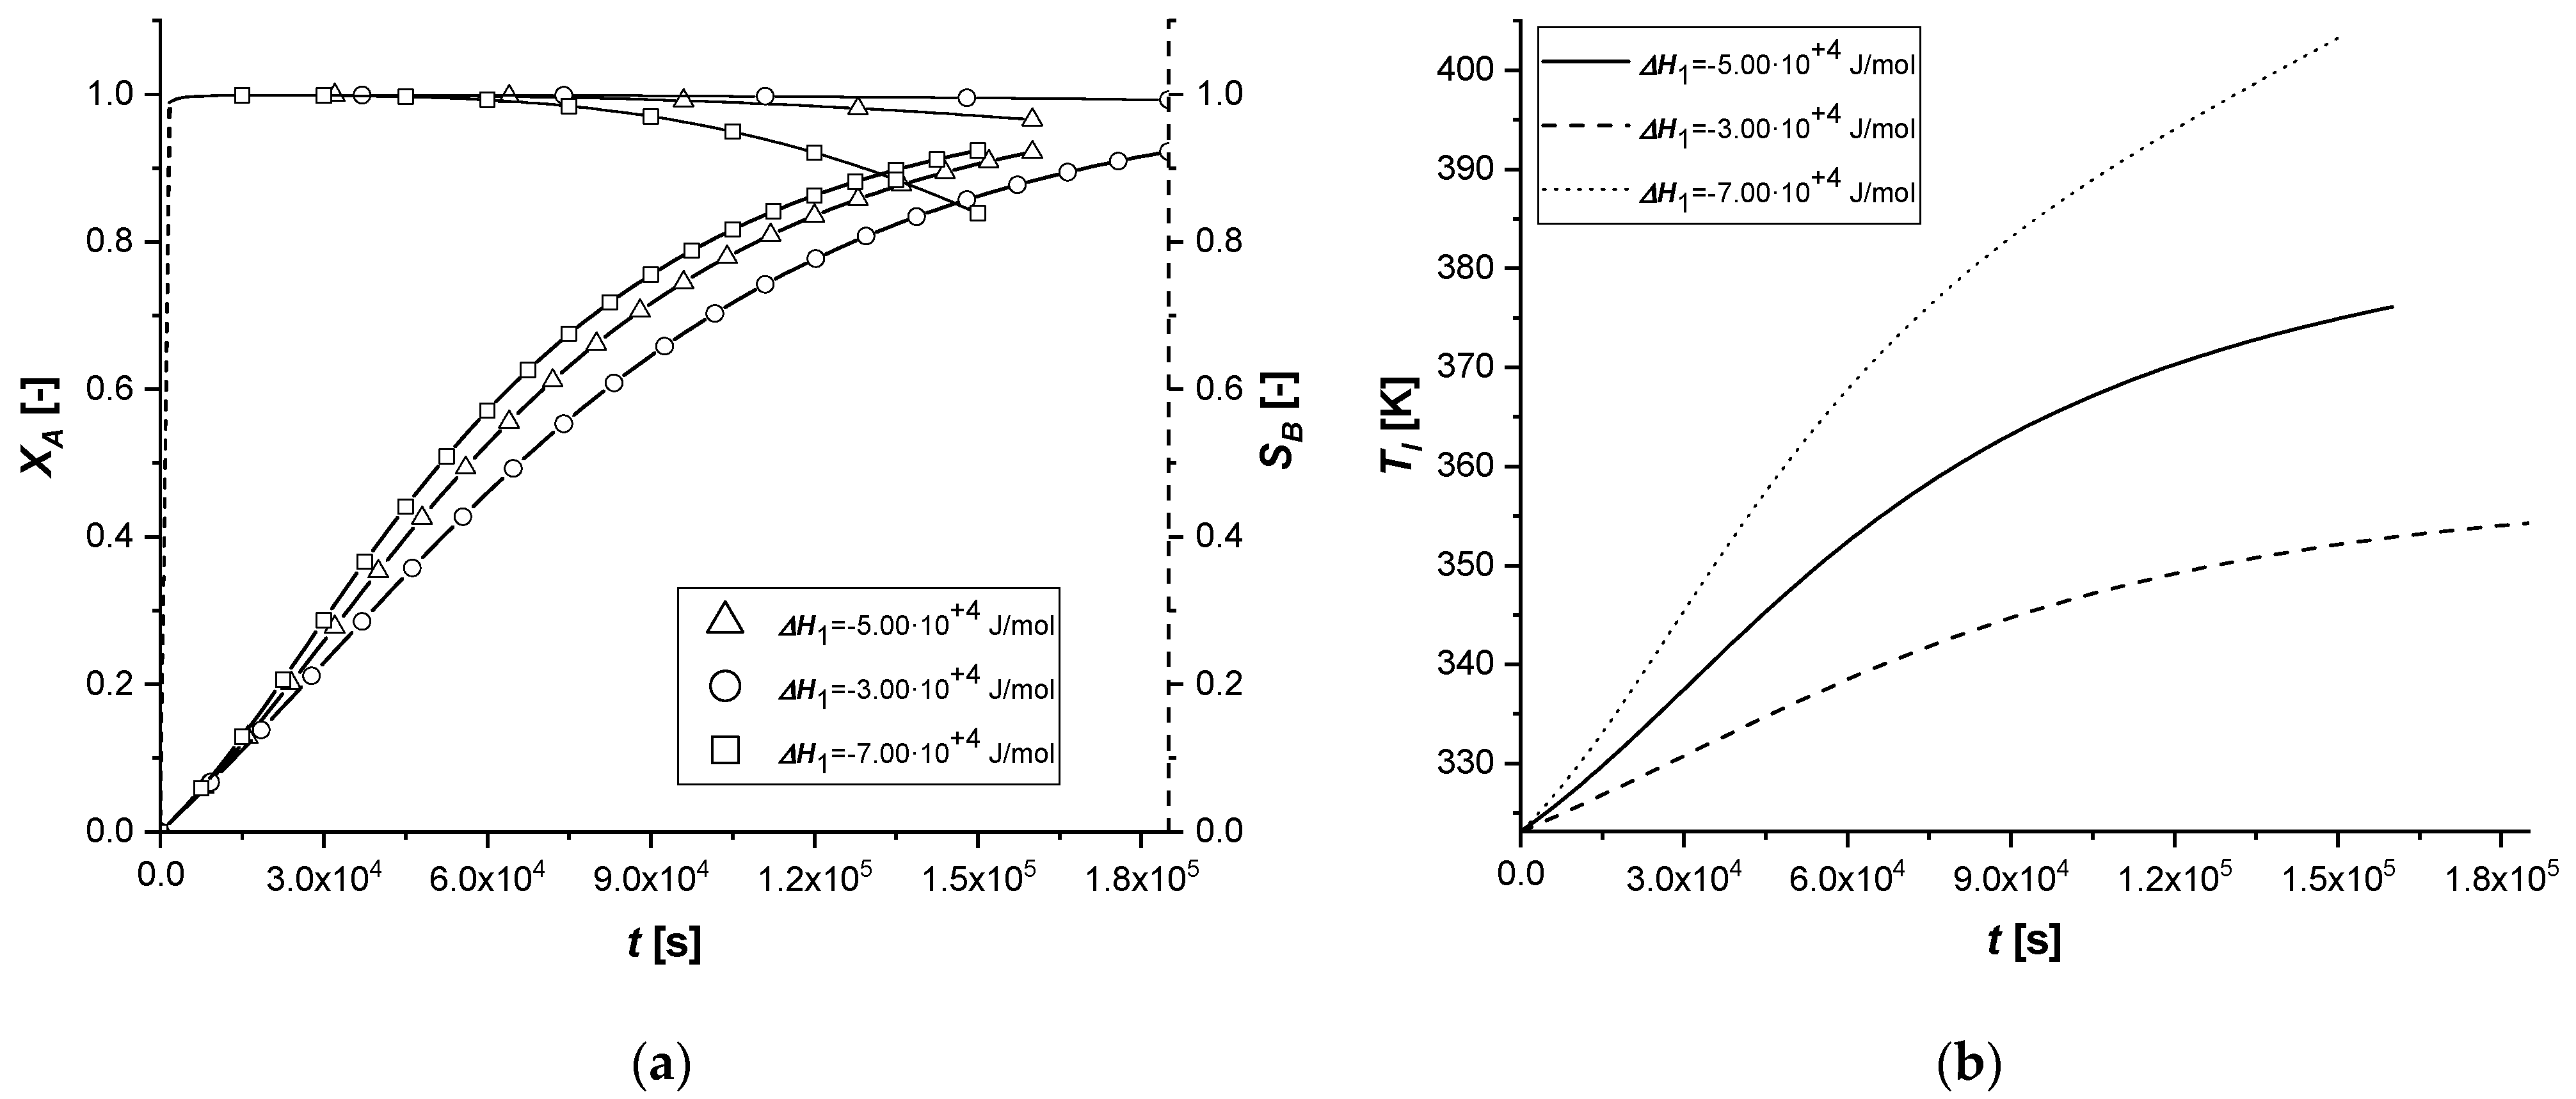
The consequent variation of the enthalpy of the first reaction determines the lowering or increase of the quantity of energy released by the reaction itself. As a result, the overall system temperature will be lower or higher than the standard simulation. The parameter affects indirectly the reaction rate and particularly on the kinetic constant calculated with the modified Arrhenius equation which is a function of the operation temperature.
It can be noted that, in all cases, as the thermodynamic parameter increases, both reactive processes are enhanced; moreover, it is interesting to note that the first catalytic system behaves differently from the other ones.
In fact, if in the ES case the consumed quantity of A seems to be very sensitive for the variation of the coefficient, the same behavior is not observed in the case of EW and EY. Its consumption is clearly limited by internal diffusion resistance. As the component slowly reaches the active phase of the catalyst, promoting the formation of the intermediate, the increase in the reaction rate, due to temperature, causes an accelerated consumption of B available close to the catalytic site. In these two cases, the quantity of C obtained is therefore higher.
Ultimately, it can be assumed that the use of ES type catalysts is favorable if it is desired to improve the production of the intermediate in exothermic reactions if severe limitations of internal diffusion arise.
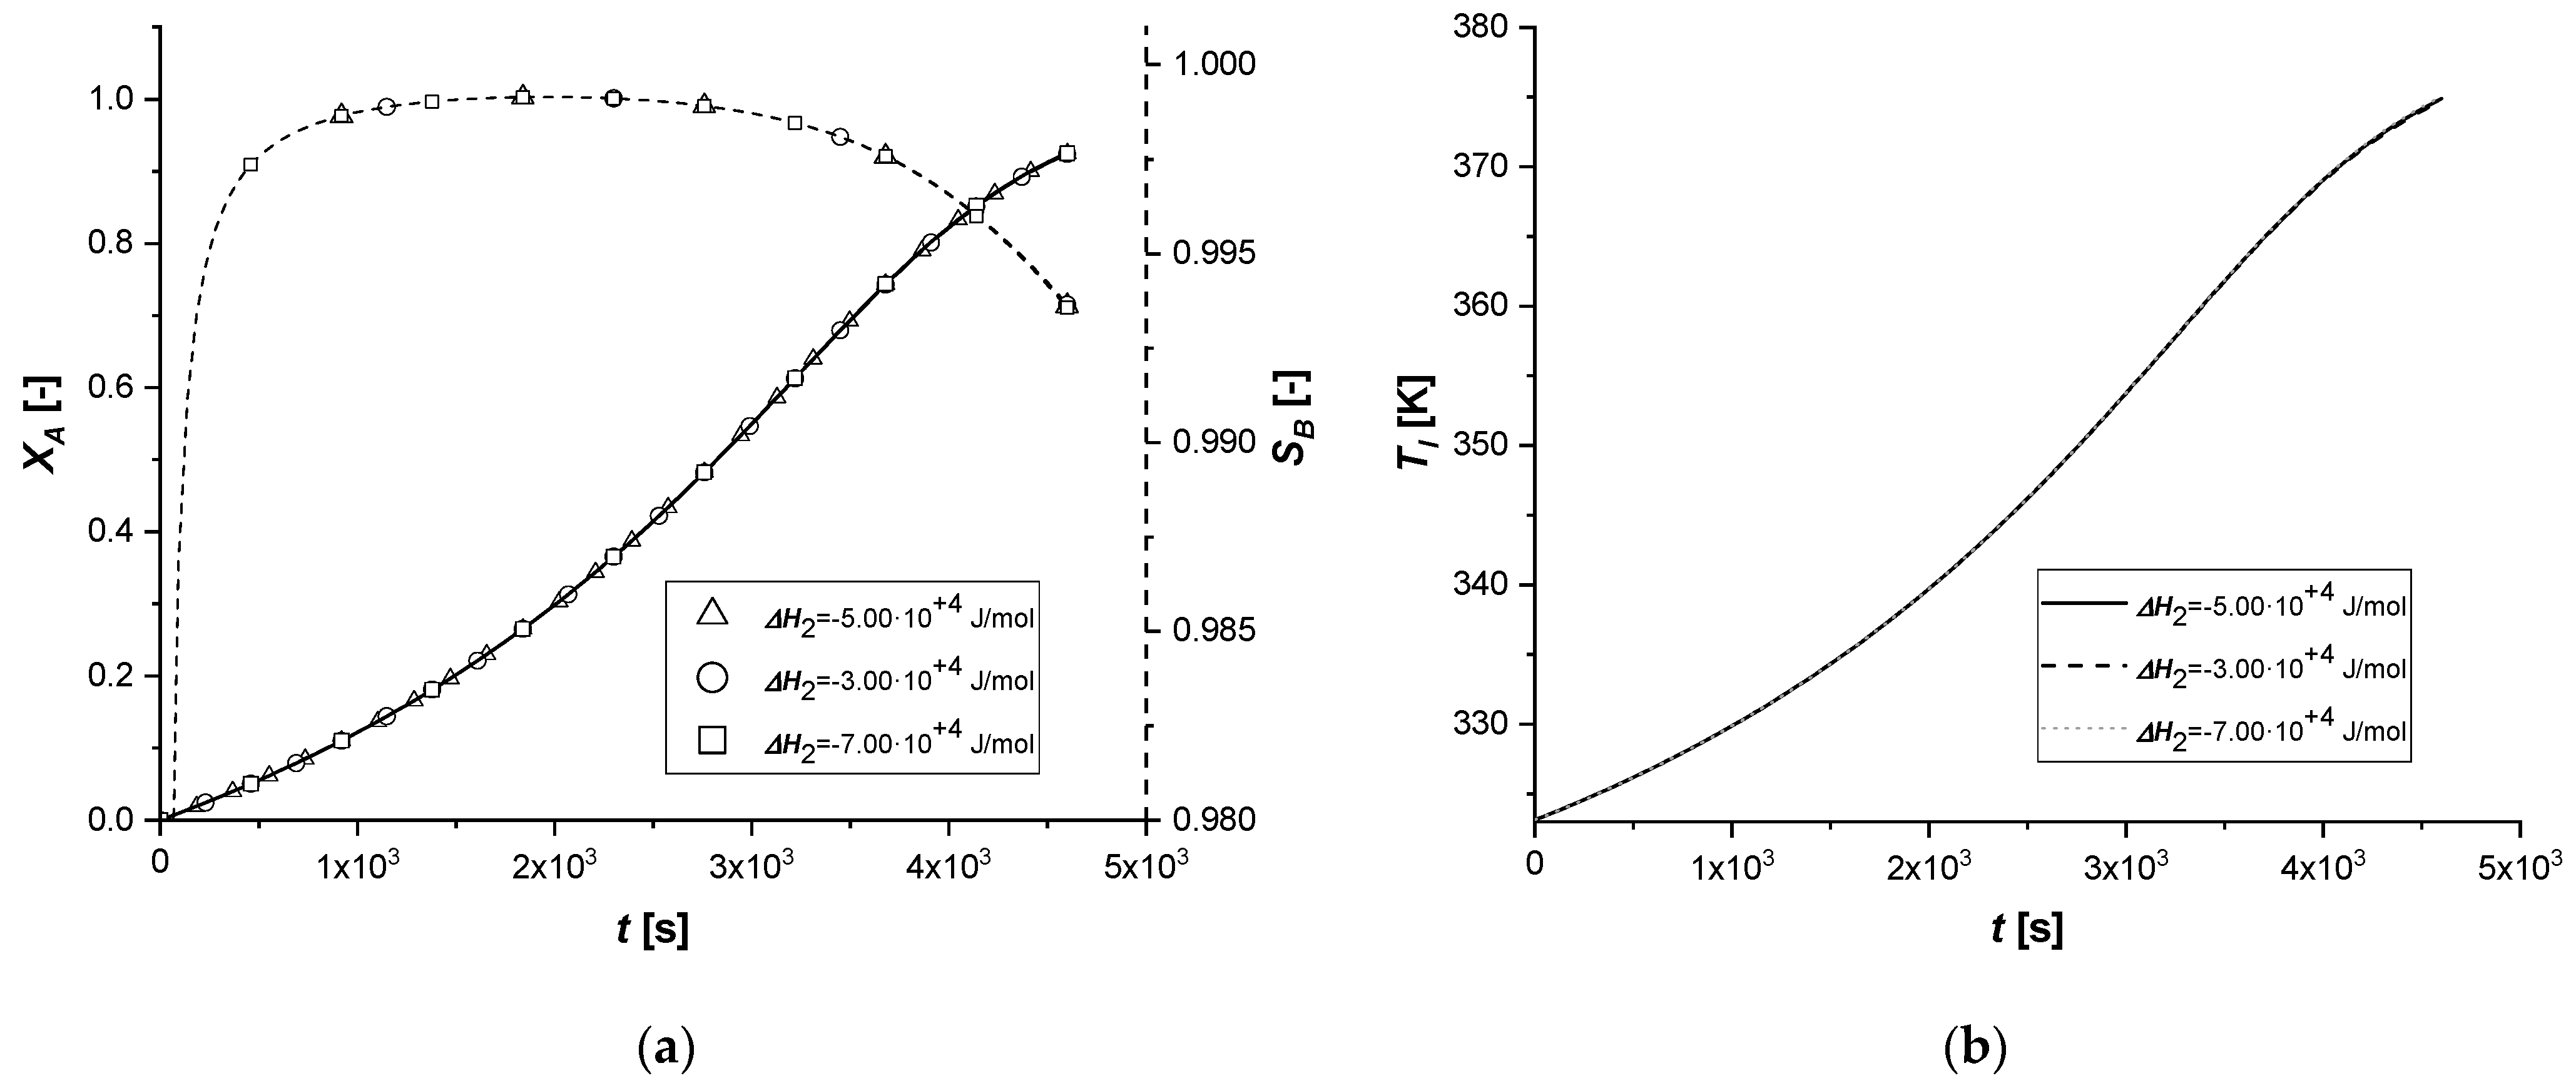
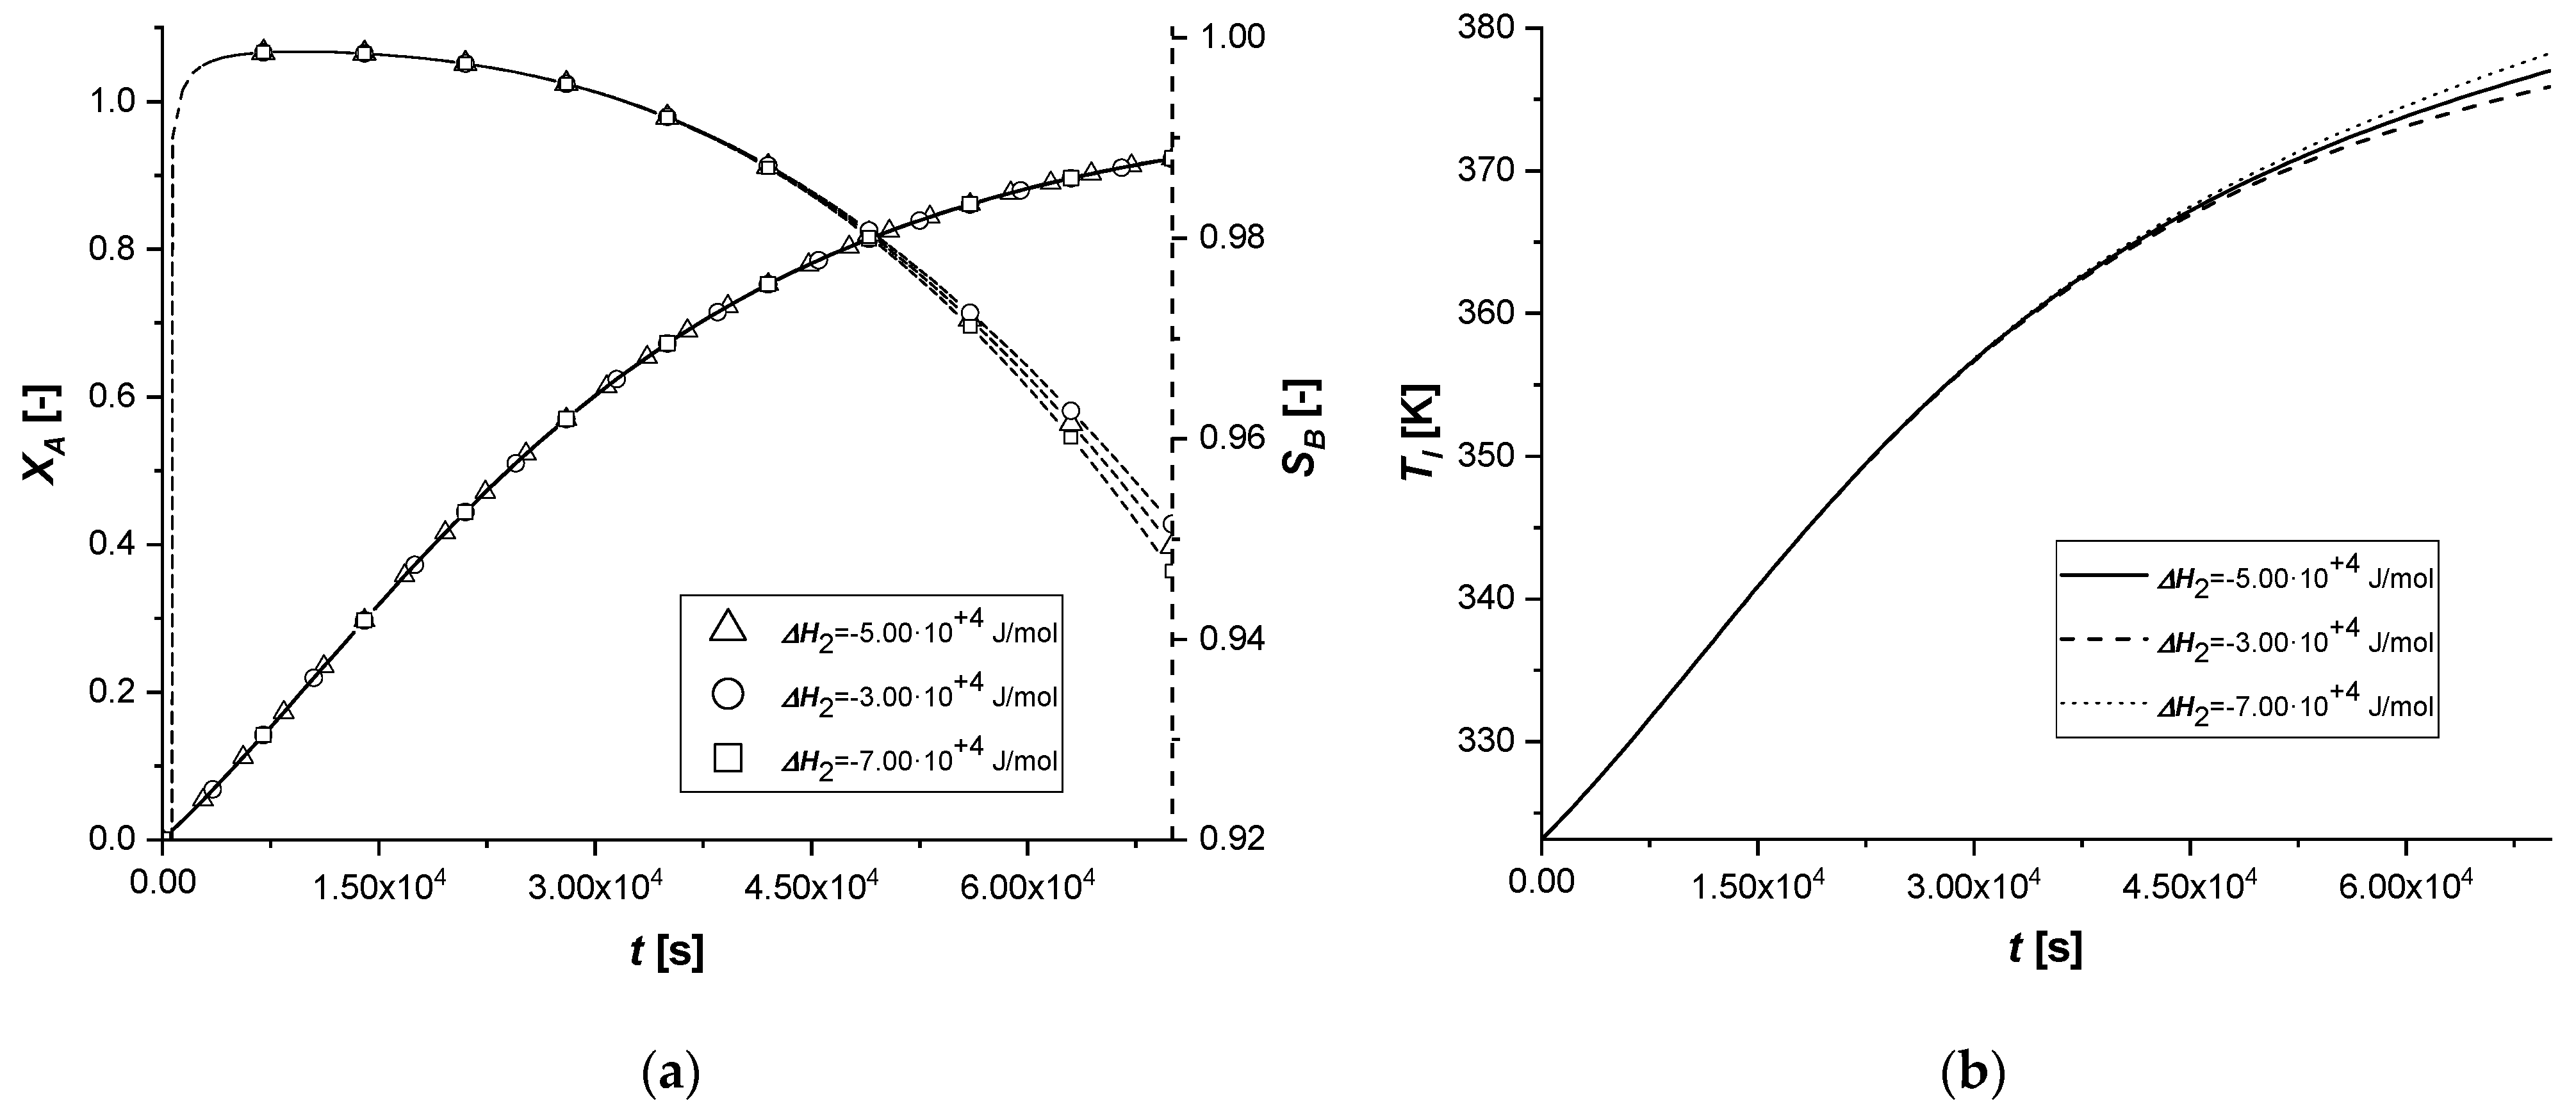
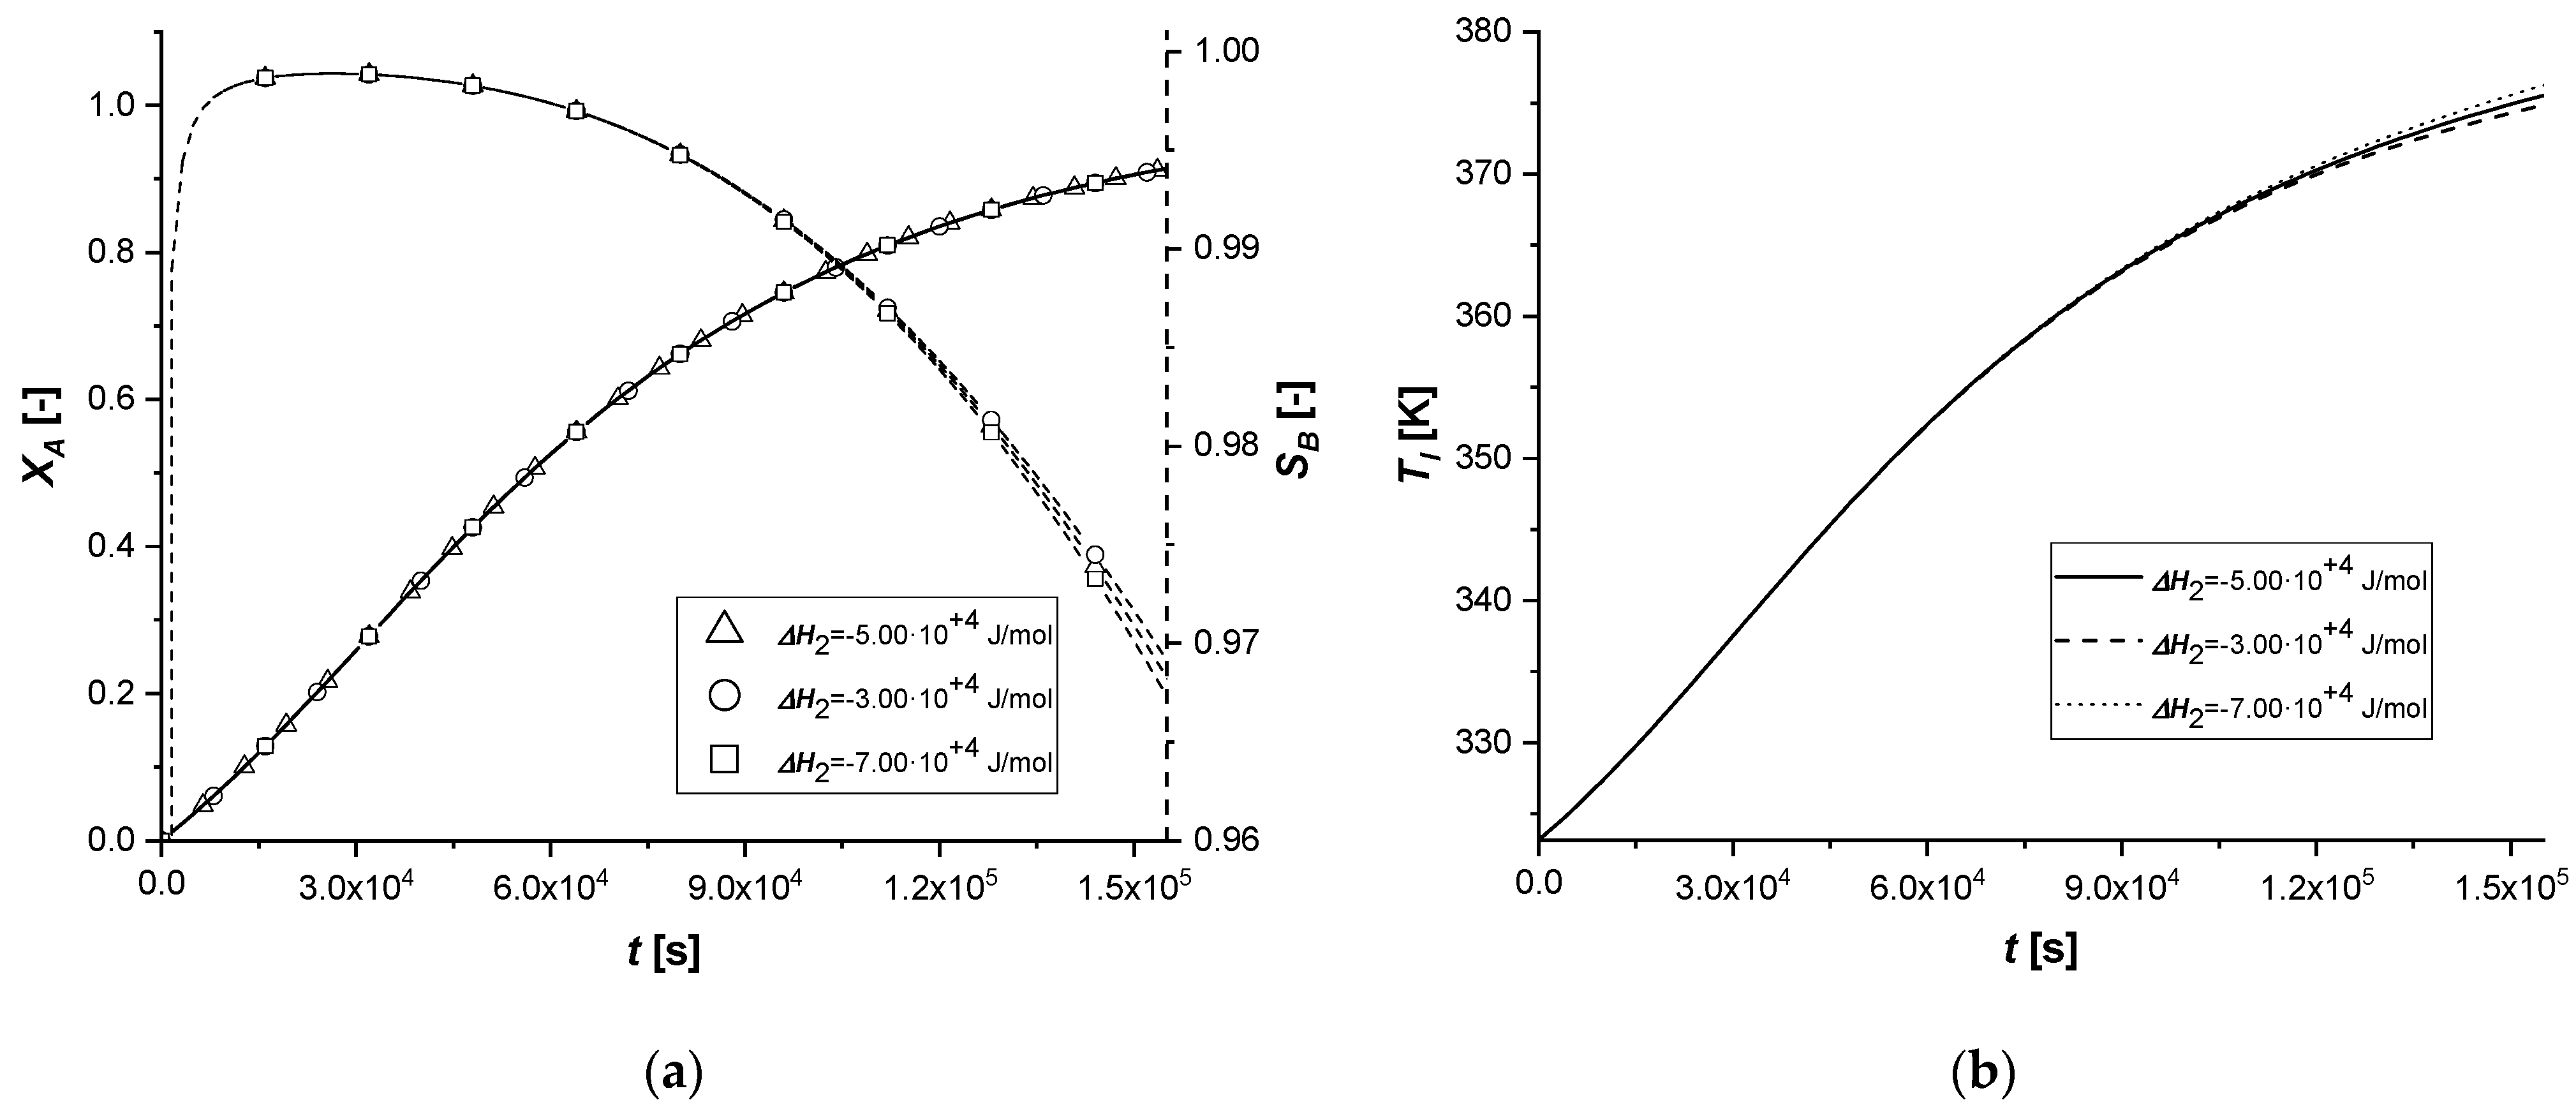
The variation of the enthalpy of the second reaction causes effects similar to those observed in the previous simulations, influencing the reaction rates.
Unlike the ΔH1 case, since the second reaction is slower than the first (kref2 << kref1) and produces C in smaller quantities than B, the energy contribution will certainly be reduced compared to the previous simulations.
As can be seen from
Figure 10, the variation of Δ
H2 obtained starting from the same values used in the study of Δ
H2, led to completely different results. Both the solid-side and liquid-side profiles overlap almost completely in all the cases showing slight deviations from the standard behavior only in the production of C in the EW and EY cases. As anticipated, the energy contribution provided is very limited due to the low concentration of C produced. In cases where the catalytically active phase is positioned in the innermost parts of the particle, the reactive thrust is displayed in a slightly more evident way, but the effect of the parameter remains extremely limited.
3.2.2. Reaction Rate Constants
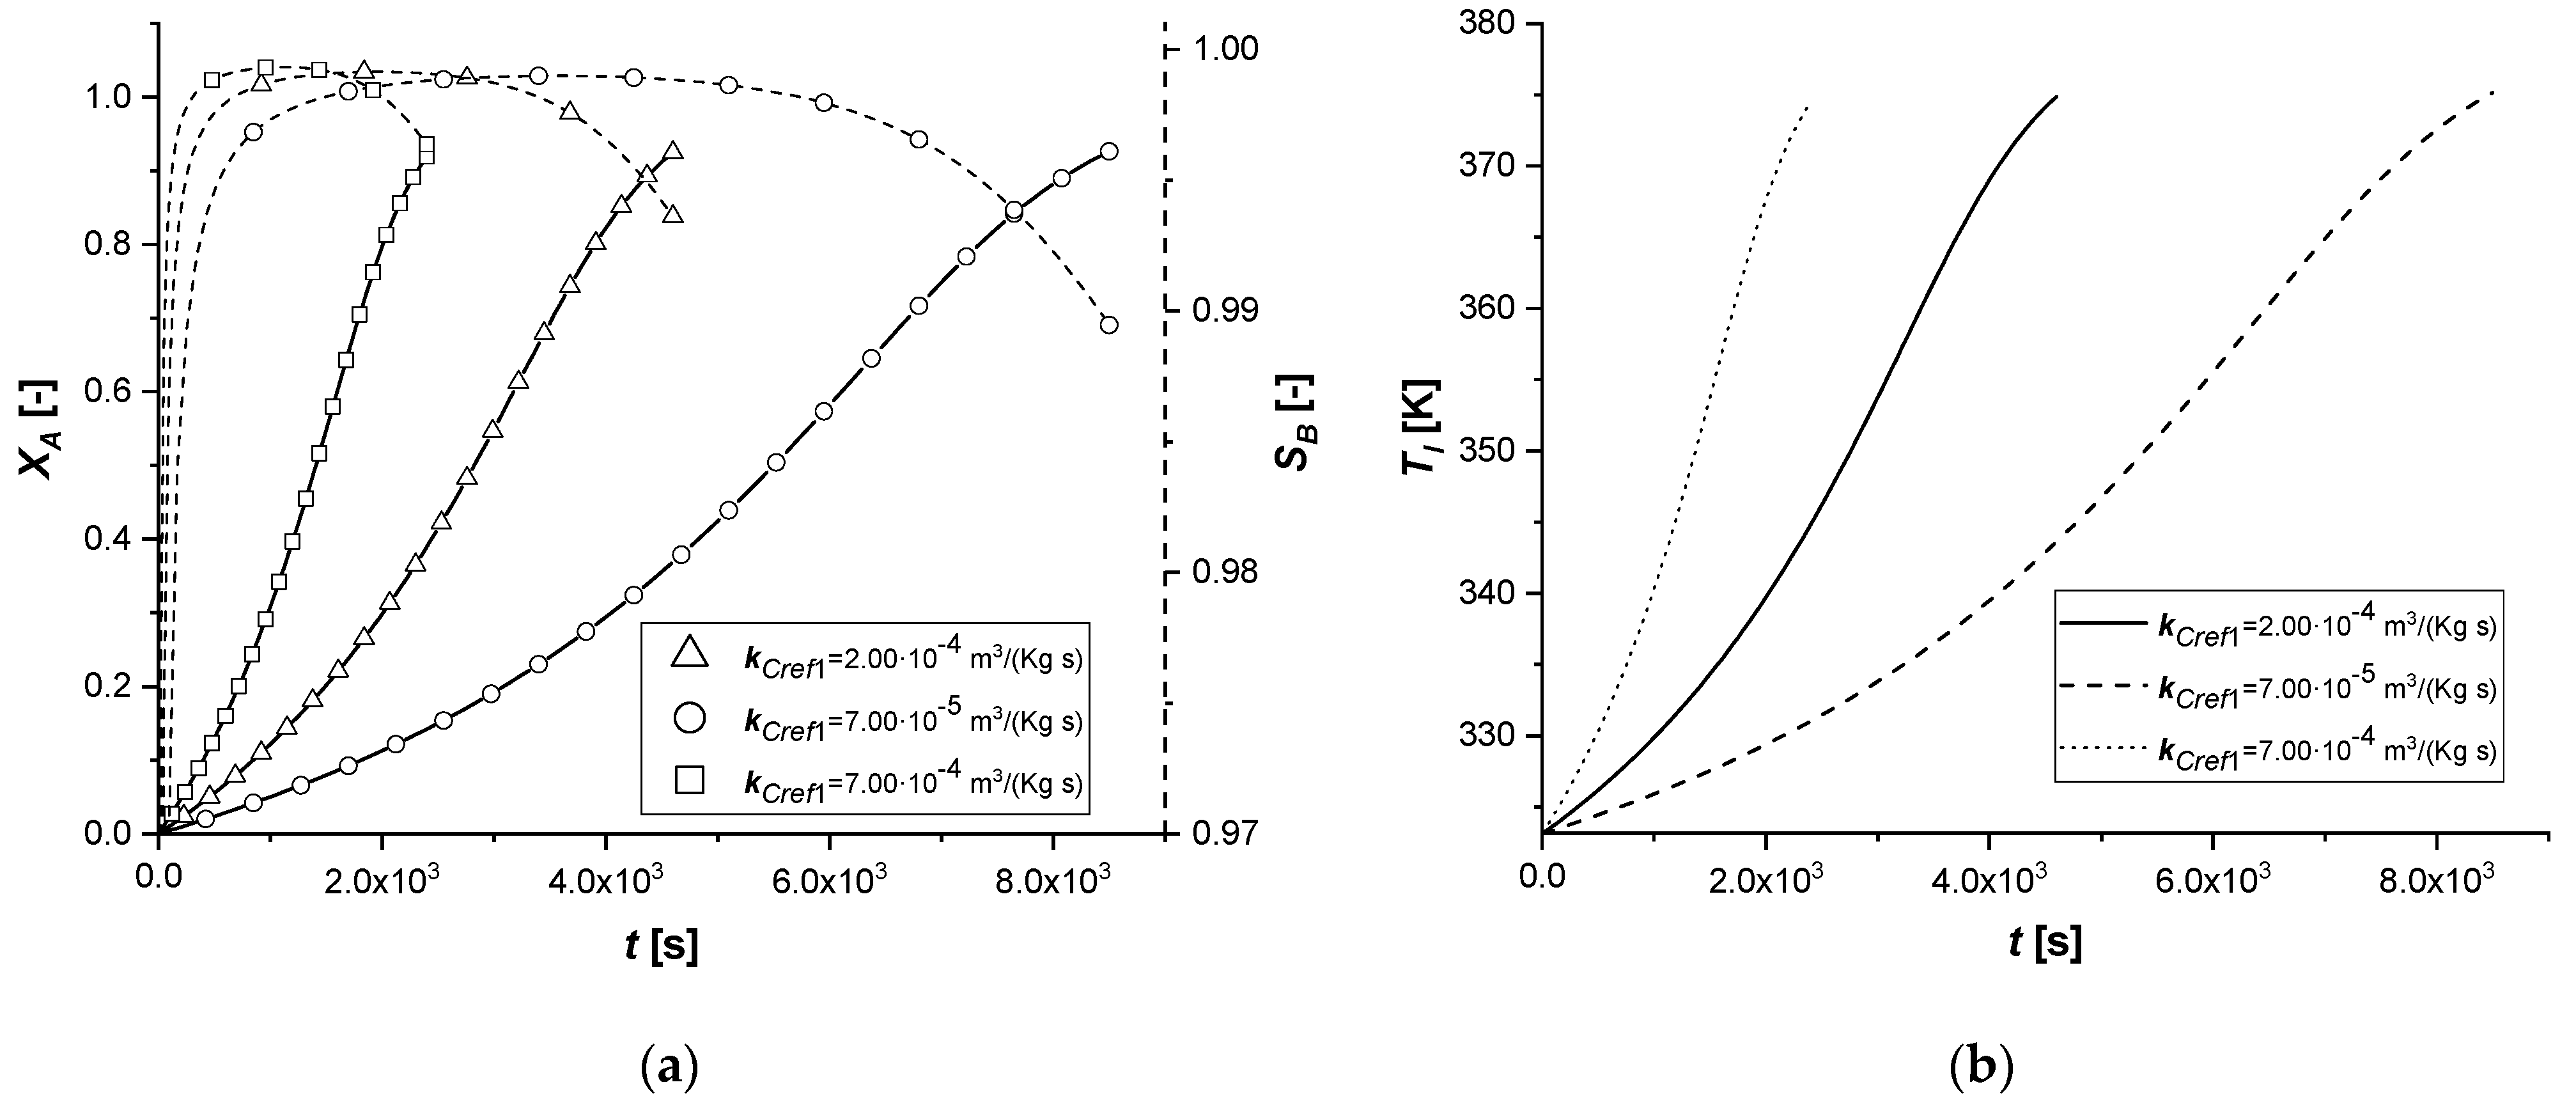
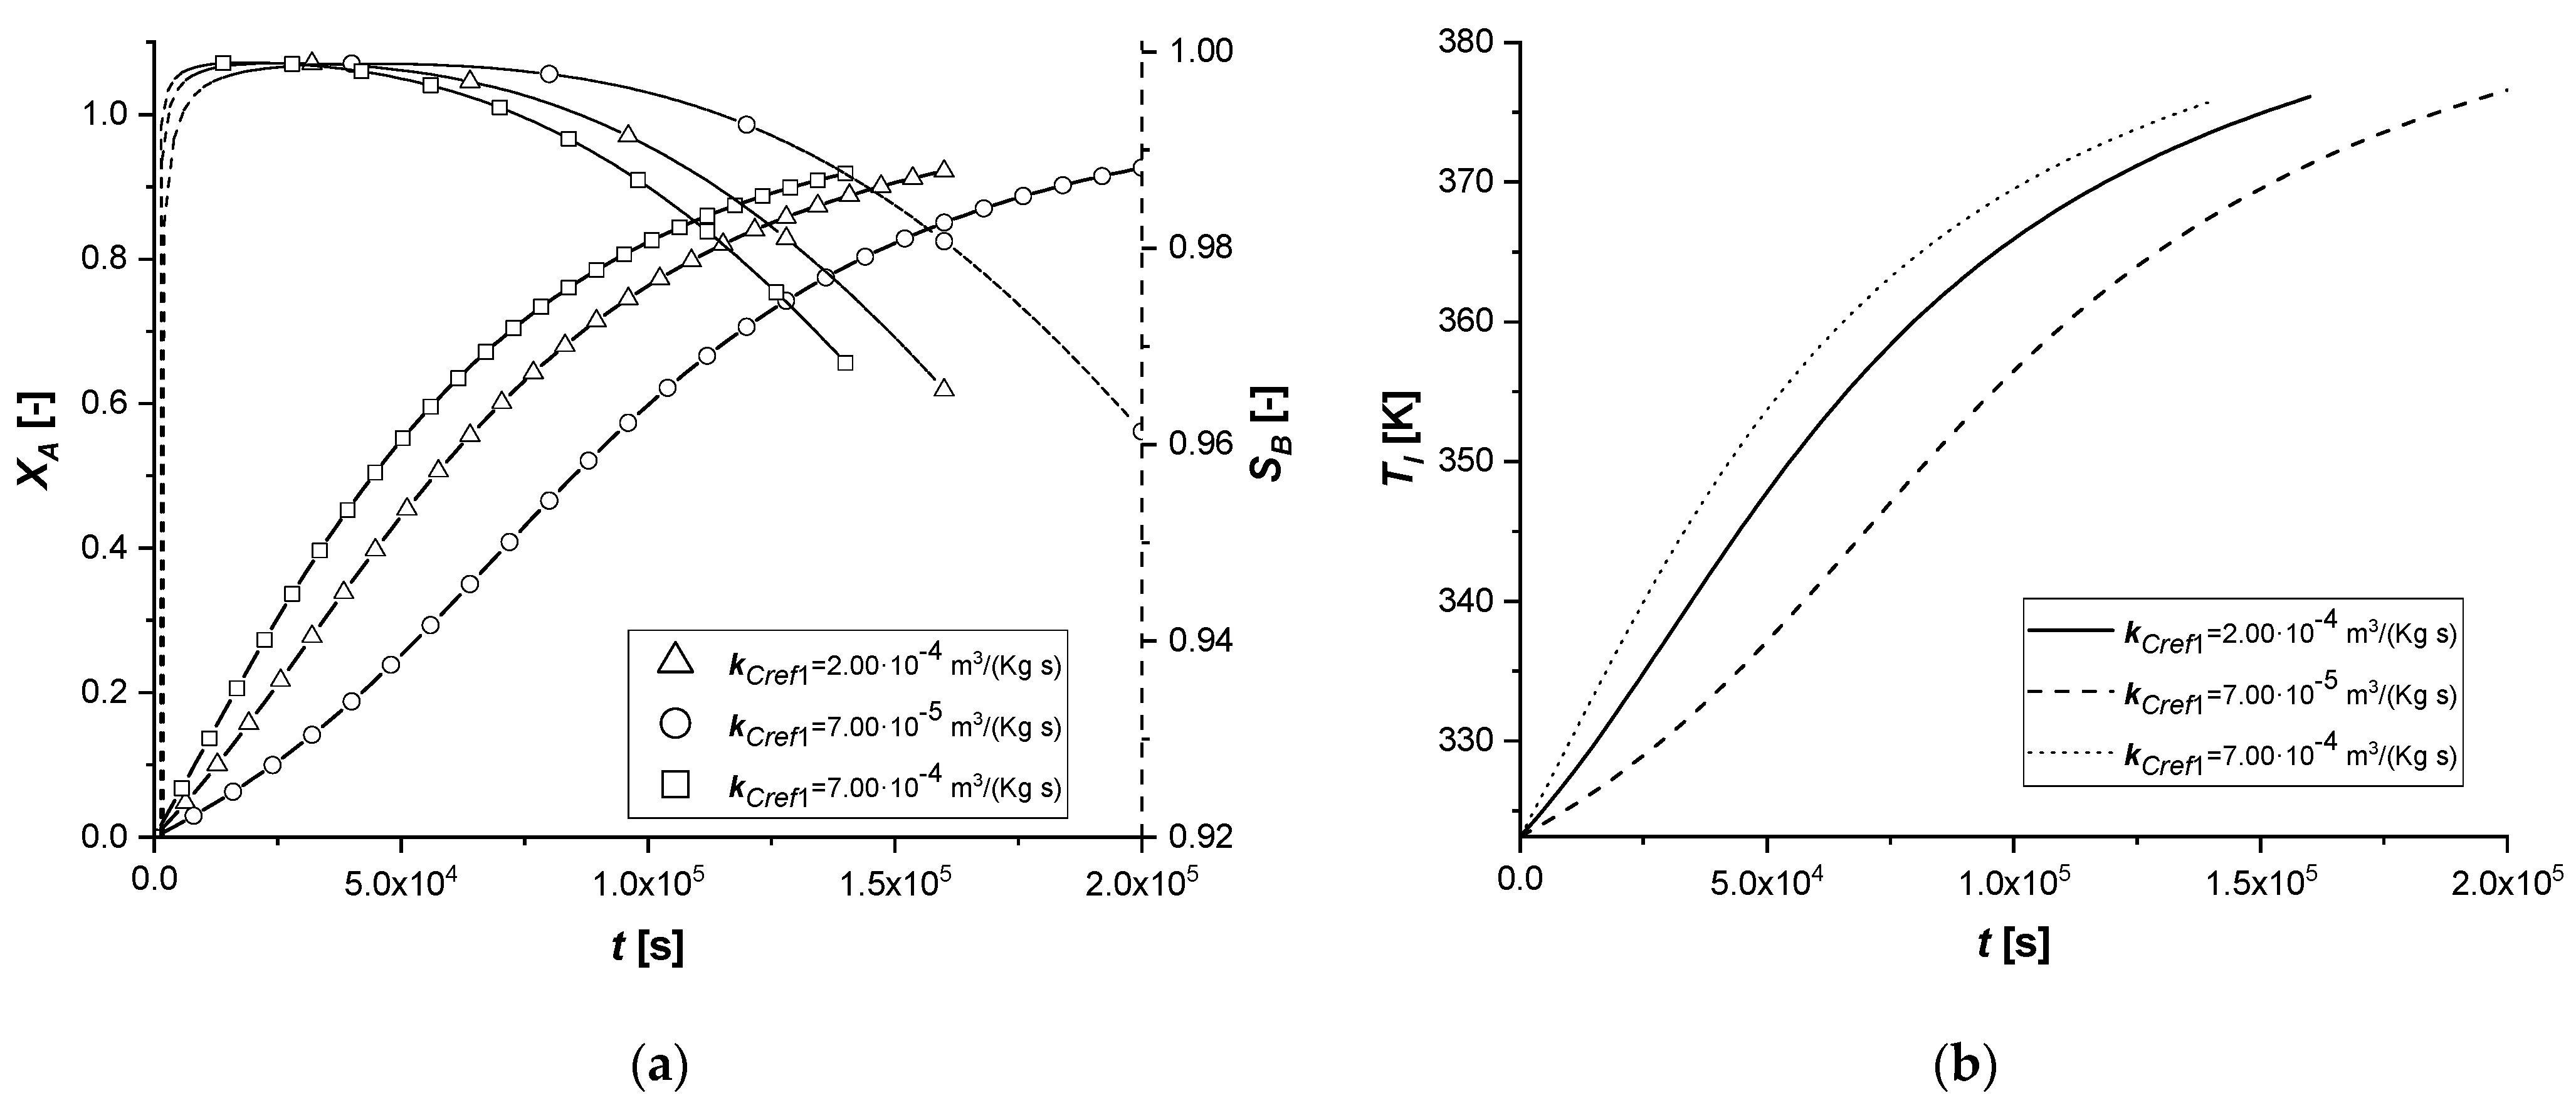
The manipulation of the reference kinetic constant of the first reactive process determines the variation of its reaction rate. Consequently, an increase in the amount of reactant diffused in the particle or an improvement in the production of the intermediate can be expected.
As the kinetic parameter increases, both reactive processes are accelerated. If for the first reaction the increase in the rate is evident, the second receive an improvement due to the high concentration of B, because its kinetics of first order with respect to the intermediate.
It is interesting to note that unlike the first set of enthalpy simulations, the decreasing trend on the liquid side of cBl is not observed in the EW and EY cases. The second chemical reaction is less affected than the ΔH1 study. In these simulations, in the cases of EW and EY, the consumption of A is clearly limited by internal diffusion resistance.
With the consequent decrease of the kinetic constant, the reaction times increase moderately, showing a growth in the production of the by-product C, especially in the ES case.
Also in this study, the use of ES type catalysts can be favored if the desired product is the intermediate one.
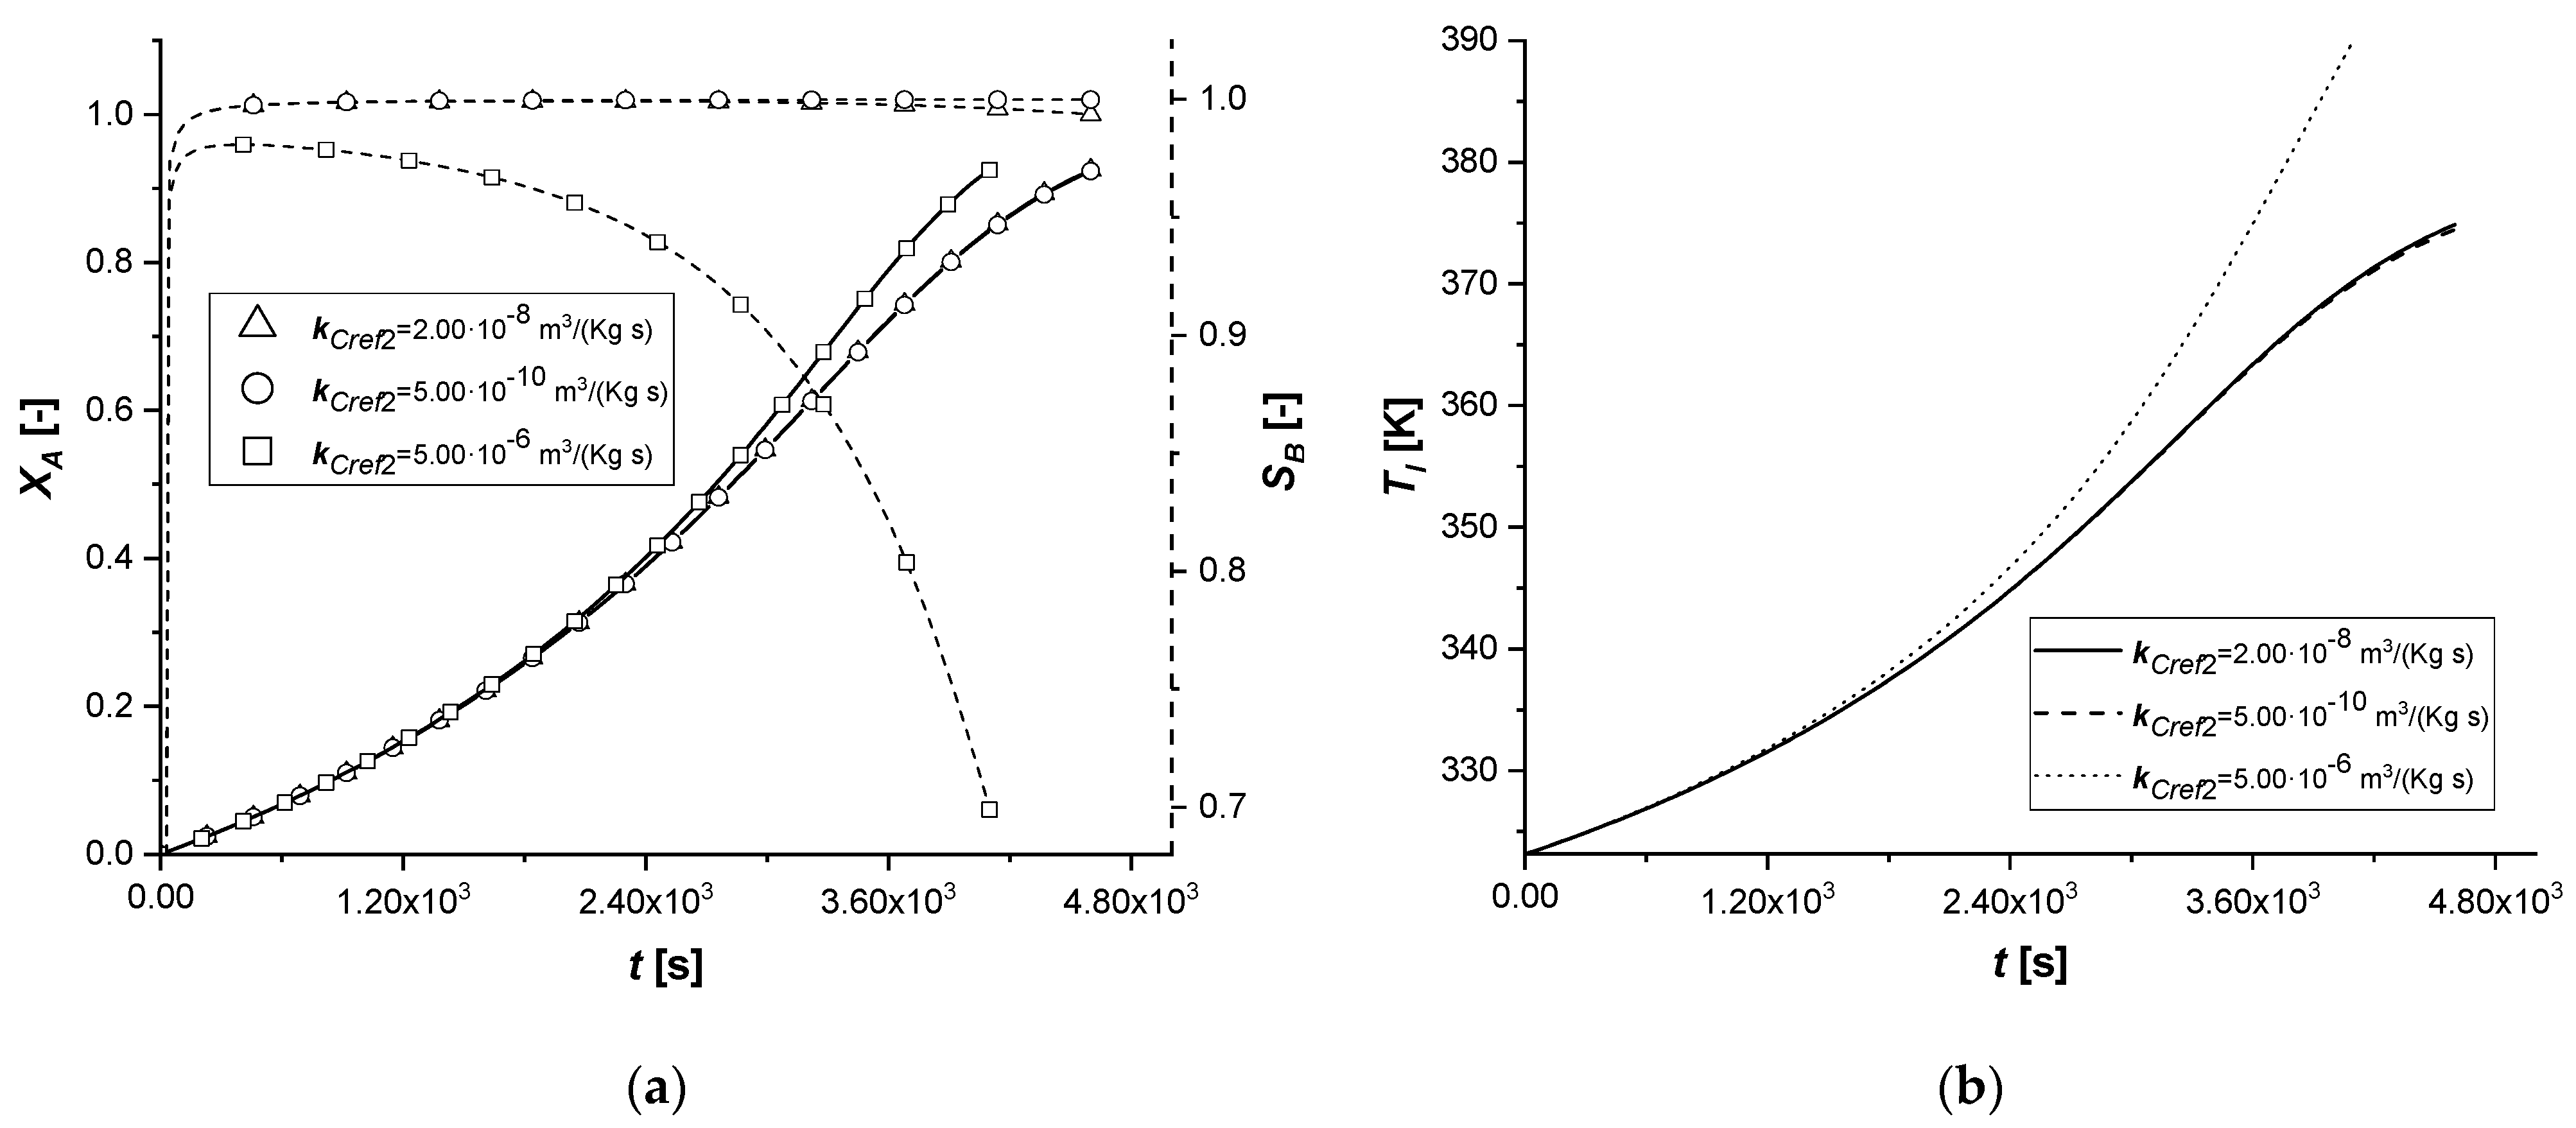
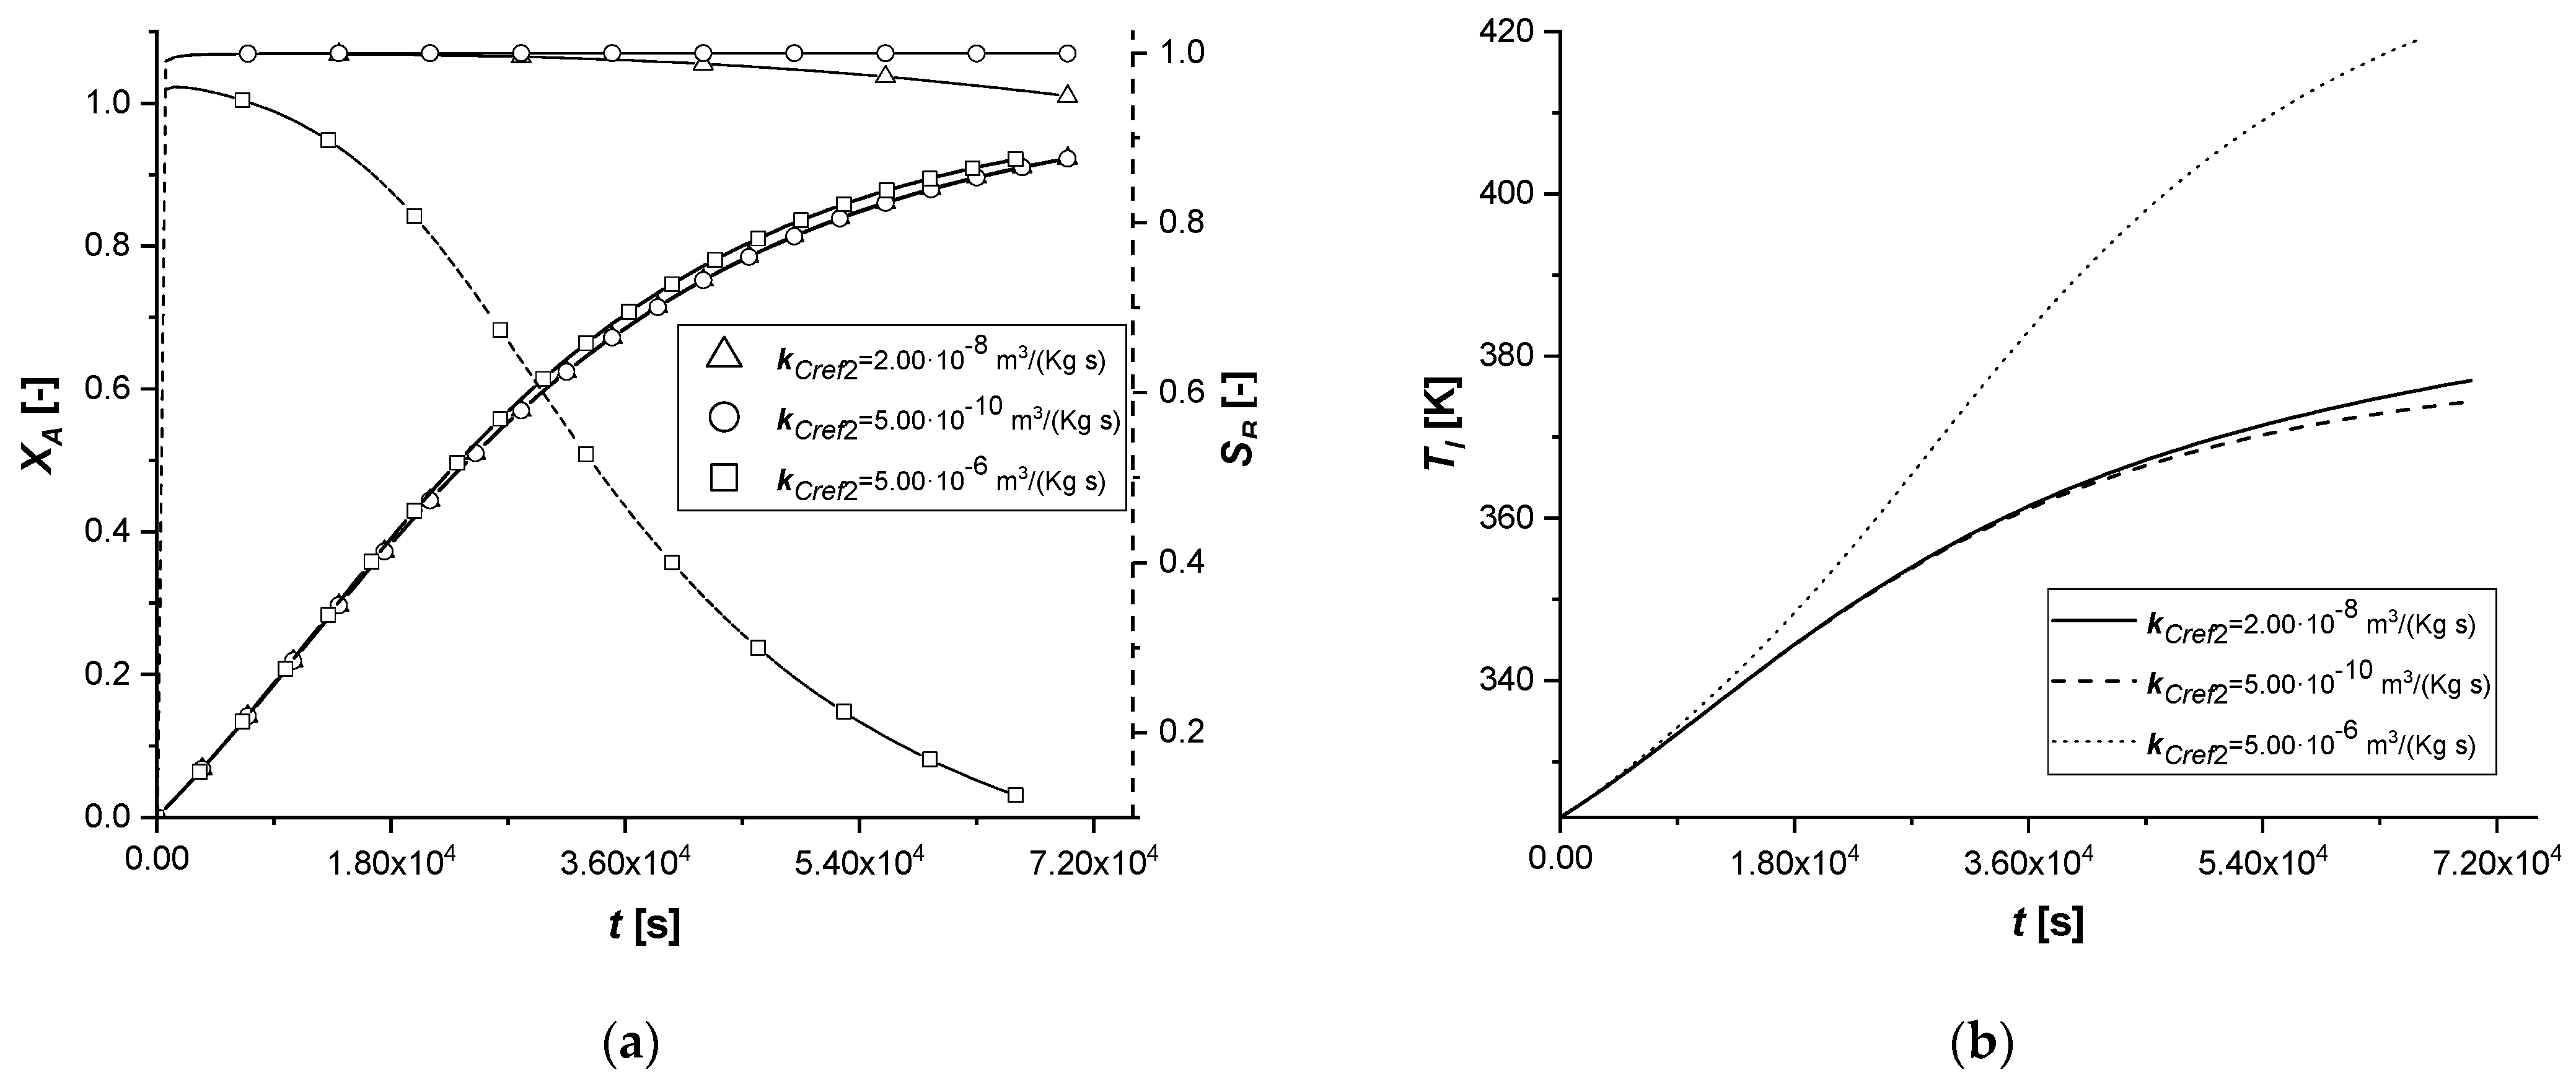
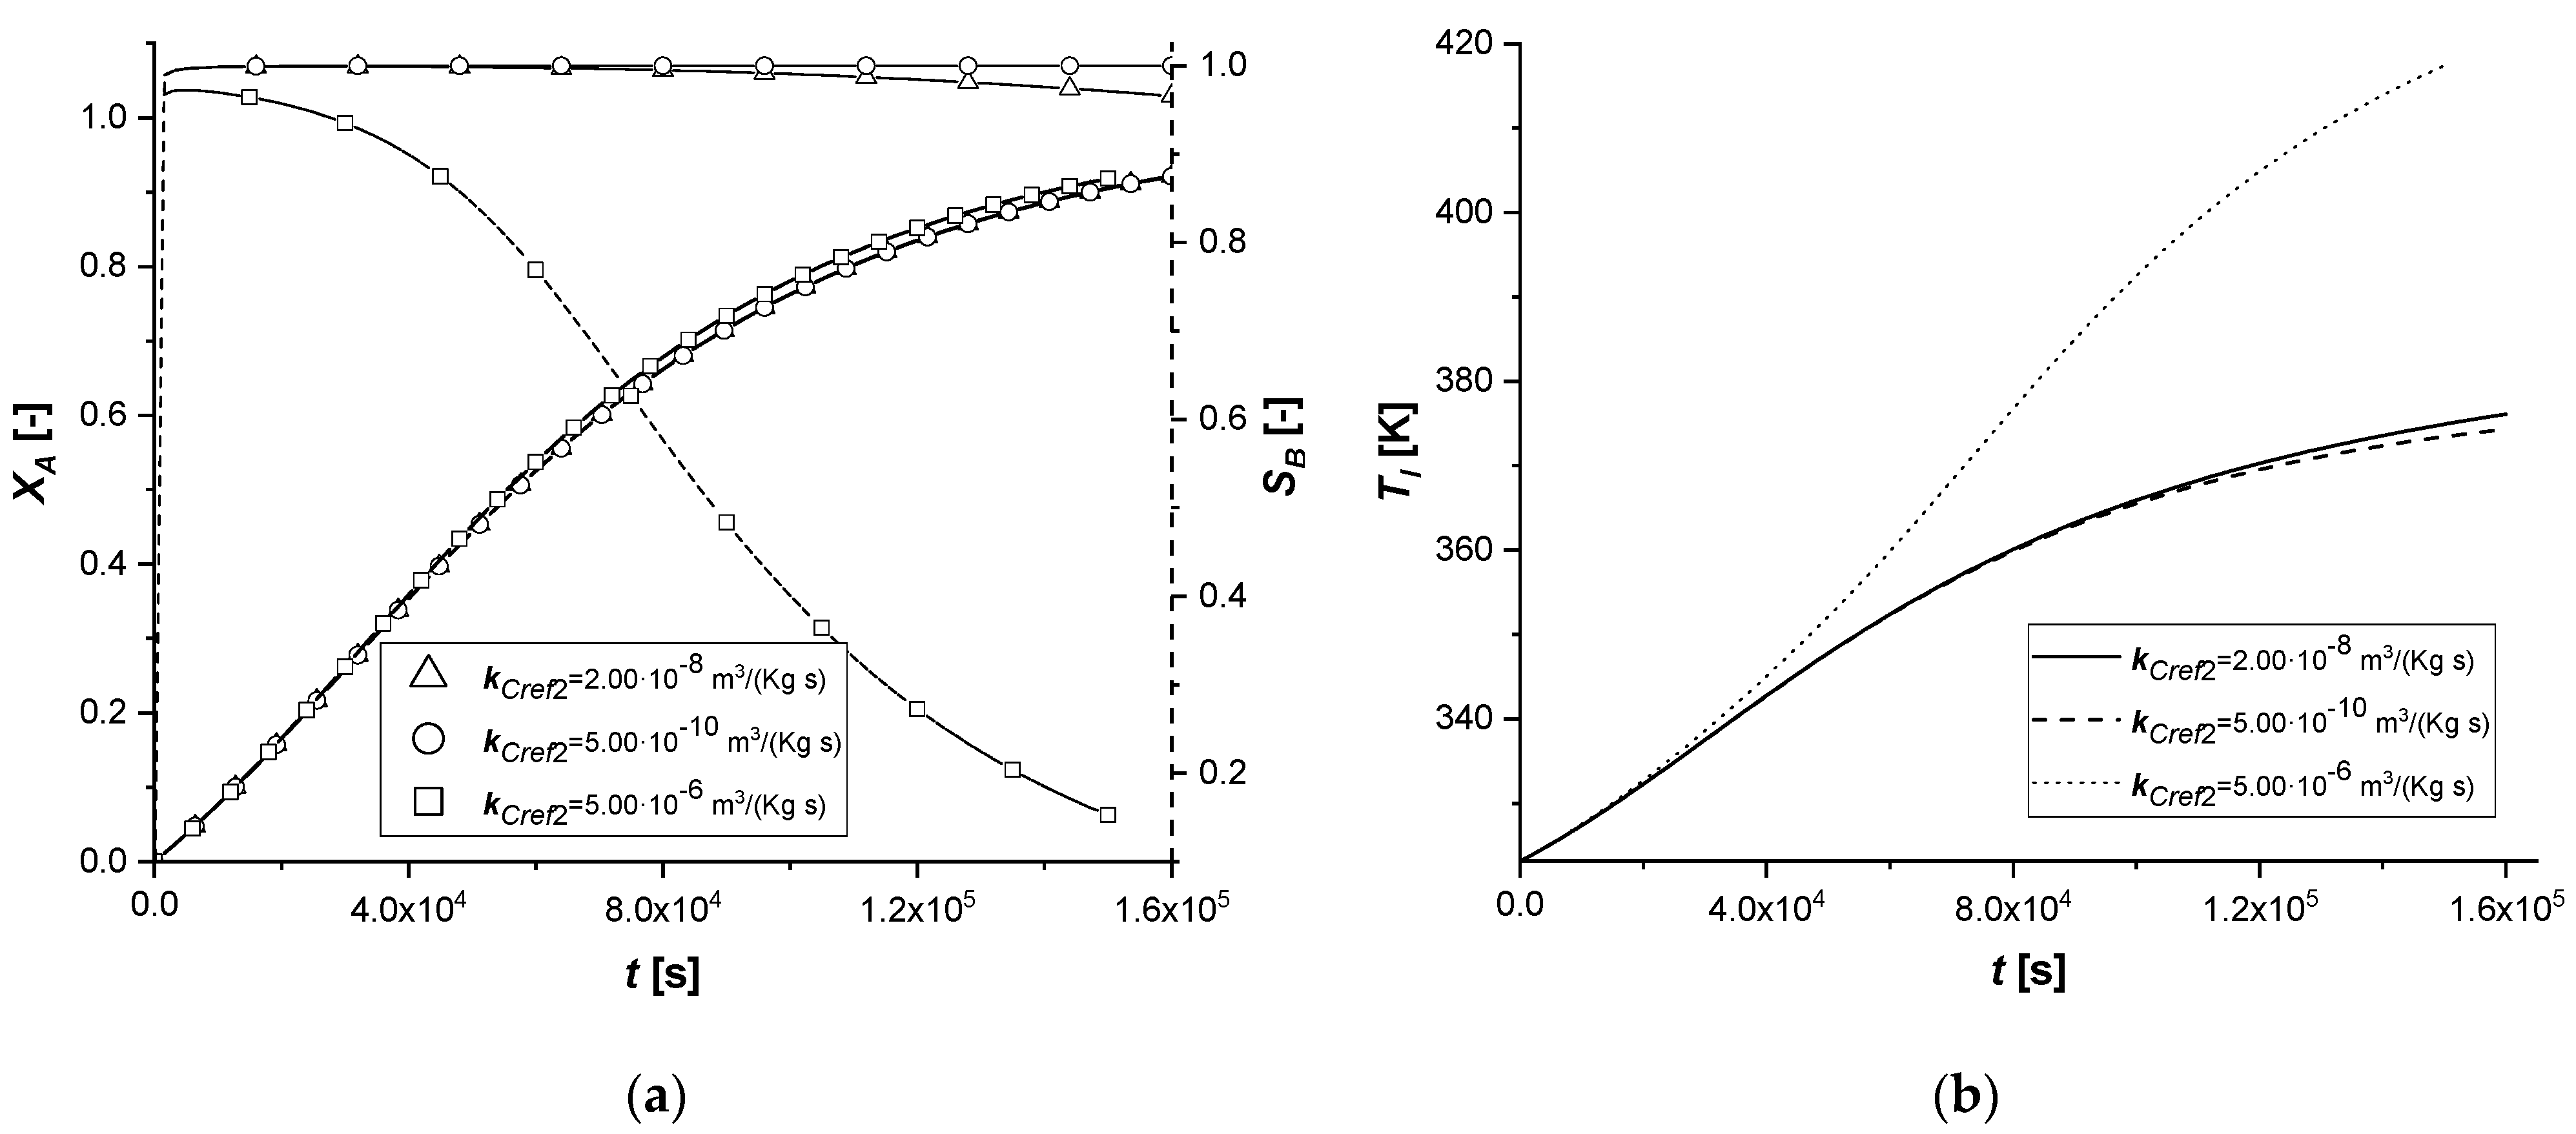
The kinetic parameter, kCref2, is under standard conditions, four orders of magnitude lower than the first chemical reaction; consequently, its further lowering involves a decrease in the quantity of the final product C. In all the cases, it is possible to observe that both the liquid and solid side profiles tend to overlap the reference simulation with small exceptions.
By increasing the parameter and making it comparable with kCref1, it is observed an increase in the production of C. For the first time, there is a beginning of a descending phase in the cBl profile in the ES. In the EW and EY cases the concentration of the intermediate in the liquid is the lowest ever observed, also preventing the accumulation of the component inside the particle.
3.2.3. Effective Molecular Diffusivity
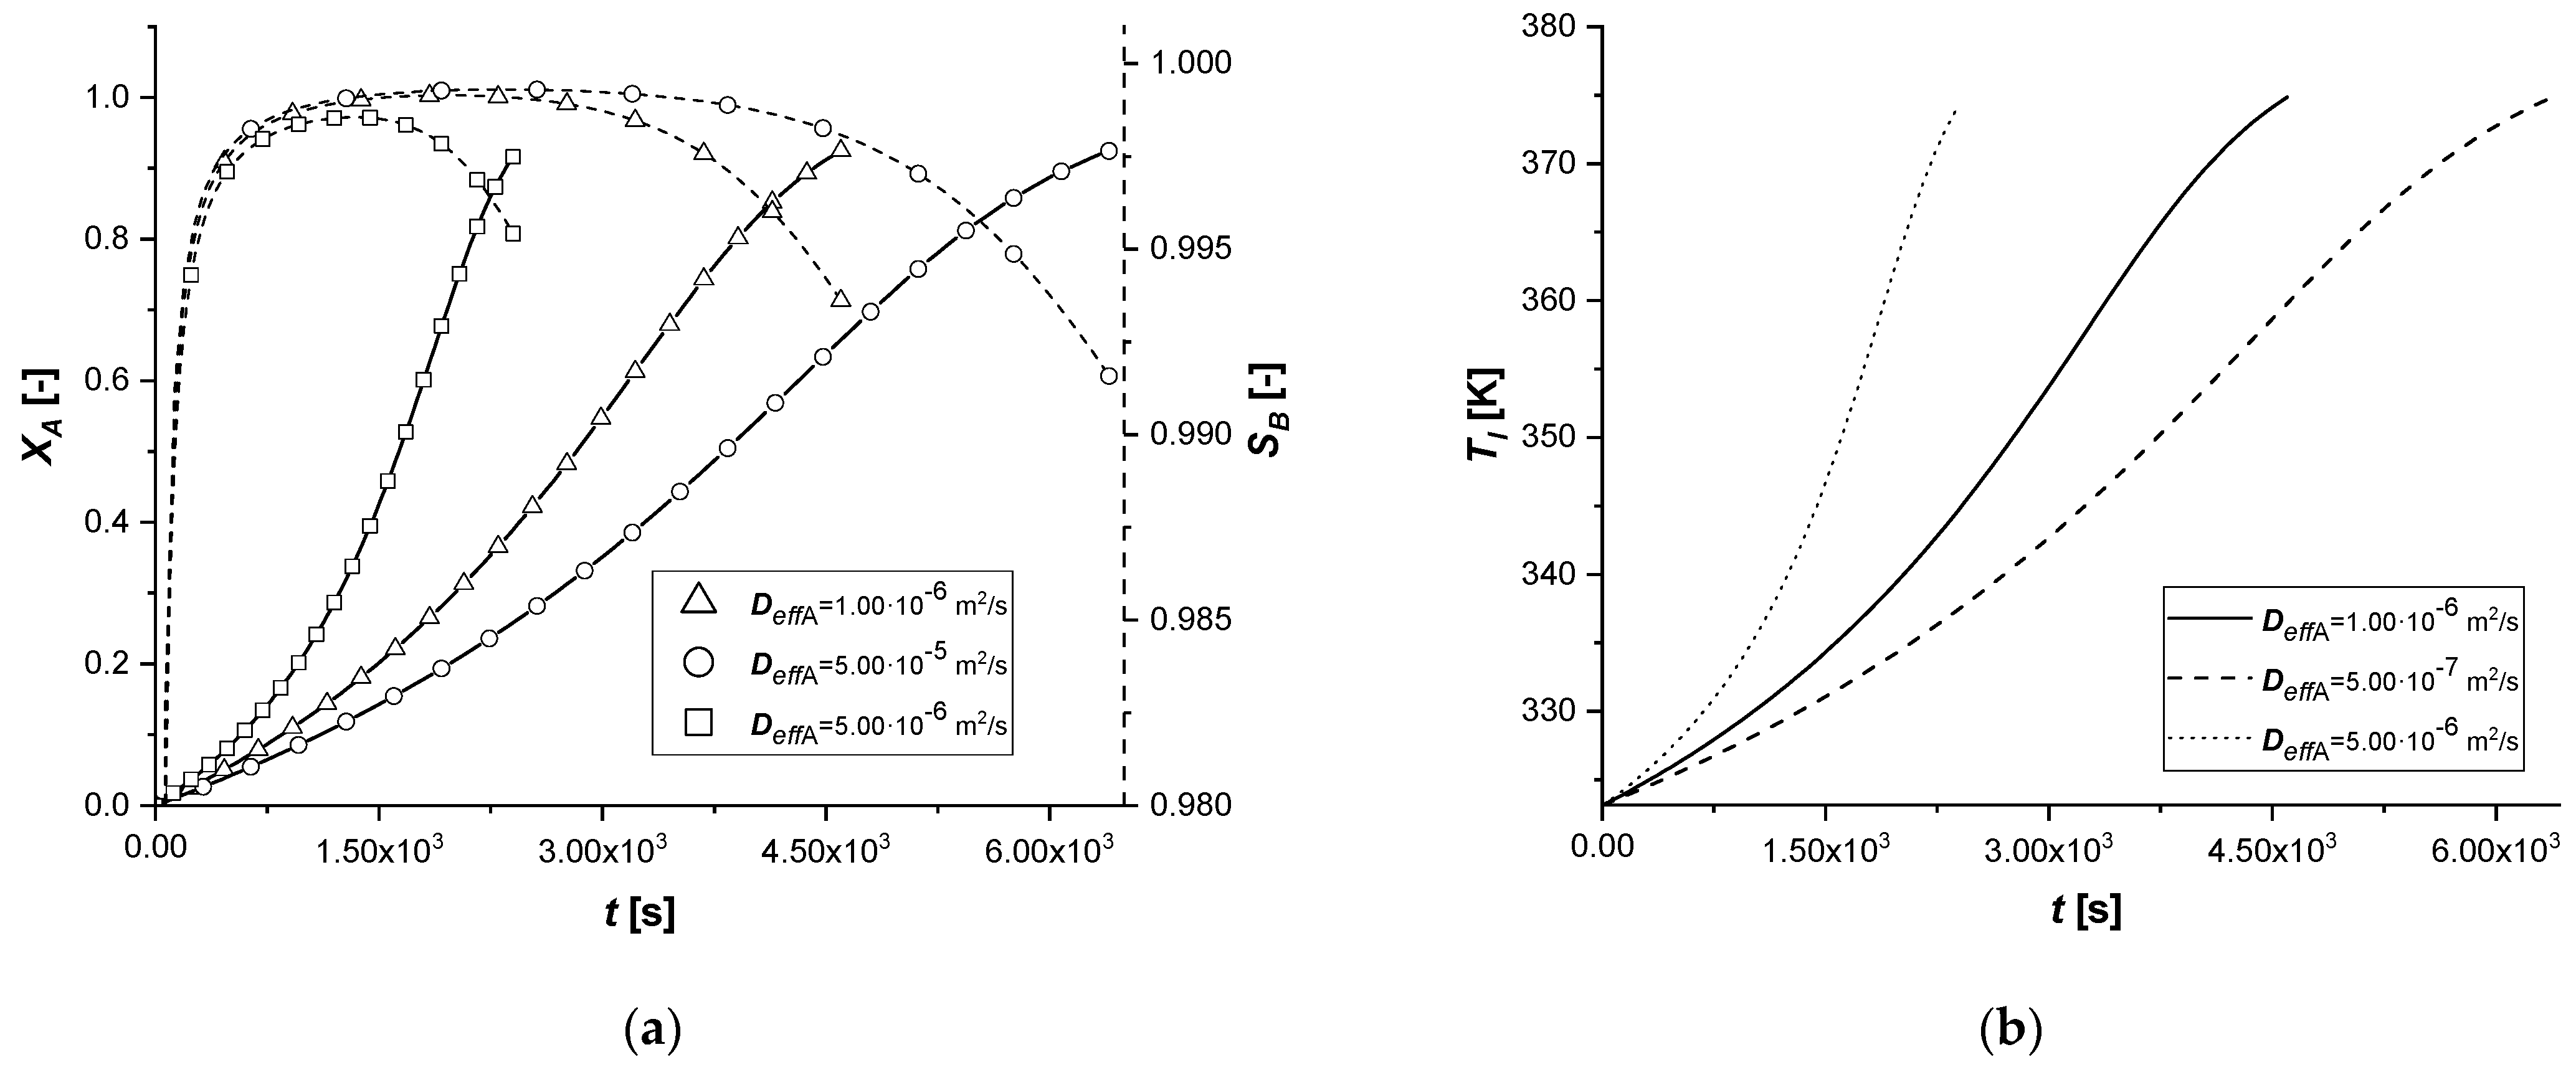
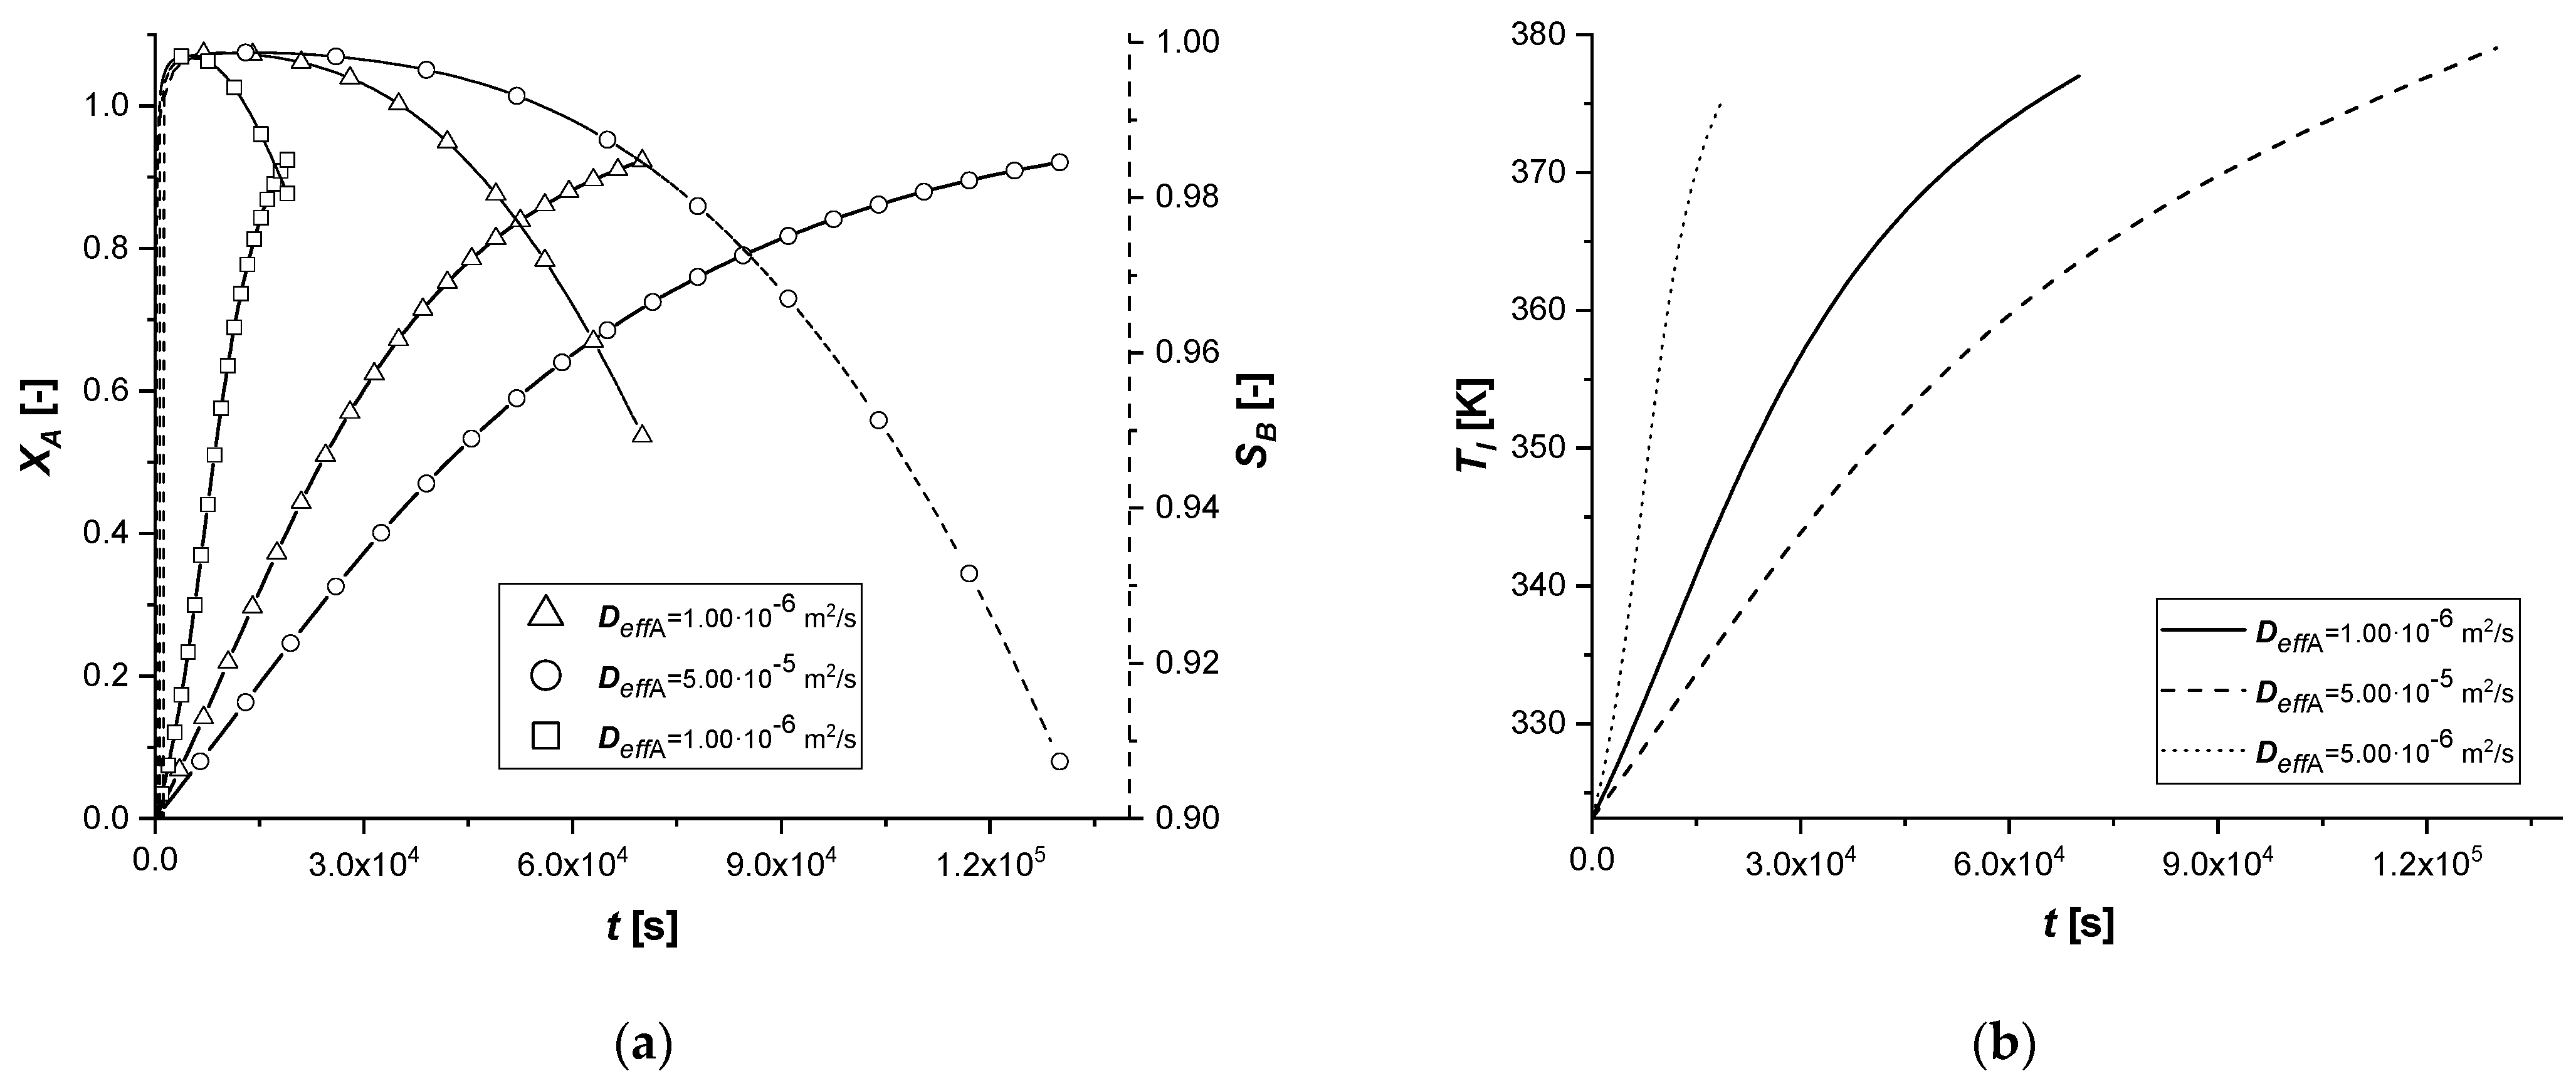
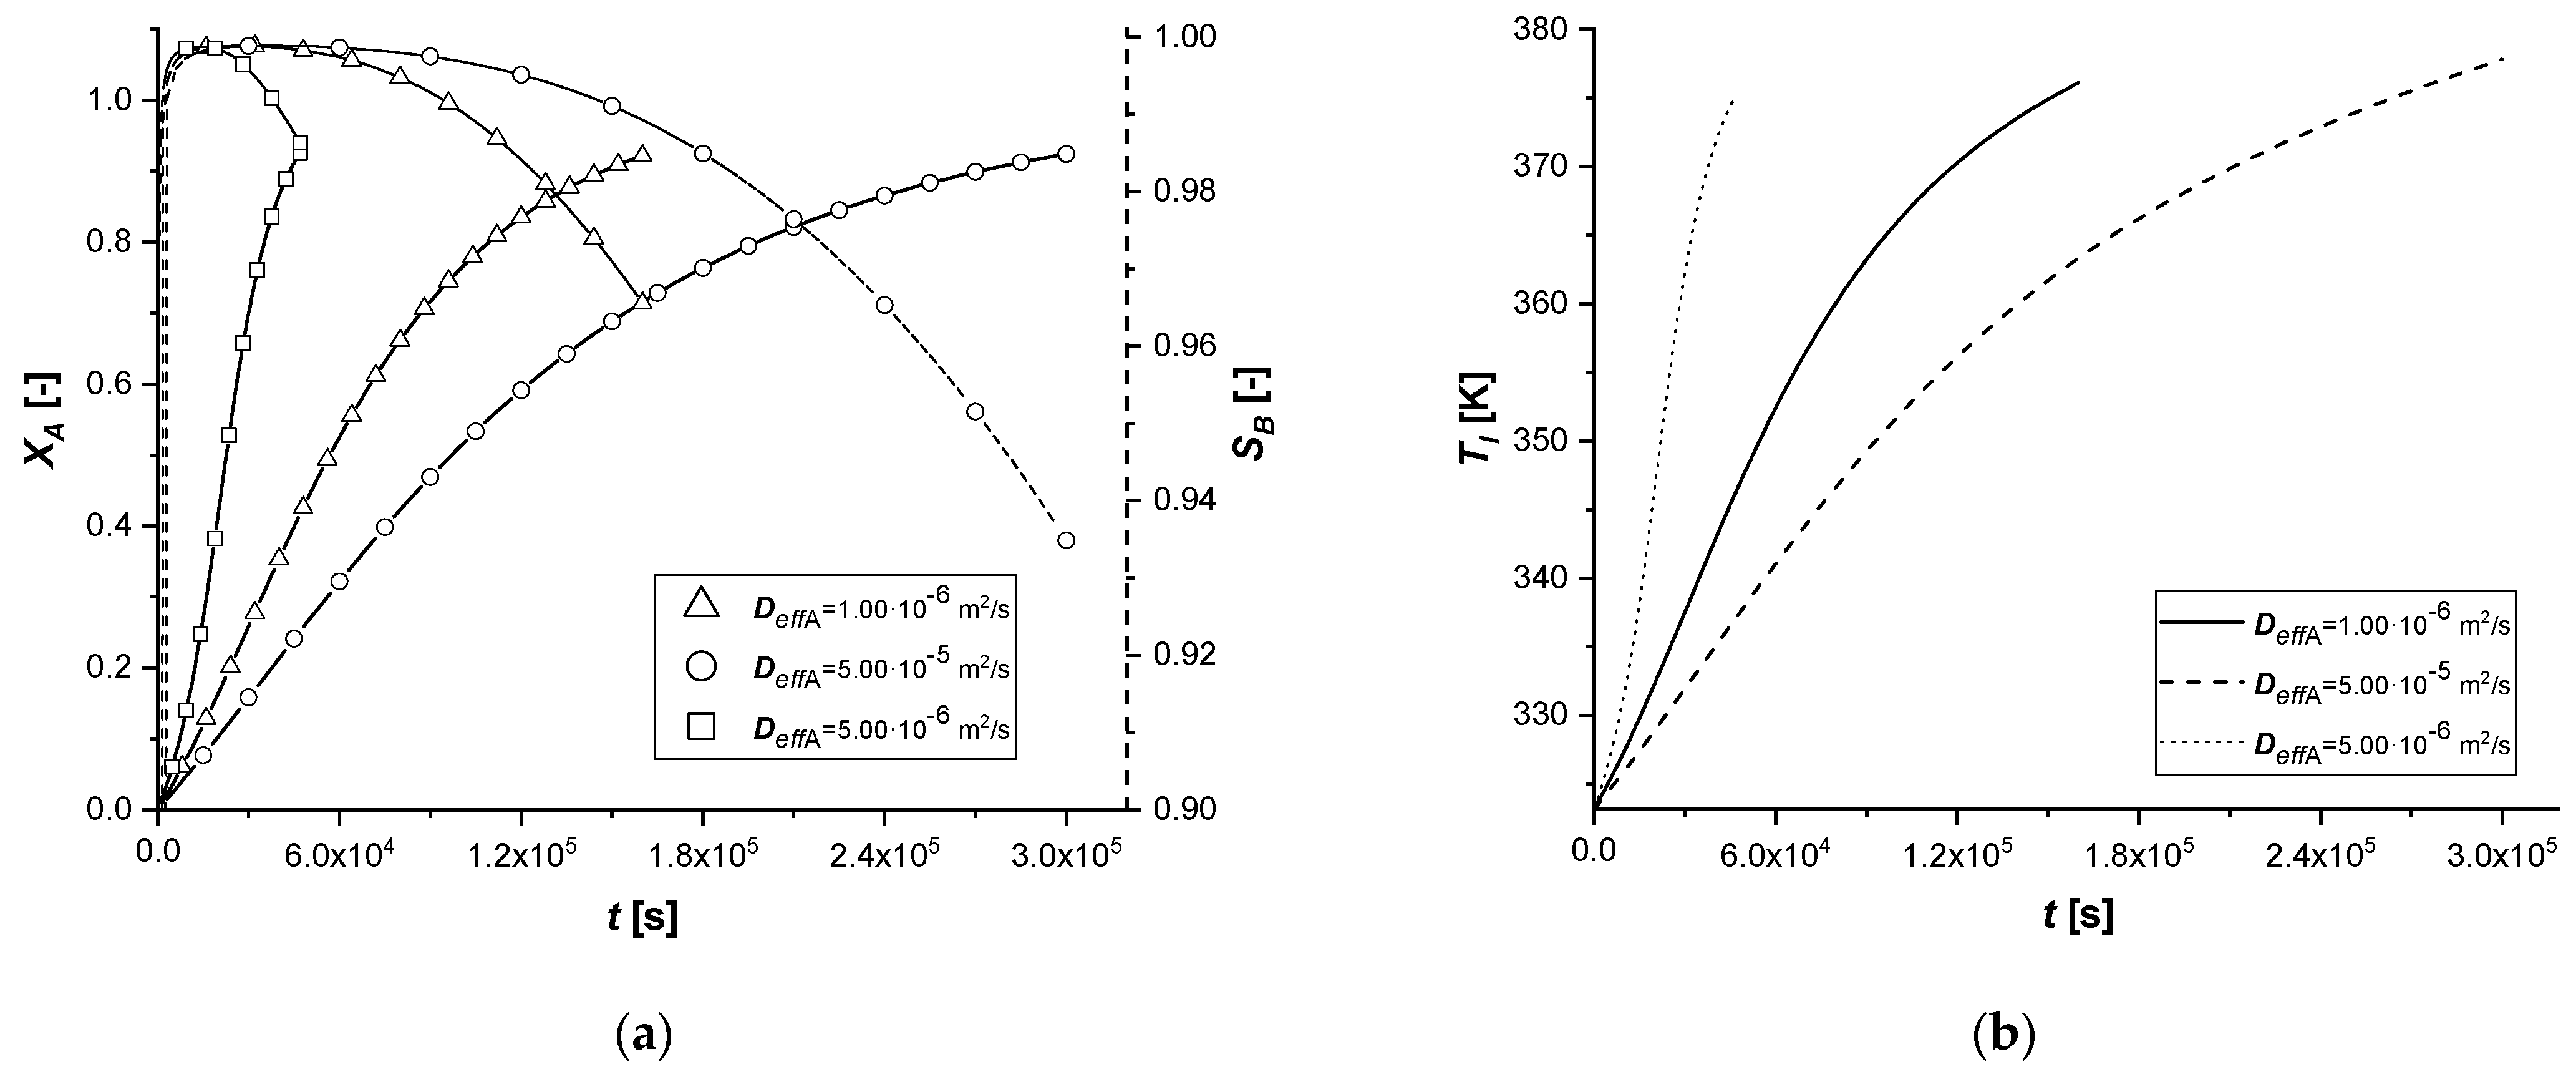
The molecular diffusivity coefficient, appearing in the model in the solid-side mass balance, intervenes in the intraparticle mass transport resistance. Therefore, this study focused exclusively on the variation of the diffusive parameter of reagent A.
As can be seen from the results, a modest variation in Deff,A causes significant changes in the concentration profiles of the solid and liquid sides.
In particular, the resulting decrease of the parameter determines an increase in the resistance of intraparticle mass transport of A. It is possible to notice extended reaction times, especially in cases where the catalytic phase is located in the depth of the catalyst.
The increment of Deff,A generates diametrically opposite effects; much faster reactions are observed, due to less diffusion resistance within the solid phase. It is interesting to note that for the reactive process causes, for the first time, the achievement of an intra-particle concentration of the intermediate is higher than 1 mol m−3.
Finally, the amount of the final product cCl obtained is very low when the mass transfer of A is less limiting.
3.2.4. Particle Radius
The effect of the variation of the particle radius in the model is to be found in both mass balances. In particular, RP is placed both in the internal diffusive term, altering the transport resistance, and in the external diffusive term by modifying the contact surface between the two phases, identified in the relationship between the surface of the particle and its volume (asp).
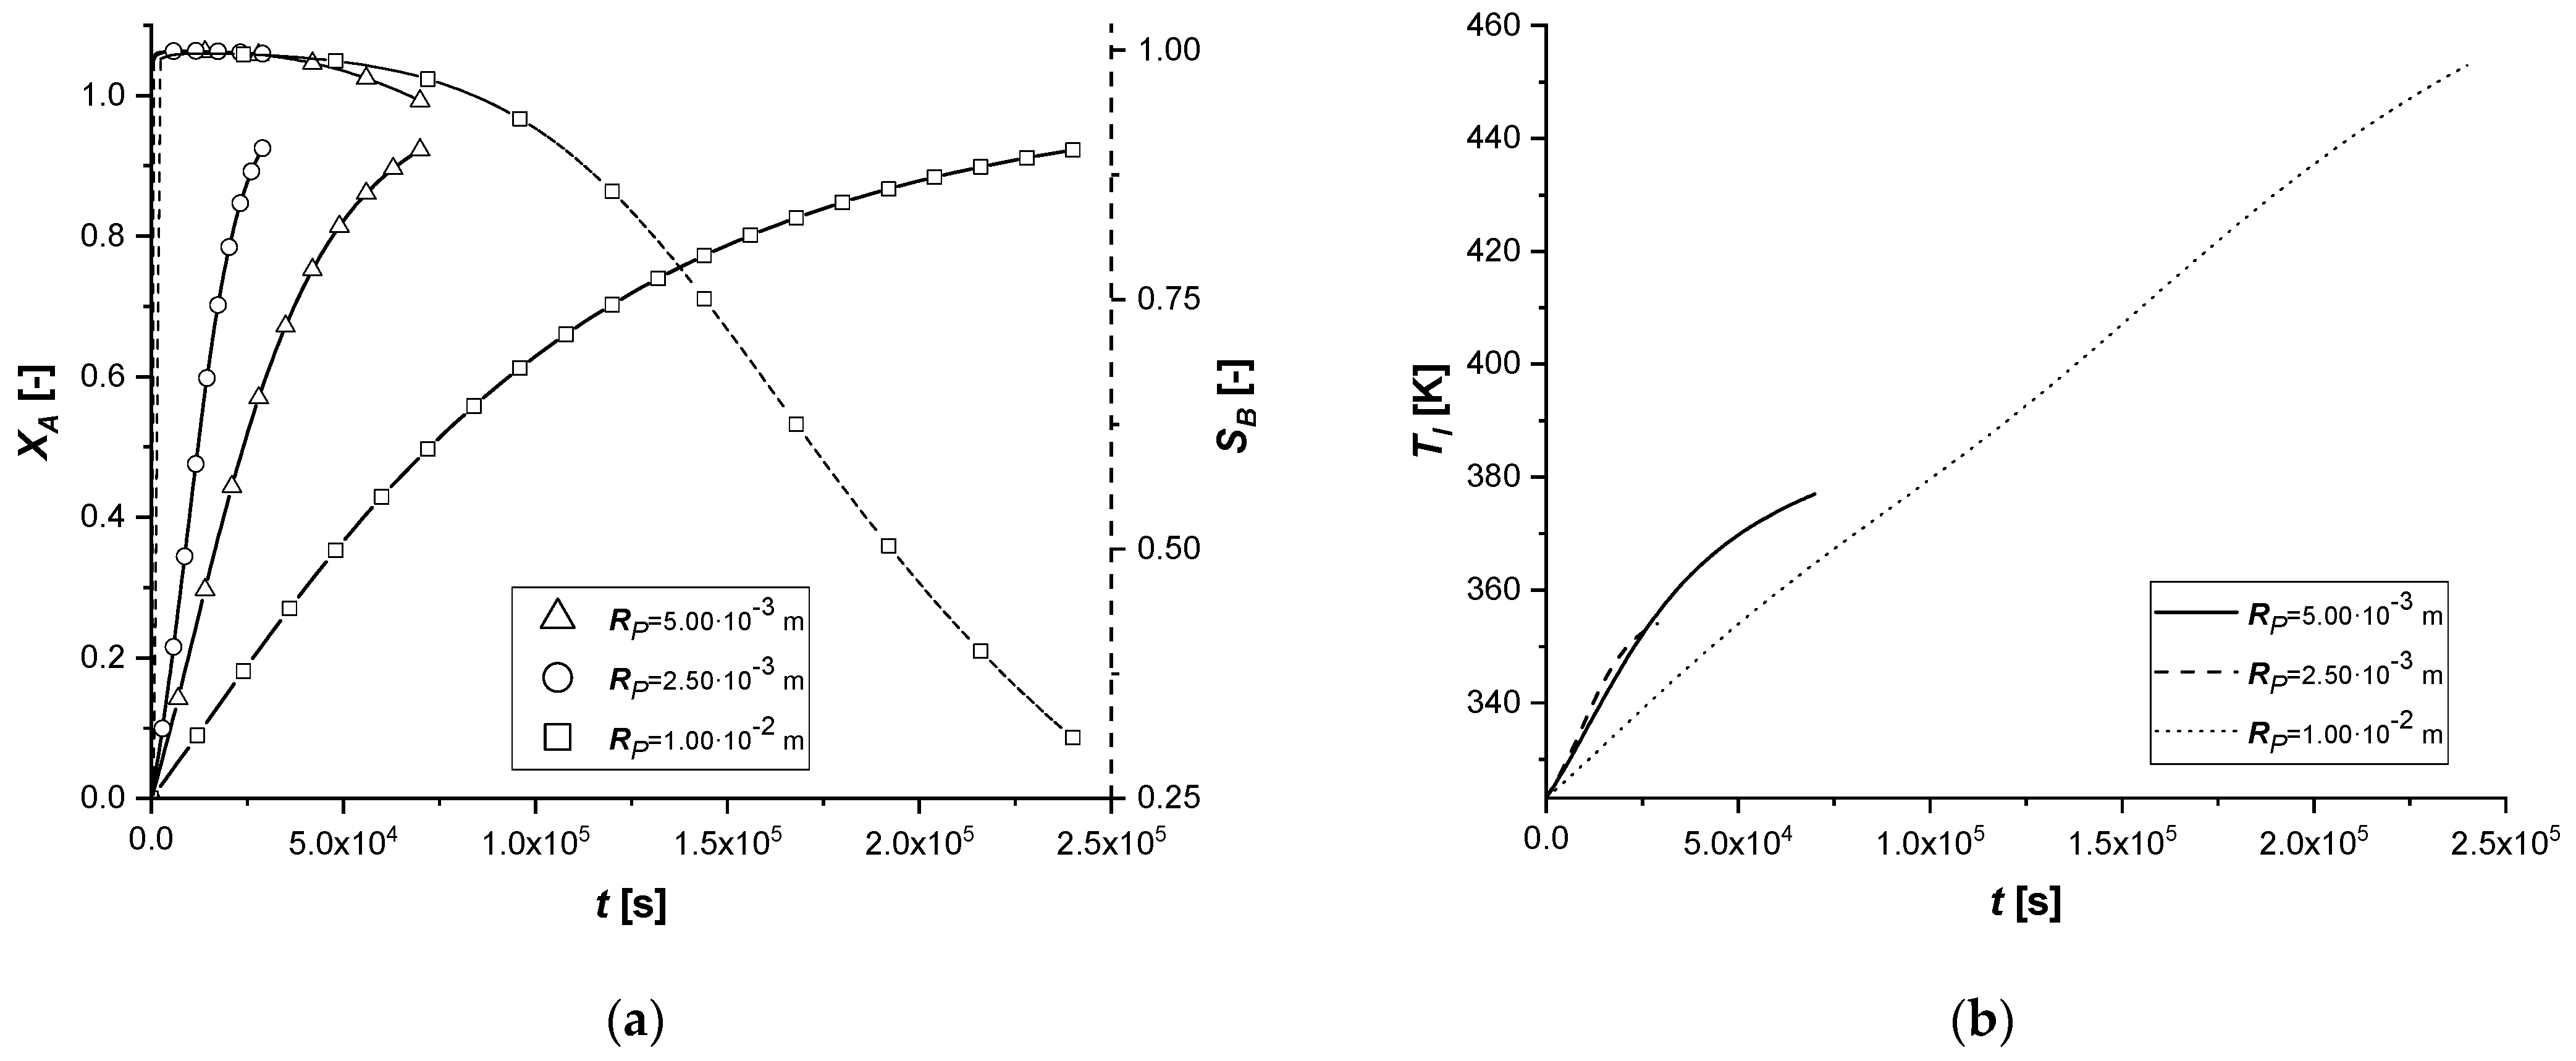
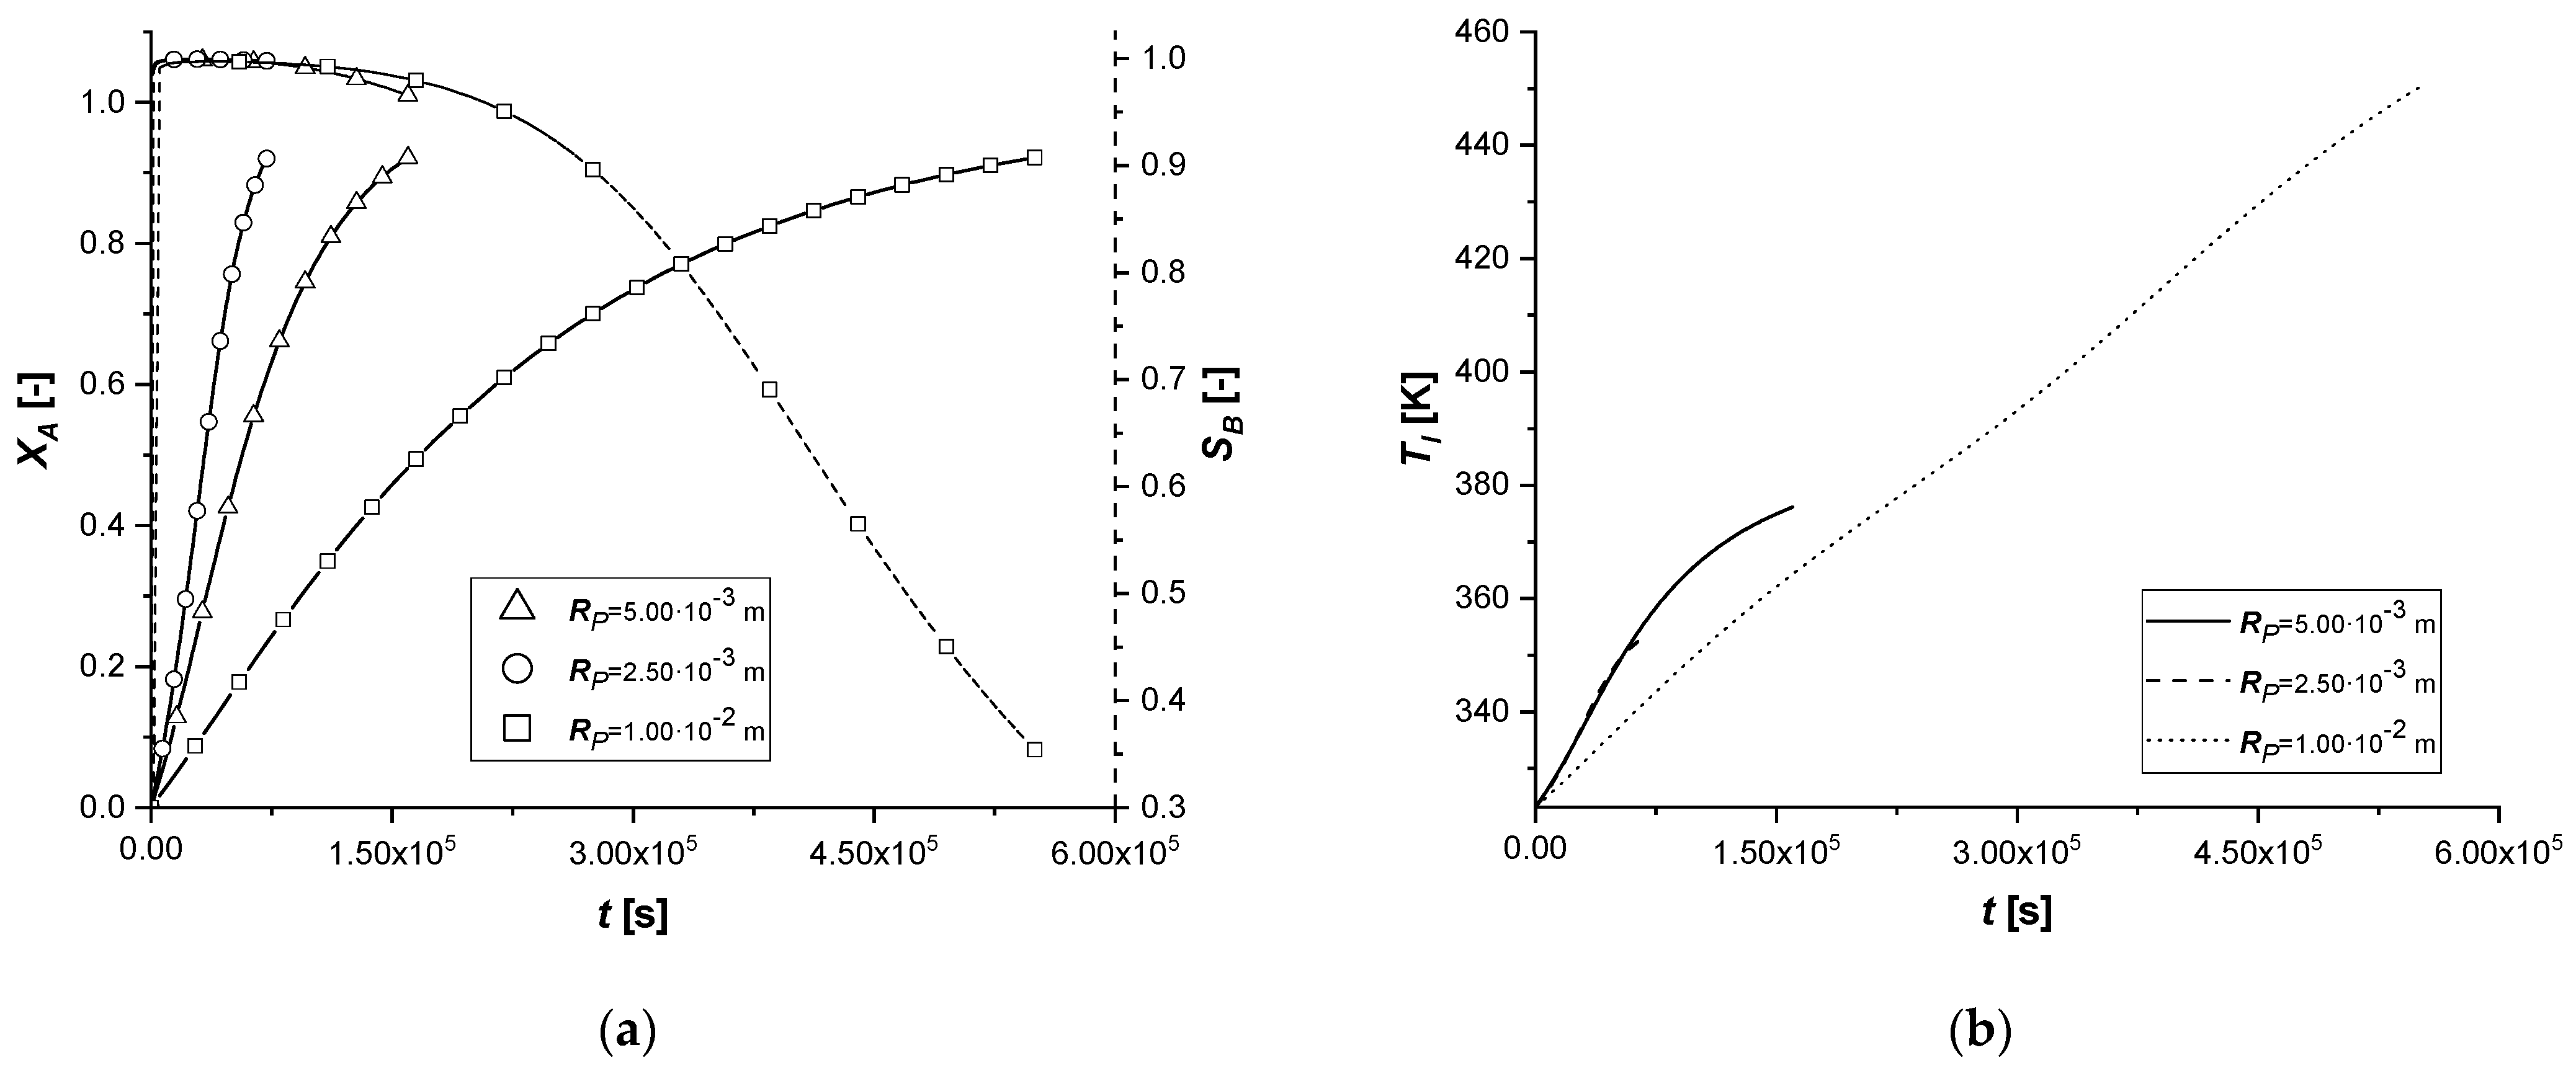
The comparison between the solid side and liquid side concentration profiles calculated for all the catalytic cases are reported in
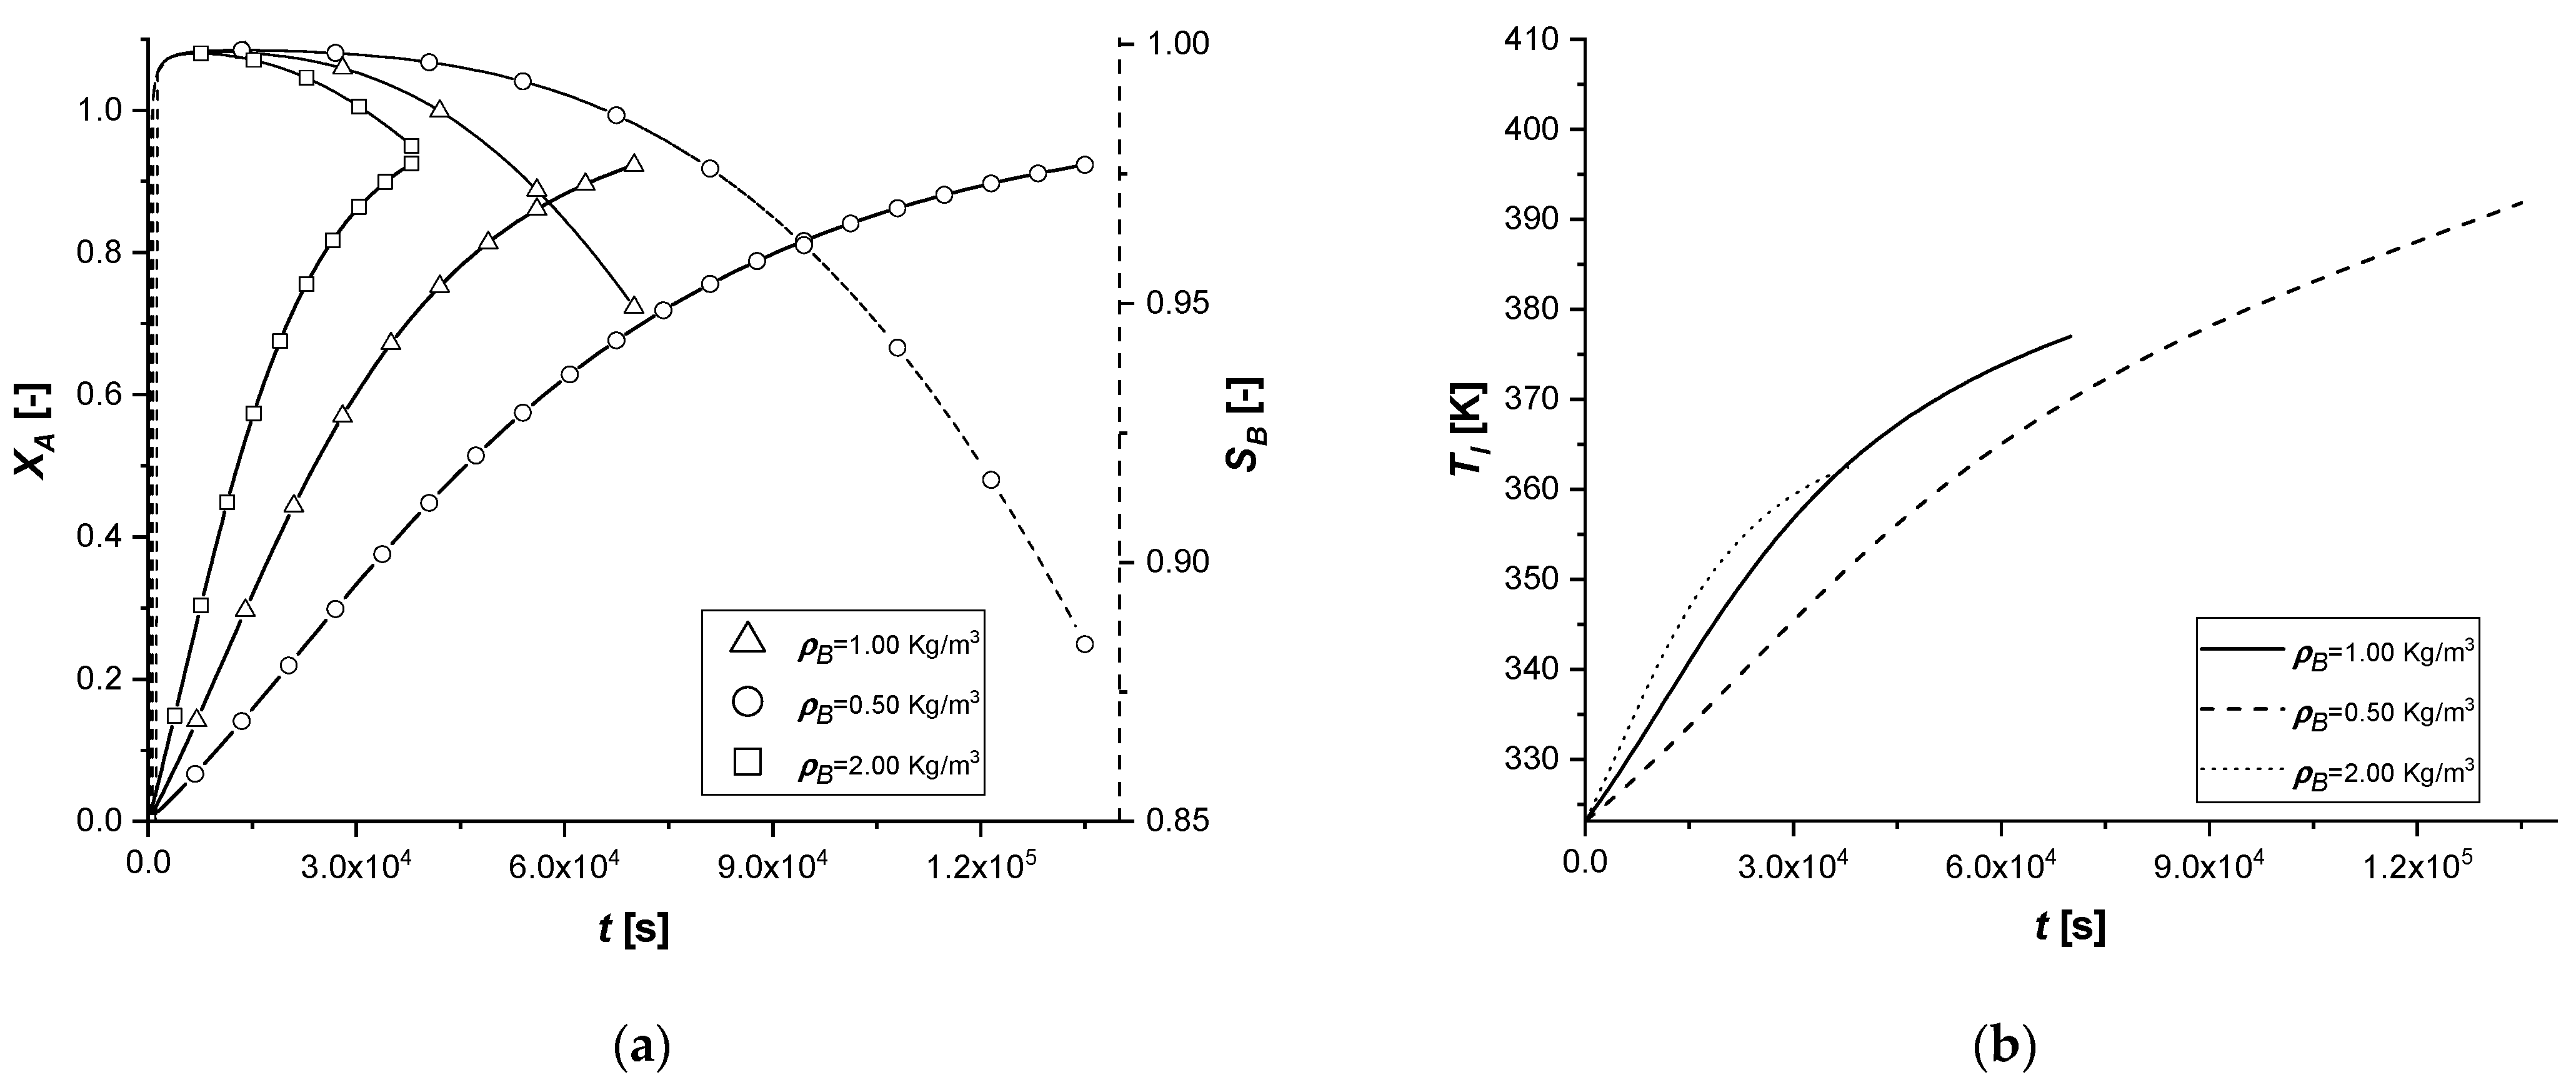
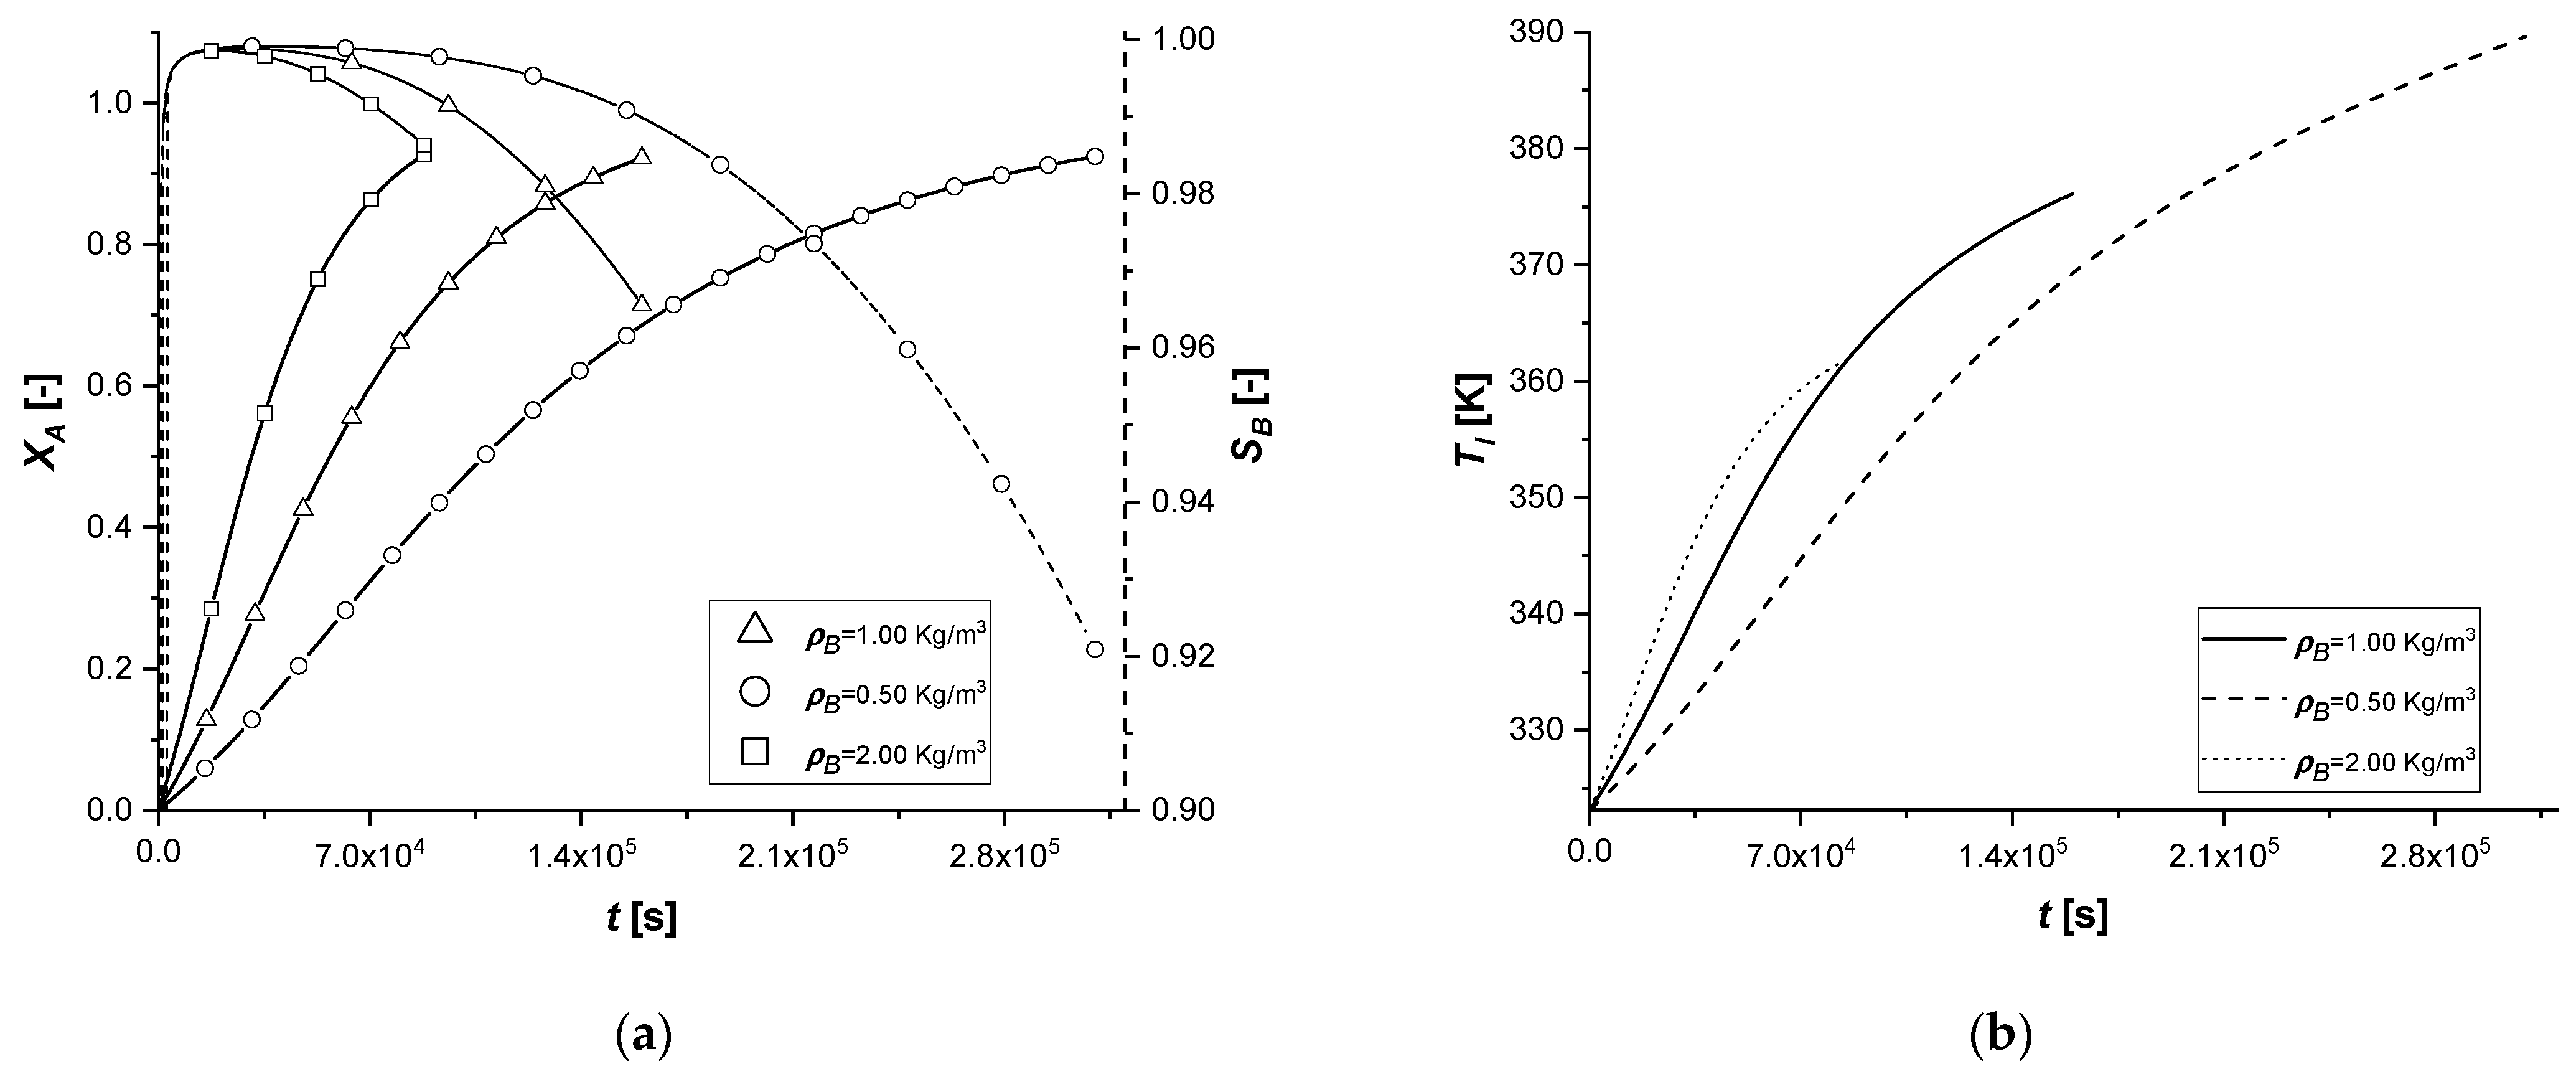
Supplementary Materials in Figures S46–S54. The details of each conversion, selectivity, and liquid side temperature profiles, calculated for all catalytic cases, are displayed in
Figure 20,
Figure 21 and
Figure 22.
Observing the results in the comparison graphs, it can be stated that the response of the model to the variation of RP is opposite to what is visible in the simulations involving Deff,A. It is important to remember that, unlike the previous case, where the effect was focused only on the main reacting species, in these simulations, the effect is related to all the species involved.
In particular, a reduction of the particle size favors the diffusion of the reagent inside it and of the products towards the bulk. This result can be visualized very well due to the short reaction times. With a small radius, the quantity cBl obtained in all cases is very high to the detriment of the by-product.
If the particle size increases, the limitation caused by diffusive internal phenomena becomes even more dominant. In all the cases, a significant increase in the concentration of C is observed. This phenomenon is caused by the difficulty of B, once formed in the catalytic zone, to diffuse backward, accumulating in the solid and promoting the second reaction.
The influence of RP in the liquid side balance is less evident than that observed in the solid side, being the external diffusive term much less sensitive to its small alterations.
It can be assumed that the use of catalysts with a small particle radius favors the production of the reaction intermediate.
3.2.5. Catalyst Bulk Density
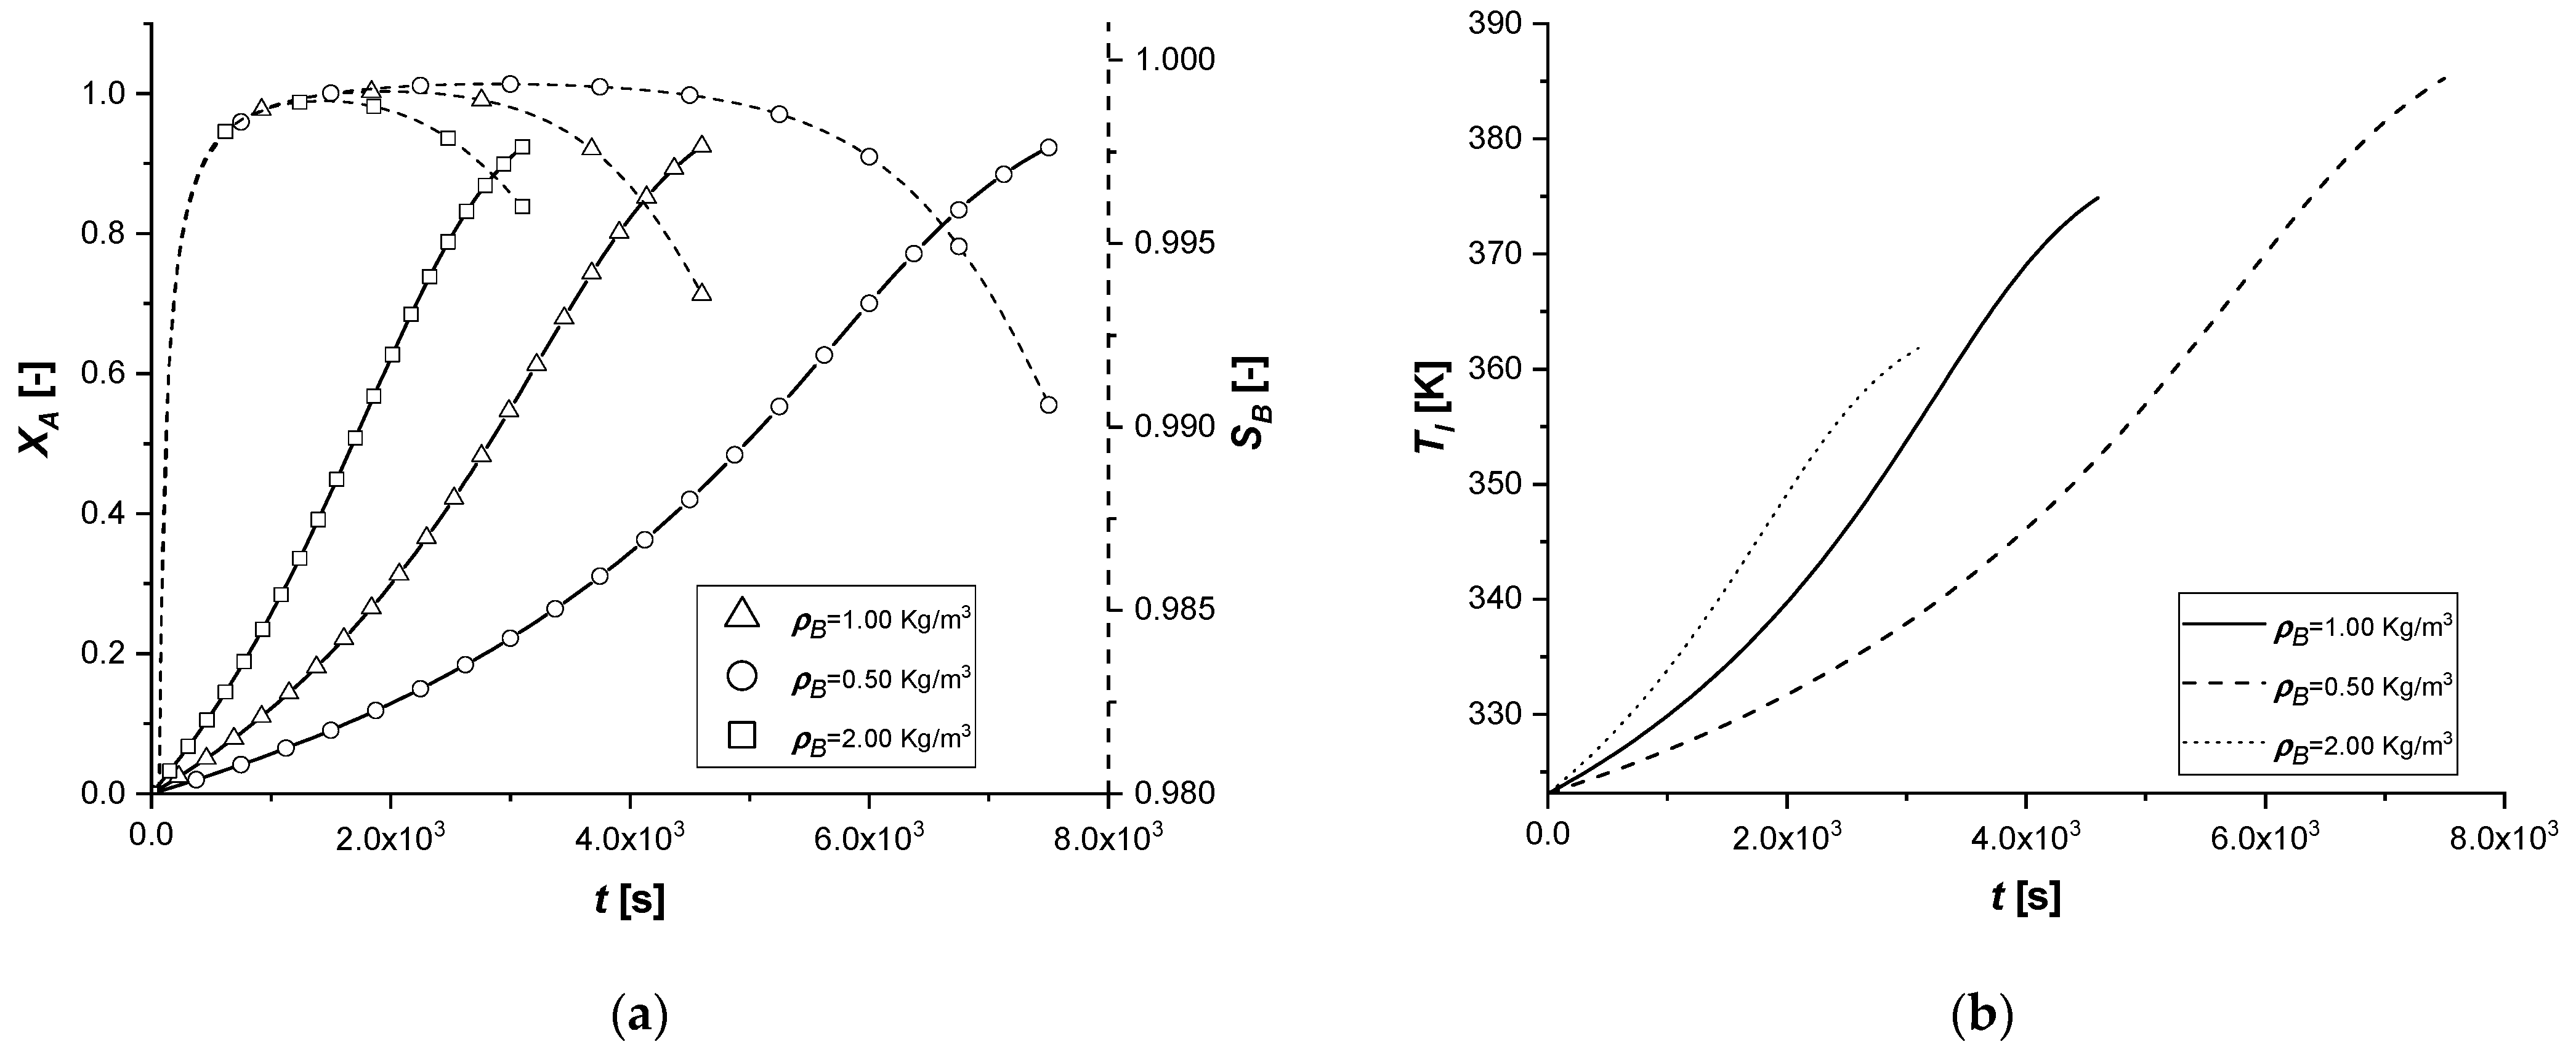
The consequent alteration of ρP, for the same particle radius, consists in a modification of the mass of catalyst present in the reactive system. This parameter directly affects the generative terms of intraparticle mass and energy balances. Finally, it also intervenes in the liquid side mass balance in the term ε.
The results obtained in the comparison graphs show that the decrease in ρP entails a slowdown in the entire chemical process due to the lower contribution of the generative terms. In fact, the accumulation of reagent A in the intraparticle profiles is observed, unlike the simulations with higher density values.
The increase in the quantity of catalyst accelerates all reactive cases and determines a lower production of by-product C in the reaction times.
It is important to consider that the alteration of this coefficient emphasizes important characteristics of the system: despite the correlation with both generative terms of mass, the gap between the two reactions tends to grow as the parameter increases.
3.2.6. Initial Bulk Concentration of A
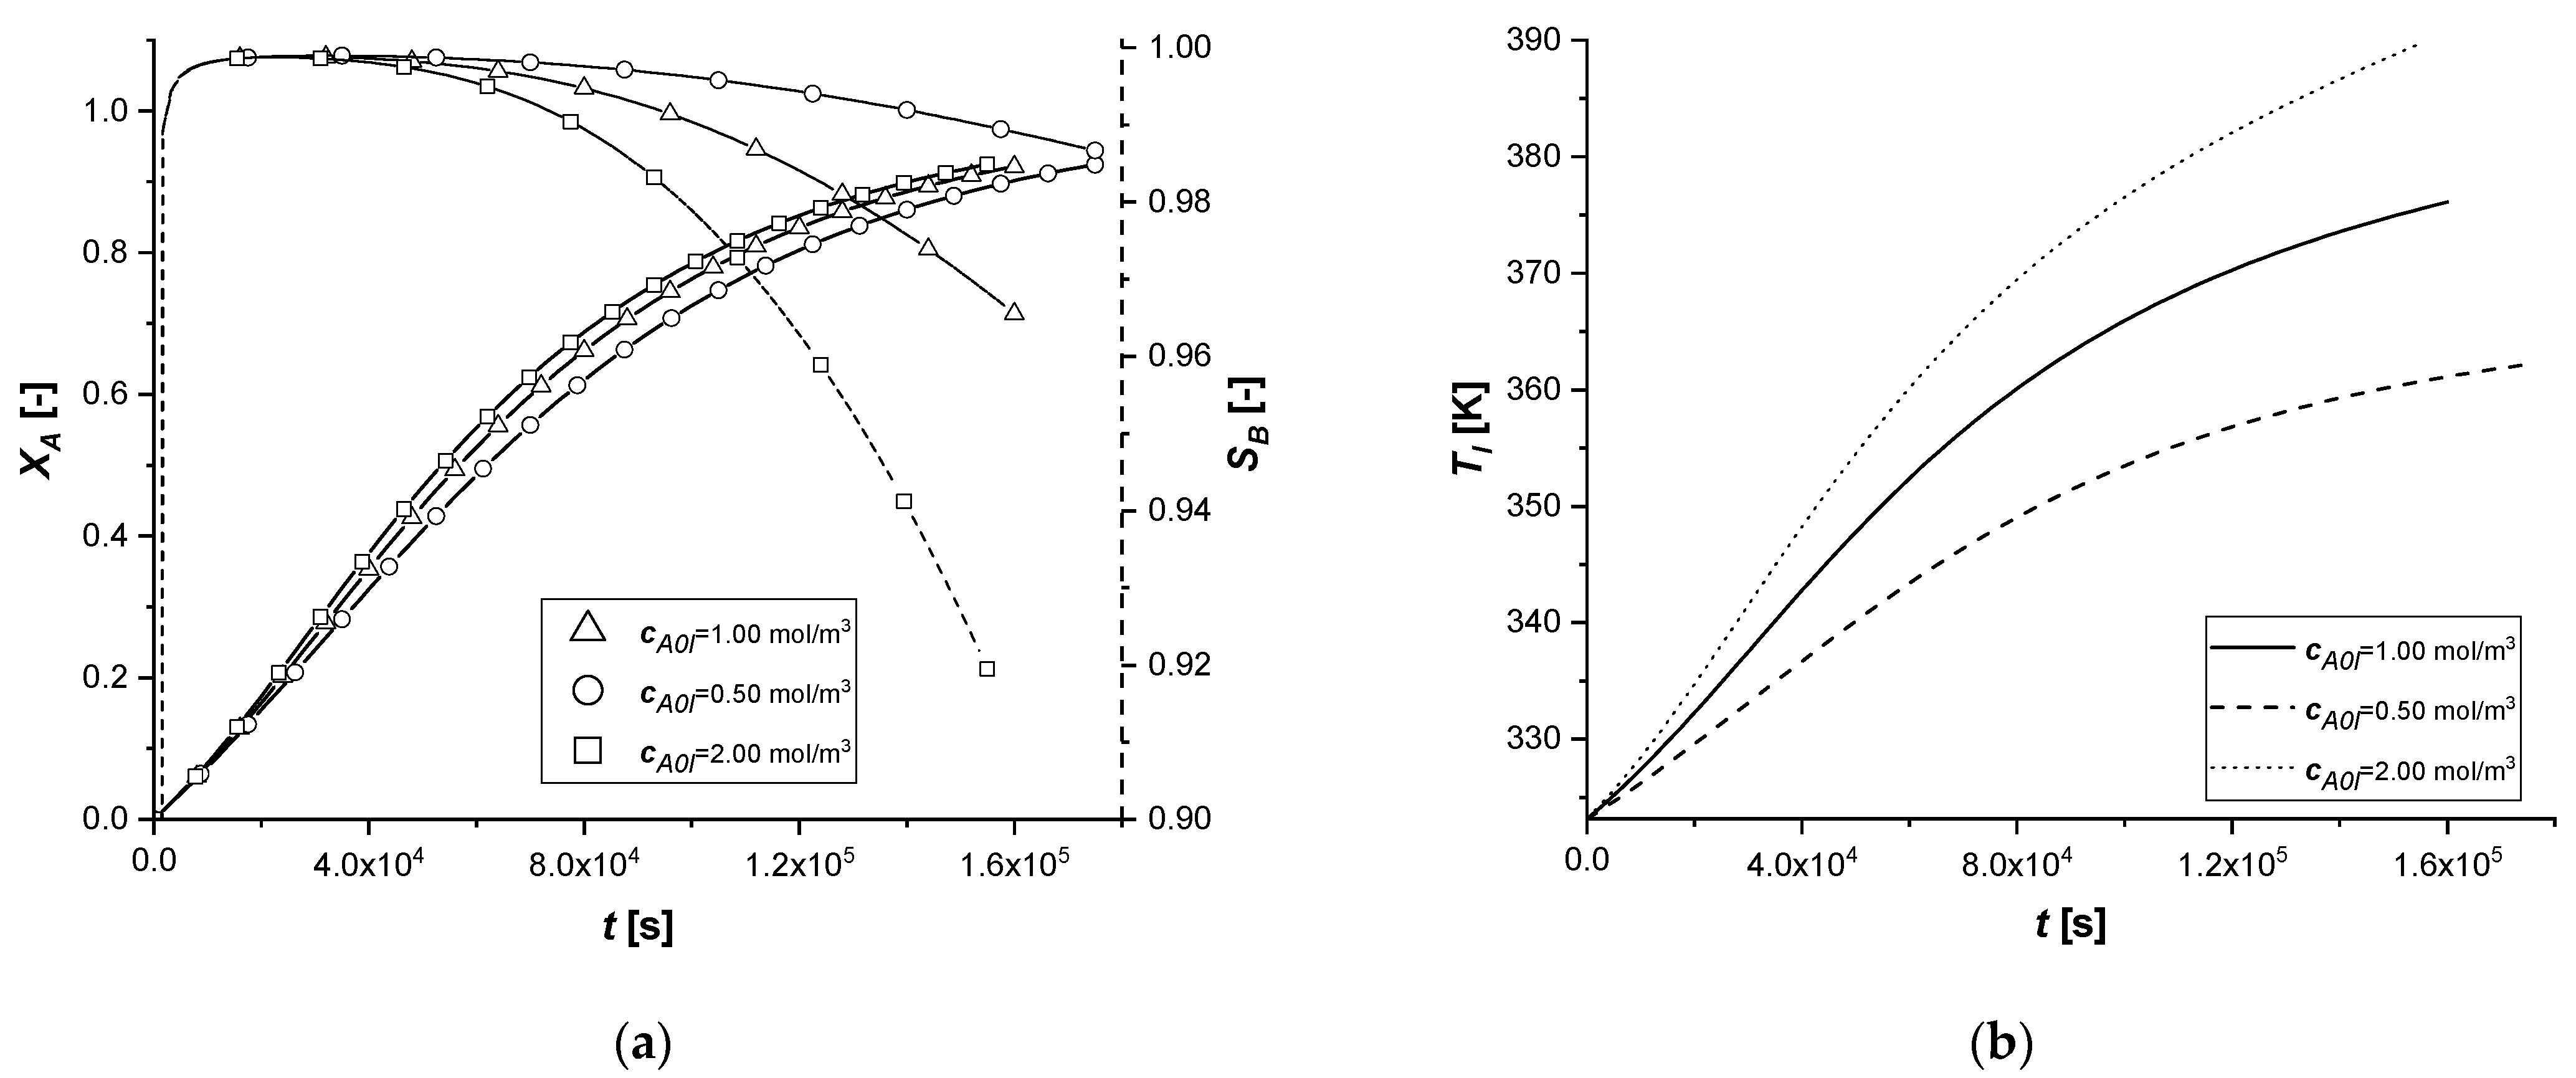
The change in the initial concentration of A in the liquid phase affects the model through the mass and energy balances.
In the absence of chemical reactions in the liquid phase, the parameter mainly influences the gradient at the liquid–solid interface.
Furthermore, for an exothermic reaction, the quantity of reactant available determines the amount of energy released during the reaction and consequently the operating temperature, which affects the main kinetic parameters.
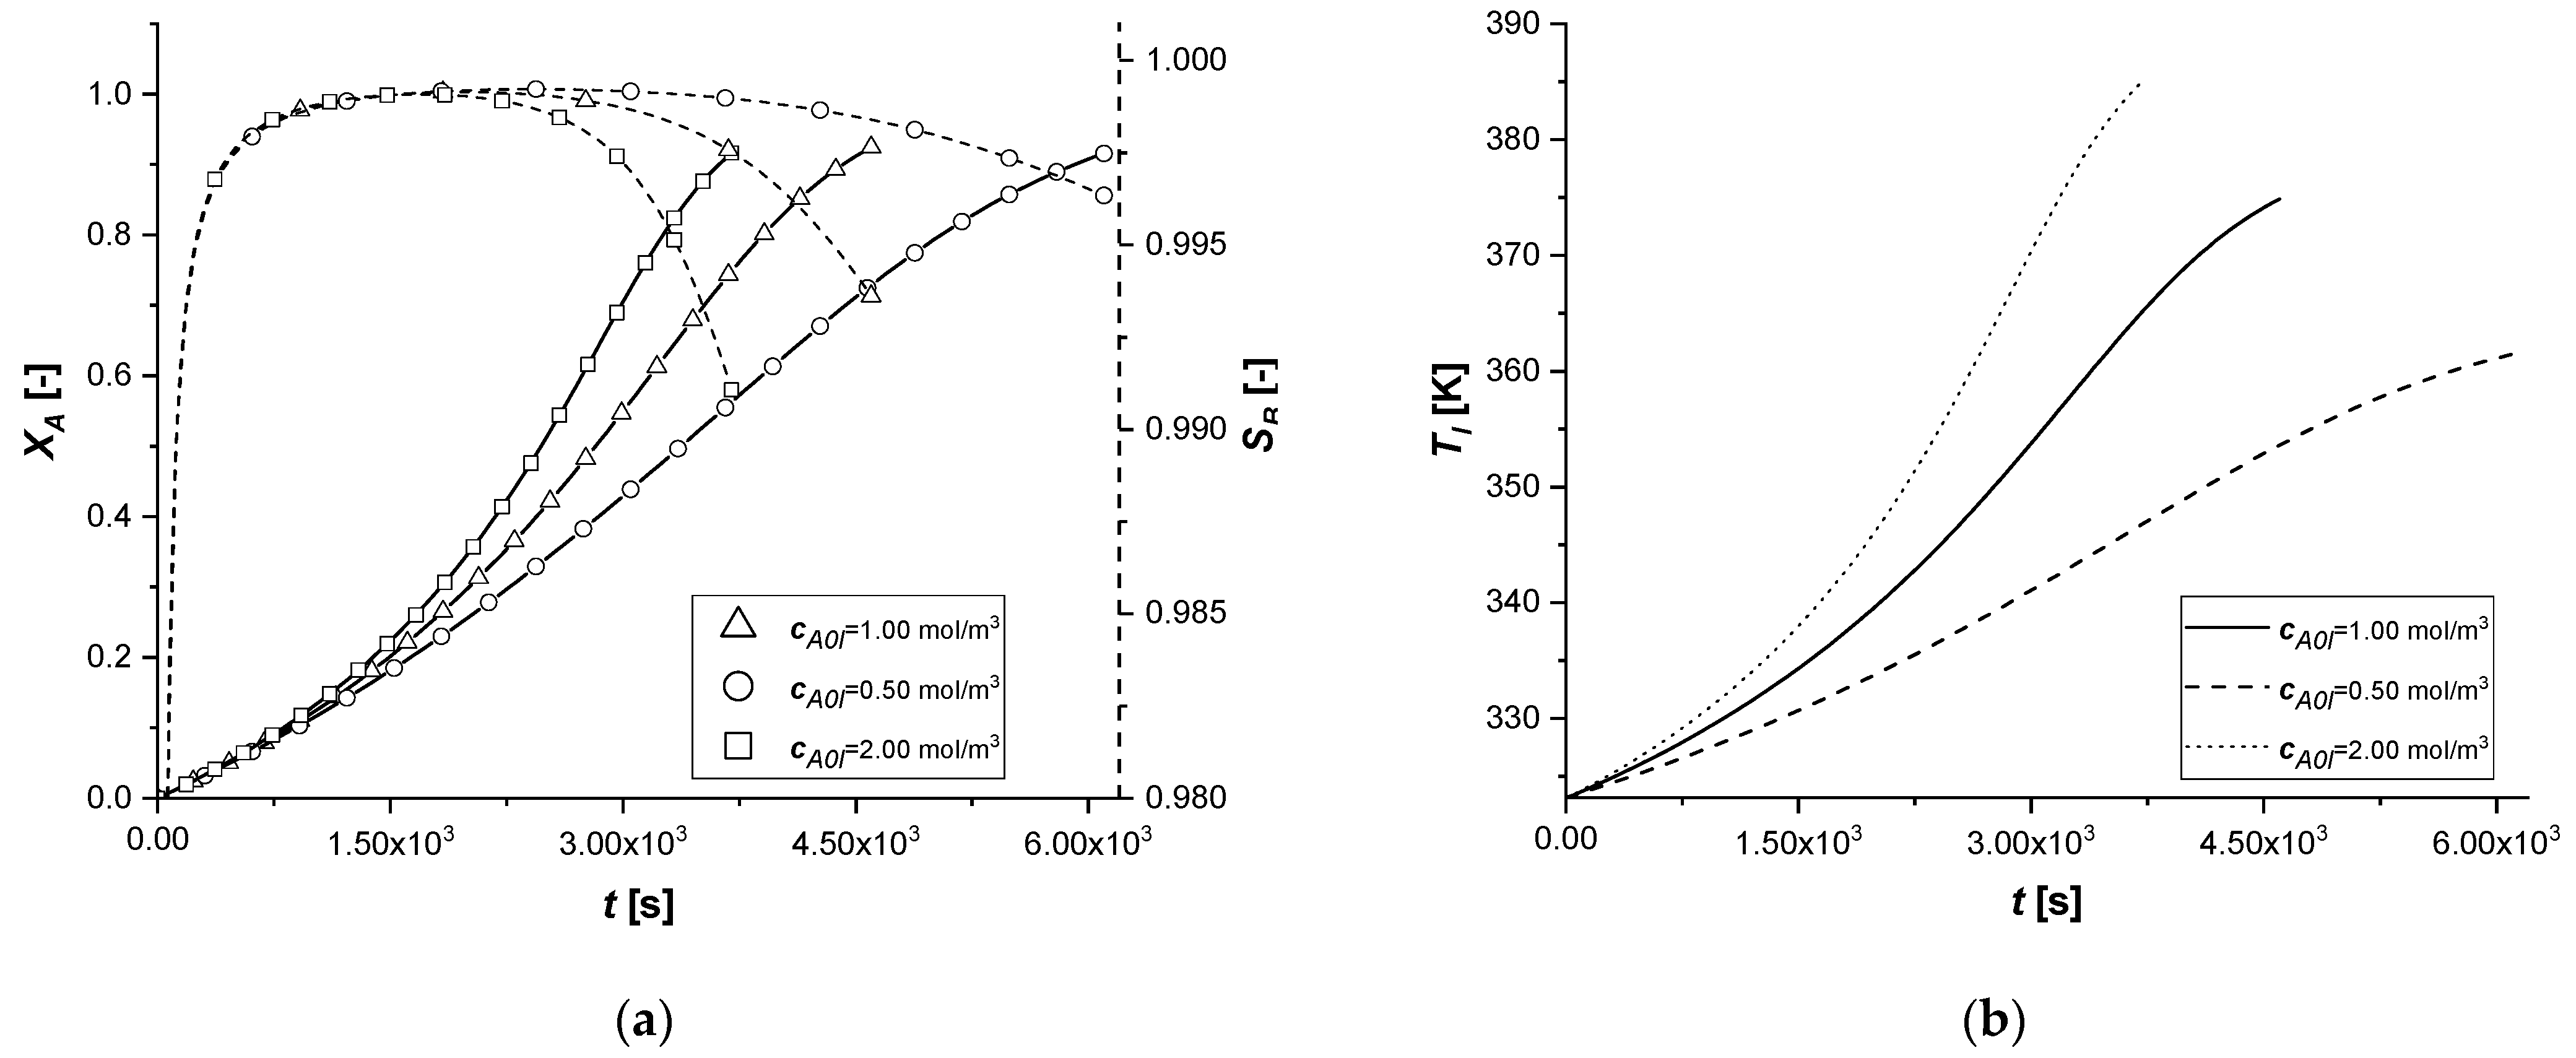
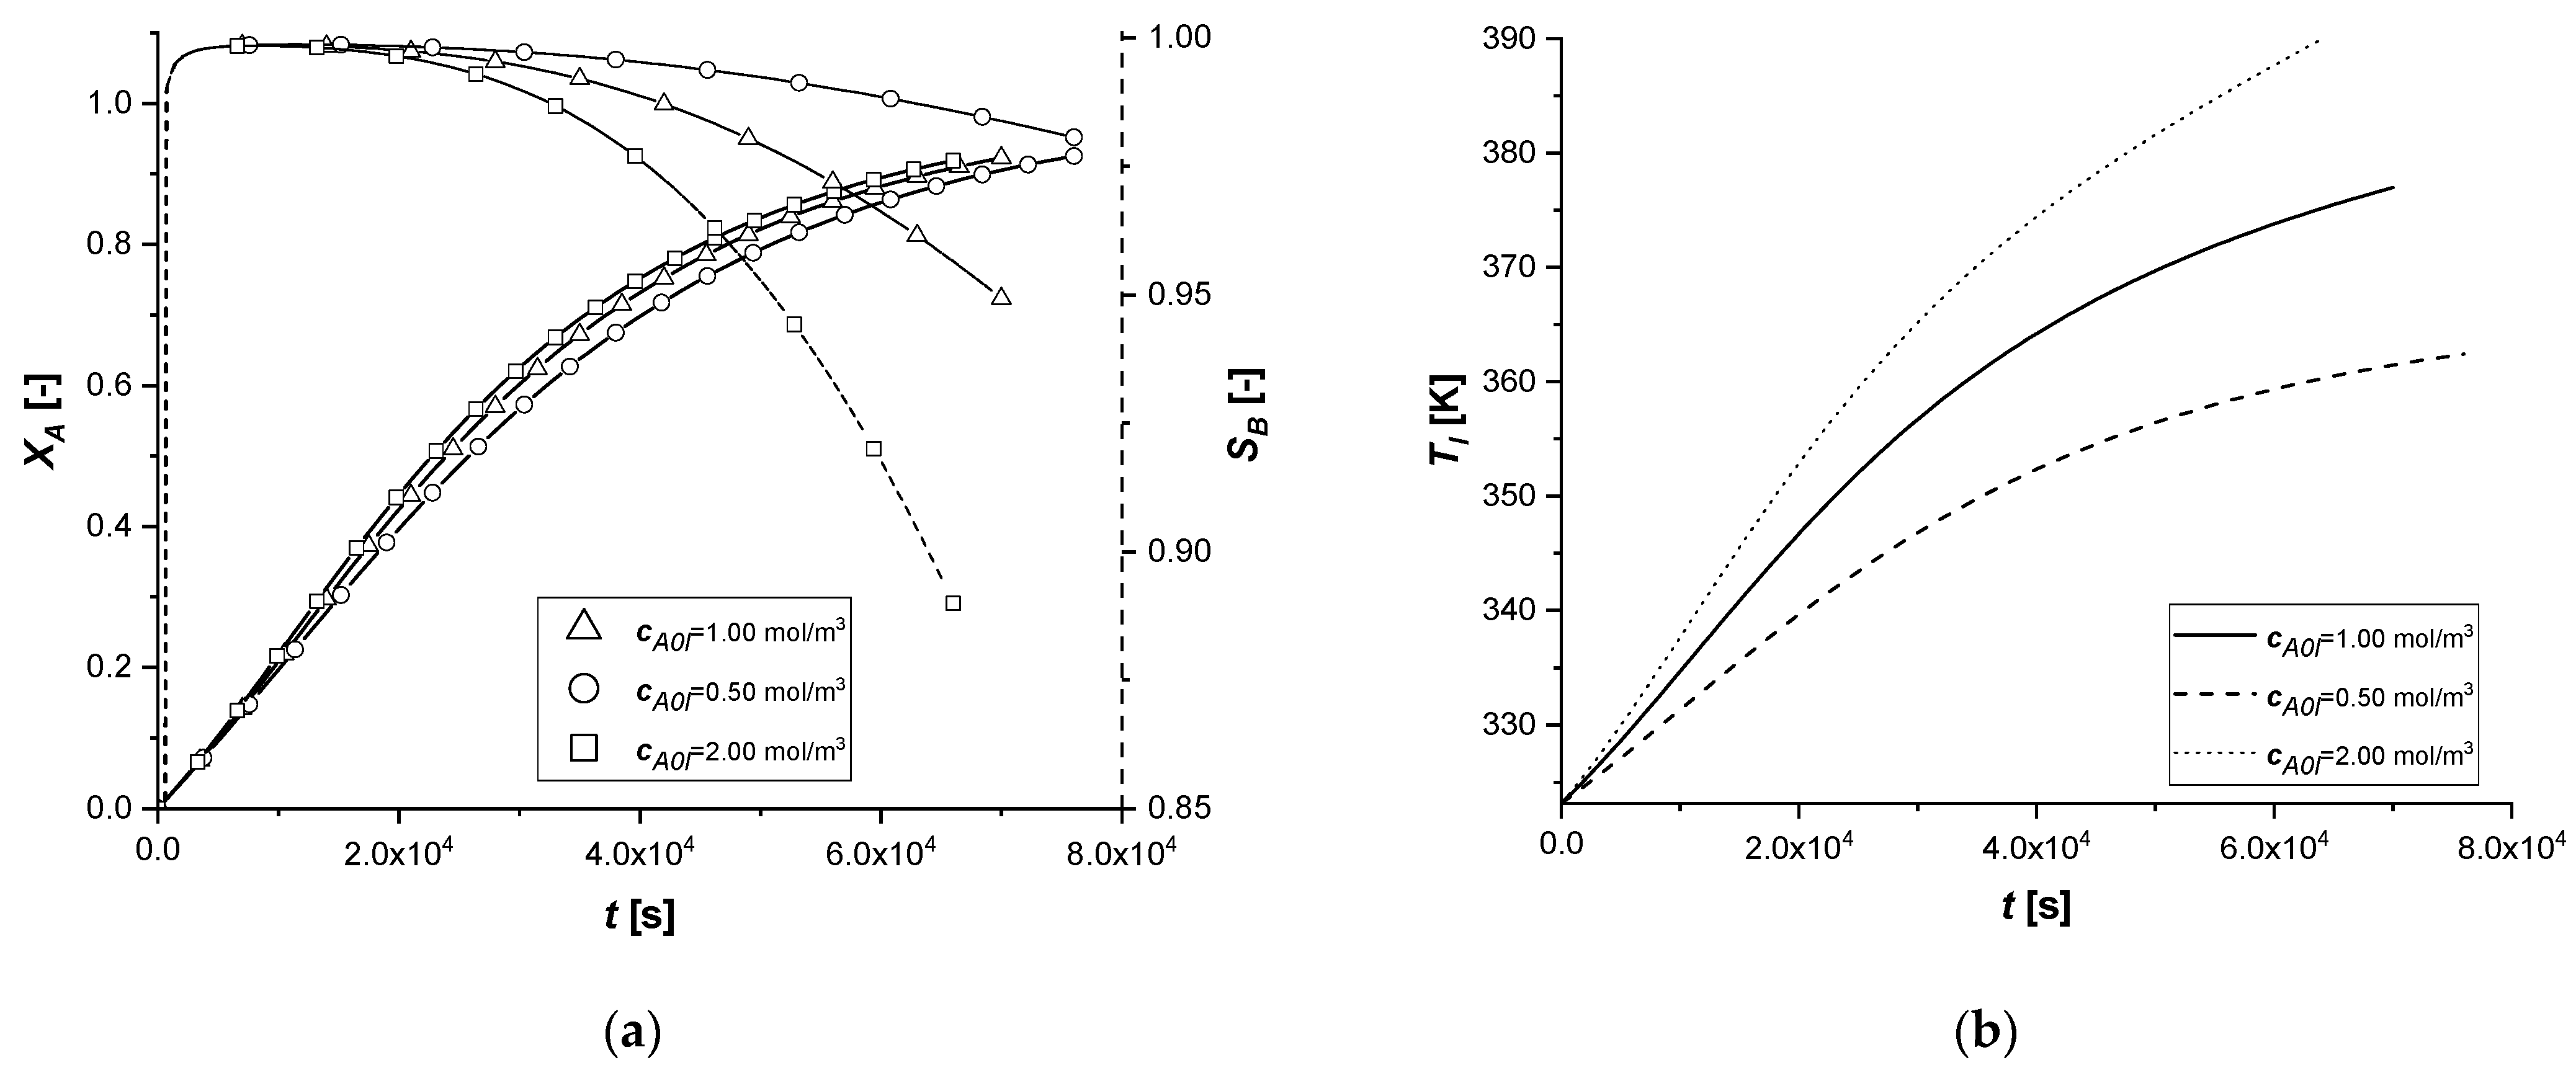
The results demonstrate how the chemical process behaves consistently with respect to the decrease or increase of the parameter cA0,l. In all the cases, the reaction times, for obtaining the desired conversion, are similarly decreasing moderately with the increment of the available reagent. ES is the catalytic case most influenced by the parameter, probably due to the immediate availability of the catalytic zone, unlike the other two cases.
Finally, it is interesting to notice, again in the case of the ES, how the slope of the intraparticle profiles of component A changes at the entrance to the solid (x = 1) due to the different concentration gradients at the interface.
3.2.7. Liquid–Solid Mass Transfer Coefficient
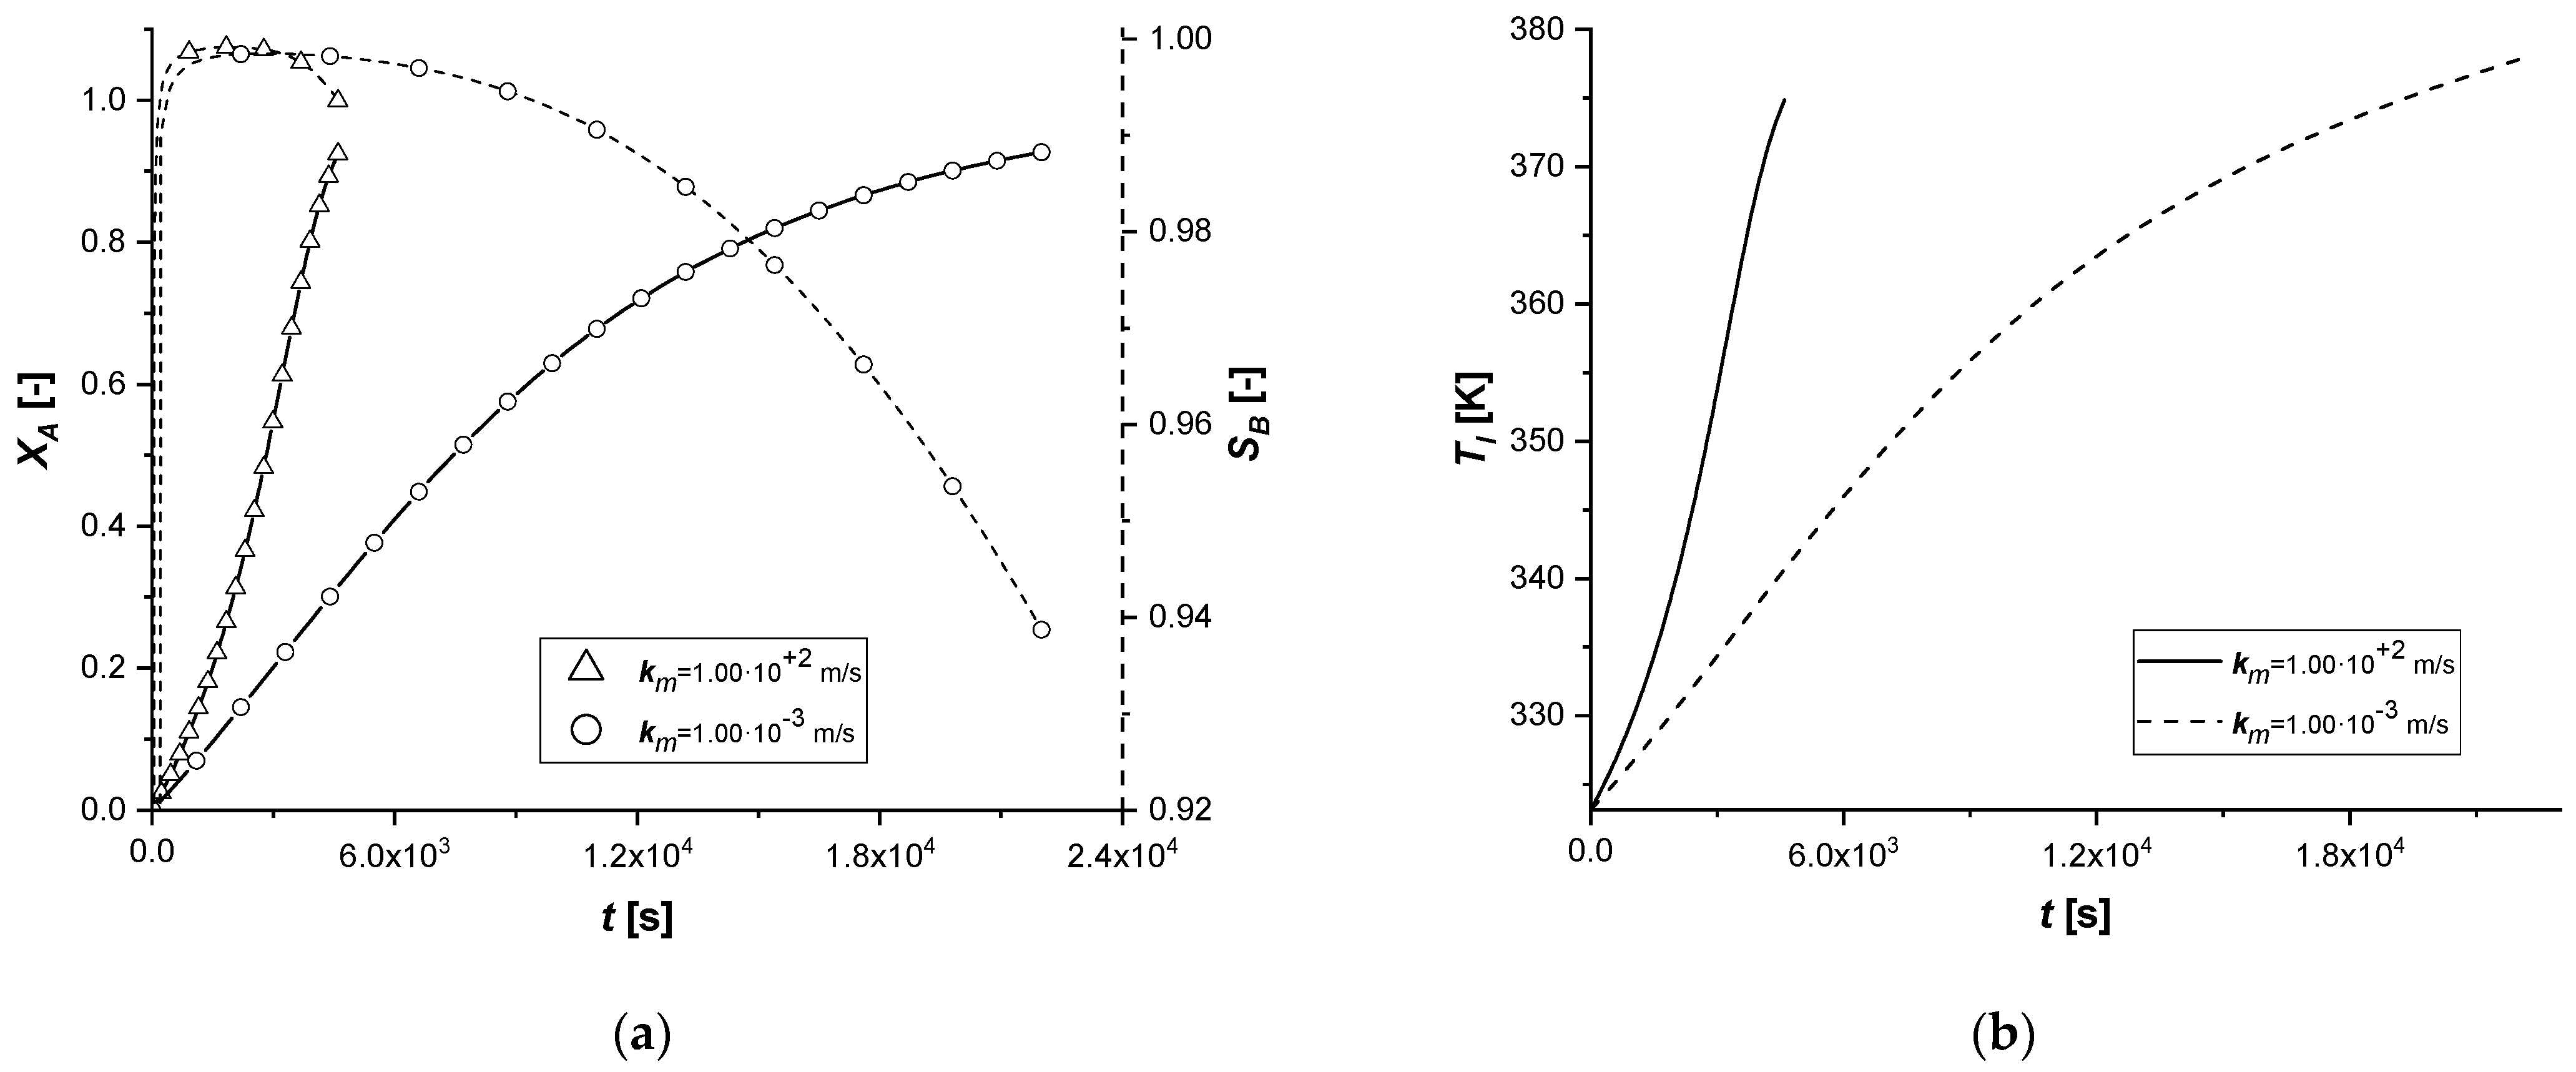
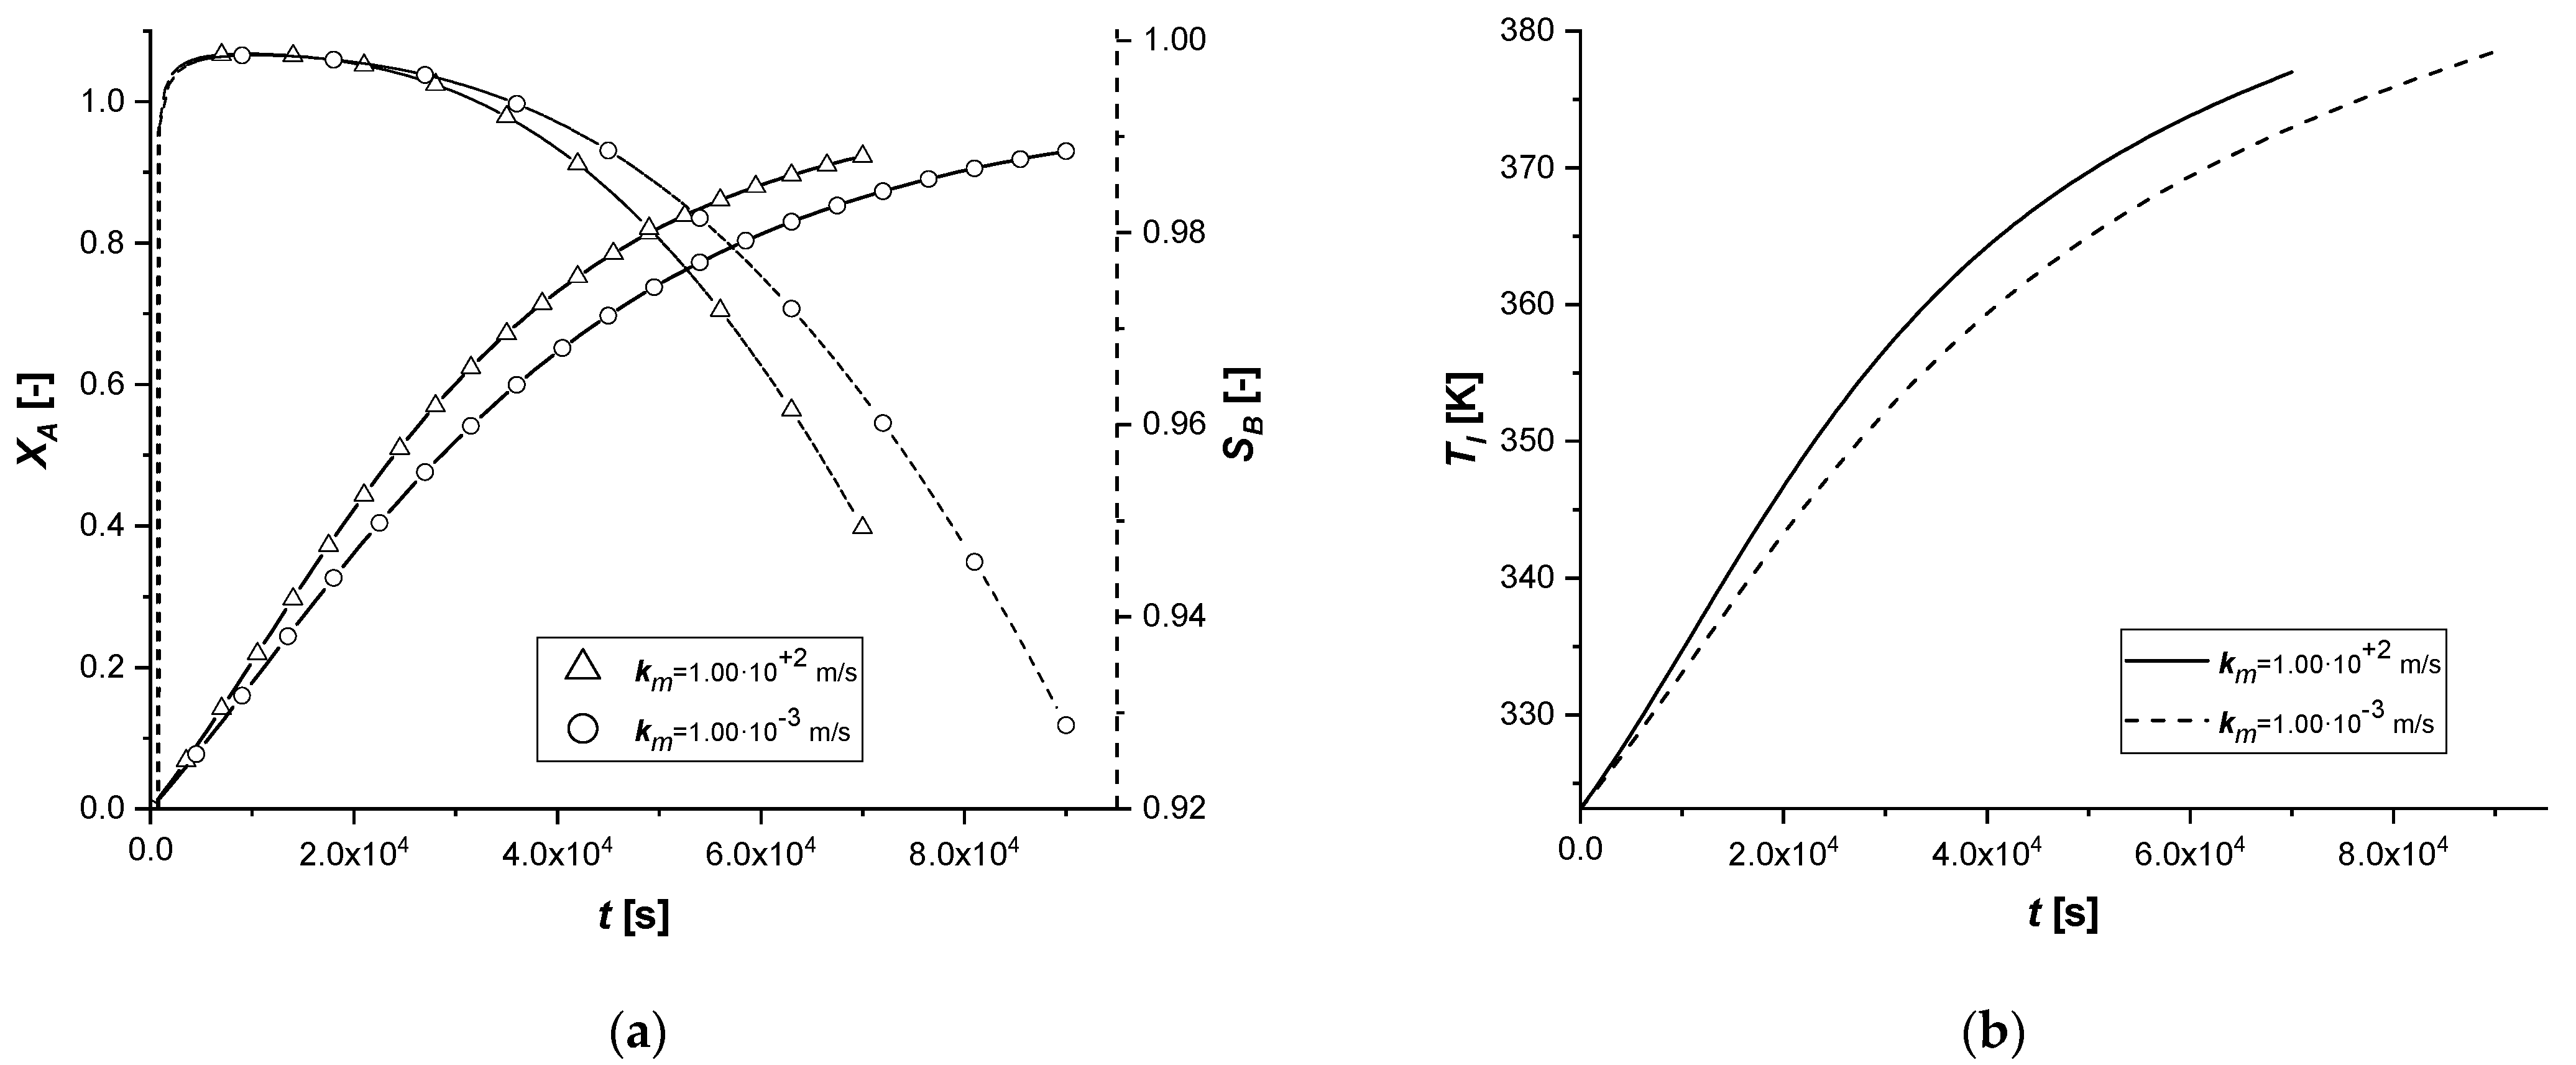
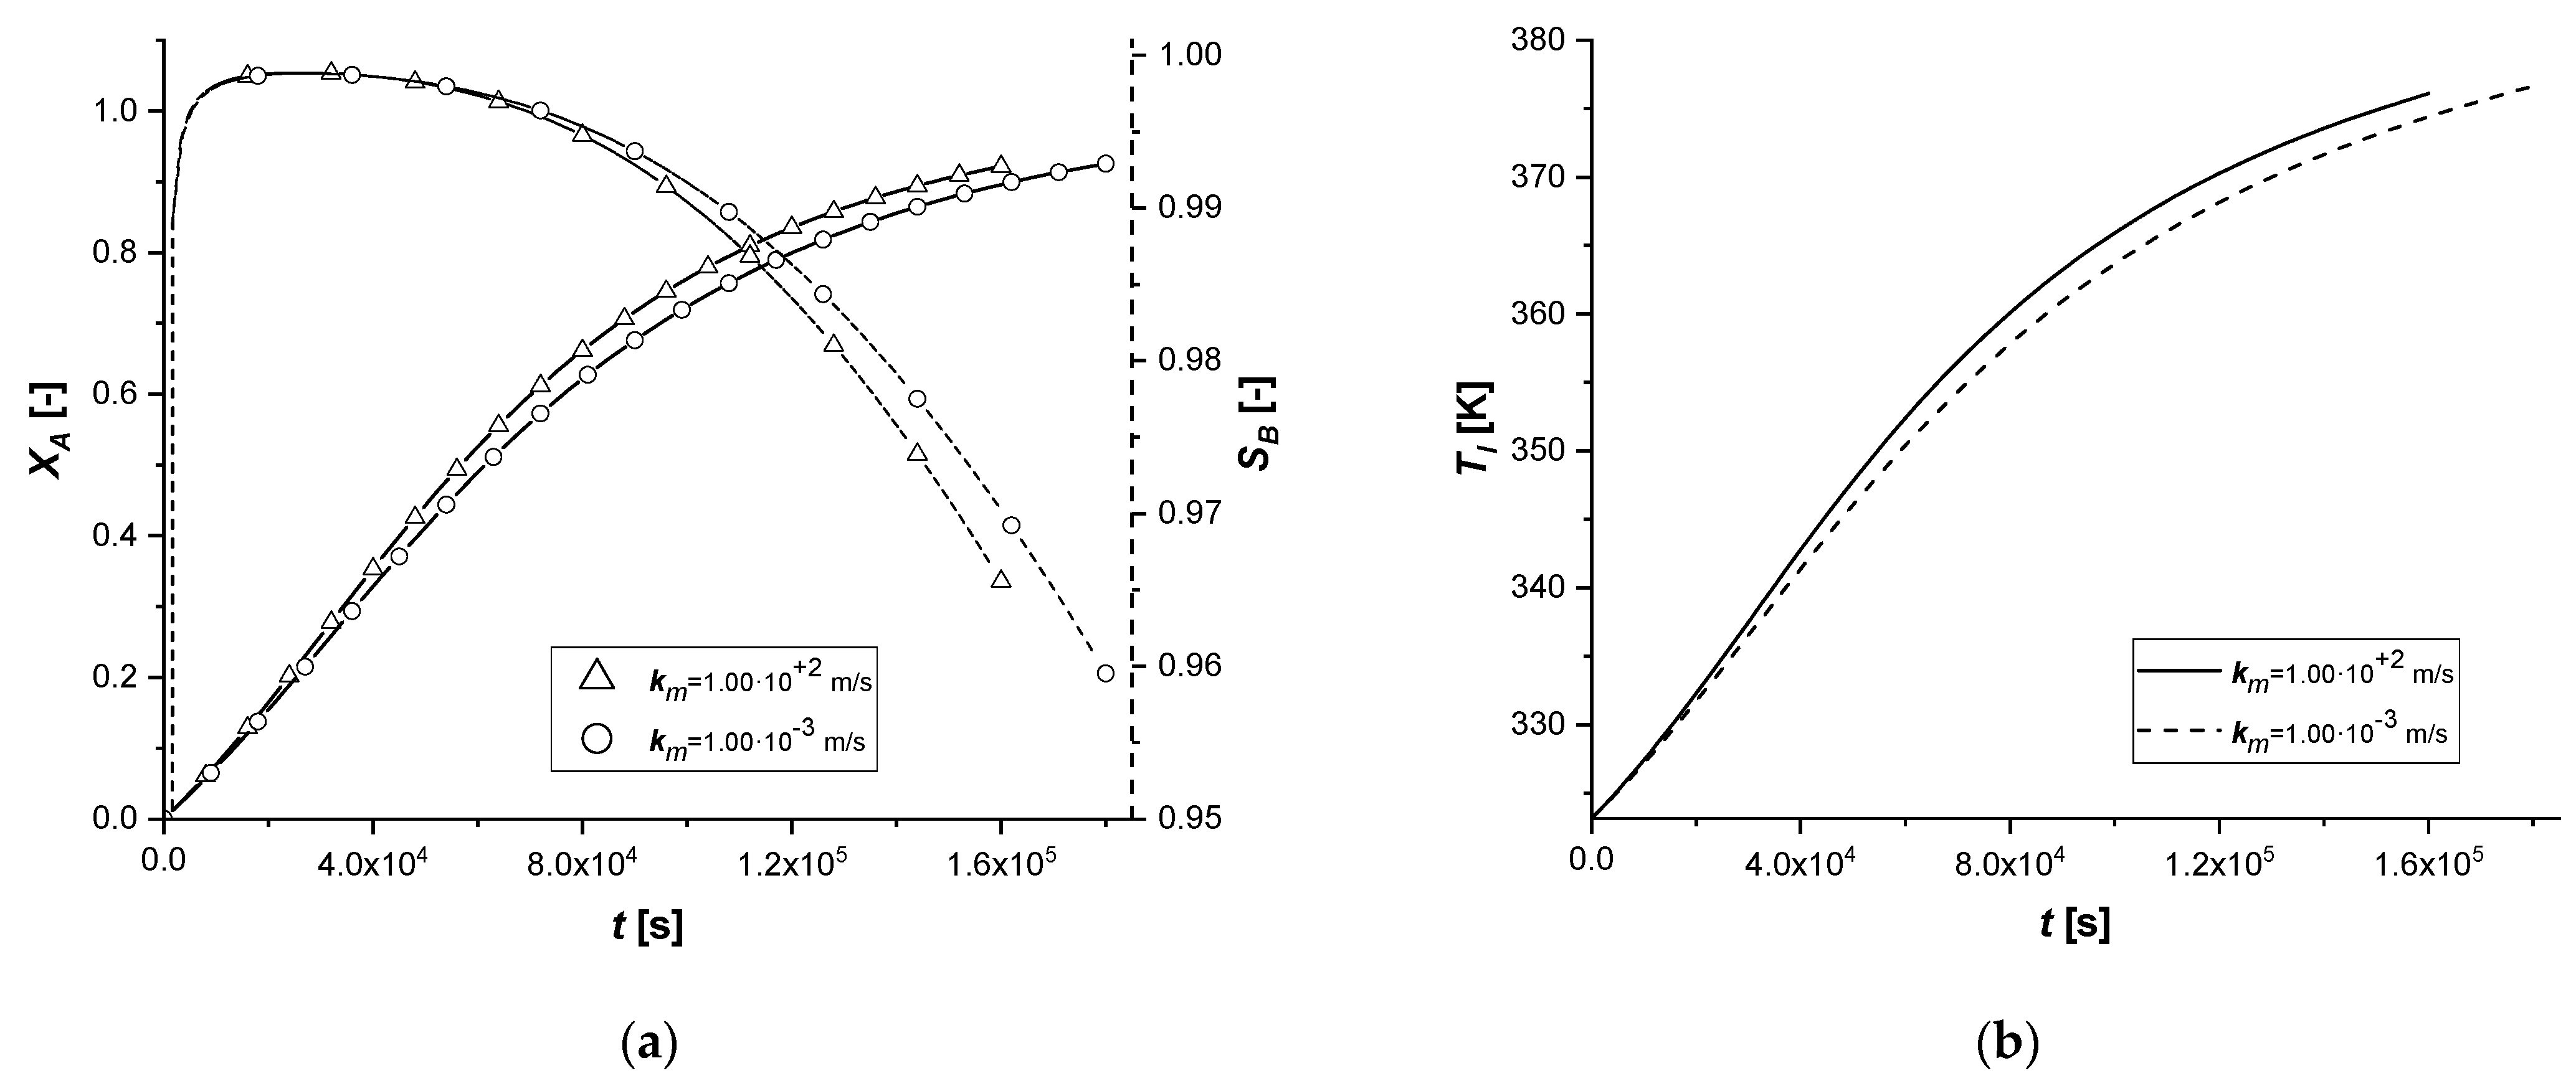
The liquid–solid mass transfer coefficient under standard conditions is sufficiently high to keep the external diffusion effects negligible. In this study, the response of the system was evaluated by assuming that the resistance to transport on the surface of the catalytic particle becomes influential in the reactive process.
From the comparison graphs, it is possible to observe that, by considerably reducing the numerical value of the parameter km, the influence on the ES catalyst seems to be more significant than in the other two cases.
In fact, if for EW and EY the limiting process remains the internal diffusive one, in the first catalytic case, extended reaction times are observed. Furthermore, for the first time, it is possible to observe for the ES a concentration cCl at the end of the reaction, comparable if not higher than the other two cases.
In order to avoid the increase of external diffusion resistance, it is advisable to use high stirring rates in batch reactors. It is known that as the stirring rate increases, the thickness of the film of stagnant liquid at the interface between the phases diminishes, suppressing the mass transfer resistance.
3.2.8. External Thermal Resistance
This parametric study was conducted by evaluating the response of the model in the presence of an energy exchange term with the external environment, simulating the dissipation of a part of the energy deriving from the chemical reaction.
The results confirm that the presence of an energy dissipative term causes a slowdown of all chemical processes, as a consequence of the lowering of the system temperature compared to the reference case.
In fact, the intraparticle concentration cAs profiles show a considerable accumulation of the reagent given the low reaction rates, which are functions of operation temperature. Finally, it is interesting to notice that when the desired conversion is achieved, the bulk concentration of the final product C is extremely low in all the cases.
