Article

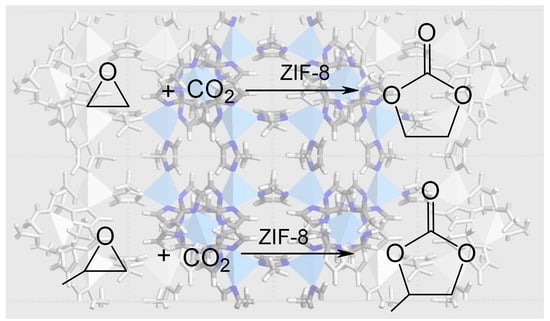
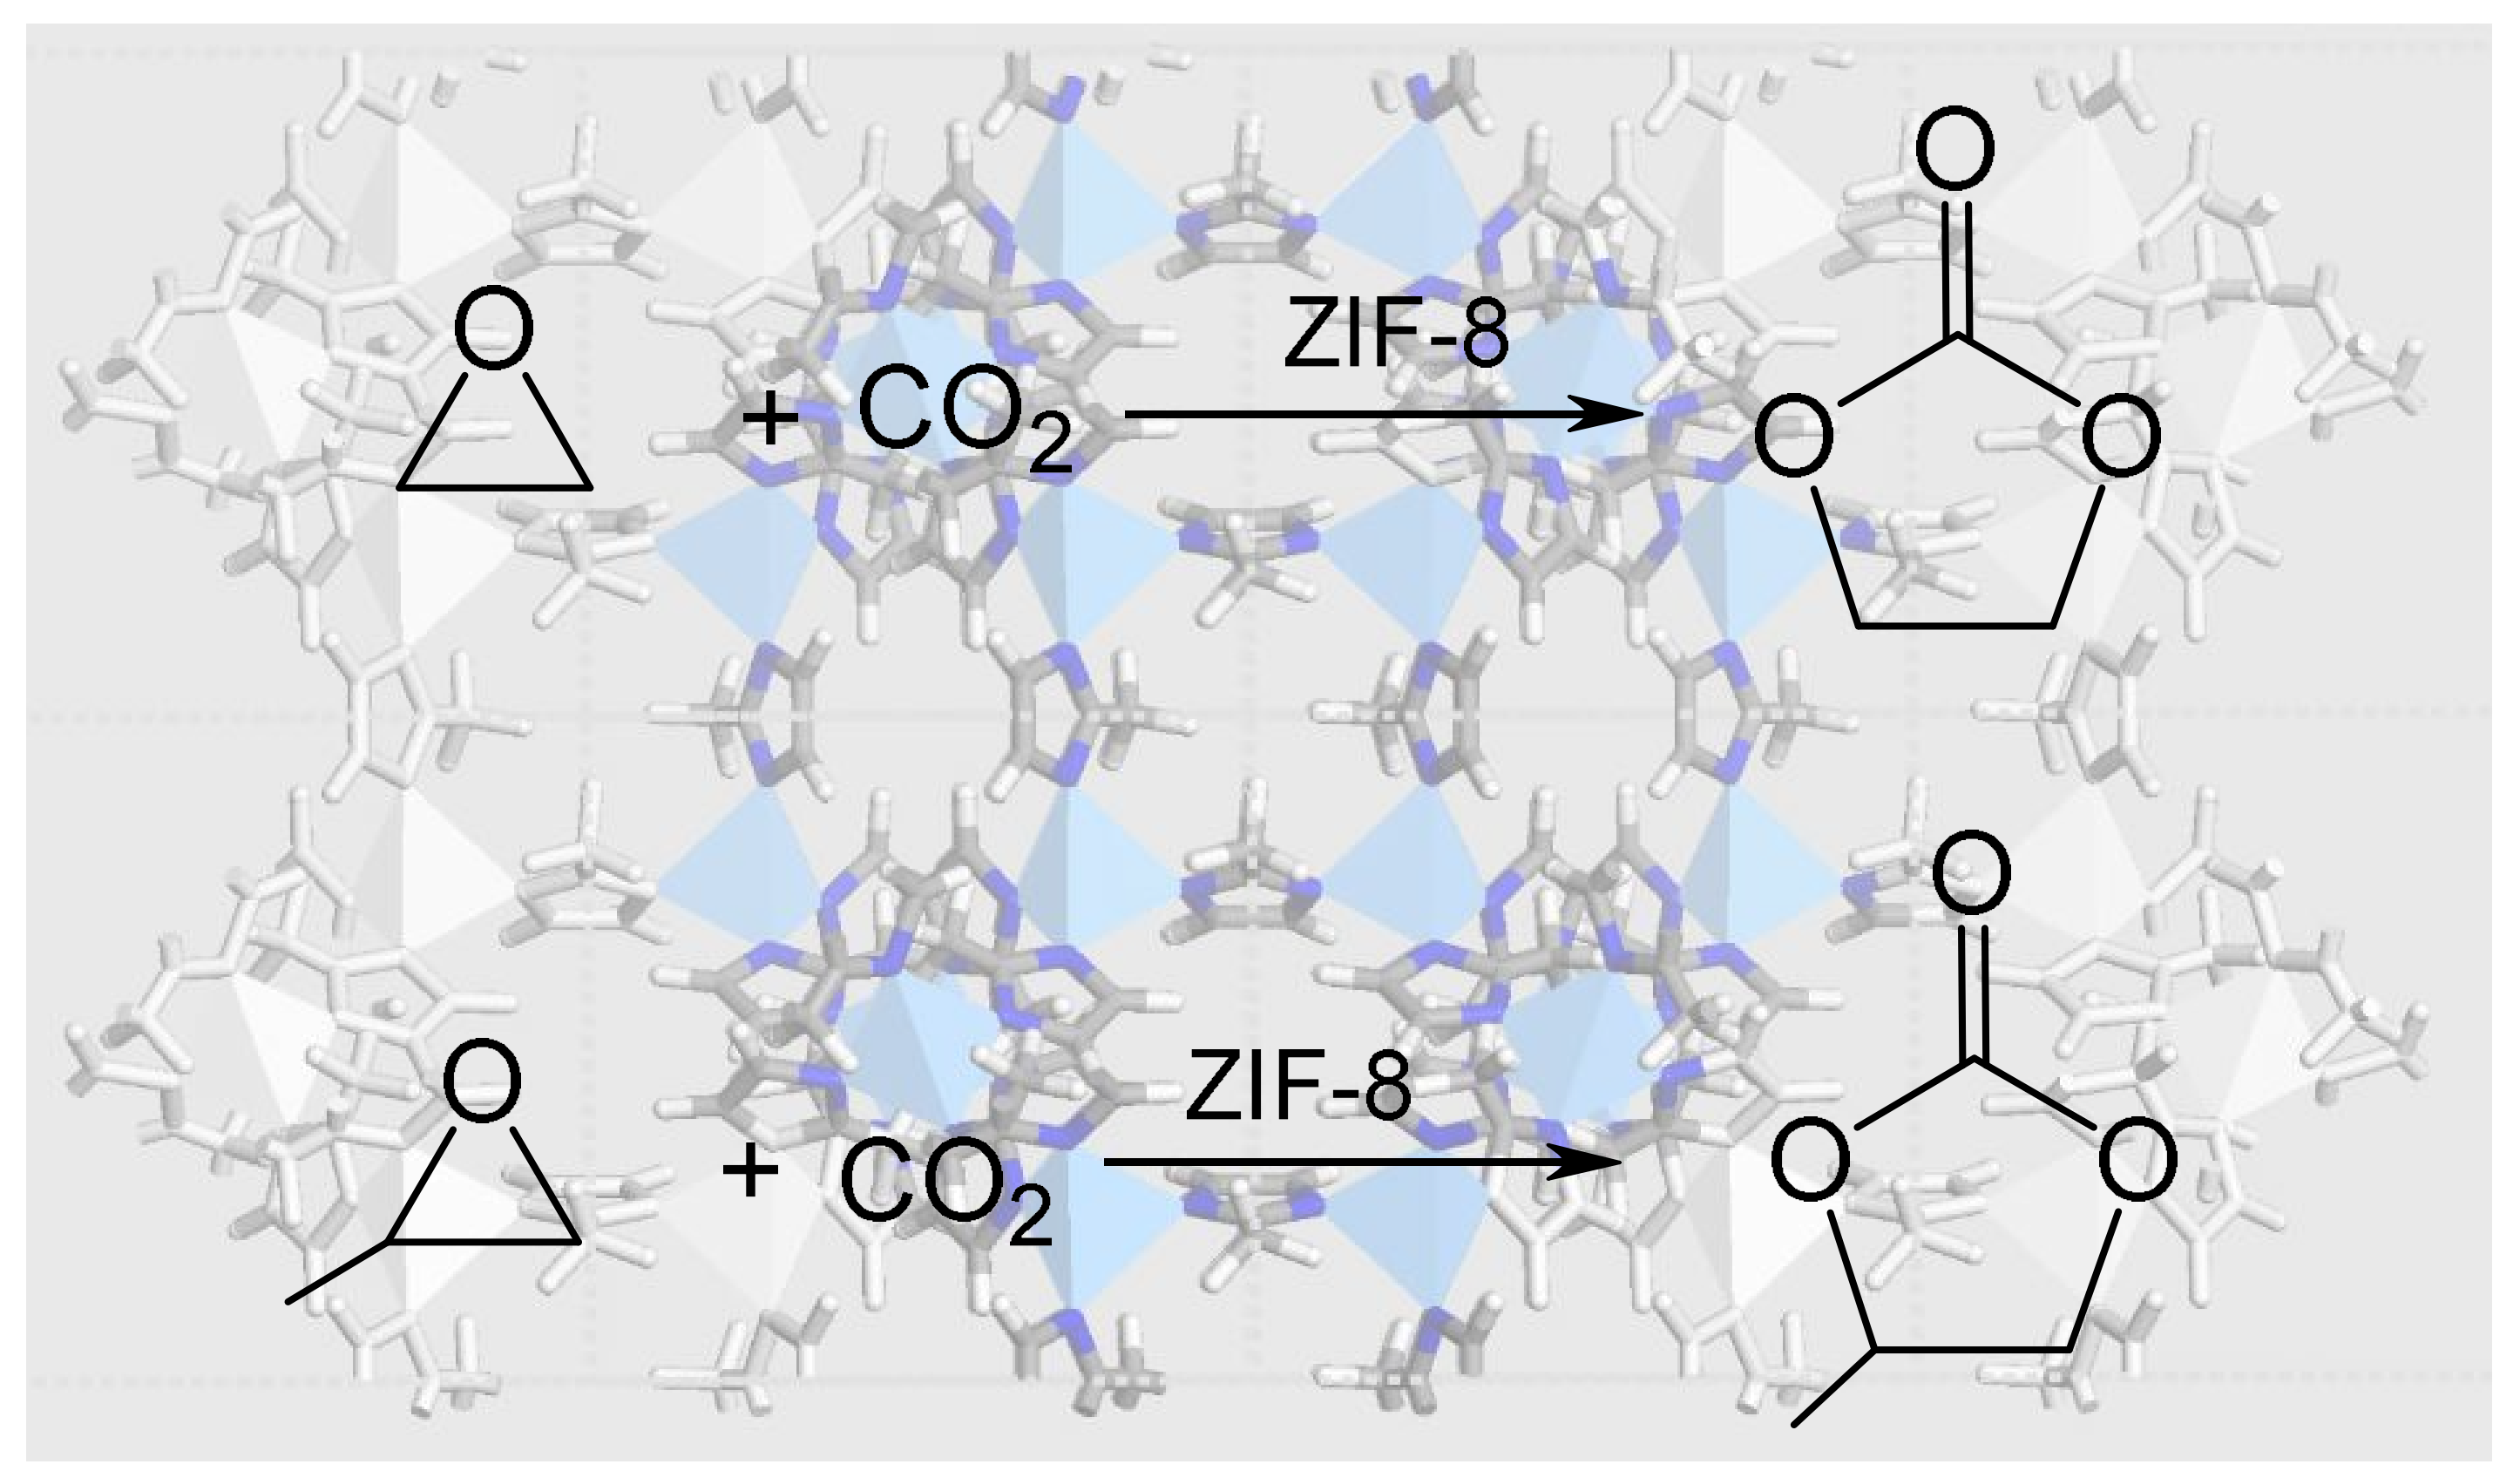
ZIF-8 as a Catalyst in Ethylene Oxide and Propylene Oxide Reaction with CO2 to Cyclic Organic Carbonates

by
Jenny G. Vitillo
1,*,
Valentina Crocellà
2 and
Francesca Bonino
2
1
Dipartimento di Scienza e Alta Tecnologia, Università dell’Insubria, Via Valleggio 9, 22100 Como, Italy
2
Dipartimento di Chimica, NIS e Centro di Riferimento INSTM, Università di Torino, Via G. Quarello 15, I-10135 and Via P. Giuria 7, I-10125 Torino, Italy
*
Author to whom correspondence should be addressed.
ChemEngineering 2019, 3(3), 60; https://doi.org/10.3390/chemengineering3030060
Submission received: 17 May 2019 / Revised: 7 June 2019 / Accepted: 28 June 2019 / Published: 2 July 2019
(This article belongs to the Special Issue CO2 Capture, Utilization, and Storage)

Abstract

:
CO2 is an important by-product in epoxides synthesis, accounting for 0.02% of worldwide greenhouse emissions. The CO2 cycloaddition to ethylene and propylene oxides is an important class of reactions due to the versatile nature of the corresponding organic carbonates as chemical feedstocks. We report that these reactions can be catalyzed by ZIF-8 (Zeolitic Imidazole Framework-8) in the absence of solvent or co-catalyst and in mild conditions (40 °C and 750 mbar). In situ infrared spectroscopy places the onset time for ethylene and propylene carbonate formation to 80 and 30 min, respectively. Although there is low catalytic activity, these findings suggest the possibility to cut the CO2 emissions from epoxides production through their direct conversion to these highly valuable chemical intermediates, eliminating de facto energetically demanding steps as the CO2 capture and storage.

Graphical Abstract

1. Introduction

Strategies for the mitigation of climate change effects require the implementation of processes aimed to attenuate anthropogenic CO2 emissions, estimated to 36.2 Gt year−1, in 2015 [1]. The artificial CO2 cycle aimed to tackle this issue starts with the capture of carbon dioxide and ends alternatively with CO2 sequestration or reuse. The CO2 reuse is evidently the preferable option allowing, where possible, the compensation of the cost paid for the capture step, the most energetically demanding of the whole cycle. Accordingly, several reactions have been proposed in the literature involving CO2 as feedstock [2,3,4,5,6] or as reaction medium [7]. Unfortunately, most of them require a high purity CO2, further increasing the cost of the separation process [5,8]. In this view, the advantages to coupling in a single step the separation and recycling of CO2 are evident [9,10]. Cyclic organic carbonates are important solvents and chemical reagents [11]. Their traditional synthesis involves phosgene, with consequent concerns on safety. A green alternative protocol considers the cycloaddition of CO2 to oxiranes [5,12] that allows the production of organic carbonates, in monomeric (see Scheme 1) or polymeric form [13,14], with the advantages of safer reagents and of the CO2 reuse. Several catalytic systems have been reported to operate in this sense at CO2 partial pressure of 1 bar; additionally, the reaction rates are enhanced at higher pressures [13,14]. The greener synthesis of organic carbonates is already implemented industrially, although it accounts for a few percent of their global production [12,15]. Beside the interest in the synthesis of organic carbonates, that are versatile and valuable chemical products, the reaction of CO2 with oxiranes is particularly appealing because CO2 is always present as by-product in the epoxide syntheses. For example, an 8% in volume of CO2 is produced in the synthesis of ethylene oxide, accounting for 0.02% of total CO2 emissions (3 Mt CO2 year−1) [3]. Electroreduction synthesis of epoxides was very recently proved to be CO2-free [16] but this technology is only at its early stages. Among the catalysts reported for CO2 epoxidation, Zn-based catalysts are the most efficient ones, among the homogeneous [14] and the heterogeneous catalysts [17]. In most of the cases, mild temperatures but high CO2 pressures (> 10 bar) are required [14]. Another interesting class of systems active in the carbonation of epoxides is that of the imidazolium-based ionic liquids, both in their liquid and polymeric form [18,19,20,21], that have been shown to catalyze the reaction at 40 °C and pressures as low as 200 mbar. It is evident that materials that are also good CO2 separators would be particularly appealing as catalysts, because they can also act as CO2 concentrators [13,22].
Metal-organic frameworks (MOFs) are a class of materials having the hallmark of a great flexibility in design. They have a modular structure composed by inorganic (oxidic or metallic) nodes connected through organic molecules. Modulation of their chemical and structural properties is then achieved straightforwardly through an appropriate choice of the building units allowing tailoring a material for a specific use. Zeolitic Imidazole Framework-8 (ZIF-8) is a metal organic framework which structure is constituted by zinc atoms (light blue tetrahedra in Figure 1a,c), each of them coordinated to four 2-methylimidazoles in a tetrahedral symmetry [23]. Each vertex of the tetrahedron is occupied by one N atom of a different 2-methylimidazole molecule, each 2-methylimidazole being shared between two Zn atoms. The resulting structure is topologically equivalent to sodalite (Figure 1b) although having a decidedly higher surface area than its inorganic analogous (1800 vs. ~ 50 m2 g−1, [23]) due to the larger Zn-Zn distance compared to the Si-Si one. The hybrid organic-inorganic sodalite cages are characterized by spherical pores of about 14 Å diameter, accessible through six 4-member and six 6-member ring openings of 2.4 and 5.7 Å, respectively (crystallographic distances, see Figure A1 for a view of the 6-rings). ZIF-8 has been reported to possess an exceptional chemical and thermal stability [23,24] being able to maintain its porosity and crystallinity in boiling water, in the presence of aggressive chemical reagents (e.g. H2S, [25]) and in steam up to 400 °C [26].
Many MOFs have been reported to be able to catalyze the CO2 cycloaddition to ethylene oxide and propylene oxide in the presence of cocatalysts or solvents [12]. ZIF-8 has proven to be an efficient catalyst for many reactions, such as the Knoevenagel reaction [28], transesterification of vegetable oil [29], and Friedel-Crafts acylation [30]. ZIF-8 has been reported to be suitable for both CO2 separation and catalysis as well [13,31,32,33,34]. For what concerns the last point, ZIF-8 has recently been reported to catalyze the carbonation of epichlorohydrin to chloropropene carbonate [33] and the carbonation of styrene oxide to styrene carbonate [34], in the absence of a co-catalyst or solvents, unlike other MOFs [13,35,36]. Recently, a carbon derived from ZIF-8 has been proved to catalyze the CO2 reaction with propylene oxide [37] but ZIF-8 catalytic activity for the carbonation of ethylene and propylene oxides, although their larger importance, has never been tested before. In this study, we have employed infrared spectroscopy to check the feasibility of the reactions between CO2 and ethylene oxide (hereafter, EtO) and CO2 and propylene oxide (hereafter, PrO) on ZIF-8 at 40 °C and subatmospheric pressures without cocatalysts or solvents. The regeneration of the catalyst after its use has been tested by infrared (IR) spectroscopy and X-ray diffraction (XRD). Kohn Sham density functional methods (KS-DFT) have been also employed to provide an estimate of the relative adsorption enthalpy on ZIF-8 of CO2, ethylene oxide, propylene oxide, ethylene carbonate (EtC), and propylene carbonate (PrC).

2. Materials and Methods

Materials. ZIF-8 was purchased from Sigma Aldrich (Basolite® Z1200, catalog n. 691348-10G, 2-methylimidazole zinc salt, Empirical Formula C8H12N4Zn) and, for scruples, stored in inert atmosphere (M Braun Lab Star Glove Box supplied with pure 5.5 grade Nitrogen, <0.5 ppm O2, <0.5 ppm H2O). Ethylene oxide (3.0 grade, Union Carbide), propylene oxide (≥99.5%, Sigma Aldrich), and carbon dioxide (4.6 grade, Praxair) were dosed from the gas phase and used as received without further purification. Before any reaction, ZIF-8 was previously activated by outgassing at 300 °C for 3 h on a glass vacuum line (final pressure < 10−4 mbar).
Fourier transform infrared (FTIR) spectroscopy. In situ FTIR spectra in transmission mode (2 cm-1 resolution, average on 256 scans) were collected on a Bruker Vertex70 spectrophotometer. The samples were measured in the form of self-supporting pellets (~4 mg, 1.8 cm2) inside a quartz cell in controlled atmosphere. The background was collected before each spectrum, because small changes in the rotovibrational spectrum of water can affect the intensity of the carbonate band at 1800 cm-1. The pressure was measured using an absolute pressure transducer (Oerlikon Leybold Vacuum, TTR-101).
Powder XRD measurements. Powder X-ray diffraction measurements were performed in the 2θ range 2°–90° (step size of 0.017°, time per step 200 s) in Debye-Scherrer geometry using a laboratory diffractometer (Panalytical X’Pert Pro Multipurpose Diffractometer) having as a source a high powdered ceramic tube PW3373/10 LFF with a Cu anode equipped with a Ni filter to attenuate Kβ and focused by a PW3152/63 X-ray mirror. The incident beam was collimated using a Soller slit (0.04 rad), an antiscatter slit (1/2 Å) and a divergence slit (1/2 Å); for the diffracted beam an antiscatter slit (AS Slit 5.0 mm, X’Celerator) and a Soller slit (0.04 rad) were adopted. Samples were sealed into boron silica glass capillaries of 0.8 mm internal diameter in a protected atmosphere and mounted on a rotating goniometer head.
Volumetry. Nitrogen adsorption isotherms were measured on a commercial volumetric apparatus (Micromeritics, ASAP 2020) at 77 K. Prior measurement, the powders were degassed at 300 °C on a vacuum line equipped with a turbomolecular pump and then the samples were transferred to the measurement cell in a glove box. The specific surface area was obtained by using the BET (Brunauer–Emmett–Teller) [38] and Langmuir approximations [39,40] in the standard pressure range (0.05 < p/p0 < 0.20). We are aware that the BET method, unlike the Langmuir method, is not suitable to estimate the area of microporous materials (negative BET constant values in the standard pressure range). However, the BET values have been reported because sometimes adopted in the literature of the subject. The micropore volume has been evaluated with the t-plot method adopting the Harkins and Jura equation of thickness in the 0.15 < p/p0 < 0.50 range [39]. All the reported quantities are affected by an error of 10%.
Kohn Sham density functional calculations. The electrostatic potential map on the ZIF-8 periodic structure was obtained using the coordinates reported in Ref. [27] by single point calculation using the Becke’s exchange functional and the Lee, Yang and Parr correlation functional (BLYP) in combination with double-ζ plus polarization function basis sets (DNP) with the DMol3 program (as embedded in Materials Studio 6.0, Accelerys Inc. [41]).
The interaction of CO2, EtO, PrO, EtC, and PrC with ZIF-8 was simulated using a cluster approach (see Figure 2). The geometries were optimized using the Becke’s three-parameters hybrid exchange functional [42] supplemented with the Lee, Yang and Parr’s gradient-corrected correlation functional [43] (B3LYP) as implemented in Gaussian 09 [44], including the D3 version of Grimme’s dispersion (D3) with the Becke–Johnson damping (BJ) [45]. All the elements have been modeled by means of the fully optimized triple-ζ valence basis sets proposed by Ahlrichs et al. [46] with polarization (TZVp). Geometry optimization has been carried out by means of the Berny optimization algorithm with analytical gradient using the default thresholds (0.000450 and 0.000300 a.u. for the maximum and the rms forces respectively; and to 0.001800 and 0.001200 a.u. for the maximum and rms atomic displacements, respectively). A (99,590) pruned grid was used (i.e. 99 radial points and 590 angular points per radial point). No symmetry constraints have been imposed. During the optimization, the position of some atoms was maintained fixed to that reported in Ref. [27] and in particular that of each N directly linked with the Zn center and that of the farthest C atom from Zn on the same ring. The geometries of all the optimized clusters are reported in the Supplementary Materials in Cartesian coordinates.
Harmonic frequencies have been obtained by analytically determining the second derivatives of the energy with respect to the Cartesian nuclear coordinates and then transforming them to mass-weighted coordinates. No scaling factor has been adopted. Enthalpies and free Gibbs energies were computed at 25 °C and 1 bar in the harmonic approximation using the default settings in Gaussian 09.
All the energetic data have been corrected for the basis set superposition error (BSSE) following the a posteriori method proposed by Boys and Bernardi [47] as implemented in the program. The BSSE corrected energetic values are signalized by a c superscript and were obtained from the computed Y values as Yc = Y − BSSE.

3. Results

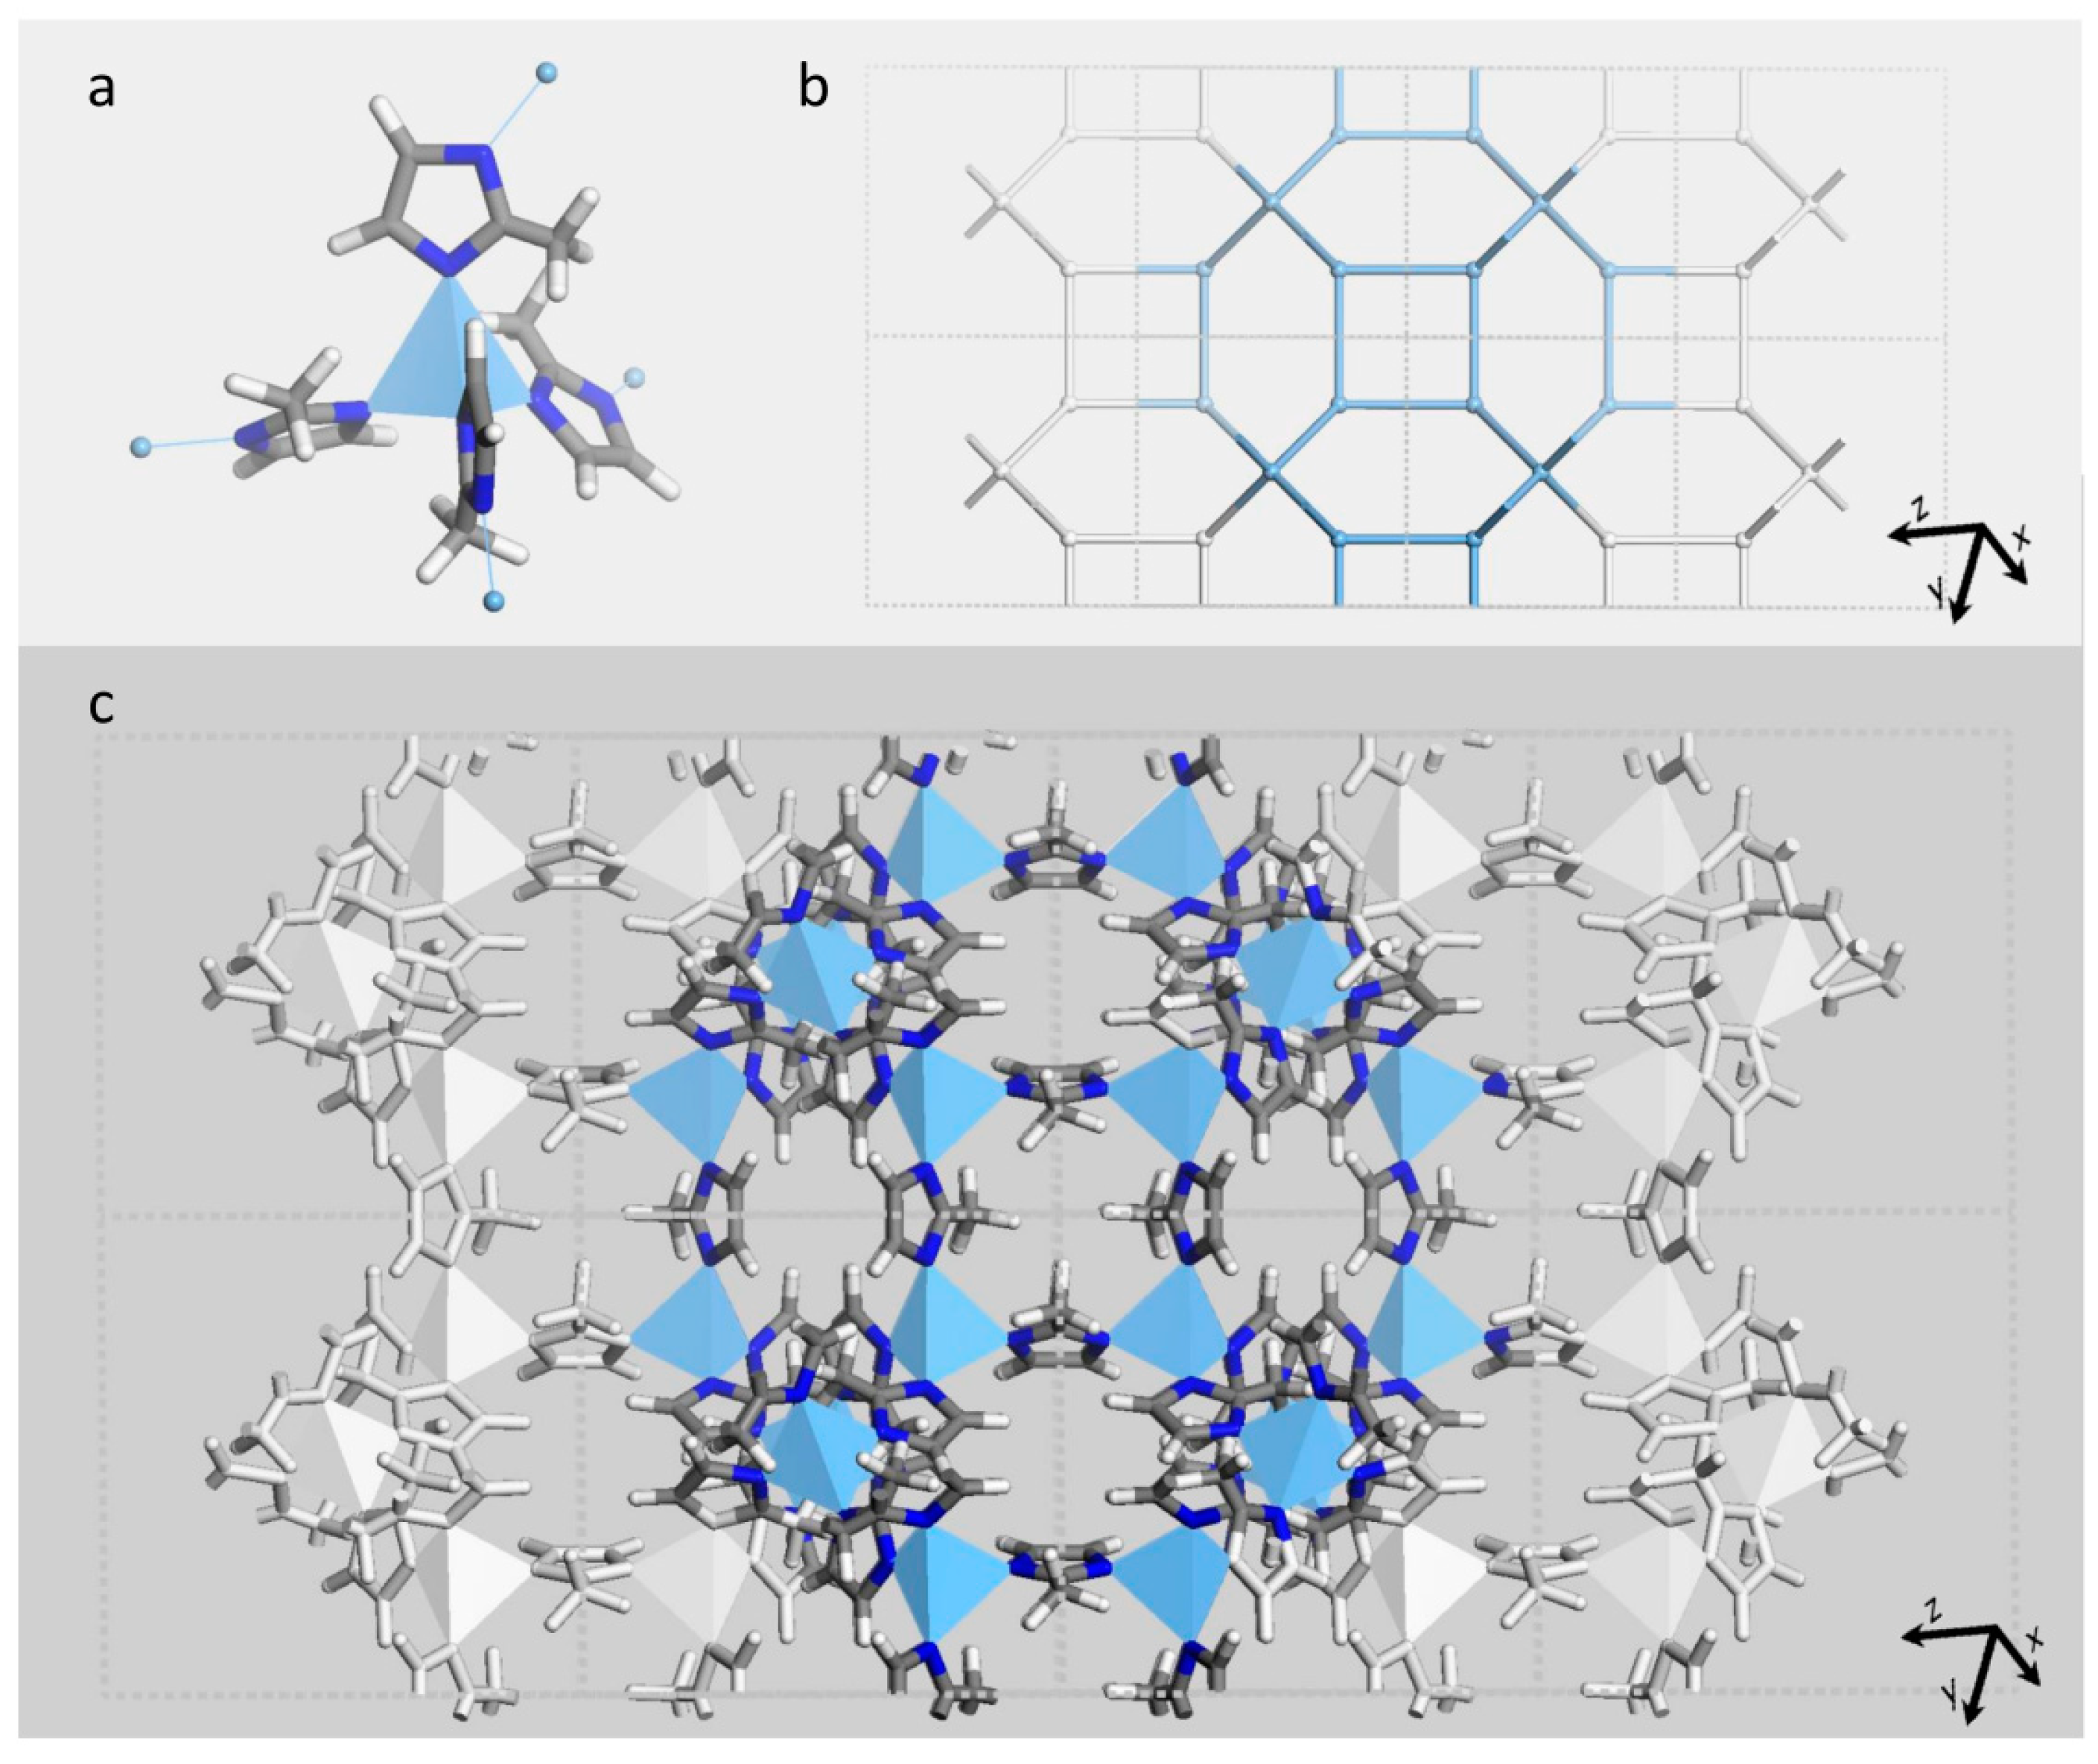
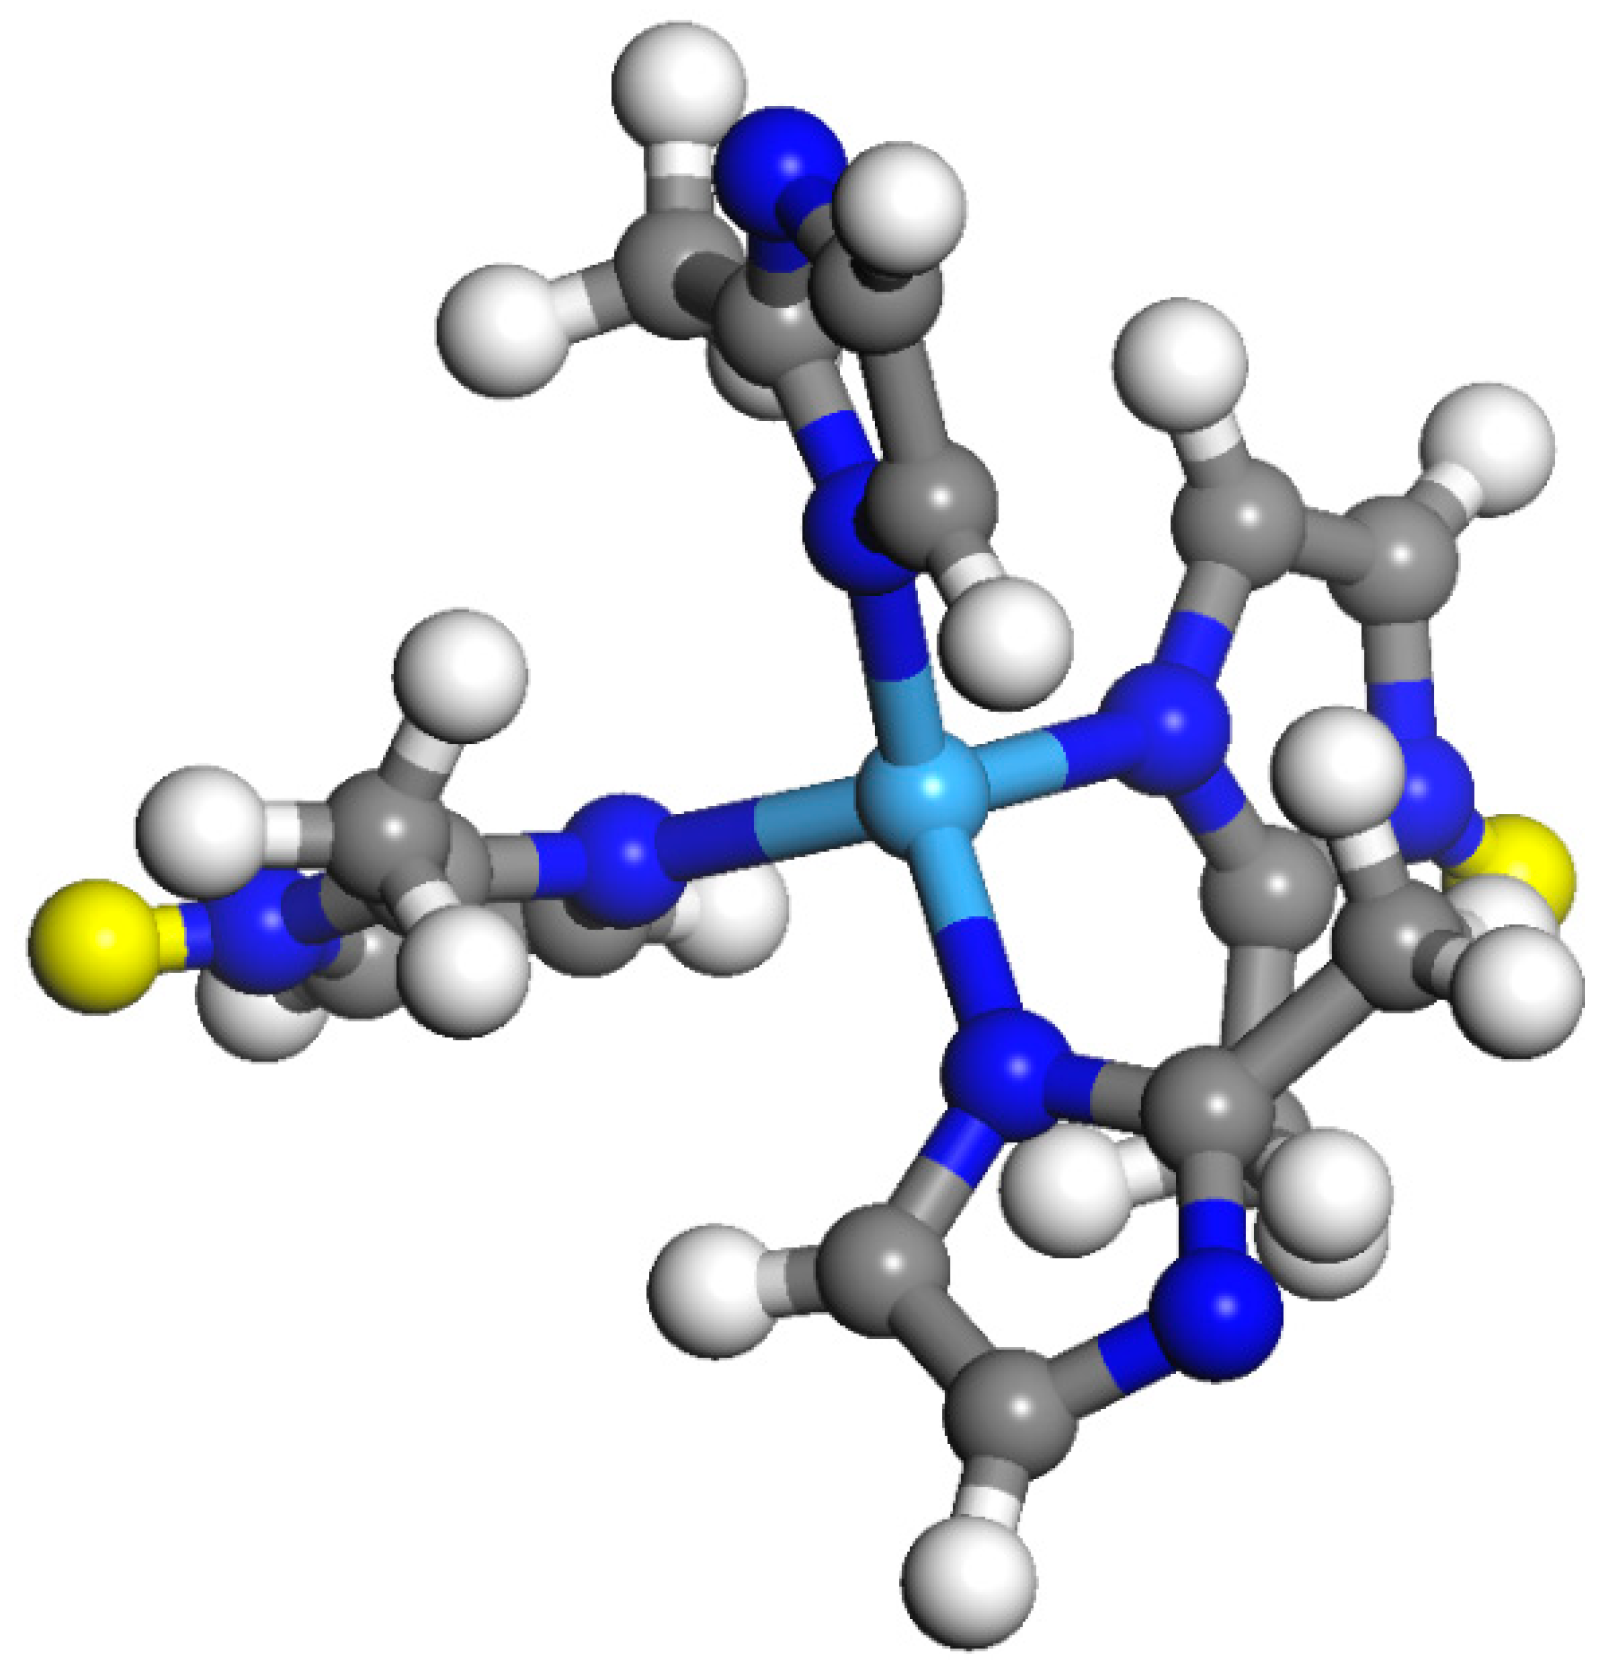
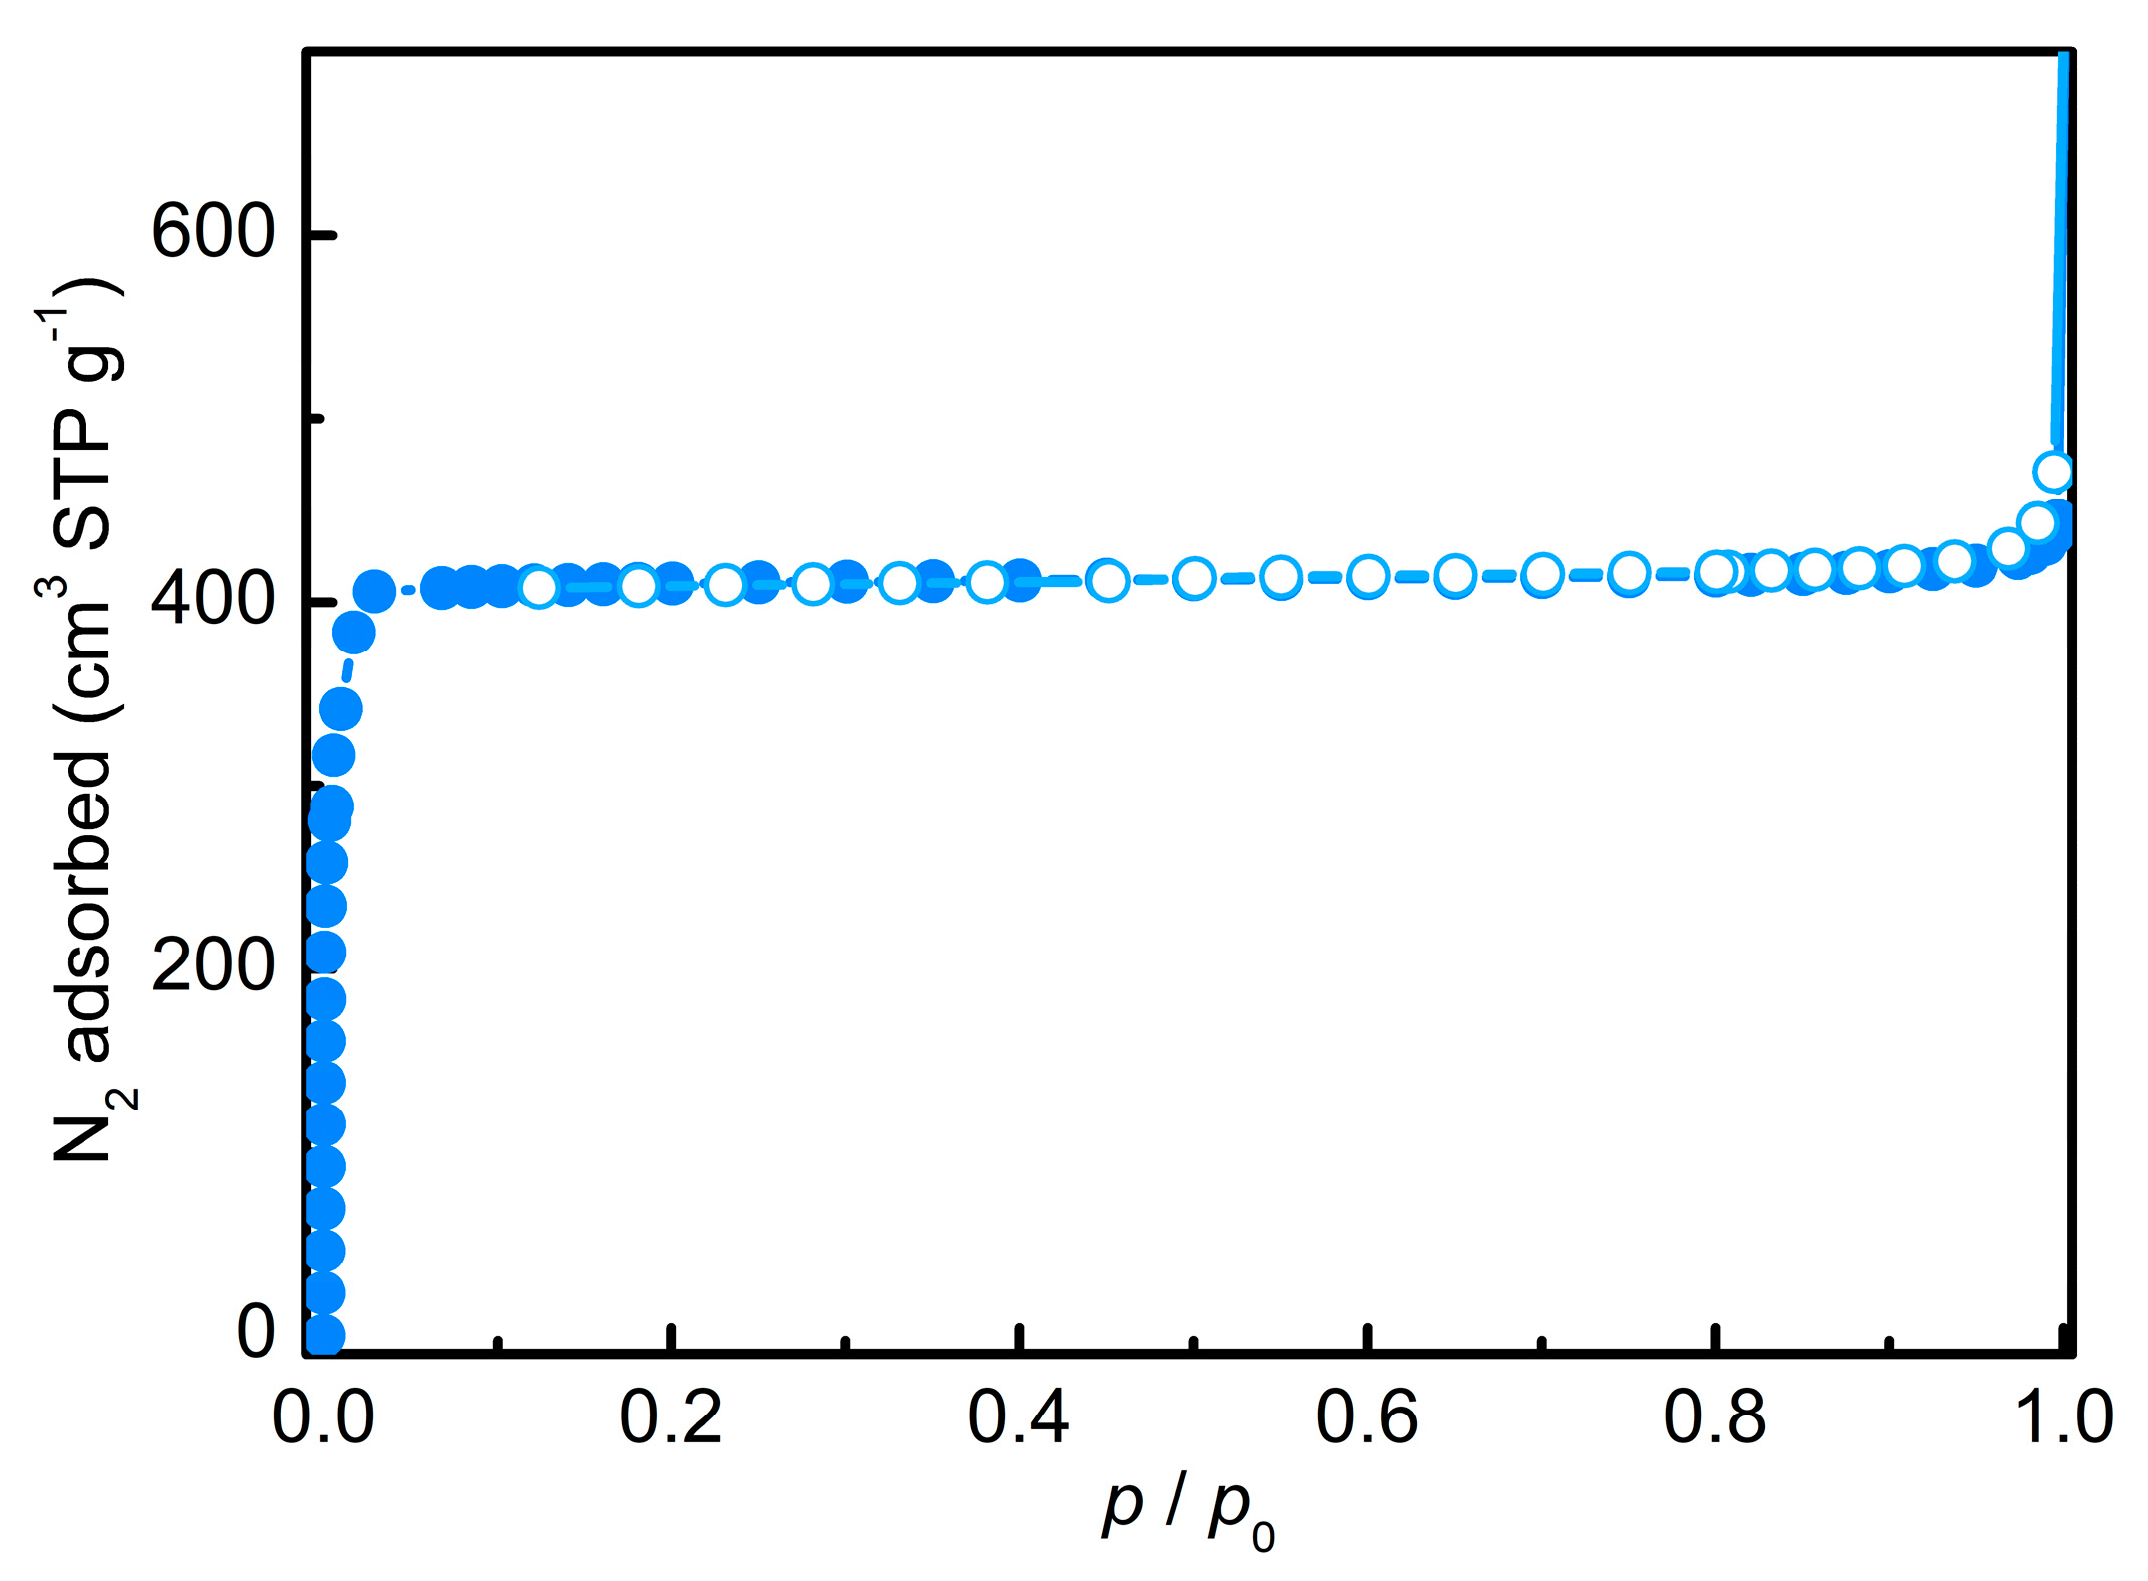
3.1. Zeolitic Imidazole Framework-8 (ZIF-8)

The XRD pattern of ZIF-8 is reported in Figure 3 as a blue line. This pattern rules out the presence of additional phases in the ZIF-8 sample and indicates a low strain and large crystalline domains material (the halo at 20° is associated to the boron silicate capillary). Accordingly, the N2 isotherm at 77 K is of type I, see Figure A2, as expected for a microporous material. The absence of a hysteresis between the adsorption and desorption branches (full and empty scatters, respectively) confirms the absence of mesopores, in general associated to impurities or additional phases. The Langmuir surface area is also very close to that reported previously (1790 vs. 1810 m2 g−1, see Table A1 and Ref. [23]).
The infrared spectrum of activated ZIF-8 is reported as a blue line in Figure 4. The IR spectrum of this MOF has been previously reported [48]. Briefly, the bands at 3134 and 2931 cm−1 can be assigned to the aromatic and aliphatic C–H stretching modes of the 2-methylimidazole, respectively. The peak at 1583 cm−1 can exactly be ascribed to the C=N stretching mode, whereas the intense and convoluted bands in the 1350–1500 cm−1 range are associated with the entire ring stretching vibrational mode. The bands in the 1350–900 cm−1 spectral range are due to the in-plane bending of the ring and those ones below 800 cm−1 are assigned to out-of-plane bending. Zn–N stretching mode is expected to be observed at around 420 cm−1 [25], that is in a lower frequencies range not explored in the present work.
The absence of signals in the >3200 cm−1 region testifies both the effectiveness of the activation procedure and a concentration of defects (associated to the formation of Zn-OH species) lower than the limit of detectability of IR spectroscopy.

3.2. EtO-CO2/ZIF-8

ZIF-8 spectrum obtained after dosing a gas mixture of 150 mbar of EtO and 600 mbar of CO2 is reported in Figure 4 (light orange curve). The signals associated to EtO (3066, 3000, 1267, 871, 617 cm−1) and to CO2 (strong absorption at 2339 and doublet at 660 cm−1) are well evident and are only slightly different than the corresponding gas phase values [49,50]. The bands of the MOF are essentially unperturbed by the gas. It was expected due to the absence of strong polarizing sites in the ZIF-8 structure (see the electrostatic map reported in Figure A1), the Zn atoms being completely shielded by the imidazolates. The asymmetric stretching band of CO2 (2339 cm−1) is almost coincident with that previously reported for ZIF-8 (2336 cm−1) [48]. The absence of strong polarizing sites in the material was also proved in a previous work using CO as molecular probe [48]. The calculations correctly predict the small shift of the vibrational features of EtO upon adsorption, while the band of CO2 is predicted to shift of about −20 cm−1 (see Table 1). This value is almost unchanged by considering the copresence of EtO. The difference observed between the computationally predicted and experimentally observed CO2 frequency shift is likely associated to the presence of the protons used to saturate the ZIF-8 cluster and that are absent in the real material (yellow spheres in Figure 2). For what concerns the energetics, the calculated ΔHc for CO2 is lower than the experimentally determined value reported in Refs. [51,52,53], as expected because of the small dimension of the cluster used in this study [54]. The spurious effect of the H atoms is then mainly affecting the vibrational features of CO2, whereas it does not increase significantly the energetics of the interaction and the considerations that can be driven from these values.
We observed the first appearance of the signals associated to ethylene carbonate (EtC) after 1 h 20 min of contact at beam temperature (35–40 °C), in particular the peaks at 1078 and 716 cm-1 (due to ring breathing modes associated with CCH2-O stretching modes). The mechanism at the basis of the cycloaddition reaction is likely similar to that hypothesized for (poly)ionic liquid, where the epoxide ring opening is catalyzed by the –N-R group of the imidazole [19]. A doublet is also observed at 1815 and 1776 cm−1, associated to the C=O stretching split in two signals by a Fermi resonance effect with the first overtone of a ring breathing vibration (2ν = 1780 cm−1, [55]). An additional band, having a very low intensity, also appears at 1754 cm-1: it can be associated to EtC molecules in interaction with defects or, more likely, to EtC oligomers (see below). Signals associated to EtO polymerization (2945, 2880 and 1355 cm−1) were not observed also after prolonged contact [56,57], suggesting the oligomers should be in a negligible, or almost nil, concentration. All these signals simultaneously grow in intensity with time. The spectrum recorded after 4 days is reported as a dark orange line in Figure 4. The decrease in intensity of the reagents bands is of few percent, indicating a kinetically limited process, unlike what reported for styrene carbonate formation in ZIF-8, reaching about 70% of reagents conversion after 10 h [34]. The different behavior can be associated to various factors as, for example, the intrinsically higher reactivity of styrene oxide and/or the higher temperature and pressures adopted in that study (7 bar, 100 °C) [34]. Another factor could be the larger concentration of defects in the ZIF-8 sample used in Ref. [34], as suggested by its lower surface area (860 m2 g-1), that can significantly increase its activity.
After 4 days, the sample was degassed at 35–40 °C for one night (see light grey curve in Figure 4). All the reagents bands were removed in the first five minutes of degassing, indicating a small affinity of these molecules for ZIF-8, as expected on the basis of the calculated adsorption enthalpies. In parallel, the decrease in intensity of the products bands was slower, although continuous, bringing to their total disappearance, except for the component at 1754 cm−1. The absence of a band at about 1800 cm−1 has confirmed the polymeric nature of the carbonate species associated to this band [56,57]. A spectrum equivalent to that of the fresh material was obtained after a treatment at 200 °C for 3 h. The XRD pattern of ZIF-8 collected after reactivation at 200 °C is reported as orange line in Figure 3. Both intensity and position of the peaks are unchanged with respect to those of the pristine material (black curve), confirming the structural stability of ZIF-8. Accordingly, the reactivated material showed a catalytic activity coincident with the fresh sample. In addition, the materials degassed at 35–40 °C (grey line in Figure 4) showed no difference in activity compared to that fully activated, on the time scale adopted in this study.

3.3. PrO-CO2/ZIF-8

After activation of a fresh aliquot of ZIF-8 (black curve in Figure 5), a gas mixture composed by 150 mbar of PrO and 600 mbar of CO2 was dosed at 40 °C (light green curve). The position of the CO2 peaks is almost identical to that in the EtO/CO2 mixture. The signals due to PrO are present at 3042, 2991, 1294, 1021, 894, and 829 cm−1, with the latter being the most intense band in the PrO spectrum. All the ZIF-8 bands undergo a significant perturbation, unlike what was observed for EtO/CO2 (compare for example the shift of the 1665 cm-1 band from the black curve to the light orange and to the light green one in Figure 4 and Figure 5, respectively). The calculations provide a very similar description of the energetics for the adsorption of EtO and PrO on ZIF-8 (see Table 1). This experimentally observed difference can be then related to the different state of EtO and PrO at RT, being in the gas and liquid state, respectively (not considered in the calculations, just performed in the gas phase). For an infrared study where the effect of different adsorbates on a MOF modes is compared, refer to Ref. [58].
The first signals related to propylene carbonate (PrC) appeared after only 30 min, indicating a larger reactivity of PrO than EtO. Two main signals were observed: a broad IR band at 1816 cm-1, associated to C=O stretching, and at 1076 cm−1, due to ring breathing modes. These values are similar to those obtained for EtC. The band at 1816 cm−1 is significantly shifted compared to the corresponding band reported for liquid PrC (1863 cm−1, [50]), in agreement with the calculations (see Table 1). The framework bands further shifts while the reaction proceeds, because of the larger interaction energy of ZIF-8 with PrC than with PrO (see Table 1). The spectrum obtained after 4 days of contact is reported in Figure 5 as dark green line. Both signals of PrO and CO2 have the same intensity to those in the curve registered at time zero, suggesting that a low amounts of reagents has been consumed over time. All the signals were fully reversible after degassing at 40 °C for 15 h except the band at 1816 cm−1 (that is decreased to ~20% of its initial intensity). This band was removed only after degassing at 200 °C for 3 h (spectrum not reported). The stability of the ZIF-8 structure was confirmed by the XRD measurement (green line in Figure 3). Moreover, the reactivated material showed the same catalytic activity as the pristine one.

4. Discussion

In the previous section, we showed that ZIF-8 catalyzes the CO2 cycloaddition to EtO and to PrO with a very similar behavior. In both cases, the predominant product is the corresponding carbonate in its monomeric form, with a minor concentration of oligomers/polymers, and the reaction proceeds slowly. In order to provide evidence for some differences, in Figure 6 we have reported the integral of the band at ~1075 cm1 (normalized to the value at 96 h) as function of time for EtC (diamond scatters) and PrC (circles) formation. The absolute values are reported in Table 2. For this analysis we did not use the most intense band of the organic carbonates spectrum (i.e. the component at ~1815 cm−1) because it is significantly affected by small variations in the spectrum background. A quantitative evaluation of the conversion yields and rate was not possible because of the limitations of our experimental apparatus that precluded any in situ quantification of the formed products. Their ex situ quantification was instead not possible because they were partially removed along with the reagents during the degassing. For this reason, the reactivity of the catalyst is discussed in the following only qualitatively. Anyway, from the changes observed in the IR spectrum, it is evident that the ZIF-8 activity is very small, especially if compared with other catalysts studied in similar reactions conditions, e.g. polyionic-liquids [19]. Nevertheless, the first report of the catalytic activity of a MOF in such challenging reactions, without the presence of cocatalysts or solvents, is particularly important. Indeed, MOFs are the only class of materials possessing both a crystalline and modular structure, a hallmark that makes them ideal for material design in combination with computational studies. This often allows a faster identification and synthesis of the optimized versions of a catalyst than for all the other heterogeneous catalytic materials. The fit evidenced a linear dependence on time of EtC concentration (R2 = 0.9884, y = 0.1212 + 0.00899t, orange line in Figure 6), whereas a good fit was obtained for PrC with a second order polynomial (R2 = 0.98961, y = 0.07949 + 0.01496t − 5.50 × 10⁻⁵ t2, dark yellow line).
Then, the reaction proceeds slightly faster for PrO than for EtO conversion, in agreement with the shorter induction time observed for PrC formation. The computed ΔHcreaction is identical for both the EtO and PrO carboxylation reactions (about −70 kJ mol−1, see Table A2). Assuming a Brønsted–Evans–Polanyi behavior for the two reactions, the different kinetics should have a different origin.
As discussed in Section 3.3, the IR spectrum of the MOF showed a significant perturbation upon dosing PrO, whereas the ZIF-8 bands were substantially unperturbed for EtO. This fact was associated with the different state of aggregation for PrO (liquid) in the conditions adopted in this study, compared to the gas phase EtO. The difference in the state of aggregation for the two reagents is expected to cause a different local distribution in the MOF pores, definitely more homogeneous for EtO than for PrO. As a consequence, although the dosed amount was the same, the number of PrO molecules available around the reaction site is expected to be larger than in the EtO case, favoring the proceeding of the reaction. Moreover, the IR spectrum provides evidence of a larger perturbation of the ZIF-8 framework in presence of PrO: this modification of the MOF structure could also make more accessible the Zn-N couples to the interaction with the epoxide: the acid-base nature of these couples can in fact facilitate the ring opening step.

5. Conclusions

This study has shown that the commercially available MOF ZIF-8 is able to catalyze EtO and PrO carbonation to EtC and PrC, respectively. ZIF-8 activity for both the cycloaddition reactions is very similar. Interestingly, the most part of the products can be recovered at temperatures as low as 40 °C and the catalyst retained its structure upon regeneration. Besides the low yields, these results represent an important proof of concept. In fact, ZIF-8 is the first MOF reported to show a catalytic activity for the reaction of CO2 with ethylene oxide without necessitating the addition of a co-catalyst or a solvent. This result was quite unexpected based on the low CO2 adsorption enthalpy on ZIF-8 (17–29 kJ mol−1) [51,52,53] and because ZIF-8 is often studied as material for CO2 separation. Its activity is likely associated to the presence of imidazole rings in the material, which are the structural units at the basis of the catalytic activity of ionic liquids in these reactions [19]. This information is quite important in view to design new catalysts based on MOFs for CO2 cycloaddition to epoxides.
Moreover, CO2 is a significant contaminant in the synthesis of EtO, up to the 8% in volume. Catalysts necessitating solvents or cocatalysts would not be suitable to be used directly on the synthesis mixture, because those molecules could become additional contaminants of EtO. A catalyst as ZIF-8 would, instead, be appropriate and it would be able to remove selectively CO2 not simply by adsorption but converting it to EtC, coupling the CO2 capture and utilization in a single step. This feature would allow decreasing the cost of the EtO purification with the contemporaneous formation of a valuable product. As noted above, the kinetics of reactions for EtC formation were particularly slow. Nevertheless, they are expected to increase with the temperature and pressure based on previous articles [13,14]: in the present study we have worked using subatmospheric pressures because these conditions were imposed by our experimental apparatus. Usually, the EtO synthesis is conducted at 25 bar, meaning that the kinetics can be significantly increased at that pressures. Future experimental studies should aim to optimize the working conditions of ZIF-8 for this reaction and to develop, with the help of computational methods, new imidazole-based MOFs with improved catalytic activity compared to ZIF-8. The creation of defects in the material would represent another possibility to develop the present work. Indeed, the removal of linkers from the first coordination shell of the Zn atoms would cause the Zn-N Lewis acid-base couple in ZIF-8 to be accessible to adsorbates, facilitating both the CO2 adsorption and the epoxide ring opening.

Supplementary Materials

The following are available online at https://www.mdpi.com/2305-7084/3/3/60/s1, Cartesian coordinates for all the clusters optimized at the B3LYP-D3/TZVP level.

Author Contributions

Conceptualization, investigation, data curation, writing—original draft preparation, J.G.V.; writing—review and editing, V.C., F.B.

Funding

This research received no external funding.

Conflicts of Interest

The authors declare no conflict of interest.

Appendix A

Electrostatic potential map of ZIF-8 surface is reported in Figure A1.
Figure A1. Electrostatic potential map obtained at BLYP/DN level on the X-ray resolved structure of ZIF-8 reported in Ref. [27] and plot on the 0.2 a.u. isosurface. The values of −0.08 and +0.22 au are reported in blue and red, respectively, with intermediate values reported in a reverse rainbow scale. The atoms are reported in the same color code as in Figure 1.
Chemengineering 03 00060 g0a1

Appendix B

The surface area of the ZIF-8 sample was determined through N2 volumetry at 77 K. The surface area and pore volumes reported in Table A1 were obtained from the analysis of the isotherms reported in Figure A2.
Table A1. Surface areas (m2 g−1) and pore volume (cm3 g−1) of ZIF-8.
SBET 1SLangmuir 1Sext2Vmicro 2
13581791110.66
1 Total area evaluated following the BET and Langmuir models in the standard 0.05 < p/p0 < 0.25 pressure ranges, respectively. 2 External area (defined as the difference between the total area and the microporous area) and micropores volume obtained from the t-plot.
Figure A2. N2 sorption measurements at 77 K on ZIF-8. Full and empty scatters refer to adsorption and desorption branches, respectively.
Chemengineering 03 00060 g0a2

Appendix C

The calculated values for the energies associated to the reactions reported in Scheme 1 are detailed in Table A2.
Table A2. Reaction energy, enthalpy and free Gibbs energy for CO2 cycloaddition to EtO and PrO catalyzed by ZIF-8, as calculated at the B3LYP/TZVP level. All the energetic values are in kJ mol−1.
ΔEcreactionΔHcreactionΔGcreaction
EtO +CO2 → EtC−78.6−71.2−53.1
PrO +CO2 → PrC−77.2−69.8−49.6

References

  1. Olivier, J.G.J.; Janssens-Maenhout, G.; Muntean, M.; Peters, J.A.H.W. Trends in Global CO2 Emissions: 2016 Report; Netherlands Environmental Assessment Agency: Den Haag, The Netherlands, 2016. [Google Scholar]
  2. D’Alessandro, D.M.; Smit, B.; Long, J.R. Carbon dioxide capture: Prospects for new materials. Angew. Chem.-Int. Ed. 2010, 49, 6058–6082. [Google Scholar] [CrossRef] [PubMed]
  3. Quadrelli, E.A.; Centi, G.; Duplan, J.L.; Perathoner, S. Carbon dioxide recycling: Emerging large-scale technologies with industrial potential. ChemSusChem 2011, 4, 1194–1215. [Google Scholar] [CrossRef] [PubMed]
  4. Mikkelsen, M.; Jorgensen, M.; Krebs, F.C. The teraton challenge. A review of fixation and transformation of carbon dioxide. Energy Environ. Sci. 2010, 3, 43–81. [Google Scholar] [CrossRef]
  5. Aresta, M. Carbon dioxide reduction and uses as a chemical feedstock. In Activation of Small Molecules; Wiley-VCH Verlag GmbH & Co. KGaA: Weinheim, Germany, 2006; pp. 1–41. [Google Scholar]
  6. Chen, C.; Kotyk, J.F.K.; Sheehan, S.W. Progress toward commercial application of electrochemical carbon dioxide reduction. Chem 2018, 4, 2571–2586. [Google Scholar] [CrossRef]
  7. Hall, J.F.B.; Bourne, R.A.; Han, X.; Earley, J.H.; Poliakoff, M.; George, M.W. Synthesis of antimalarial trioxanes via continuous photo-oxidation with 1O2 in supercritical CO2. Green Chem. 2013, 15, 177–180. [Google Scholar] [CrossRef]
  8. Joos, L.; Huck, J.M.; Van Speybroeck, V.; Smit, B. Cutting the cost of carbon capture: A case for carbon capture and utilization. Faraday Discuss. 2016, 192, 391–414. [Google Scholar] [CrossRef] [PubMed]
  9. Vitillo, J.G. Magnesium-based systems for carbon dioxide capture, storage and recycling: From leaves to synthetic nanostructured materials. RSC Adv. 2015, 5, 36192–36239. [Google Scholar] [CrossRef]
  10. Vitillo, J.G.; Groppo, E.; Bardaji, E.G.; Baricco, M.; Bordiga, S. Fast carbon dioxide recycling by reaction with g-mg(bh4)2. Phys. Chem. Chem. Phys. 2014, 16, 22482–22486. [Google Scholar] [CrossRef] [PubMed]
  11. Shaikh, A.-A.G.; Sivaram, S. Organic carbonates. Chem. Rev. 1996, 96, 951–976. [Google Scholar] [CrossRef]
  12. Beyzavi, M.H.; Stephenson, C.J.; Liu, Y.; Karagiaridi, O.; Hupp, J.T.; Farha, O.K. Metal–organic framework-based catalysts: Chemical fixation of CO2 with epoxides leading to cyclic organic carbonates. Front. Energy Res. 2015, 2, 63. [Google Scholar] [CrossRef]
  13. Darensbourg, D.J.; Chung, W.-C.; Wang, K.; Zhou, H.-C. Sequestering CO2 for short-term storage in mofs: Copolymer synthesis with oxiranes. ACS Catal. 2014, 4, 1511–1515. [Google Scholar] [CrossRef]
  14. Kember, M.R.; Buchard, A.; Williams, C.K. Catalysts for CO(2)/epoxide copolymerisation. Chem. Commun. 2011, 47, 141–163. [Google Scholar] [CrossRef] [PubMed]
  15. Otto, A.; Grube, T.; Schiebahn, S.; Stolten, D. Closing the loop: Captured CO2 as a feedstock in the chemical industry. Energy Environ. Sci. 2015, 8, 3283–3297. [Google Scholar] [CrossRef]
  16. Jin, K.; Maalouf, J.H.; Lazouski, N.; Corbin, N.; Yang, D.; Manthiram, K. Epoxidation of cyclooctene using water as the oxygen atom source at manganese oxide electrocatalysts. J. Am. Chem. Soc. 2019, 141, 6413–6418. [Google Scholar] [CrossRef]
  17. Qin, Y.; Wang, X.; Wang, F. Recent advances in carbon dioxide based copolymer. Prog. Chem. 2011, 23, 613–622. [Google Scholar] [CrossRef]
  18. Biswas, T.; Mahalingam, V. Efficient CO2 fixation under ambient pressure using poly(ionic liquid)-based heterogeneous catalysts. Sustain. Energy Fuels 2019, 3, 935–941. [Google Scholar] [CrossRef]
  19. Dani, A.; Groppo, E.; Barolo, C.; Vitillo, J.G.; Bordiga, S. Design of high surface area poly(ionic liquid)s to convert carbon dioxide into ethylene carbonate. J. Mater. Chem. A 2015, 3, 8508–8518. [Google Scholar] [CrossRef] [Green Version]
  20. Dibenedetto, A.; Angelini, A.; Stufano, P. Use of carbon dioxide as feedstock for chemicals and fuels: Homogeneous and heterogeneous catalysis. J. Chem. Technol. Biotechnol. 2014, 89, 334–353. [Google Scholar] [CrossRef]
  21. Han, L.; Choi, H.-J.; Kim, D.-K.; Park, S.-W.; Liu, B.; Park, D.-W. Porous polymer bead-supported ionic liquids for the synthesis of cyclic carbonate from CO2 and epoxide. J. Mol. Catal. A Chem. 2011, 338, 58–64. [Google Scholar] [CrossRef]
  22. Agirrezabal-Telleria, I.; Luz, I.; Ortuño, M.A.; Oregui-Bengoechea, M.; Gandarias, I.; López, N.; Lail, M.A.; Soukri, M. Gas reactions under intrapore condensation regime within tailored metal–organic framework catalysts. Nat. Commun. 2019, 10, 2076. [Google Scholar] [CrossRef]
  23. Park, K.S.; Ni, Z.; Côté, A.P.; Choi, J.Y.; Huang, R.; Uribe-Romo, F.J.; Chae, H.K.; O’Keeffe, M.; Yaghi, O.M. Exceptional chemical and thermal stability of zeolitic imidazolate frameworks. Proc. Natl. Acad. Sci. USA 2006, 103, 10186–10191. [Google Scholar] [CrossRef] [PubMed] [Green Version]
  24. Hu, Y.; Kazemian, H.; Rohani, S.; Huang, Y.; Song, Y. In situ high pressure study of zif-8 by ftir spectroscopy. Chem. Commun. 2011, 47, 12694–12696. [Google Scholar] [CrossRef] [PubMed]
  25. Ethiraj, J.; Bonino, F.; Lamberti, C.; Bordiga, S. H2S interaction with hkust-1 and zif-8 mofs: A multitechnique study. Microporous Mesoporous Mater. 2015, 207, 90–94. [Google Scholar] [CrossRef]
  26. Yin, H.; Kim, H.; Choi, J.; Yip, A.C.K. Thermal stability of zif-8 under oxidative and inert environments: A practical perspective on using zif-8 as a catalyst support. Chem. Eng. J. 2015, 278, 293–300. [Google Scholar] [CrossRef]
  27. Lewis, D.W.; Ruiz-Salvador, A.R.; Gómez, A.; Rodriguez-Albelo, L.M.; Coudert, F.-X.; Slater, B.; Cheetham, A.K.; Mellot-Draznieks, C. Zeolitic imidazole frameworks: Structural and energetics trends compared with their zeolite analogues. CrystEngComm 2009, 11, 2272–2276. [Google Scholar] [CrossRef]
  28. Tran, U.P.N.; Le, K.K.A.; Phan, N.T.S. Expanding applications of metal-organic frameworks: Zeolite imidazolate framework zif-8 as an efficient heterogeneous catalyst for the knoevenagel reaction. ACS Catal. 2011, 1, 120–127. [Google Scholar] [CrossRef]
  29. Chizallet, C.l.; Lazare, S.; Bazer-Bachi, D.; Bonnier, F.; Lecocq, V.; Soyer, E.; Quoineaud, A.-A.; Bats, N. Catalysis of transesterification by a nonfunctionalized metal−organic framework: Acido-basicity at the external surface of zif-8 probed by ftir and ab initio calculations. J. Am. Chem. Soc. 2010, 132, 12365–12377. [Google Scholar] [CrossRef] [PubMed]
  30. Nguyen, L.T.L.; Le, K.K.A.; Phan, N.T.S. A zeolite imidazolate framework zif-8 catalyst for friedel-crafts acylation. Chin. J. Catal. 2012, 33, 688–696. [Google Scholar] [CrossRef]
  31. Sumida, K.; Rogow, D.L.; Mason, J.A.; McDonald, T.M.; Bloch, E.D.; Herm, Z.R.; Bae, T.H.; Long, J.R. Carbon dioxide capture in metal-organic frameworks. Chem. Rev. 2012, 112, 724–781. [Google Scholar] [CrossRef]
  32. McEwen, J.; Hayman, J.-D.; Ozgur Yazaydin, A. A comparative study of CO2, CH4 and N2 adsorption in zif-8, zeolite-13x and bpl activated carbon. Chem. Phys. 2013, 412, 72–76. [Google Scholar] [CrossRef]
  33. Miralda, C.M.; Macias, E.E.; Zhu, M.; Ratnasamy, P.; Carreon, M.A. Zeolitic imidazole framework-8 catalysts in the conversion of CO2 to chloropropene carbonate. ACS Catal. 2012, 2, 180–183. [Google Scholar] [CrossRef]
  34. Zhu, M.; Srinivas, D.; Bhogeswararao, S.; Ratnasamy, P.; Carreon, M.A. Catalytic activity of zif-8 in the synthesis of styrene carbonate from CO2 and styrene oxide. Catal. Commun. 2013, 32, 36–40. [Google Scholar] [CrossRef]
  35. Zalomaeva, O.V.; Chibiryaev, A.M.; Kovalenko, K.A.; Kholdeeva, O.A.; Balzhinimaev, B.S.; Fedin, V.P. Cyclic carbonates synthesis from epoxides and CO2 over metal–organic framework Cr-MIL-101. J. Catal. 2013, 298, 179–185. [Google Scholar] [CrossRef]
  36. Beyzavi, M.H.; Klet, R.C.; Tussupbayev, S.; Borycz, J.; Vermeulen, N.A.; Cramer, C.J.; Stoddart, J.F.; Hupp, J.T.; Farha, O.K. A hafnium-based metal–organic framework as an efficient and multifunctional catalyst for facile CO2 fixation and regioselective and enantioretentive epoxide activation. J. Am. Chem. Soc. 2014, 136, 15861–15864. [Google Scholar] [CrossRef] [PubMed]
  37. Chaemchuen, S.; Xiao, X.; Ghadamyari, M.; Mousavi, B.; Klomkliang, N.; Yuan, Y.; Verpoort, F. Robust and efficient catalyst derived from bimetallic zn/co zeolitic imidazolate frameworks for CO2 conversion. J. Catal. 2019, 370, 38–45. [Google Scholar] [CrossRef]
  38. Brunauer, S.; Emmett, P.H.; Teller, E. Adsorption of gases in multimolecular layers. J. Am. Chem. Soc. 1938, 60, 309–319. [Google Scholar] [CrossRef]
  39. Gregg, S.J.; Sing, K.S.W. Adsorption, Surface Area and Porosity, 2nd ed.; Academic Press Inc.: London, UK, 1982. [Google Scholar]
  40. Langmuir, I. The adsorption of gases on plane surfaces of glass, mica and platinum. J. Am. Chem. Soc. 1918, 40, 1361–1403. [Google Scholar] [CrossRef]
  41. Materials Studio; Version 6; Accelrys Software Inc.: San Diego, CA, USA, 2011.
  42. Becke, A.D. Density-functional thermochemistry III. The role of exact exchange. J. Chem. Phys. 1993, 98, 5648–5652. [Google Scholar] [CrossRef]
  43. Lee, C.; Yang, W.; Parr, R.G. Development of the colle-salvetti correlation-energy formula into a functional of the electron density. Phys. Rev. B 1988, 37, 785–789. [Google Scholar] [CrossRef]
  44. Frisch, M.J.; Trucks, G.W.; Schlegel, H.B.; Scuseria, G.E.; Robb, M.A.; Cheeseman, J.R.; Montgomery, J.A.; Vreven, T.; Kudin, K.N.; Burant, J.C.; et al. Gaussian 03; Revision B.05; Gaussian, Inc.: Wallingford, CT, USA, 2004. [Google Scholar]
  45. Grimme, S.; Ehrlich, S.; Goerigk, L. Effect of the damping function in dispersion corrected density functional theory. J. Comput. Chem. 2011, 32, 1456–1465. [Google Scholar] [CrossRef]
  46. Schäfer, A.; Huber, C.; Ahlrichs, R. Fully optimized contracted gaussian-basis sets of triple zeta valence quality for atoms li to kr. J. Chem. Phys. 1994, 100, 5829–5835. [Google Scholar] [CrossRef]
  47. Boys, S.F.; Bernardi, F. The calculation of small molecular interactions by the differences of separate total energies. Some procedures with reduced errors Mol. Phys. 1970, 19, 553–566. [Google Scholar]
  48. Wee, L.H.; Lescouet, T.; Ethiraj, J.; Bonino, F.; Vidruk, R.; Garrier, E.; Packet, D.; Bordiga, S.; Farrusseng, D.; Herskowitz, M.; et al. Hierarchical zeolitic imidazolate framework-8 catalyst for monoglyceride synthesis. ChemCatChem 2013, 5, 3562–3566. [Google Scholar] [CrossRef]
  49. Vitillo, J.G.; Savonnet, M.; Ricchiardi, G.; Bordiga, S. Tailoring metal-organic frameworks for CO2 capture: The amino effect. ChemSusChem 2011, 4, 1281–1290. [Google Scholar] [CrossRef] [PubMed]
  50. Wallace, W.E. Infrared spectra. In Nist Chemistry Webbook, Nist Standard Reference Database Number 69; Linstrom, P.J., Mallard, W.G., Eds.; National Institute of Standards and Technology: Gaithersburg, MD, USA, 2019. [Google Scholar]
  51. Russell, B.A.; Migone, A.D. Low temperature adsorption study of CO2 in zif-8. Microporous Mesoporous Mater. 2017, 246, 178–185. [Google Scholar] [CrossRef]
  52. Autie-Castro, G.; Oliveira, D. Ch4 and CO2 adsorption study in zif-8 and al-bdc mofs. Biol. Chem. Res. 2017, 234–246. [Google Scholar]
  53. Gadipelli, S.; Travis, W.; Zhou, W.; Guo, Z. A thermally derived and optimized structure from zif-8 with giant enhancement in CO2 uptake. Energy Environ. Sci. 2014, 7, 2232–2238. [Google Scholar] [CrossRef]
  54. Vitillo, J.G.; Atzori, C.; Civalleri, B.; Barbero, N.; Barolo, C.; Bonino, F. Design and characterization of mofs (metal organic frameworks) for innovative applications. In Hybrid Organic-Inorganic Interfaces. Towards Advanced Functional Materials; Delville, M.H., Taubert, A., Eds.; Wiley-VCH Verlag: Weinheim, Germany, 2017. [Google Scholar]
  55. Angell, C.L. The infra-red spectra and structure of ethylene carbonate. Trans. Faraday Soc. 1956, 52, 1178–1183. [Google Scholar] [CrossRef]
  56. Groppo, E.; Estephane, J.; Lamberti, C.; Spoto, G.; Zecchina, A. Ethylene, propylene and ethylene oxide in situ polymerization on the cr(ii)/sio2 system: A temperature- and pressure-dependent investigation. Catal. Today 2007, 126, 228–234. [Google Scholar] [CrossRef]
  57. Groppo, E.; Zecchina, A.; Barzan, C.; Vitillo, J.G. Low temperature activation and reactivity of CO2 over a crii-based heterogeneous catalyst: A spectroscopic study. Phys. Chem. Chem. Phys. 2012, 14, 6538–6543. [Google Scholar] [CrossRef]
  58. Vitillo, J.G.; Ricchiardi, G. Effect of pore size, solvation, and defectivity on the perturbation of adsorbates in mofs: The paradigmatic MG2(dobpdc) case study. J. Phys.Chem. C 2017, 121, 22762–22772. [Google Scholar] [CrossRef]
Scheme 1. Cycloaddition of CO2 to (top) ethylene oxide and (bottom) propylene oxide on Zeolitic Imidazole Framework-8 (ZIF-8).
Chemengineering 03 00060 sch001
Figure 1. ZIF-8 structure from Ref. [27]. (a) Inset on a Zn tetrahedron and the four 2-methylimidazole directly linked to it. Elements are represented according to the following color code: Zn (light blue), N (blue), C (grey), and H (white). (b) ZIF-8 structure representation where only the Zn atoms are reported. Only one cage is colored in order to facilitate the visualization. The analogy with the sodalite structure is evident. (c) Representation of (b) where all the atoms are reported.
Chemengineering 03 00060 g001
Figure 2. Cluster model used to simulate ZIF-8 structure, as optimized at the B3LYP-D3/TZVP level. Color code as in Figure 1. The yellow spheres are used to represent the protons used to saturate the dangling bonds of the model.
Chemengineering 03 00060 g002
Figure 3. Powder X-ray diffraction (XRD) of ZIF-8 materials exposed to air after reactivation at 200 °C following the EtO/CO2 (orange curve) and PrO/CO2 reaction (dark yellow curve). The pattern of the fresh material is reported for comparison (blue curve).
Chemengineering 03 00060 g003
Figure 4. Fourier transform infrared (FTIR) spectrum of ZIF-8 degassed at 300 °C (blue curve). On this sample, a gas mixture of 150 mbar of EtO and 600 mbar of CO2 was dosed at 35–40 °C (light orange curve) and left in contact with the sample for 4 days (orange curve). The spectrum after degassing at beam temperature for 15 h is reported as a grey line.
Chemengineering 03 00060 g004
Figure 5. FTIR spectrum of ZIF-8 degassed at 300 °C (black curve). On this sample, a gas mixture of 150 mbar of PrO and 600 mbar of CO2 was dosed at 35–40 °C (light green curve) and left in contact with the sample at this temperature for 4 days (green curve). After this time, the sample was degassed at 35–40 °C for 15 h: the corresponding spectrum is reported in the figure as a grey line.
Chemengineering 03 00060 g005
Figure 6. Dependence on time of the integral of the ~1075 cm1 band of ethylene carbonate (orange scatters) and propylene carbonate (dark yellow scatters) on ZIF-8. The intensities reported in the plot are those in Table 2, normalized to the 96 h value. The orange and yellow lines correspond to the linear fitting of the EtC data and the quadratic fitting of the PrC data, respectively.
Chemengineering 03 00060 g006
Table 1. Energy (ΔEc), enthalpy (ΔHc), and free Gibbs energy (ΔGc) of adsorption for EtO, EtC, PrO, PrC, and CO2 on ZIF-8 as calculated at the B3LYP-D3/TZVP level. All these values are expressed in kJ mol−1. For the energy, the value uncorrected for basis set superposition error (BSSE) is also reported for comparison (ΔE). The shift of a representative normal mode with respect to the gas value (Δ v ˜ , cm−1) is also reported for each molecule: the asymmetric stretching frequency for CO2, the breathing ring mode at about 1050 cm−1 for EtO and PrO, and the C=O stretching frequency for EtO and PrO. In the CO2/EtO and CO2/PrO clusters, CO2 molecule is adsorbed on top of the cluster preadsorbing the epoxide molecule.
ΔEcE)ΔHcΔGc Δ v ˜ 1
CO2−21.2 (−23.1)−13.714.6−17
EtO−32.7 (−36.2)−26.117.21
PrO−33.2 (−36.4)−27.119.01
EtC−70.9 (−75.4)−63.5−11.9−53
PrC−70.3 (−74.7)−62.7−9.6−59
CO2/EtO−24.7 (−28.3)−17.513.6−17/2
CO2/PrO−25.8 (−28.0)−18.59.8−19/−1
1 Gas phase values: 2435 (CO2), 1296 (EtO), 1295 (PrO), 1901 (EtC), and 1897 cm−1 (PrC).
Table 2. Intensity of the ~1075 cm−1 band (I, cm−1) of EtC and PrC as function of time (h).
EtCPrC
TimeITimeI
61.860.5
122.8121.1
244.8141.2
486.6221.3
729.1482.5
9612.3723.5
963.8

