Article

Investigations on Cationic Dye Degradation Using Iron-Doped Carbon Xerogel

by
S. Andrada Maicaneanu
1,*,
Breanna McGhee
1,
Razvan Stefan
2,
Lucian Barbu-Tudoran
3,
Christopher Sedwick
1 and
Charles H. Lake
1
1
Department of Chemistry, Indiana University of Pennsylvania, Indiana, PA 15705, USA
2
Preclinic Department, University of Agricultural Science and Veterinary Medicine, 3-5 Calea Manastur, 400372 Cluj-Napoca, Romania
3
Electronic Microscopy Laboratory and Department of Molecular Biology and Biotechnology, Babeș-Bolyai University, 44 George Bilascu Street, 400015 Cluj-Napoca, Romania
*
Author to whom correspondence should be addressed.
ChemEngineering 2019, 3(3), 61; https://doi.org/10.3390/chemengineering3030061
Submission received: 1 May 2019 / Revised: 31 May 2019 / Accepted: 28 June 2019 / Published: 4 July 2019

Abstract

:
Iron-doped carbon xerogels were prepared using sol-gel synthesis, with potassium-2,4-dihydroxybenzoate and formaldehyde as starting materials, followed by an ion exchange step. The obtained samples were characterized (XRD, FTIR, SED-EDX, TEM) and investigated as catalysts in heterogeneous Fenton and catalytic wet air oxidation (CWAO) processes. Experiments were conducted in the same conditions (0.1 g catalysts, 25 mL of 100 mg/L dye solution, 25 °C, initial solution pH, 3 h) in thermostated batch reaction tubes (shaking water bath, 50 rpm) at atmospheric pressure. A series of three cationic dyes were considered: Brilliant green (BG), crystal violet (CV), and methyl green (MG). Dyes and TOC removal efficiencies up to 99% and 92%, respectively, were obtained, in strong correlation with the iron content of the catalyst. Iron content measured in solution at the end of the reaction, indicated that its amount was less than 2 ppm for all tested catalysts.

Graphical Abstract

1. Introduction

Wet air oxidation (WAO) and wet peroxide oxidation (WPO) are two wastewater treatment methods used to effectively remove (mineralize) high concentrations of persistent, toxic, and nonbiodegradable organic pollutants [1]. WAO takes place at elevated temperatures and pressures using gaseous oxygen or air as oxidant [2]. In contrast, WAO in presence of a solid catalyst, catalytic wet air oxidation (CWAO), decreases the severity of the operating conditions, increases efficiency, and reduces the cost of the process [2,3,4]. Although conducted under milder conditions, majority of the CWAO studies report usage of temperatures and pressures up to 250 °C and 8 MPa, respectively, and use pure oxygen or high purity air as oxidizing agent [2,5]. Classic WPO, homogeneous Fenton, uses Fe2+ and H2O2 to efficiently reduce the organic load of wastewaters. Although the process is very efficient and fast, it has a few disadvantages: It is only efficient at 2–4 pH, iron salt will remain in solution upon process completion, and a high amount of Fe2+ and H2O2 is required [1]. All these disadvantages can be overcome by using the heterogeneous process, in which Fe2+ is supported on a porous matrix.
Dyes are important water pollutants, which are discharged from textile, printing, paper, plastics, food, and leather industries. Dyes containing wastewater has strong color, high pH, high oxygen demand, and low biodegradability, and therefore is difficult to treat using conventional methods (e.g. biological methods) [2]. Various catalysts and combination of degradative/oxidative processes were reported for dye removal from wastewater, some of them are listed below. WPO on mixed iron oxides [6], iron-loaded ZSM-5 [7], Fe/AC [8], supported manganese porphyrins [9], iron or copper supported on clay, alumina, zeolite, activated carbon, carbon nanotubes, carbon nanofibers, graphene, silica, silica xerogel, and sepiolite [1,10]; CWAO on Ni/Mg-Al oxides [11,12,13], activated carbon [14], nitrogen-doped carbon nanotubes [15], active Pt and Ru [16], Fe2O3-CeO2-TiO2/γ-Al2O3 [17], Zn1.5PMo12O40 nanotube [18], CuO/γ-Al2O3 [19]; photocatalytic degradation on cerium- and iron-doped TiO2 [20], copper-doped TiO2 [21], strontium-doped TiO2 [22], TiO2 nanoparticles immobilized on activated carbon and natural clay [23], Ni-DMG/ZSM-5 [24], sodium bismuthate visible light photocatalysis [25]; microwave catalytic oxidation over CuO@AC, CuO-CeO2@AC [26], CoFe2O4 [27,28], NiFe2O4 [29] were reported.
The design of new and improved catalysts that can be successfully (high total organic carbon efficiencies) used in wastewater treatment processes such as heterogeneous Fenton and mild conditions CWAO has attracted scientist’s attention over the last decades.
Carbon xerogels, activated and metal-doped, have properties (controllable porosity, thermal stability, high specific surface area) [30] that can be capitalized in the removal of organic pollutants from wastewater. There are not many studies that considered carbon xerogel usage in wastewater treatment processes. Carbon xerogels were tested as adsorbents for caffeine, diclofenac [31], Orange II, and Chromotrope 2R [32]. Activated carbon xerogels [32], activated carbon xerogels–chitosan composite [33], iron-cobalt-doped magnetic carbon xerogels [34], nitrogen- and phosphorus-doped carbon xerogel [35], nickel-doped carbon xerogel [36], and ceria nanorods loaded on carbon xerogel [37] were tested in WPO of dyes and nitrophenols. Co- [5,30,38], Ce-, Fe-, Ni-, and Zn-doped carbon xerogel catalysts [5,30] were tested for phenol CWAO, while mesoporous carbon xerogel was tested for wet oxidation of aniline and nitro-aromatic compounds [39,40]. Carbon xerogel–Nb2O5 composite proved to exhibit photocatalytic properties towards visible light degradation of methylene blue [41], while Fe- and Mn-doped carbon xerogels demonstrated catalytic activity for dichlorobenzene ozonation [42].
The aim of the present work was to synthesize various iron-doped carbon xerogel (CX) catalysts, characterize the new obtained catalysts, test the efficiency of these catalysts in heterogeneous Fenton and CWAO (ambient pressure and temperature) processes for BG, CV, and MG dyes removal from wastewater, identify the best synthesis route, and investigate iron leakage during the catalytic process.

2. Materials and Methods

2.1. Chemicals

K2CO3 anhydrous (Acros Organics, Waltham, MA, USA), formaldehyde 37% w/w aqueous solution (Alfa Aesar, Haverhill, MA, USA), 2,4-dihydroxybenzoic acid (Alfa Aesar, Haverhill, MA, USA), Fe(NO3)3·9H2O (Acros Organics, Waltham, MA, USA), and ethanol (Fisher, Hampton, NH, USA) were used to synthesize the iron-doped carbon xerogel catalysts. 18.2 MΩ water obtained using a Millipore Direct-Q system was used for catalyst synthesis. Brilliant Green, C27H34N2O4S, 482.63 g/mol, BG (Aldrich, St. Louis, MO, USA), Crystal Violet, C25H30N3Cl, 407.98 g/mol, CV (Acros Organics), and Methyl Green, C27H35BrClN3⋅ZnCl2, 653.24 g/mol, MG (Fisher) were used as model dye molecules for the oxidation processes, Figure 1. A stock solution of 1000 mg/L was used to prepare the desired concentration (100 mg/L) solutions. H2O2 30% (Fisher) and dried, filtered air were used as oxidation agents. All reagents were of analytical purity and used as received.

2.2. Catalysts Synthesis

Iron-doped carbon xerogel samples were prepared using a sol-gel method modified (washing steps) after Plesa Chicinas et al., 2018 [5]. The main steps involved in the process were as follows: (1) Potassium-2,4-dihydroxybenzoate was obtained from 2,4-dihydroxybenzoic acid and K2CO3, (2) polycondensation reaction with formaldehyde was conducted using K2CO3 as a catalyst, (3) organic gel obtained was washed with ethanol, (4) K+ ions from the organic gel were replaced with Fe3+ ions, (5) iron-doped gel was dried in air, and finally (6) iron-doped gel was pyrolyzed in inert atmosphere. A blank carbon xerogel (CX) sample and five iron-doped carbon xerogel (Fe-CX) samples were prepared as described in Table 1.

2.3. Catalysts Characterization

X-ray diffraction (XRD) data were collected with a Rigaku-Americas Miniflex II Powder Diffractometer (Rigaku Americas Corporation, The Woodlands, TX, USA) using CuKα radiation. The diffractograms were recorded from 4° to 80° in 2θ. The analytic conditions were: 30 kV, 15 mA, with a step size of 0.020° and a step time of 5 s.
Fourier Transform Infrared Spectroscopy (FTIR) analyses were performed on KBr pellets (2 mg sample in 200 mg KBr). Spectra were obtained using a JASCO 4100 FTIR spectrometer (JASCO Corporation, Tokyo, Japan), operating between 400–4000 cm−1 with 2 cm−1 resolution.
Scanning electron microscopy-energy dispersive X-ray spectroscopy (SEM-EDX) analyses were performed using a Hitachi SU8230 High-Resolution Scanning Electron Microscope (Hitachi Ltd., Tokyo, Japan) equipped with a cold field emission gun. For morphological analysis, the samples were deposited on aluminum stubs and coated with a 10 nm gold layer. Energy dispersive X-ray spectra and chemical maps for the elements were acquired using an Oxford Instruments EDX System (X-Max N 80 Silicon Drift Detector, Oxford Instruments, Abingdon, UK).
Transmission electron microscopy analyses were performed using a Hitachi HD-2700 (Hitachi Ltd., Tokyo, Japan) scanning transmission electron microscope (STEM), equipped with a cold field emission gun, working at an acceleration voltage of 200 kV and designed for high-resolution (HRTEM) imaging with a resolution of 0.144 nm. A drop of suspension of each sample was deposited and dried on a copper grid coated by a thin carbon film prior to the electron microscopy analysis.

2.4. Heterogeneous Fenton and Catalytic Wet Air Oxidation Processes

Fe-CX catalysts were tested using glass tubes placed on a rack in a precision shaking water bath, at 25 ± 0.1 °C and 50 rpm (Thermo Scientific SWB15, Thermo Scientific, Waltham, MA, USA).
Heterogeneous Fenton experiments were conducted using 0.1 g catalysts (<212 μm to minimize diffusional limitations), 25 mL of 100 mg/L dye solution, 25 °C, initial solution pH 5.5–6, and 0.5 mL H2O2. The oxidation conditions were maintained for 3 h. Two blank tests were also carried out: (a) H2O2 and no catalyst, (b) no H2O2 and Fe-CX(4) catalyst.
CWAO experiments were carried out in the same conditions, with H2O2 being replaced by air at a flow rate of 300 mL/min. Experiments were conducted at ambient pressure. Two blank tests were run for this process: (a) Air and no catalyst and (b) no air and Fe-CX(4) catalyst.
All experiments were carried out in triplicate (±1% reproducibility), the hereafter discussed data being averaged values. pH values recorded at the end of the oxidation process were slightly higher but below 6.5.
The evolution of dye oxidation process was evaluated by means of efficiency (E and ETOC, %), calculated as dye concentration and total organic carbon (TOC) values, obtained for the initial and final solution (Equation (1)). Dye concentrations in solutions were determined using a UV-Vis, Genesys 50 spectrophotometer (Thermo Scientific, Waltham, MA, USA), calibration curve 2–10 mg/L, and the following maximum UV-Vis absorption wavelengths: λBG = 625 nm, λCV = 584 nm, λMG = 631 nm. Absorption spectra of reaction intermediates were collected in 200–800 nm range using the same spectrophotometer. Total organic carbon (TOC) analyses were performed using a Shimadzu Corporation TOC-L Analyzer (Shimadzu Scientific Instrumets, Columbia, MD, USA). Prior to analyses, the solution was centrifuged for 20 min at 4500 rpm.
E ( % ) = I n i t i a l F i n a l I n i t i a l × 100
Iron concentration in solution at the end of the oxidation processes was measured using an inductively coupled plasma optical emission spectrometer (ICP-OES) Perkin Elmer Optical 2100DV (Perkin Elmer Inc., Waltham, MA, USA). Prior to analysis, samples were acidified with HNO3 1:1 solution and filtered using 0.45 μm PET syringe filters.

3. Results and Discussion

3.1. Catalysts Characterization

Diffraction patterns from three iron-doped carbon xerogel catalysts (Fe-CX) are presented in Figure 2. In each case, three phases were identified; graphite (JCPDS 75-1621), iron ferrite (JCPDS 06-0696), and a cohenite (Fe3C) phase (JCPDS 34-001). At least one other unidentified phase is present (unidentified peak located at 51.3°). Diffraction from the graphite 002 planes occurred at 26.23° in 2 θ. This peak was used to scale the intensities of the three datasets for comparative purposes. Elemental iron was present in the xerogel catalyst in two phases, a cubic iron ferrite phase and an orthorhombic cohenite iron carbide phase indicating reduction of Fe3+ during the pyrolysis process. The iron ferrite phase was identified by diffraction from the 110 and 200 sets of planes (diffracted peaks at 44.67° and 65.02° in 2θ, respectively). These peaks are denoted with a dotted line in Figure 2. Notice, relatively weak diffraction from the graphite 101 planes overlap that from the iron ferrite 110 planes (44.36°). The cohenite iron carbide phase is identified by the 102, 211, 112, and 221 planes located at 43.74°, 42.86°, 45.85°, and 49.10°, respectively. Iron-doped carbon xerogel catalyst Fe-CX(1) represents a base line diffraction pattern where the sample was washed with ethanol and underwent ion exchange for the addition of Fe3+ before pyrolysis. Catalyst Fe-CX(2) underwent a 72 h washing with water before ion exchange while, Fe-CX(4), underwent a 72 h washing after ion exchange but before pyrolysis, Table 1. The ordering of the washings proved to be very significant and demonstrated large variations in the iron content of the resulting catalyst. The XRD data show a significant increase in the iron ferrite content in the diffractogram for Fe-CX(2) with an accompanying decrease of the iron carbide content. The diffractogram for Fe-CX(4) indicates a significant decrease of the iron ferrite component (when looking at the diffractogram, it should be remembered that diffraction from the graphite 101 planes overlaps that from the iron ferrite 110 planes). In this sample, the iron carbide content is also substantially reduced.
FT-IR spectra of CX and Fe-CX samples are presented in Figure 3. For better visualization of the structural modifications that took place after iron doping, infrared bands were indexed with respect to their position in carbon xerogel. The recorded spectral range was plotted into two figures for a better analysis of bands evolution after metal doping and pyrolysis steps.
In the 400–2000 cm−1 range, Figure 3a, absorption bands appear at 670, 702, 795, 886, 1059, 1375, 1443, 1473, 1580, 1740 cm−1 for CX sample. Most of these bands are narrow and reveal an organized structure inside the carbon xerogel CX. In this range, vibrations related to carbon and functional units are expected. Starting with the less energetic vibrations in 650–750 cm−1 range, two narrow signals can be noticed, located at ~670 and ~702 cm−1. On the right side of these bands, a broad and less intense envelope appeared. This more energetic spectral domain is composed of two signals, one located at 782 cm−1 and the other one at ~818 cm−1. The [650–850] cm−1 spectral domain was attributed to the aromatic ring in particular to C–H bond vibrations [5,31]. More energetically Lorentzian band at 886 cm−1 was ascribed to stretching vibration of C−H bonds, which seems to have similar length and surroundings within the rigid structure of carbon xerogel [31,43].
Two intense vibrations located at 1375 and 1443 cm−1 and a shoulder at 1473 cm−1 connected to the last vibration belong all to bonds linked to aromatic rings [5,44]. After iron doping, all the above-mentioned bands disappeared under a broad infrared envelope. An interesting behavior was observed for the band at 1730 cm−1 related to carboxyl in esters group; more precisely, to the stretching vibration of υ(C=O) [44,45,46] in [COO]-K as obtained during synthesis process that cannot be found in the iron-doped samples.
The 2000–4000 cm−1 spectral range presented in Figure 3b is clearly dominated, in the carbon xerogel sample, by a strong band located at 3198 cm−1, with two shoulders at around 3000 and 3452 cm−1. After iron doping, the last mentioned band became the most prominent in the spectra while the first two are hidden under a broad envelope. The band at 3450 cm−1 might be assigned to residual –OH groups from the gel precursors and adsorbed water [31,46]. The bands at 2852 and 3002 cm−1 were associated with asymmetric and symmetric vibrations of aliphatic and aromatic structures [46]. Infrared bands, which build up the broad band with a metacenter at 2294 cm−1, were assigned to −C≡C− triple bond [5].
SEM-EDX analyses on carbon xerogel and iron-doped carbon xerogel samples revealed the strong connection between the synthesis procedure, specifically washing steps (Table 1), and iron content of the final sample. For CX sample, a porous carbon matrix (Figure 4a) with elements originating from the inorganic and organic precursors used for synthesis were identified (Figure 4b and Table 2). As potassium was replaced with iron during the ion exchange step, several differences were observed. Samples Fe-CX(1) and Fe-CX(2) have a similar average iron content as no water washing step was included after the ion exchange process, 7.0% and 7.3%, respectively (Table 2). This difference might be attributed to an improved ion exchange process, for Fe-CX(2), as it took place on a water prewashed organic gel (Table 1). For Fe-CX(3) sample, which synthesis included two water washing steps, before and after the ion exchange process, average surface iron content dropped to less than half (Table 2). In the case of Fe-CX(4) and Fe-CX(4.1) samples, where water washing was performed only after the ion exchange process, iron content dropped significantly (Table 2). SEM-EDX iron maps presented in Figure 4 for Fe-CX(2) and Fe-CX(4.1) samples show iron distribution on the surface and the decreased content in Fe-CX(4.1) correlated with the synthesis steps discussed above.
TEM images presented in Figure 5 for Fe-CX(2) and Fe-CX(4) reveal how iron is imbedded in the carbon (graphite) matrix as well as the decreased amount in Fe-CX(4) sample.

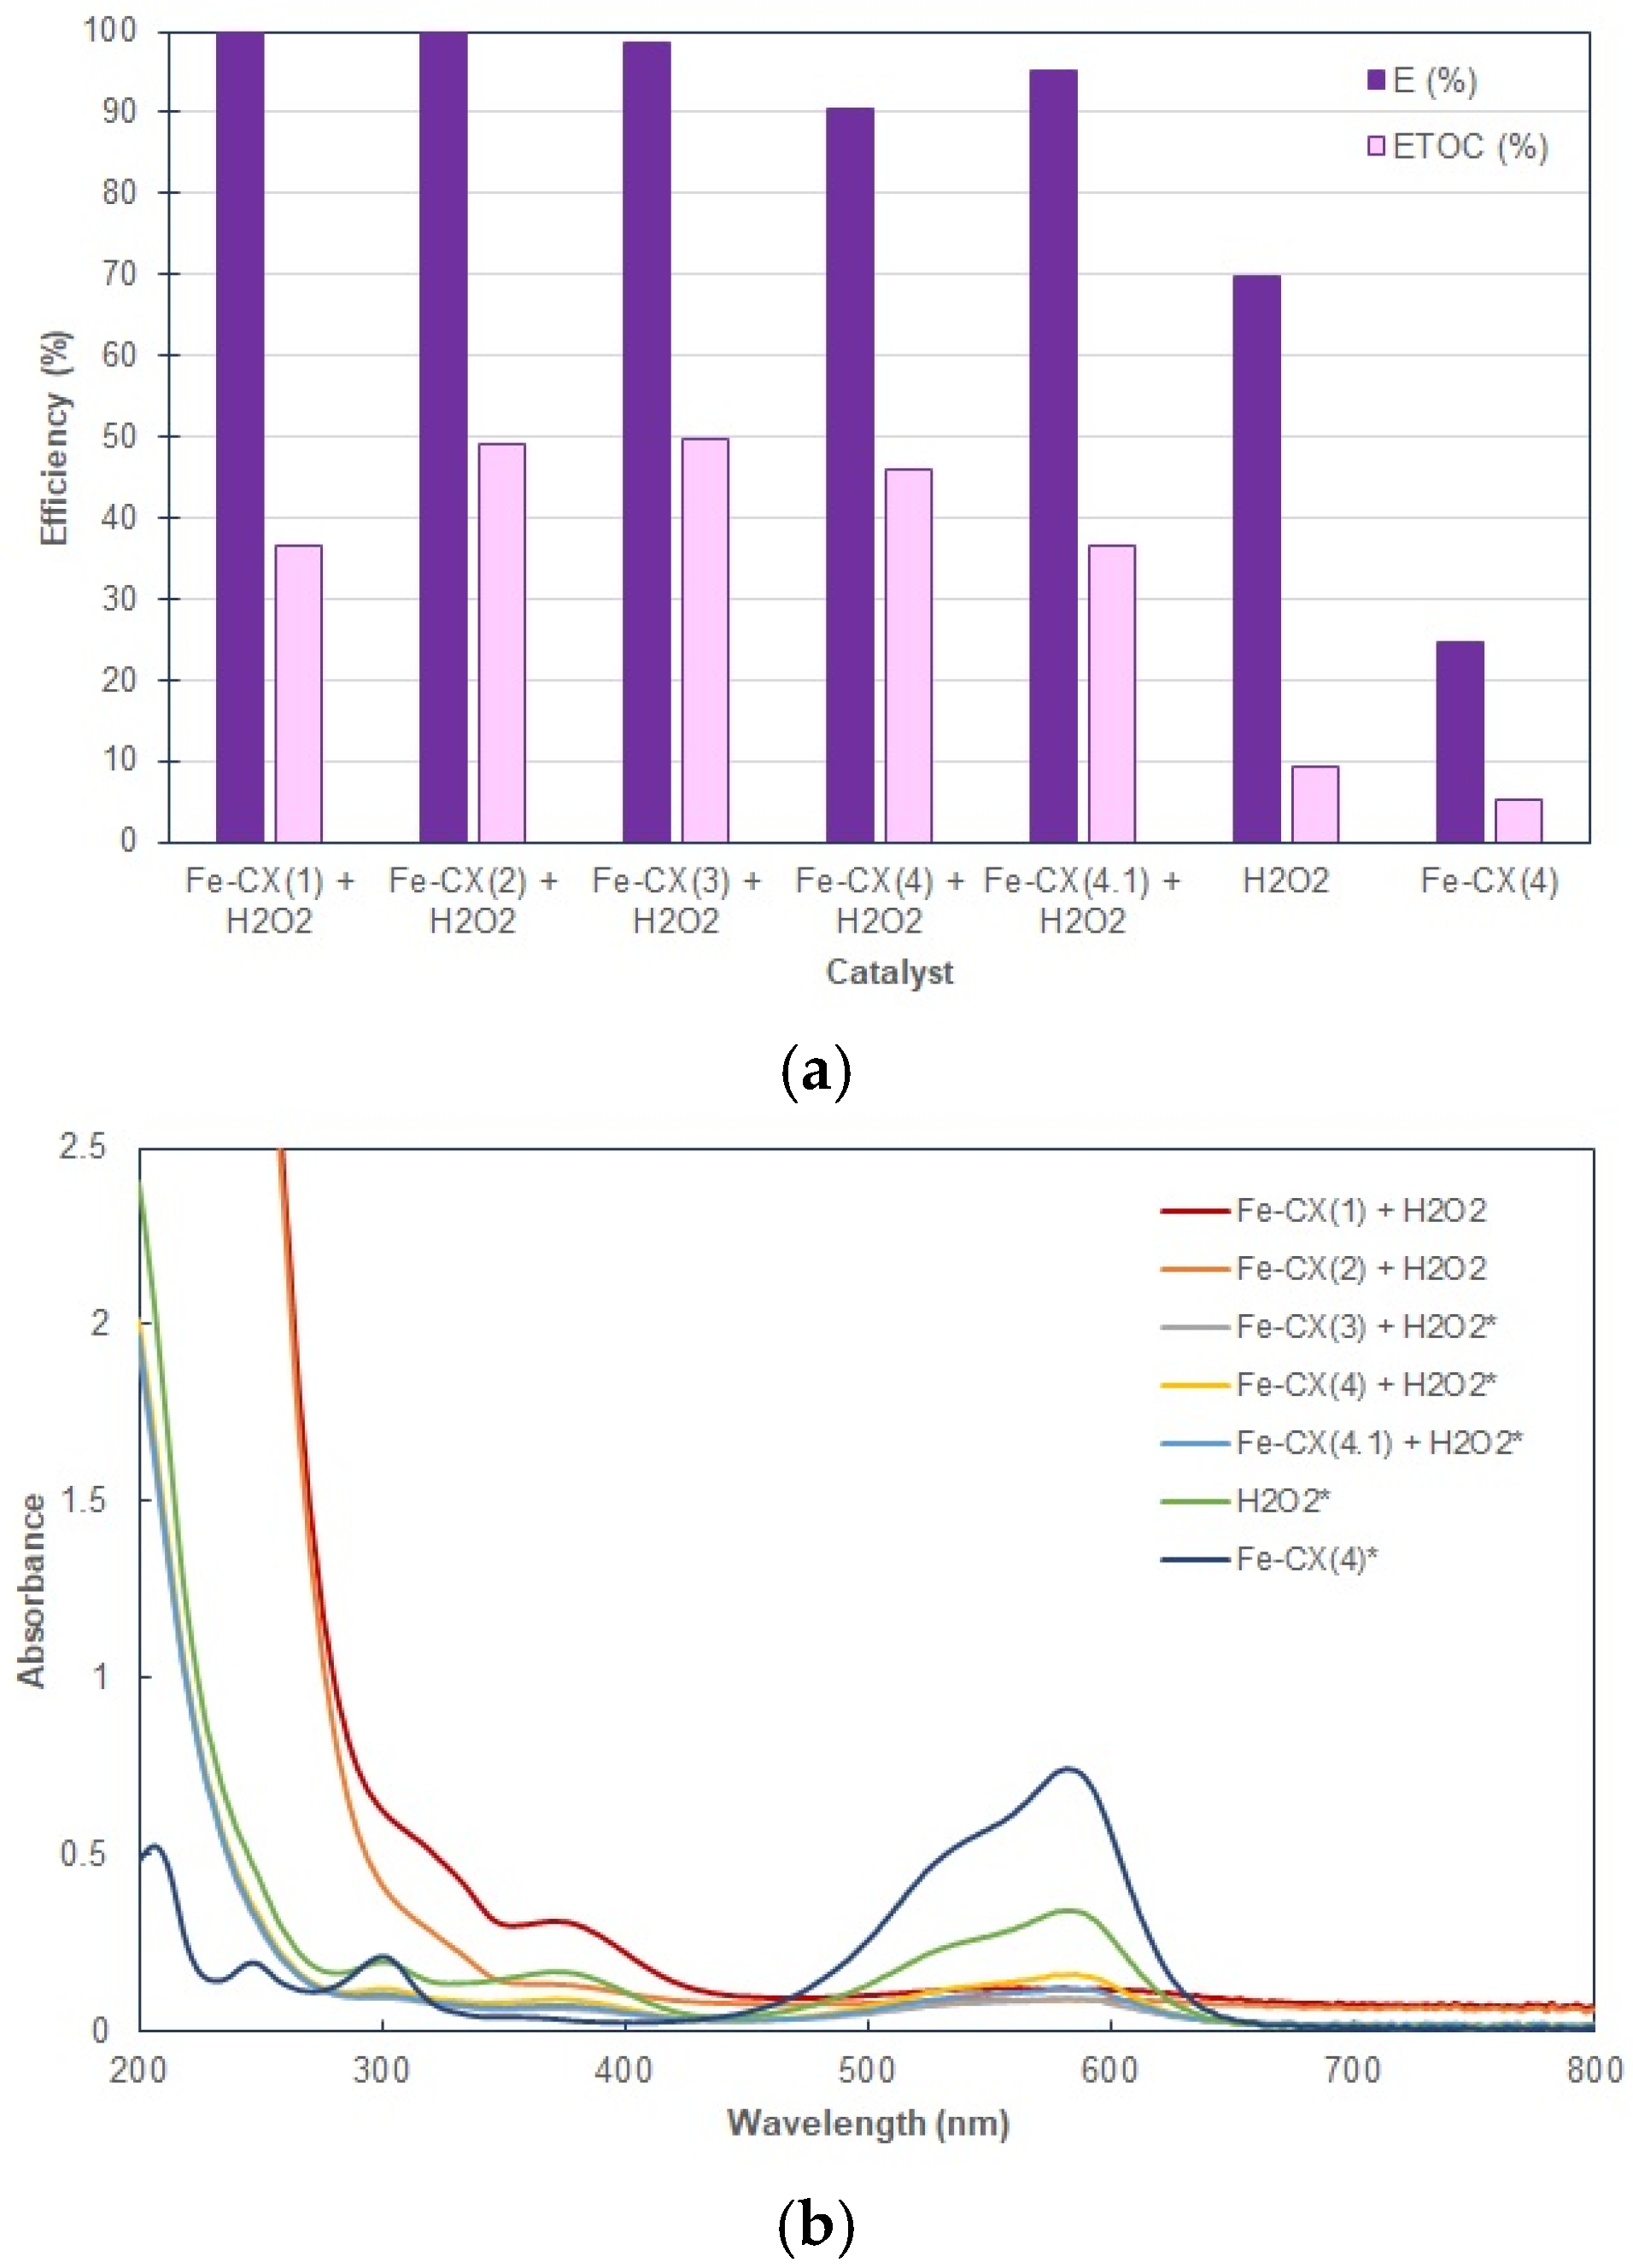
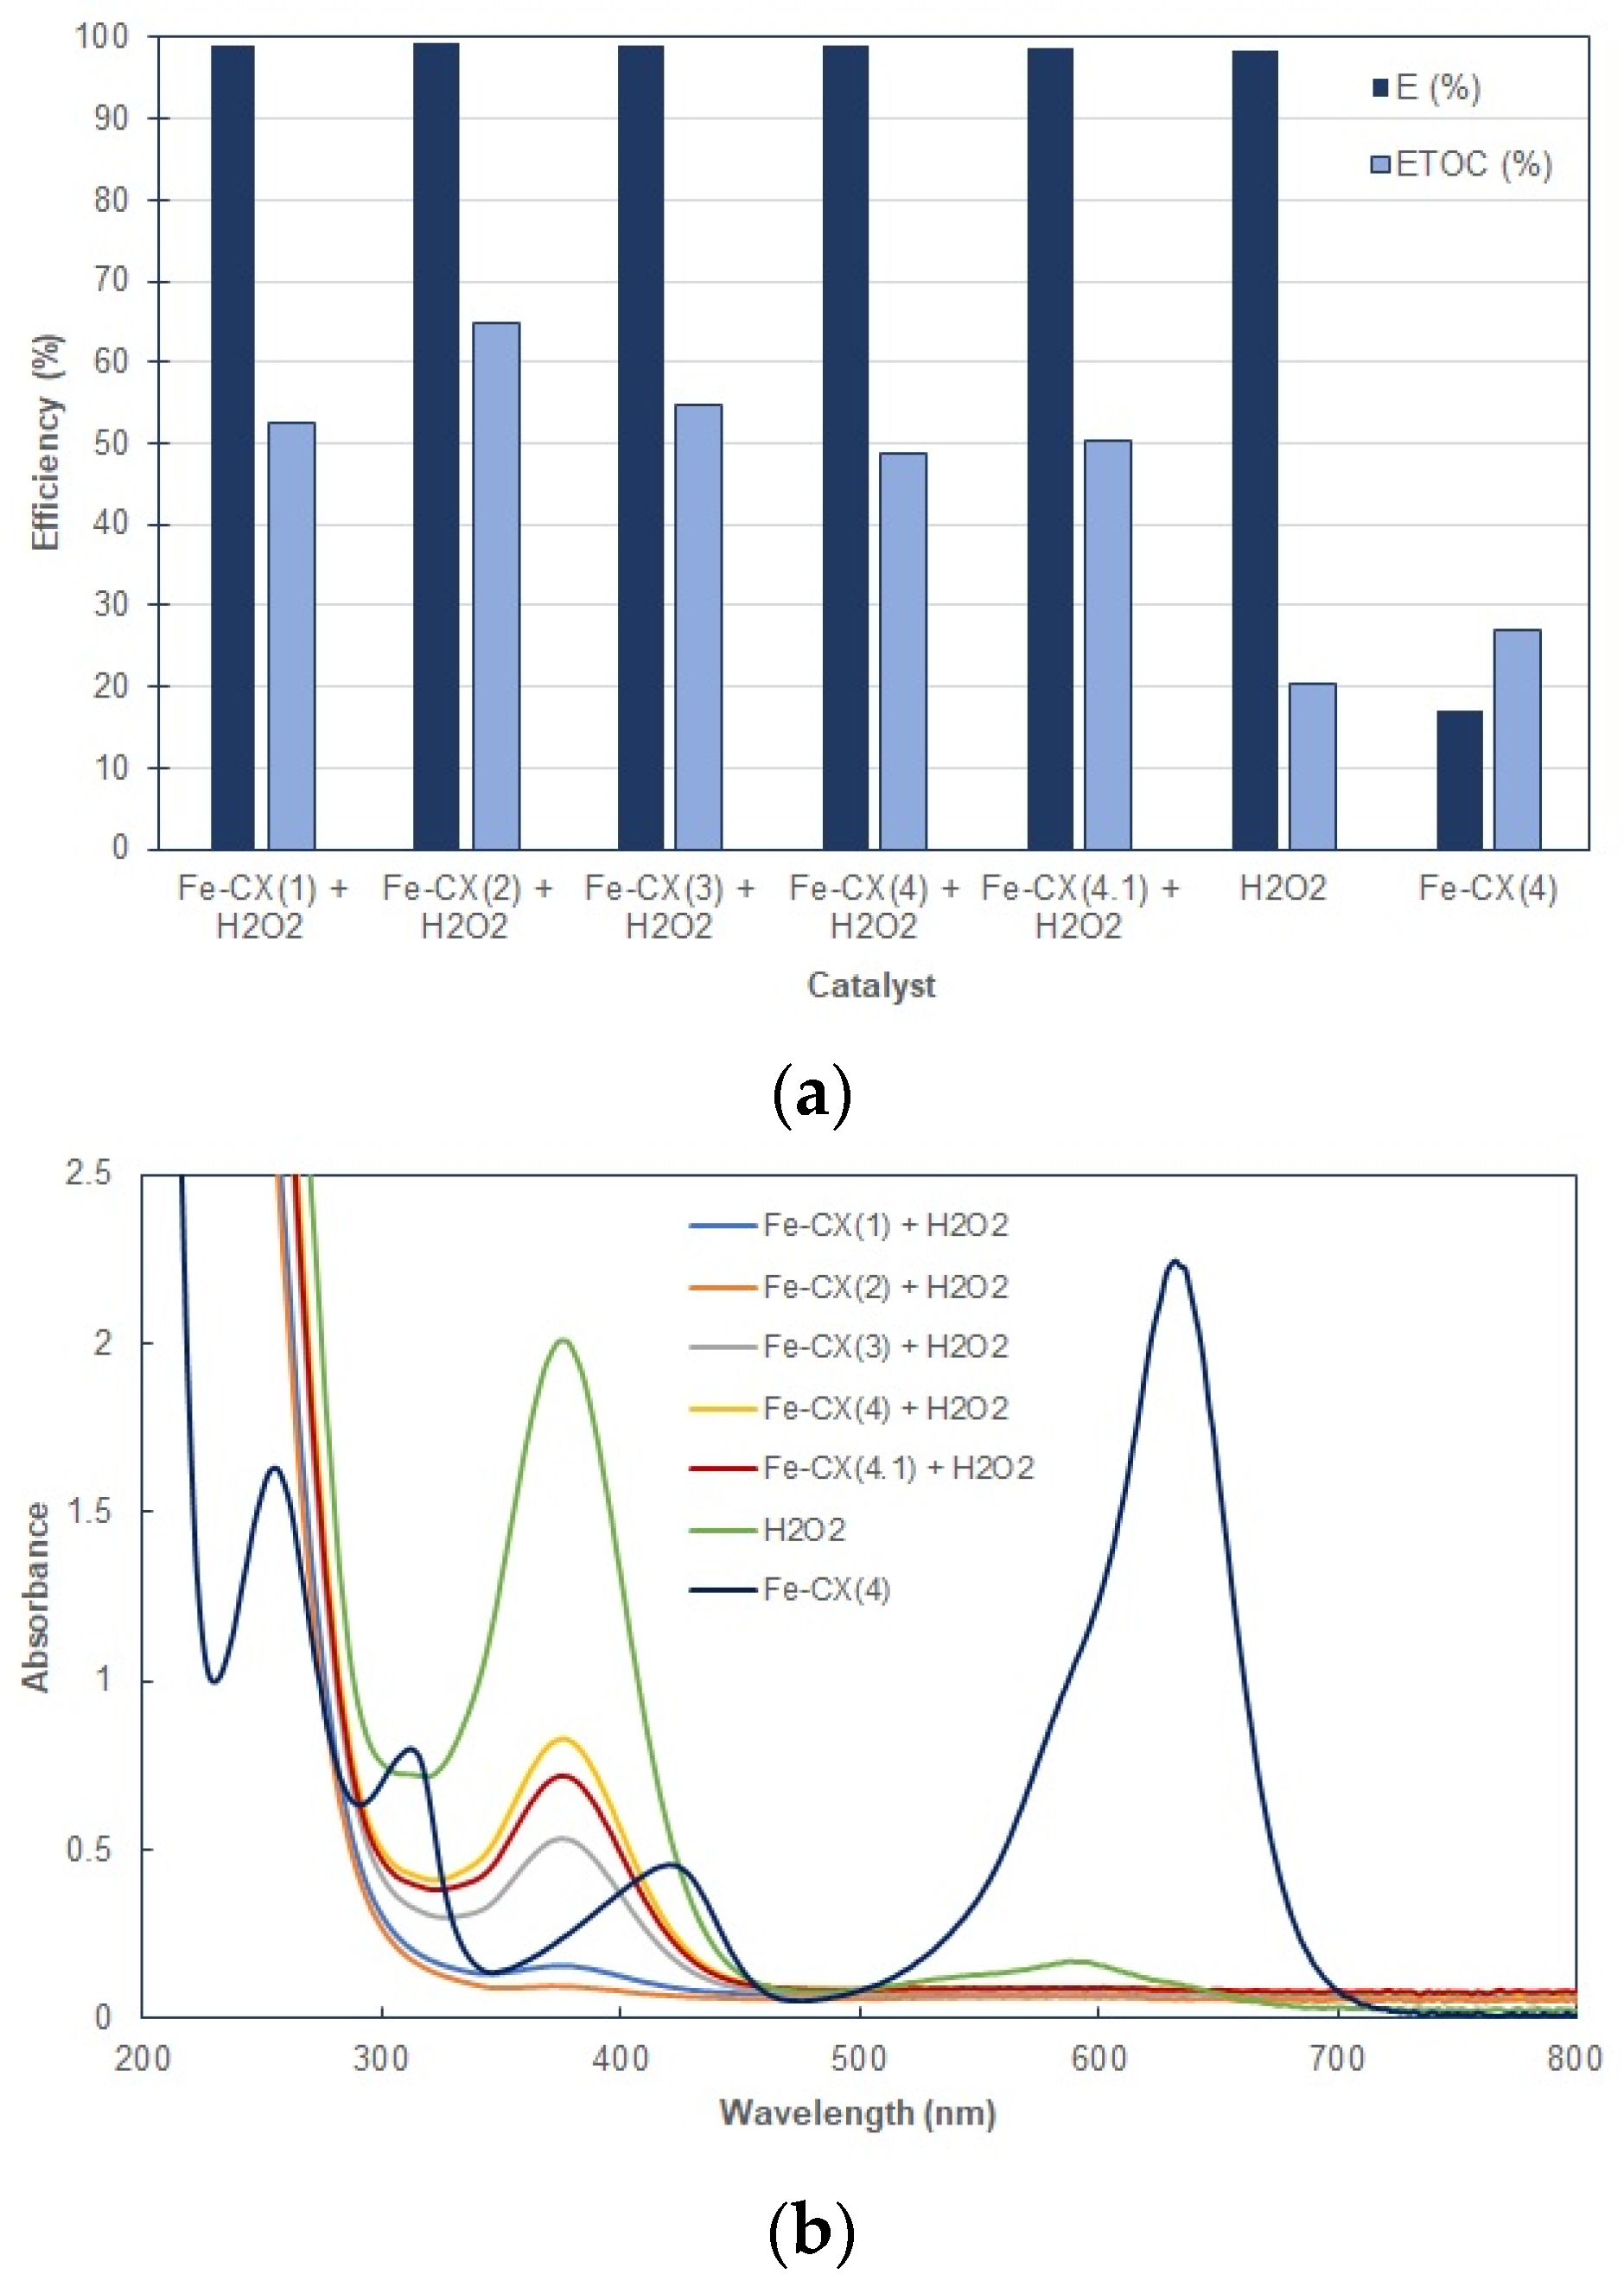
3.2. Dyes Oxidation Tests

Iron-doped carbon xerogel samples, prepared as described above, were tested in heterogeneous Fenton and CWAO processes. Experiments were conducted in the same conditions (see Section 2.4) for BG, CV, and MG dyes. The obtained results are presented in Figure 6, Figure 7 and Figure 8 for heterogeneous Fenton and Figure 9, Figure 10 and Figure 11 for CWAO (for UV-Vis spectra, *indicates a dilution coefficient of 10). E and ETOC (%) values are very well correlated with the iron content, decreasing with the amount of iron in the catalysts. Dye removal efficiencies up to 99% were obtained for all dyes and for both oxidation processes. In terms of total organic carbon efficiencies, the highest values were in the 50%–65% range for heterogeneous Fenton and in the 66%–92% range for CWAO. The CWAO results are very promising as the reaction took place under atmospheric pressure and at only 25 °C. The general trend observed was: Highest efficiencies for Fe-CX(1), Fe-CX(2), and Fe-CX(3) and between the three of them, for Fe-CX(2), the highest efficiency was recorded in most of the cases, in correlation with iron content (Table 2). For heterogeneous Fenton process, both E and ETOC % efficiency values decrease in the following order: MG > BG > CV for Fe-CX(2) catalyst. In the case of CWAO, E % values are very close to each other for the three dyes, 98.3%–98.8%, while ETOC % values decrease in the following order: BG > MG > CV.
In terms of oxidation process evolution, UV-Vis spectra indicated that chemical composition of the reaction mass changed dramatically as absorption maxima shifts from the visible region towards UV region as non-colored reaction intermediates start to form, especially in the case of heterogeneous Fenton. As maximum absorption peaks at 625, 584, and 631 nm for BG, CV, and MG, respectively, decreased drastically by the end of the oxidation process, a new absorption maximum was recorded in 200–250 nm region. In the case of MG, a second, higher absorption peak was recorded at about 375 nm. For the CWAO process, organic content considerably dropped, as shown in both UV and visible regions, with best results for BG and MG dyes.

3.3. Iron Leakage

Iron content was measured at the end of the reaction (3 h) for both processes. For heterogeneous Fenton process, most concentration values were under the limit of detection (LOD = 0.023 ppm) for the ICP-OES instrument used. For Fe-CX(1) and Fe-CX(2) samples, iron concentrations were under the limit of quantification (LOQ = 0.057 ppm). In the case of CWAO process, iron concentrations ranging from 0.100 to 1.644 ppm were recorded with the highest values for Fe-CX(1) and Fe-CX(2) catalysts.

4. Conclusions

Several iron-doped xerogel catalysts were successfully prepared. XRD, FTIR, SEM-EDX, and TEM investigations showed that iron as iron ferrierite and cohenite was imbedded in a carbon graphite matrix. The iron amount in the xerogel samples was strongly dependent upon the synthesis conditions, especially the water washing steps. The highest amount of iron was obtained for Fe-CX(2) sample when water was used to wash the organic gel prior to the ion exchange process. When water was used to wash the organic gel after the ion exchange process, the amount of iron drastically decreased, affecting the catalysts performances. Heterogeneous Fenton and CWAO results, E and ETOC % efficiencies obtained for all considered dyes, are in direct correlation with iron content.
Further investigations will consider optimum reaction conditions identifications, catalyst lifetime, and reuse, as well as mechanistic aspects of the oxidation processes.

Author Contributions

S.A.M.—investigation (design of synthesis process; iron-doped carbon xerogel synthesis; design, execution, and data analysis of oxidation experiments), manuscript writing (except FTIR and XRD), managed the study; B.M.—carbon xerogel and iron-doped carbon xerogel synthesis; R.S.—FTIR analysis, execution, and writing; L.B-T.—SEM-EDX and TEM analyses, execution; C.S.—XRD execution; and C.H.L.—XRD data analysis and writing.

Funding

This research received no external funding.

Acknowledgments

The authors would like to thank Nathan McElroy and graduate student Ann Fagbuyi, Department of Chemistry, Indiana University of Pennsylvania, for their help with ICP-OES analyses.

Conflicts of Interest

The authors declare no conflict of interest.

References

  1. Tehrani-Bagha, A.R.; Balchi, T. Catalytic wet peroxide oxidation. In Advanced Oxidation Processes for Wastewater Treatment; Ameta, S.C., Ameta, R., Eds.; Elsevier Inc.: Amsterdam, The Netherlands, 2018; pp. 375–402. [Google Scholar]
  2. Fu, J.; Kyzas, G.Z. Wet air oxidation for the decolorization of dye wastewater: An overview of the last two decades. Chin. J. Catal. 2014, 35, 1–7. [Google Scholar] [CrossRef]
  3. Kolaczkowski, S.T.; Plucinski, P.; Beltran, F.J.; Rivas, F.J.; McLurgh, D.B. Wet air oxidation: A review of process technologies and aspects in reactor design. Chem. Eng. J. 1999, 73, 143–160. [Google Scholar] [CrossRef]
  4. Wu, Q.; Hu, X.; Yue, P. Kinetics study on catalytic wet air oxidation of phenol. Chem. Eng. Sci. 2003, 58, 923–928. [Google Scholar] [CrossRef]
  5. Plesa Chicinas, R.; Gal, E.; Bedelean, H.; Darabantu, M.; Maicaneanu, A. Novel metal modified diatomite, zeolite and carbon xerogel catalysts for mild conditions wet air oxidation of phenol: Characterization, efficiency and reaction pathway. Sep. Purif. Technol. 2018, 197, 36–46. [Google Scholar] [CrossRef]
  6. Baldrian, P.; Merhautova, V.; Gabriel, J.; Nerud, F.; Stopka, P.; Hruby, M.; Benes, M.J. Decolorization of synthetic dyes by hydrogen peroxide with heterogeneous catalysis by mixed iron oxides. Appl. Catal. B Environ. 2006, 66, 258–264. [Google Scholar] [CrossRef]
  7. Unnu, B.A.; Gunduz, G.; Dukkanci, M. Heterogeneous Fenton-like oxidation of crystal violet using an iron loaded ZSM-5 zeolite. Desalin. Water Treat. 2015, 57, 1–15. [Google Scholar]
  8. Zhang, H.; Gao, H.; Cai, C.; Zhang, C.; Chen, L. Decolorization of crystal violet by ultrasound/heterogeneous Fenton process. Water Sci. Technol. 2013, 68, 2515–2520. [Google Scholar] [CrossRef]
  9. Ucoskia, G.M.; Machado, G.S.; Freitas Silva, G.; Nunes, F.S.; Wypych, F.; Nakagaki, S. Heterogeneous oxidation of the dye Brilliant Green with H2O2 catalyzed by supported manganese porphyrins. J. Molec. Catal. A Chem. 2015, 408, 123–131. [Google Scholar] [CrossRef]
  10. Rodriguez, A.; Ovejero, G.; Sotelo, J.L.; Mestanza, M.; Garcia, J. Heterogeneous Fenton catalyst supports screening for Mono Azo Dye degradation in contaminated wastewaters. Ind. Eng. Chem. Res. 2010, 49, 498–505. [Google Scholar] [CrossRef]
  11. Ovejero, G.; Rodriguez, A.; Vallet, A.; Willerich, S.; Garcia, J. Application of Ni supported over mixed Mg–Al oxides to crystal violet wet air oxidation: The role of the reaction conditions and the catalyst. Appl. Catal. B Environ. 2012, 111–112, 586–594. [Google Scholar] [CrossRef]
  12. Ovejero, G.; Rodriguez, A.; Vallet, A.; Garcia, J. Ni supported on Mg–Al oxides for continuous catalytic wet air oxidation of crystal violet. Appl. Catal. B Environ. 2012, 125, 166–171. [Google Scholar] [CrossRef]
  13. Ovejero, G.; Rodriguez, A.; Vallet, A.; Garcia, J. Intermediary products in the catalytic wet air oxidation of crystal violet with Ni/MgAlO as catalyst. Ind. Eng. Chem. Res. 2012, 51, 11367–11372. [Google Scholar] [CrossRef]
  14. Santos, A.; Yustos, P.; Rodriguez, S.; Garcia-Ochoa, F.; de Gracia, M. Decolorization of textile dyes by wet oxidation using activated carbon as catalyst. Ind. Eng. Chem. Res. 2007, 46, 2423–2427. [Google Scholar] [CrossRef]
  15. Rocha, R.P.; Soarez, O.S.G.P.; Goncalves, A.G.; Orfao, J.J.M.; Pereira, M.F.R.; Figueiredo, J.L. Different methodologies for synthesis of nitrogen doped carbon nanotubes and their use in catalytic wet air oxidation. Appl. Catal. A Gen. 2017, 548, 62–70. [Google Scholar] [CrossRef]
  16. Cybulski, A.; Trawczynski, J. Catalytic wet air oxidation of phenol over platinum and ruthenium catalysts. Appl. Catal. B Environ. 2004, 47, 1–13. [Google Scholar] [CrossRef]
  17. Liu, Y.; Sun, D.Z. Development of Fe2O3-CeO2-TiO2/γ-Al2O3 as catalyst for catalytic wet air oxidation of methyl orange azo dye under room condition. Appl. Catal. B Environ. 2007, 72, 205–211. [Google Scholar] [CrossRef]
  18. Zhang, Y.; Li, D.L.; Chen, Y.; Wang, X.H.; Wang, S.T. Catalytic wet air oxidation of dye pollutants by polyoxomolybdate nanotubes under room condition. Appl. Catal. B Environ. 2009, 86, 182–189. [Google Scholar] [CrossRef]
  19. Hua, L.; Ma, H.R.; Zhang, L. Degradation process analysis of the azo dyes by catalytic wet air oxidation with catalyst CuO/γ-Al2O3. Chemosphere 2013, 90, 143–149. [Google Scholar] [CrossRef]
  20. Bethi, B.; Sonawane, S.H.; Rohit, G.S.; Holkar, C.R.; Pinjari, D.V.; Bhanvase, B.A.; Pandit, A.B. Investigation of TiO2 photocatalyst performance for decolorization in the presence of hydrodynamic cavitation as hybrid AOP. Ultrason. Sonochem. 2016, 28, 150–160. [Google Scholar] [CrossRef]
  21. Lozovskyi, O.; Gunduz, G.; Dukkancib, M.; Prihodkoa, R. Preparation and characterization of silver or copper-doped TiO2 catalysts and their catalytic activity in dye degradation. Color. Technol. 2015, 131, 245–254. [Google Scholar] [CrossRef]
  22. Sood, S.; Umar, A.; Mehta, S.K.; Sinha, A.S.K.; Kamsal, S.K. Efficient photocatalytic degradation of brilliant green using Sr-doped TiO2 nanoparticles. Ceram. Int. 2015, 41, 3533–3540. [Google Scholar] [CrossRef]
  23. Hadjltaief, H.B.; Omri, A.; Ben Zina, M.; Da Costa, P.; Galvez, M.E. Titanium dioxide supported on different porous materials as photocatalyst for the degradation of methyl green in wastewaters. Adv. Mater. Sci. Eng. 2015, 2015, 759853. [Google Scholar] [CrossRef]
  24. Nezamzadeh-Ejhieh, A.; Shams-Ghahfarokhi, Z. Photodegradation of methyl green by Nickel-Dimethylglyoxime/ZSM-5 zeolite as a heterogeneous catalyst. J. Chem. 2013, 2013, 104093. [Google Scholar] [CrossRef]
  25. Yu, K.; Yang, S.; Liu, C.; Chen, H.; Li, H.; Sun, C.; Boyd, S.A. Degradation of organic dyes via bismuth silver oxide initiated direct oxidation coupled with sodium bismuthate based visible light photocatalysis. Environ. Sci. Technol. 2012, 46, 7318–7326. [Google Scholar] [CrossRef] [PubMed]
  26. Yin, J.; Cai, J.; Yin, C.; Gao, L.; Zhou, J. Degradation performance of crystal violet over CuO@AC and CeO2-CuO@AC catalysts using microwave catalytic oxidation degradation method. J. Environ. Chem. Eng. 2016, 4, 958–964. [Google Scholar] [CrossRef]
  27. Ju, Y.; Wang, X.; Qiao, J.; Li, G.; Wu, Y.; Li, Y.; Zhang, X.; Xu, Z.; Qi, J.; Fang, J.; et al. Could microwave induced catalytic oxidation (MICO) process over CoFe2O4 effectively eliminate brilliant green in aqueous solution? J. Hazard. Mater. 2013, 263, 600–609. [Google Scholar] [CrossRef] [PubMed]
  28. Zhang, L.; Su, M.; Guo, X. Studies on the treatment of brilliant green solution by combination microwave induced oxidation with CoFe2O4. Sep. Purif. Technol. 2008, 62, 458–463. [Google Scholar] [CrossRef]
  29. Zhang, L.; Liu, X.; Guo, X.; Su, M.; Xu, T.; Song, X. Investigation on the degradation of brilliant green induced oxidation by NiFe2O4 under microwave irradiation. Chem. Eng. J. 2011, 173, 737–742. [Google Scholar] [CrossRef]
  30. Plesa Chicinas, R.; Contet, C.L.; Maicaneanu, A.; Vasilescu, M.; Vulpoi, A. Preparation, characterization, and testing of metal-doped carbon xerogels as catalyst for phenol CWAO. Environ. Sci. Pollut. Res. 2017, 24, 2980–2986. [Google Scholar] [CrossRef] [PubMed]
  31. Alvarez, S.; Ribeiro, R.S.; Gomes, H.T.; Sotelo, J.L.; Garcia, J. Synthesis of carbon xerogels and their application in adsorption studies of caffeine and diclofenac as emerging contaminants. Chem. Eng. Res. Des. 2015, 95, 229–238. [Google Scholar] [CrossRef]
  32. Ribeiro, R.S.; Fathy, N.A.; Attia, A.A.; Silva, M.T.; Faria, J.L.; Gomes, H.T. Activated carbon xerogels for the removal of the anionic azo dyes Orange II and Chromotrope 2R by adsorption and catalytic wet peroxide oxidation. Chem. Eng. J. 2012, 195–196, 112–121. [Google Scholar] [CrossRef]
  33. Pinho, M.T.; Silva, A.M.T.; Hathy, N.A.; Attia, A.A.; Gomes, H.T.; Faria, J.L.; Pinho, M.T. Activated carbon xerogel–chitosan composite materials for 2 catalytic wet peroxide oxidation under intensified process conditions. J. Environ. Chem. Eng. 2015, 3, 1243–1251. [Google Scholar] [CrossRef]
  34. Ribeiro, R.S.; Silva, A.M.T.; Figueiredo, J.L.; Faria, J.L.; Gomes, H.T. The role of cobalt in bimetallic iron-cobalt magnetic carbon xerogels developed for catalytic wet peroxide oxidation. Catal. Today 2017, 296, 66–75. [Google Scholar] [CrossRef] [Green Version]
  35. Fathy, N.A.; Shouman, M.A.; Aboelenin, R.M.M. Nitrogen and phosphorous-doped porous carbon xerogels as metal-free catalysts for environmental catalytic peroxide oxidation of 4-nitrophenol. Asia Pac. J. Chem. Eng. 2016, 11, 836–845. [Google Scholar] [CrossRef]
  36. Fathy, N.A.; El-Khouly, S.M.; Hassan, N.A.; Awad, M.S. Free- and Ni-doped carbon xerogels catalysts for wet peroxide oxidation of methyl orange. J. Water Process Eng. 2017, 16, 21–27. [Google Scholar] [CrossRef]
  37. Rashwan, W.E.; Fathy, N.A.; Elkhouly, S.M. A novel catalyst of ceria-nanorods loaded on carbon xerogel for catalytic wet oxidation of methyl green dye. J. Taiwan Inst. Chem. Eng. 2018, 88, 234–242. [Google Scholar] [CrossRef]
  38. Sun, H.; Tian, H.; Hardjono, Y.; Buckley, C.E.; Wang, S. Preparation of cobalt/carbon-xerogel for heterogeneous oxidation of phenol. Catal. Today 2012, 186, 63–68. [Google Scholar] [CrossRef]
  39. Gomes, H.T.; Machado, B.F.; Ribeiro, A.; Moreira, I.; Rosario, A.; Silva, A.M.T.; Figueiredo, J.L.; Faria, J.L. Catalytic properties of carbon materials for wet oxidation of aniline. J. Hazard. Mater. 2008, 159, 420–426. [Google Scholar] [CrossRef] [PubMed]
  40. Apolinario, A.C.; Silva, A.M.T.; Macjado, B.F.; Gomes, H.T.; Araujo, P.P.; Figueiredo, J.L.; Faria, J.L. Wet air oxidation of nitro-aromatic compounds: Reactivity on single- and multi-component systems and surface chemistry studies with a carbon xerogel. Appl. Catal. B Environ. 2008, 84, 75–86. [Google Scholar] [CrossRef]
  41. De Moraes, N.C.; da Silva, M.L.C.P.; Rodriguez, L.A. Effect of metal doping in the photocatalytic properties of carbon xerogel-Nb2O5 composite towards visible light degradation of methylene blue. Mater. Lett. 2018, 228, 486–489. [Google Scholar] [CrossRef]
  42. Huang, Y.; Zhang, X.; Lei, L. Preparation, characterization and catalytic activity for ortho-dichlorobenzene ozonation of Fe-, Mn-Doped xerogels. Acta Phys. Chim. Sin. 2010, 26, 2443–2448. [Google Scholar]
  43. Osinska, M.; Krawczyk, P.; Rozmanowski, T.; Gurzeda, B. The electrochemical performance of carbon xerogels with the addition of graphite intercalation compound. Appl. Surf. Sci. 2009, 481, 545–553. [Google Scholar] [CrossRef]
  44. O’Rejlly, J.M.; Mosher, R.A. Functional groups in carbon black by FTIR spectroscopy. Carbon 1983, 21, 47–51. [Google Scholar]
  45. Selittiti, C.; Koenig, J.L.; Ishida, H. Surface characterization of graphitized carbon fibers by attenuated total reflection Fourier transform infrared spectroscopy. Carbon 1990, 28, 221–228. [Google Scholar] [CrossRef]
  46. Girgis, B.S.; Attia, A.A.; Fathy, N.A. Potential of nano-carbon xerogels in the remediation of dye-contaminated water discharges. Desalination 2011, 265, 169–176. [Google Scholar] [CrossRef]
Figure 1. Brilliant green (BG), crystal violet (CV), and methyl green (MG) dyes molecular structure and UV-Vis spectra of the initial solutions (* indicates a dilution coefficient of 10).
Chemengineering 03 00061 g001
Figure 2. XRD diffractograms for Fe-CX(1), Fe-CX(2), and Fe-CX(4) showing the impact of water washing before and after ion exchange process.
Chemengineering 03 00061 g002
Figure 3. 400–2000 cm−1 (a) and 2000–4000 cm−1 (b) regions of the FTIR spectra of CX ( Chemengineering 03 00061 i001), Fe-CX(1) ( Chemengineering 03 00061 i002), Fe-CX(2) ( Chemengineering 03 00061 i003), Fe-CX(3) ( Chemengineering 03 00061 i004), Fe-CX(4) ( Chemengineering 03 00061 i005), and Fe-CX(4.1) ( Chemengineering 03 00061 i006).
Chemengineering 03 00061 g003
Figure 4. Scanning electron microscopy-energy dispersive X-ray spectroscopy (SEM-EDX) analysis of CX, Fe-CX(2), and Fe-CX(4.1) samples.
Chemengineering 03 00061 g004
Figure 5. TEM images of (a) Fe-CX(2) and (b) Fe-CX(4) samples.
Chemengineering 03 00061 g005
Figure 6. Comparative E and ETOC efficiencies (a) and absorption UV-Vis spectra changes after 3 h (b) for BG oxidation (heterogeneous Fenton).
Chemengineering 03 00061 g006
Figure 7. Comparative E and ETOC efficiencies (a) and absorption UV-Vis spectra changes after 3 h (b) for CV oxidation (heterogeneous Fenton).
Chemengineering 03 00061 g007
Figure 8. Comparative E and ETOC efficiencies (a) and absorption UV-Vis spectra changes after 3 h (b) for MG oxidation (heterogeneous Fenton).
Chemengineering 03 00061 g008
Figure 9. Comparative E and ETOC efficiencies (a) and absorption UV-Vis spectra changes after 3 h (b) for BG CWAO.
Chemengineering 03 00061 g009
Figure 10. Comparative E and ETOC efficiencies (a) and absorption UV-Vis spectra changes after 3 h (b) for CV CWAO.
Chemengineering 03 00061 g010
Figure 11. Comparative E and ETOC efficiencies (a) and absorption UV-Vis spectra changes after 3 h (b) for MG CWAO.
Chemengineering 03 00061 g011
Table 1. Carbon xerogel and iron-doped carbon xerogel samples.
SampleEthanol WashWater Wash 1Iron ExchangeWater Wash 2
CXN/AN/AN/AN/A
Fe-CX(1)24 hN/A72 h **N/A
Fe-CX(2)24 h72 h *72 h **N/A
Fe-CX(3)24 h72 h *72 h **72 h *
Fe-CX(4)24 hN/A72 h **72 h *
Fe-CX(4.1)48 hN/A72 h **72 h *
* 250 mL 18.2 MΩ fresh water was used every 24 h; ** 150 mL fresh iron solution was used every 24 h.
Table 2. Carbon xerogel and iron-doped carbon xerogel samples EDX analysis, in wt% (average obtained from four surface areas).
CXFe-CX(1)Fe-CX(2)Fe-CX(3)Fe-CX(4)Fe-CX(4.1)
C54.789.490.094.095.595.0
Fe-7.07.32.81.21.6
O28.33.32.63.23.33.4
K *16.80.20.1---
Ar, Si, Al<0.2-----
* from K2CO3 used in sol-gel synthesis (see Section 2.2).

