Vapor Pressure Mapping of Ionic Liquids and Low-Volatility Fluids Using Graded Isothermal Thermogravimetric Analysis

 ,
, 
 and
and 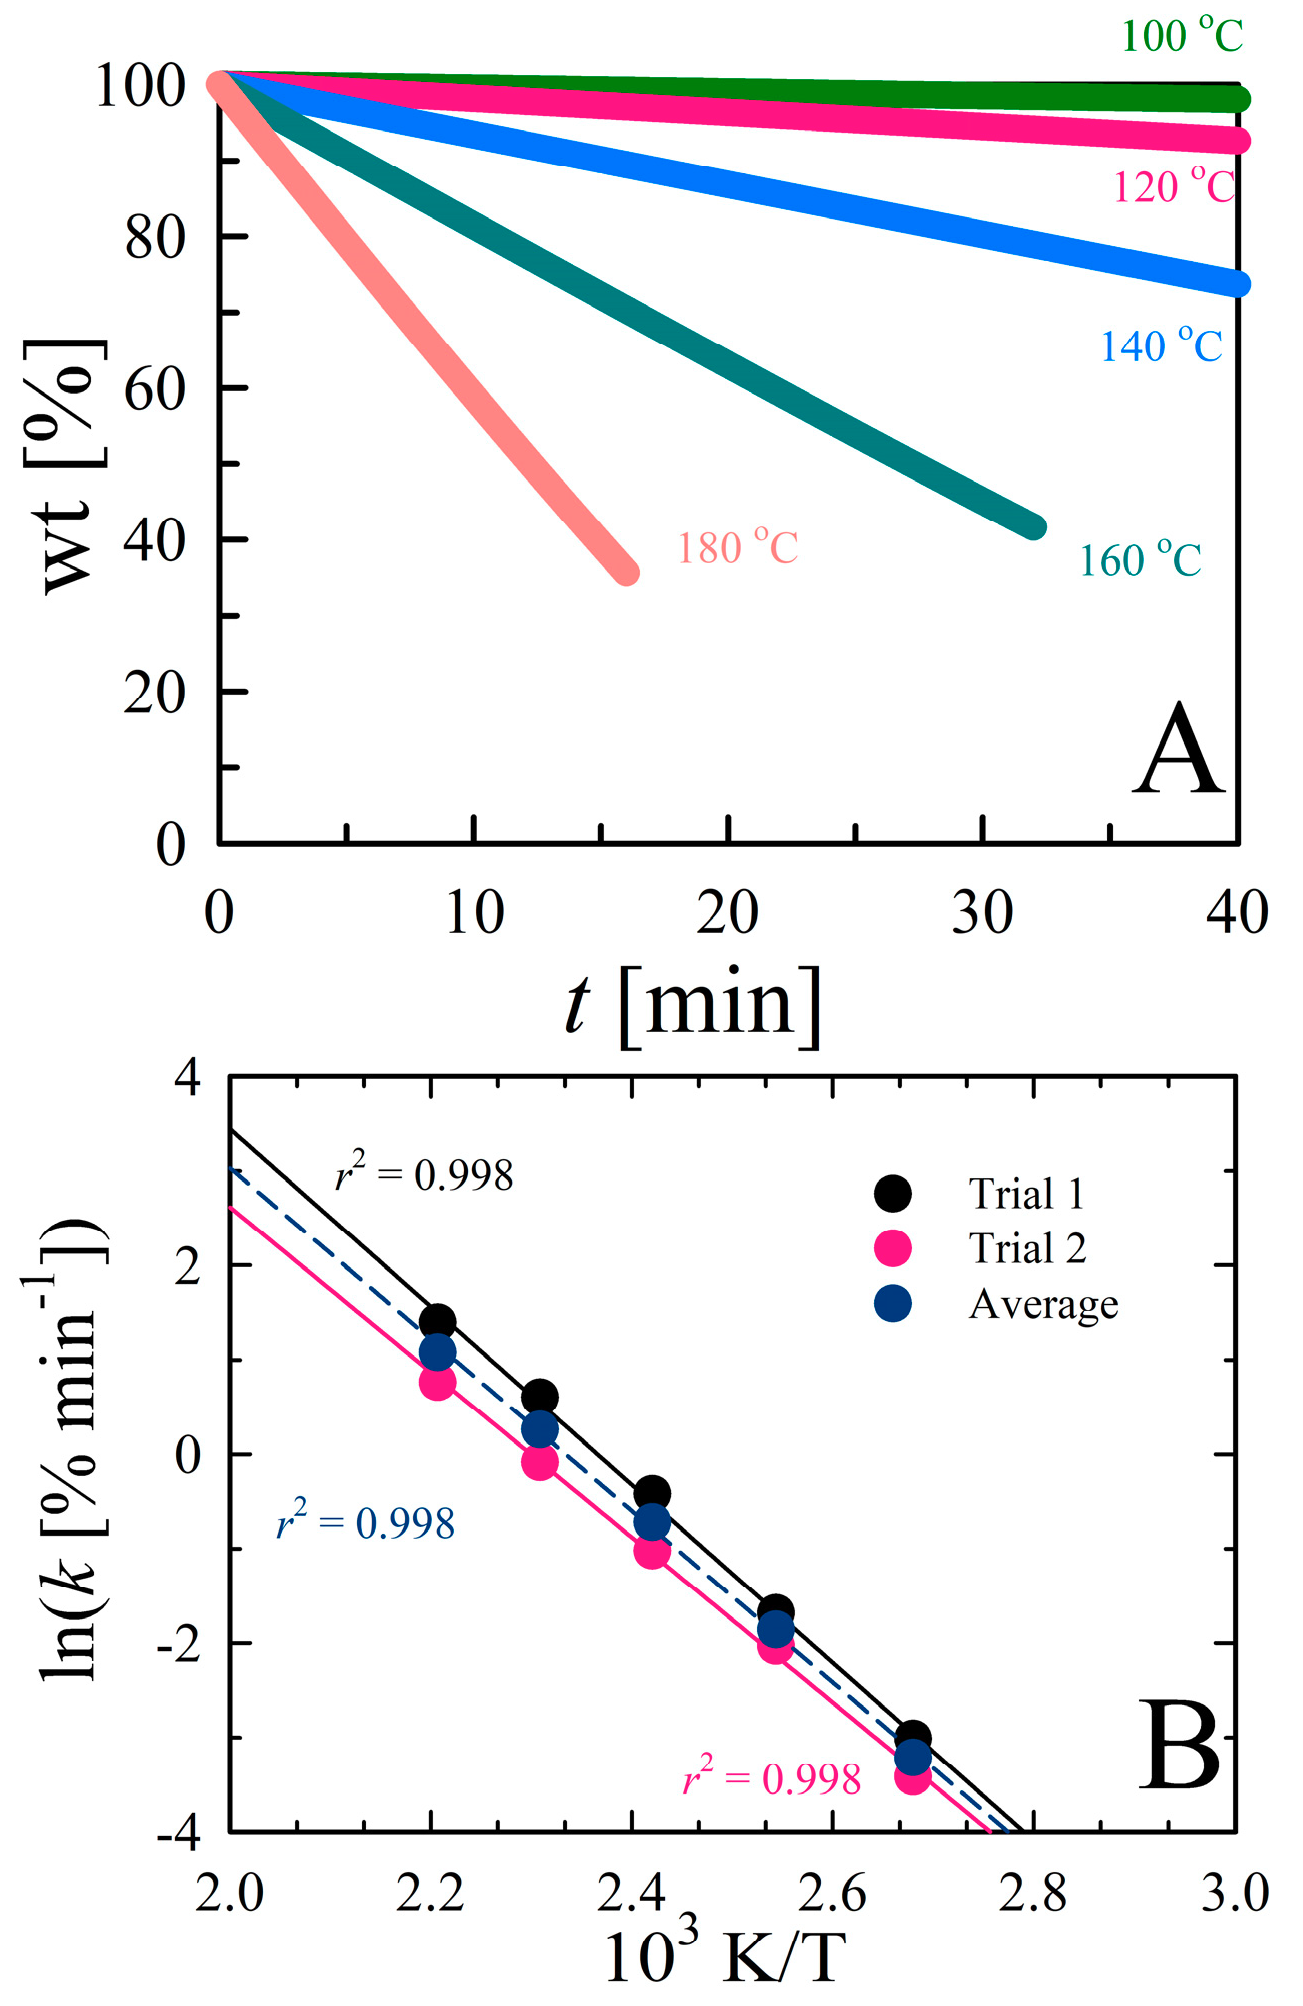
Abstract
1. Introduction
2. Materials and Methods
2.1. Materials
2.2. Vapor Pressure Measurements
2.3. Fluid Water Contents
3. Results and Discussion
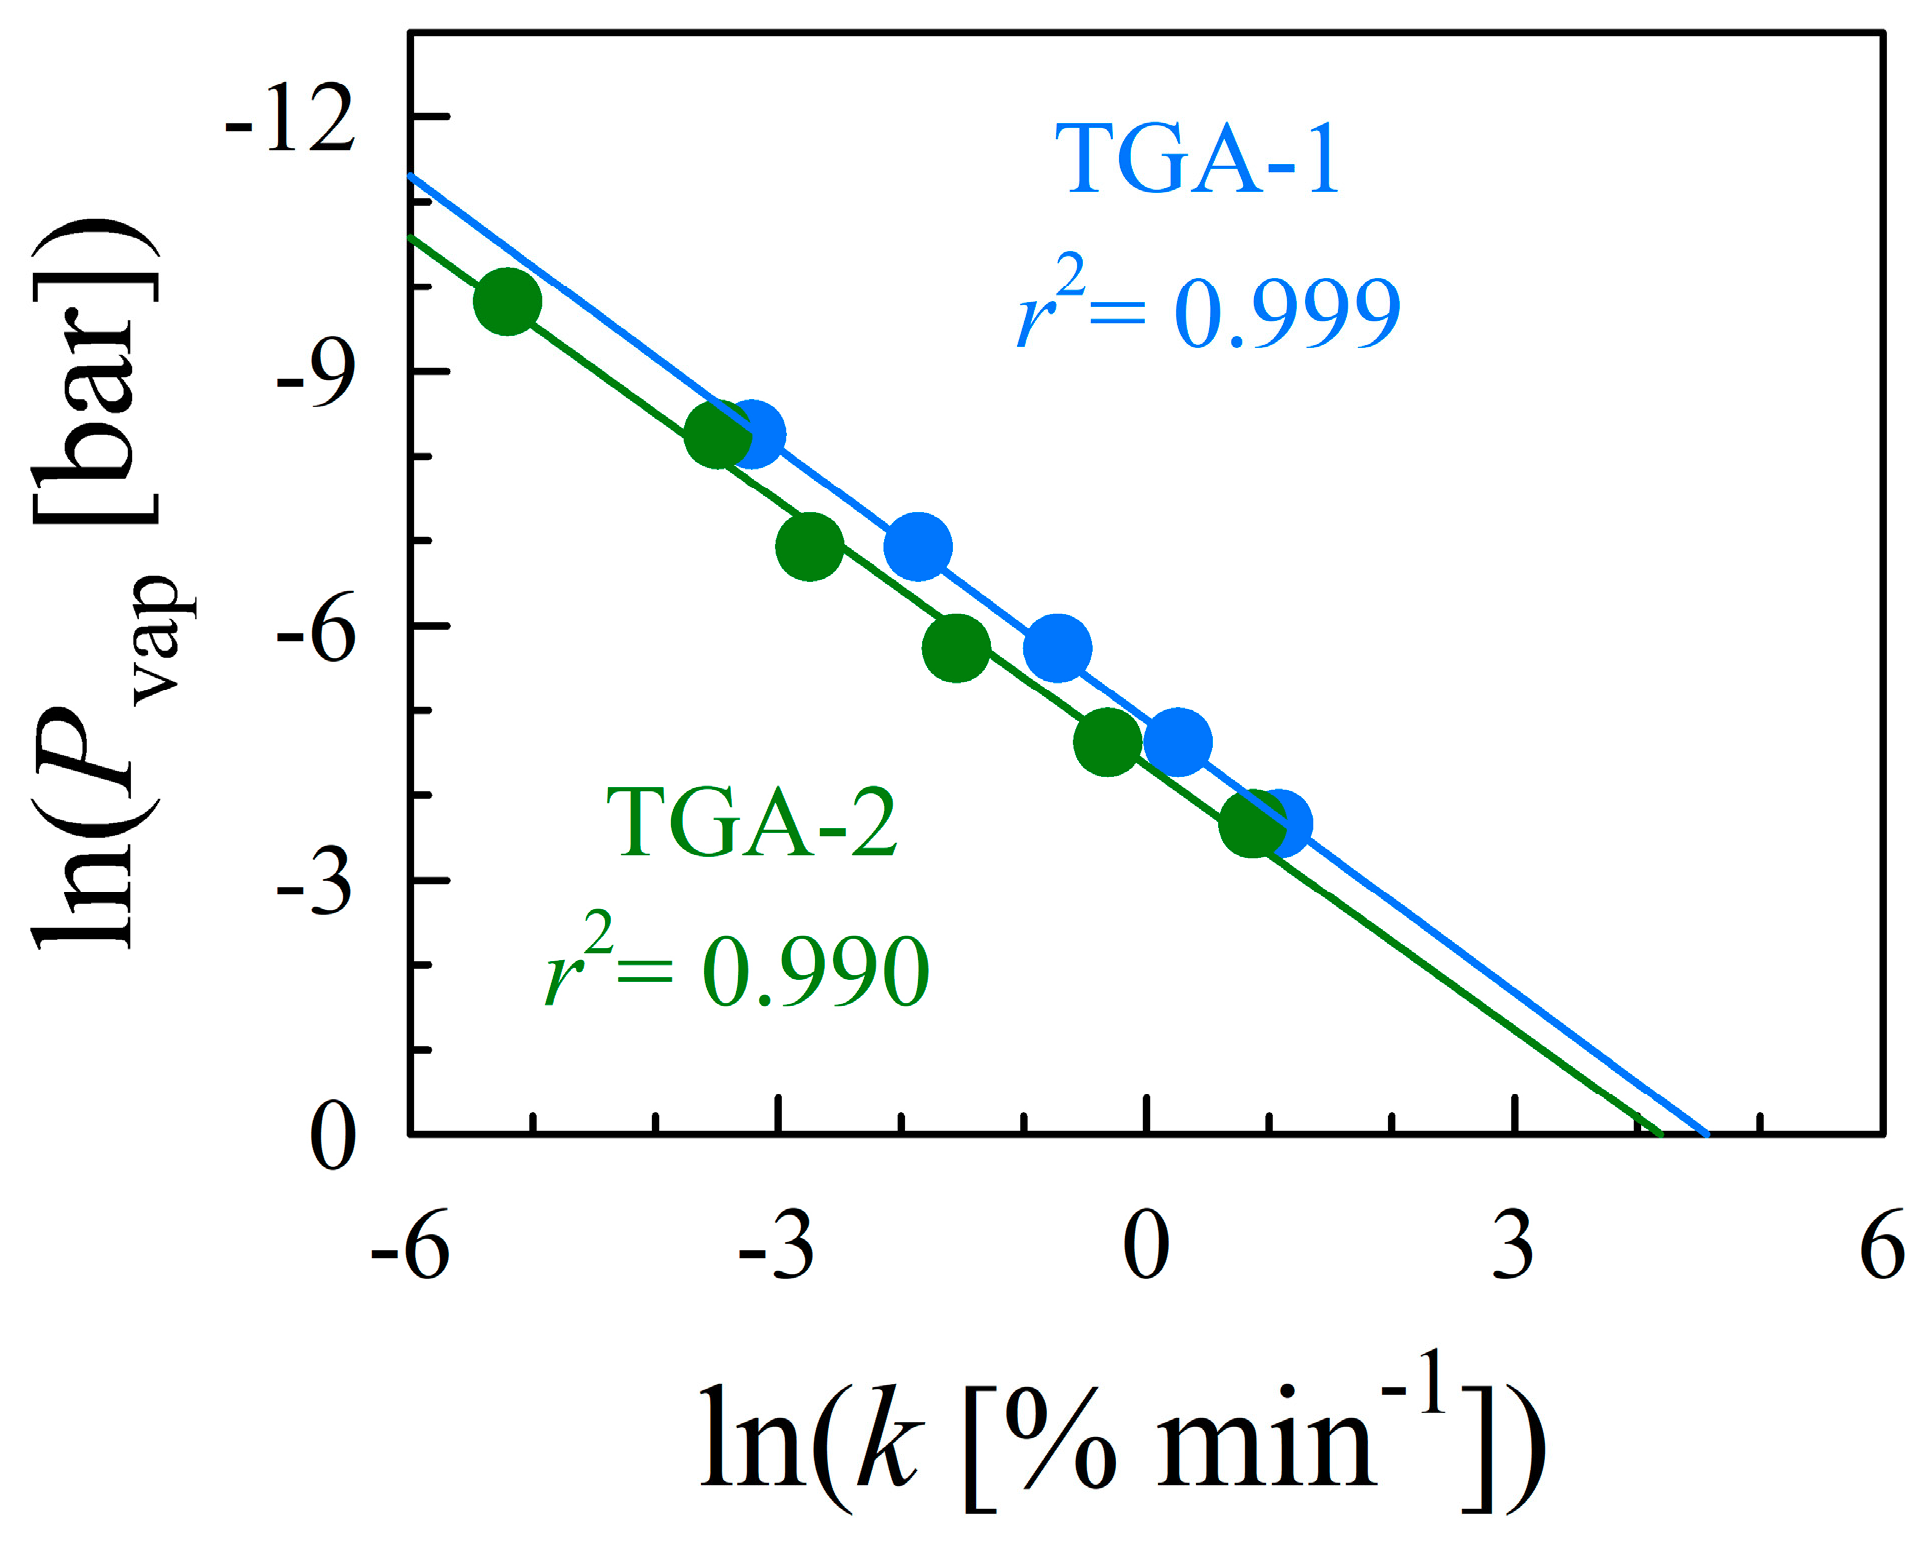
3.1. Vapor Pressure Determination for [C4mIm][Tf2N]
3.2. Effect of the Anion on IL Vapor Pressure
3.3. Effect of the Cation on IL Vapor Pressure
3.4. Vapor Pressure of Polyols
3.5. Vapor Pressure of DESs
3.6. Vapor Pressures of Protic ILs
4. Conclusions
Supplementary Materials
Author Contributions
Funding
Conflicts of Interest
References
- Baker, G.A.; Baker, S.N.; Pandey, S.; Bright, F.V. An Analytical View of Ionic Liquids. Analyst 2005, 130, 800–808. [Google Scholar] [CrossRef] [PubMed]
- Castner, E.W., Jr.; Margulis, C.J.; Maroncelli, M.; Wishart, J.F. Ionic Liquids: Structure and Photochemical Reactions. Annu. Rev. Phys. Chem. 2011, 62, 85–105. [Google Scholar] [CrossRef] [PubMed]
- Rogers, R.D.; Seddon, K.R. Ionic Liquids–Solvents of the Future? Science 2003, 302, 792–793. [Google Scholar] [CrossRef] [PubMed]
- Wishart, J.F. Energy Applications of Ionic Liquids. Energy Environ. Sci. 2009, 2, 956–961. [Google Scholar] [CrossRef]
- Tang, S.; Baker, G.A.; Zhao, H. Ether- and Alcohol-Functionalized Task-Specific Ionic Liquids: Attractive Properties and Applications. Chem. Soc. Rev. 2012, 41, 4030–4066. [Google Scholar] [PubMed]
- Rebelo, L.P.N.; Canongia Lopes, J.N.; Esperança, J.M.S.S.; Filipe, E. On the Critical Temperature, Normal Boiling Point, and Vapor Pressure of Ionic Liquids. J. Phys. Chem. B 2005, 109, 6040–6043. [Google Scholar] [CrossRef]
- Earle, M.J.; Esperanca, J.M.S.S.; Gilea, M.A.; Canongia Lopes, J.N.; Rebelo, L.P.N.; Magee, J.W.; Seddon, K.R.; Widegren, J.A. The Distillation and Volatility of Ionic Liquids. Nature 2006, 439, 831–834. [Google Scholar] [CrossRef]
- Esperança, J.M.S.S.; Canongia Lopes, J.N.; Tariq, M.; Santos, L.M.N.B.F.; Magee, J.W.; Rebelo, L.P.N. Volatility of Aprotic Ionic Liquids—A Review. J. Chem. Eng. Data 2010, 55, 3–12. [Google Scholar] [CrossRef]
- Ludwig, R.; Kragl, U. Do We Understand the Volatility of Ionic Liquids? Angew. Chem. Int. Ed. 2007, 46, 6582–6584. [Google Scholar] [CrossRef]
- Paulechka, Y.U.; Zaitsau, D.H.; Kabo, G.J.; Strechan, A.A. Vapor Pressure and Thermal Stability of Ionic Liquid 1-Butyl-3-methylimidazolium Bis(trifluoromethylsulfonyl)amide. Thermochim. Acta 2005, 439, 158–160. [Google Scholar] [CrossRef]
- Zaitsau, D.H.; Kabo, G.J.; Strechan, A.A.; Paulechka, Y.U.; Tschersich, A.; Verevkin, S.P.; Heintz, A. Experimental Vapor Pressures of 1-Alkyl-3-methylimidazolium Bis(trifluoromethylsulfonyl)imides and a Correlation Scheme for Estimation of Vaporization Enthalpies of Ionic Liquids. J. Phys. Chem. A 2006, 110, 7303–7306. [Google Scholar] [CrossRef]
- Widegren, J.A.; Wang, Y.-M.; Henderson, W.A.; Magee, J.W. Relative Volatilities of Ionic Liquids by Vacuum Distillation of Mixtures. J. Phys. Chem. B 2007, 111, 8959–8964. [Google Scholar] [CrossRef]
- Luo, H.; Baker, G.A.; Dai, S. Isothermogravimetric Determination of the Enthalpies of Vaporization of 1-Alkyl-3-methylimidazolium Ionic Liquids. J. Phys. Chem. B 2008, 112, 10077–10081. [Google Scholar] [CrossRef] [PubMed]
- Verevkin, S.P.; Zaitsau, D.H.; Emelyanenko, V.N.; Heintz, A. A New Method for the Determination of Vaporization Enthalpies of Ionic Liquids at Low Temperatures. J. Phys. Chem. B 2011, 115, 12889–12895. [Google Scholar] [CrossRef]
- Ludwig, R. Thermodynamic Properties of Ionic Liquids-A Cluster Approach. Phys. Chem. Chem. Phys. 2008, 10, 4333–4339. [Google Scholar] [CrossRef] [PubMed]
- Emel’yanenko, V.N.; Verevkin, S.P.; Heintz, A. The Gaseous Enthalpy of Formation of the Ionic Liquid 1-Butyl-3-methylimidazolium Dicyanamide from Combustion Calorimetry, Vapor Pressure Measurements, and Ab Initio Calculations. J. Am. Chem. Soc. 2007, 129, 3930–3937. [Google Scholar] [CrossRef] [PubMed]
- Armstrong, J.P.; Hurst, C.; Jones, R.G.; Licence, P.; Lovelock, K.R.J.; Satterley, C.J.; Villar-Garcia, I.J. Vapourisation of Ionic Liquids. Phys. Chem. Chem. Phys. 2007, 9, 982–990. [Google Scholar] [CrossRef] [PubMed]
- Dong, K.; Zhao, L.; Wang, Q.; Song, Y.; Zhang, S. Are Ionic Liquids Pairwise in Gas Phase? A Cluster Approach and In situ IR Study. Phys. Chem. Chem. Phys. 2013, 15, 6034–6040. [Google Scholar] [CrossRef]
- Sze, L.L.; Pandey, S.; Ravula, S.; Pandey, S.; Zhao, H.; Baker, G.A.; Baker, S.N. Ternary Deep Eutectic Solvents Tasked for Carbon Dioxide Capture. ACS Sustain. Chem. Eng. 2014, 2, 2117–2123. [Google Scholar] [CrossRef]
- Wagle, D.V.; Zhao, H.; Baker, G.A. Deep Eutectic Solvents: Sustainable Media for Nanoscale and Functional Materials. Acc. Chem. Res. 2014, 47, 2299–2308. [Google Scholar] [CrossRef]
- Wu, S.-H.; Caparanga, A.R.; Leron, R.B.; Li, M.-H. Vapor Pressure of Aqueous Choline Chloride-Based Deep Eutectic Solvents (ethaline, glyceline, maline and reline) at 30–70 °C. Thermochim. Acta 2012, 544, 1–5. [Google Scholar] [CrossRef]
- Boisset, A.; Jacquemin, J.; Anouti, M. Physical Properties of a New Deep Eutectic Solvent Based on Lithium Bis[(trifluoromethyl)sulfonyl]imide and N-methylacetamide as Superionic Suitable Electrolyte for Lithium Ion Batteries and Electric Double Layer Capacitors. Electrochim. Acta 2013, 102, 120–126. [Google Scholar] [CrossRef]
- Shahbaz, K.; Mjalli, F.S.; Vakili-Nezhaad, G.; AlNashef, I.M.; Asadov, A.; Farid, M.M. Thermogravimetric Measurement of Deep Eutectic Solvents Vapor Pressure. J. Mol. Liq. 2016, 222, 61–66. [Google Scholar] [CrossRef]
- Deyko, A.; Hessey, S.G.; Licence, P.; Chernikova, E.A.; Krasovskiy, V.G.; Kustov, L.M.; Jones, R.G. The Enthalpies of Vaporisation of Ionic Liquids: New Measurements and Predictions. Phys. Chem. Chem. Phys. 2012, 14, 3181–3193. [Google Scholar] [CrossRef]
- Wang, C.; Luo, H.; Li, H.; Dai, S. Direct UV-Spectroscopic Measurement of Selected Ionic-Liquid Vapors. Phys. Chem. Chem. Phys. 2010, 12, 7246–7250. [Google Scholar] [CrossRef]
- Rocha, M.A.A.; Lima, C.F.R.A.C.; Gomes, L.R.; Schröder, B.; Coutinho, J.A.P.; Marrucho, I.M.; Esperança, J.M.S.S.; Rebelo, L.P.N.; Shimizu, K.; Lopes, J.N.C.; et al. High-Accuracy Vapor Pressure Data of the Extended [CnC1im][NTf2] Ionic Liquid Series: Trend Changes and Structural Shifts. J. Phys. Chem. B 2011, 115, 10919–10926. [Google Scholar] [CrossRef]
- Santos, L.M.N.B.F.; Canongia Lopes, J.N.; Coutinho, J.A.P.; Esperança, J.M.S.S.; Gomes, L.R.; Marrucho, I.M.; Rebelo, L.P.N. Ionic Liquids: First Direct Determination of their Cohesive Energy. J. Am. Chem. Soc. 2007, 129, 284–285. [Google Scholar] [CrossRef] [PubMed]
- Verevkin, S.P.; Zaitseva, K.V.; Stanton, A.D.; Hindman, M.S.; Irvin, A.C.; Bara, J.E. Building Blocks for Ionic Liquids: Vapor Pressures and Vaporization Enthalpies of N-Functionalized Imidazoles with Branched and Cycloalkyl Substituents. Ind. Eng. Chem. Res. 2015, 54, 9850–9856. [Google Scholar] [CrossRef]
- Aschenbrenner, O.; Supasitmongkol, S.; Taylor, M.; Styring, P. Measurement of Vapour Pressures of Ionic Liquids and Other Low Vapour Pressure Solvents. Green Chem. 2009, 11, 1217–1221. [Google Scholar] [CrossRef]
- Verevkin, S.P.; Ralys, R.V.; Zaitsau, D.H.; Emel’yanenko, V.N.; Schick, C. Express Thermo-Gravimetric Method for the Vaporization Enthalpies Appraisal for Very Low Volatile Molecular and Ionic Compounds. Thermochim. Acta 2012, 538, 55–62. [Google Scholar] [CrossRef]
- Deyko, A.; Lovelock, K.R.J.; Corfield, J.-A.; Taylor, A.W.; Gooden, P.N.; Villar-Garcia, I.J.; Licence, P.; Jones, R.G.; Krasovskiy, V.G.; Chernikova, E.A.; et al. Measuring and Predicting ΔvapH298 Values of Ionic Liquids. Phys. Chem. Chem. Phys. 2009, 11, 8544–8555. [Google Scholar] [CrossRef]
- Zaitsau, D.H.; Yermalayeu, A.V.; Emel’yanenko, V.N.; Heintz, A.; Verevkin, S.P.; Schick, C.; Berdzinski, S.; Strehmel, V. Structure–property Relationships in ILs: Vaporization Enthalpies of Pyrrolidinium Based Ionic Liquids. J. Mol. Liq. 2014, 192, 171–176. [Google Scholar] [CrossRef]
- Jin, H.; O’Hare, B.; Dong, J.; Arzhantsev, S.; Baker, G.A.; Wishart, J.F.; Benesi, A.J.; Maroncelli, M. Physical Properties of Ionic Liquids Consisting of the 1-Butyl-3-Methylimidazolium Cation with Various Anions and the Bis(trifluoromethylsulfonyl)imide Anion with Various Cations. J. Phys. Chem. B 2008, 112, 81–92. [Google Scholar] [CrossRef]
- Gückel, W.; Kästel, R.; Kröhl, T.; Parg, A. Methods for Determining the Vapour Pressure of Active Ingredients Used in Crop Protection. Part IV. An Improved Thermogravimetric Determination Based on Evaporation Rate. Pestic. Sci. 1995, 45, 27–31. [Google Scholar] [CrossRef]
- Gückel, W.; Kästel, R.; Lewerenz, J.; Synnatschke, G. A Method for Determining the Volatility of Active Ingredients used in Plant Protection. Part III: The Temperature Relationship Between Vapour Pressure and Evaporation Rate. Pestic. Sci. 1982, 13, 161–168. [Google Scholar] [CrossRef]
- Elder, J.P. Sublimation Measurements of Pharmaceutical Compounds by Isothermal Thermogravivletry. J. Therm. Anal. 1997, 49, 897–905. [Google Scholar] [CrossRef]
- Yan, W.; Suppes, G.J. Vapor Pressures and Evaporation Studies of Sugars and Sugar Alcohols. J. Chem. Eng. Data 2008, 53, 2033–2040. [Google Scholar] [CrossRef]
- Wright, S.F.; Dollimore, D.; Dunn, J.G.; Alexander, K. Determination of the Vapor Pressure Curves of Adipic Acid and Triethanolamine using Thermogravimetric Analysis. Thermochim. Acta 2004, 421, 25–30. [Google Scholar] [CrossRef]
- Association, G.P. Physical Properties of Glycerine and Its Solutions; Glycerine Producers’ Association: New York, NY, USA, 1963. [Google Scholar]
- Brunetti, B.; Ciccioli, A.; Gigli, G.; Lapi, A.; Misceo, N.; Tanzi, L.; Vecchio Ciprioti, S. Vaporization of the Prototypical Ionic Liquid BMImNTf2 under Equilibrium Conditions: A Multitechnique Study. Phys. Chem. Chem. Phys. 2014, 16, 15653–15661. [Google Scholar] [CrossRef] [PubMed]
- Tokuda, H.; Ishii, K.; Susan, M.A.B.H.; Tsuzuki, S.; Hayamizu, K.; Watanabe, M. Physicochemical Properties and Structures of Room-Temperature Ionic Liquids. 3. Variation of Cationic Structures. J. Phys. Chem. B 2006, 110, 2833–2839. [Google Scholar] [CrossRef]
- Tokuda, H.; Tsuzuki, S.; Susan, M.A.B.H.; Hayamizu, K.; Watanabe, M. How Ionic Are Room-Temperature Ionic Liquids? An Indicator of the Physicochemical Properties. J. Phys. Chem. B 2006, 110, 19593–19600. [Google Scholar] [CrossRef] [PubMed]
- Tokuda, H.; Hayamizu, K.; Ishii, K.; Susan, M.A.B.H.; Watanabe, M. Physicochemical Properties and Structures of Room Temperature Ionic Liquids. 1. Variation of Anionic Species. J. Phys. Chem. B 2004, 108, 16593–16600. [Google Scholar] [CrossRef]
- Lovelock, K.R.J.; Deyko, A.; Corfield, J.-A.; Gooden, P.N.; Licence, P.; Jones, R.G. Vaporisation of a Dicationic Ionic Liquid. ChemPhysChem 2009, 10, 337–340. [Google Scholar] [CrossRef]
- Jessop, P.G.; Jessop, D.A.; Fu, D.; Phan, L. Solvatochromic Parameters for Solvents of Interest in Green Chemistry. Green Chem. 2012, 14, 1245–1259. [Google Scholar] [CrossRef]
- Organization, I.L. The International Chemical Safety Cards Database. Available online: https://www.ilo.org/dyn/icsc/showcard.listCards3?p_lang=en (accessed on 3 January 2017).
- Ueno, K.; Yoshida, K.; Tsuchiya, M.; Tachikawa, N.; Dokko, K.; Watanabe, M. Glyme–Lithium Salt Equimolar Molten Mixtures: Concentrated Solutions or Solvate Ionic Liquids? J. Phys. Chem. B 2012, 116, 11323–11331. [Google Scholar] [CrossRef]
- Kelkar, M.S.; Maginn, E.J. Calculating the Enthalpy of Vaporization for Ionic Liquid Clusters. J. Phys. Chem. B 2007, 111, 9424–9427. [Google Scholar] [CrossRef]
- Pandey, A.; Pandey, S. Solvatochromic Probe Behavior within Choline Chloride-Based Deep Eutectic Solvents: Effect of Temperature and Water. J. Phys. Chem. B 2014, 118, 14652–14661. [Google Scholar] [CrossRef]
- Greaves, T.L.; Drummond, C.J. Protic Ionic Liquids: Properties and Applications. Chem. Rev. 2008, 108, 206–237. [Google Scholar] [CrossRef]
- MacFarlane, D.R.; Tachikawa, N.; Forsyth, M.; Pringle, J.M.; Howlett, P.C.; Elliott, G.D.; Davis, J.H.; Watanabe, M.; Simon, P.; Angell, C.A. Energy Applications of Ionic Liquids. Energy Environ. Sci. 2014, 7, 232–250. [Google Scholar] [CrossRef]
- Emel’yanenko, V.N.; Boeck, G.; Verevkin, S.P.; Ludwig, R. Volatile Times for the Very First Ionic Liquid: Understanding the Vapor Pressures and Enthalpies of Vaporization of Ethylammonium Nitrate. Chem. Eur. J. 2014, 20, 11594. [Google Scholar] [CrossRef]
- Capelo, S.B.; Méndez-Morales, T.; Carrete, J.; López Lago, E.; Vila, J.; Cabeza, O.; Rodríguez, J.R.; Turmine, M.; Varela, L.M. Effect of Temperature and Cationic Chain Length on the Physical Properties of Ammonium Nitrate-Based Protic Ionic Liquids. J. Phys. Chem. B 2012, 116, 11302–11312. [Google Scholar] [CrossRef] [PubMed]


© 2019 by the authors. Licensee MDPI, Basel, Switzerland. This article is an open access article distributed under the terms and conditions of the Creative Commons Attribution (CC BY) license (http://creativecommons.org/licenses/by/4.0/).
Share and Cite
Ravula, S.; Larm, N.E.; Mottaleb, M.A.; Heitz, M.P.; Baker, G.A. Vapor Pressure Mapping of Ionic Liquids and Low-Volatility Fluids Using Graded Isothermal Thermogravimetric Analysis. ChemEngineering 2019, 3, 42. https://doi.org/10.3390/chemengineering3020042
Ravula S, Larm NE, Mottaleb MA, Heitz MP, Baker GA. Vapor Pressure Mapping of Ionic Liquids and Low-Volatility Fluids Using Graded Isothermal Thermogravimetric Analysis. ChemEngineering. 2019; 3(2):42. https://doi.org/10.3390/chemengineering3020042
Chicago/Turabian StyleRavula, Sudhir, Nathaniel E. Larm, Mohammad A. Mottaleb, Mark P. Heitz, and Gary A. Baker. 2019. "Vapor Pressure Mapping of Ionic Liquids and Low-Volatility Fluids Using Graded Isothermal Thermogravimetric Analysis" ChemEngineering 3, no. 2: 42. https://doi.org/10.3390/chemengineering3020042
APA StyleRavula, S., Larm, N. E., Mottaleb, M. A., Heitz, M. P., & Baker, G. A. (2019). Vapor Pressure Mapping of Ionic Liquids and Low-Volatility Fluids Using Graded Isothermal Thermogravimetric Analysis. ChemEngineering, 3(2), 42. https://doi.org/10.3390/chemengineering3020042