Experimental Investigation of the Gas/Liquid Phase Separation Using a Membrane-Based Micro Contactor


Abstract
1. Introduction
2. Theoretical Background
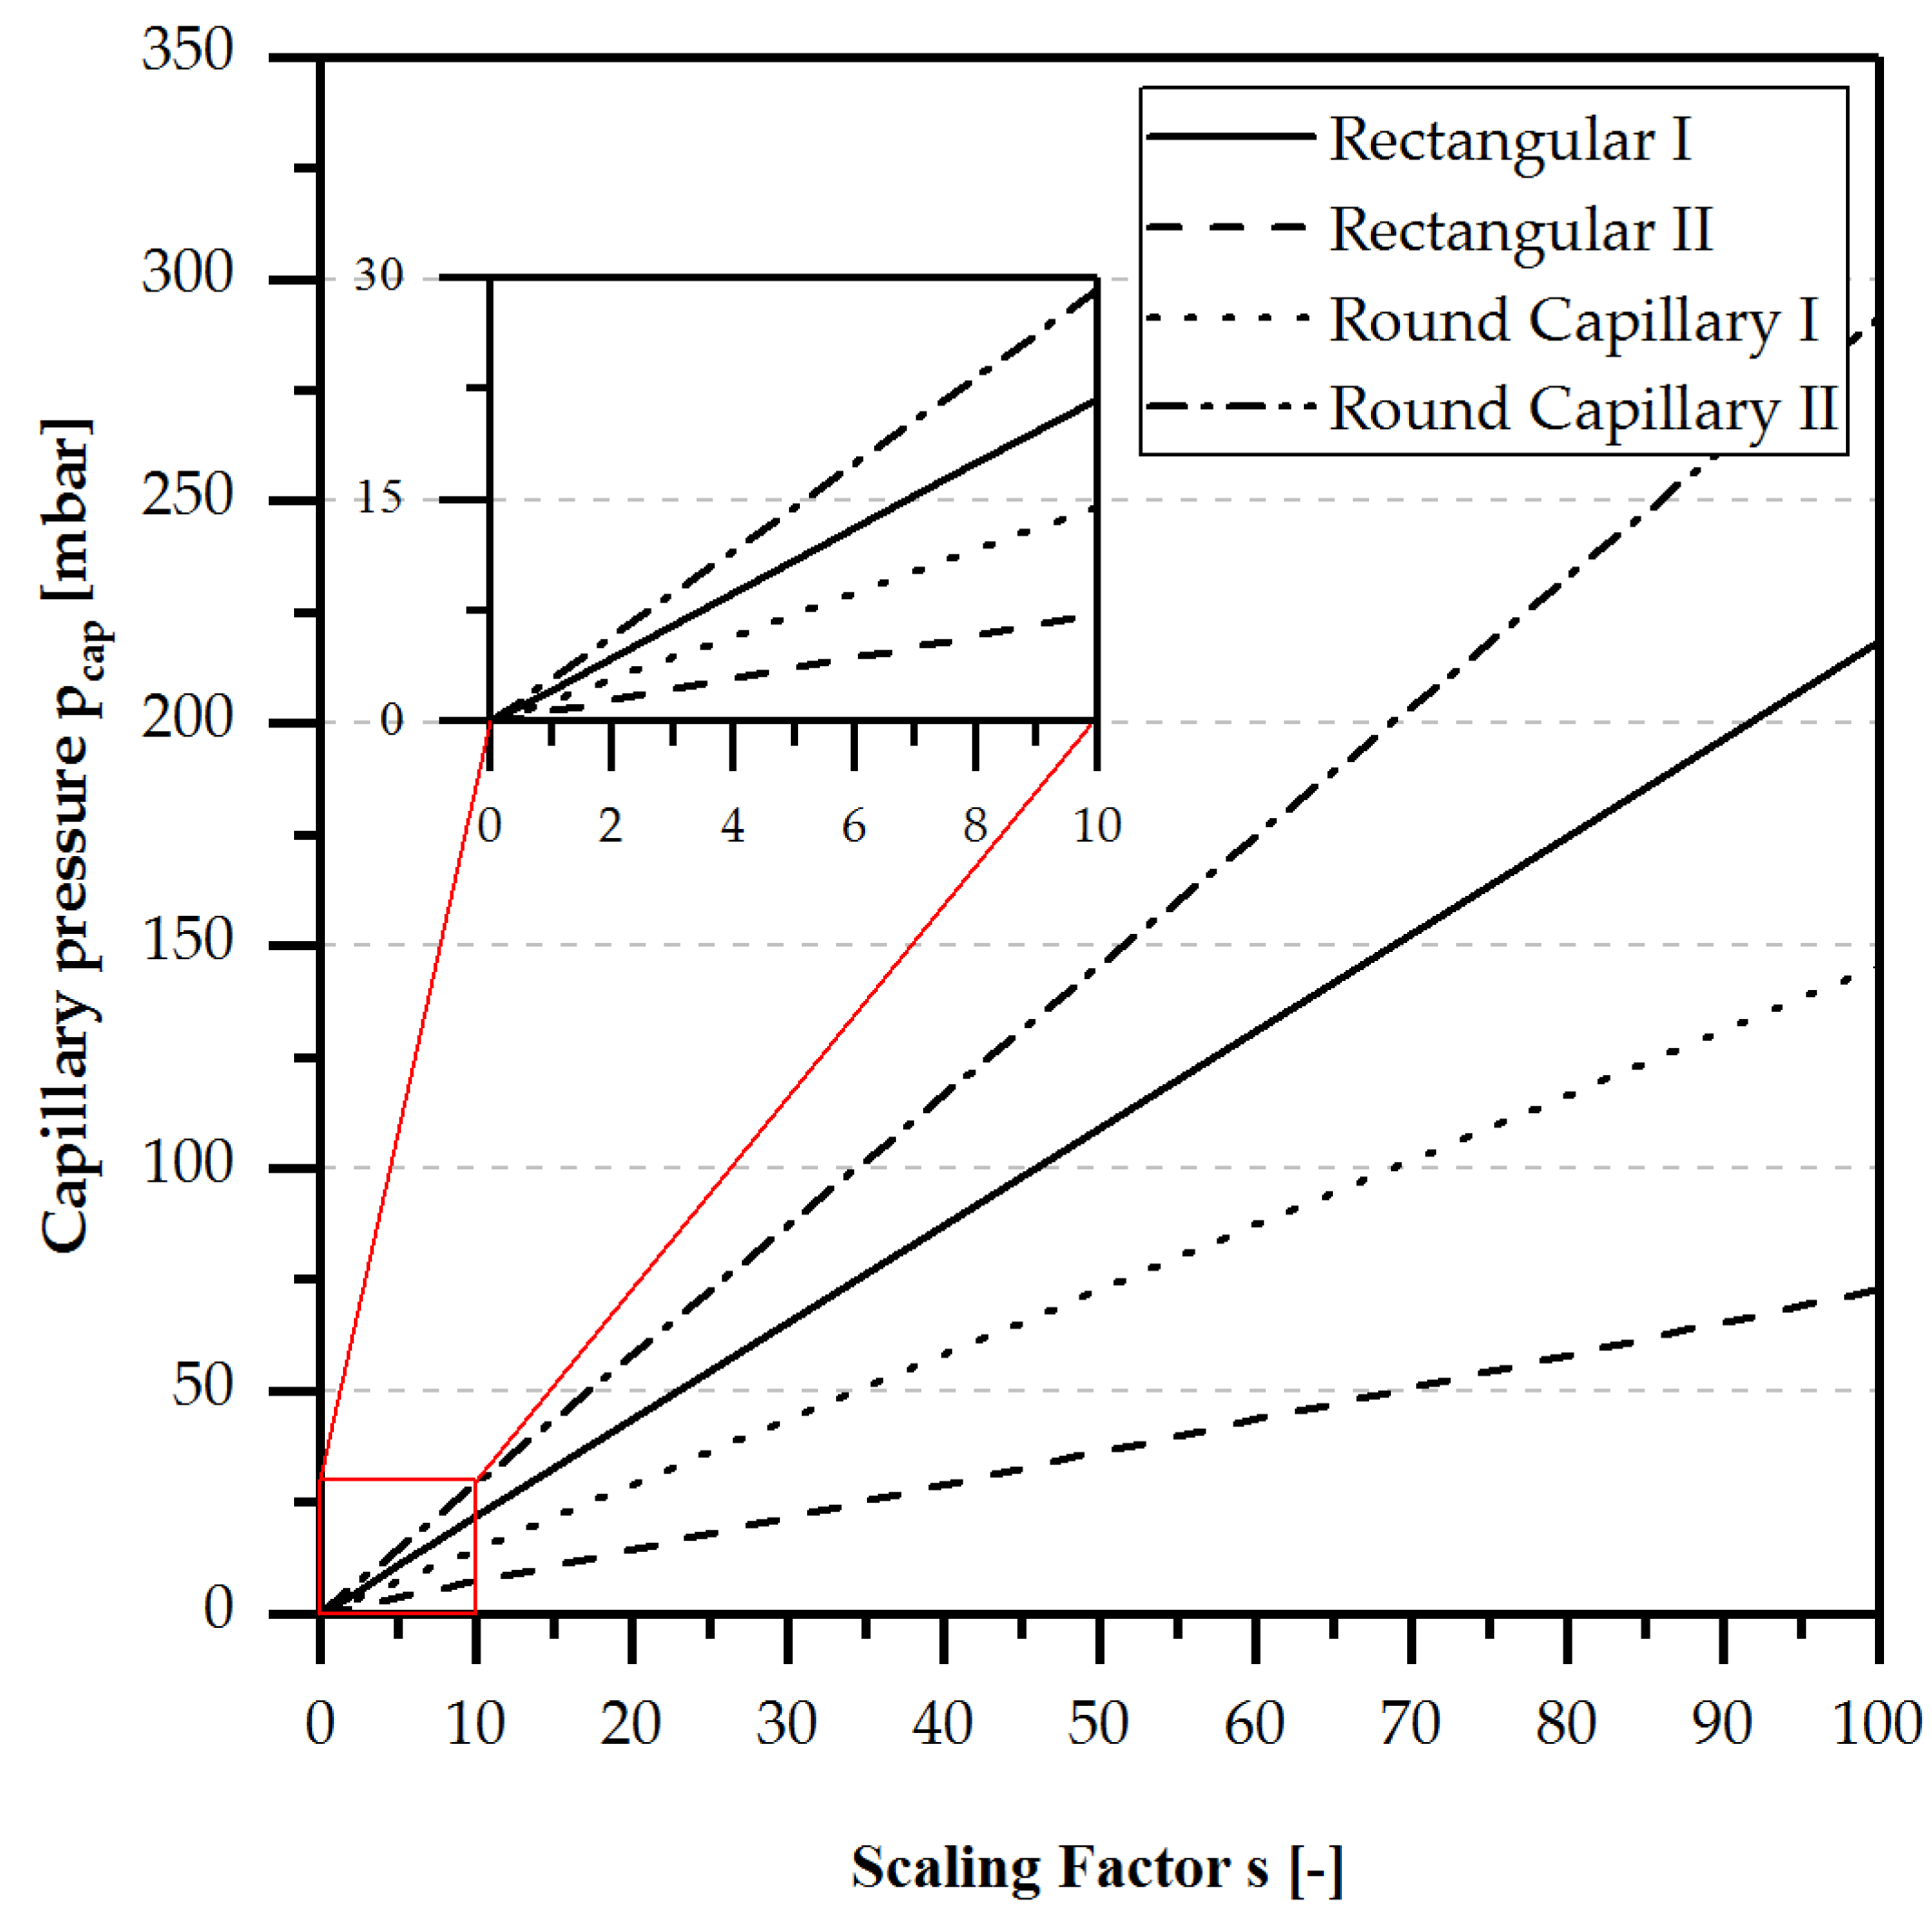
2.1. Capillary Pressure
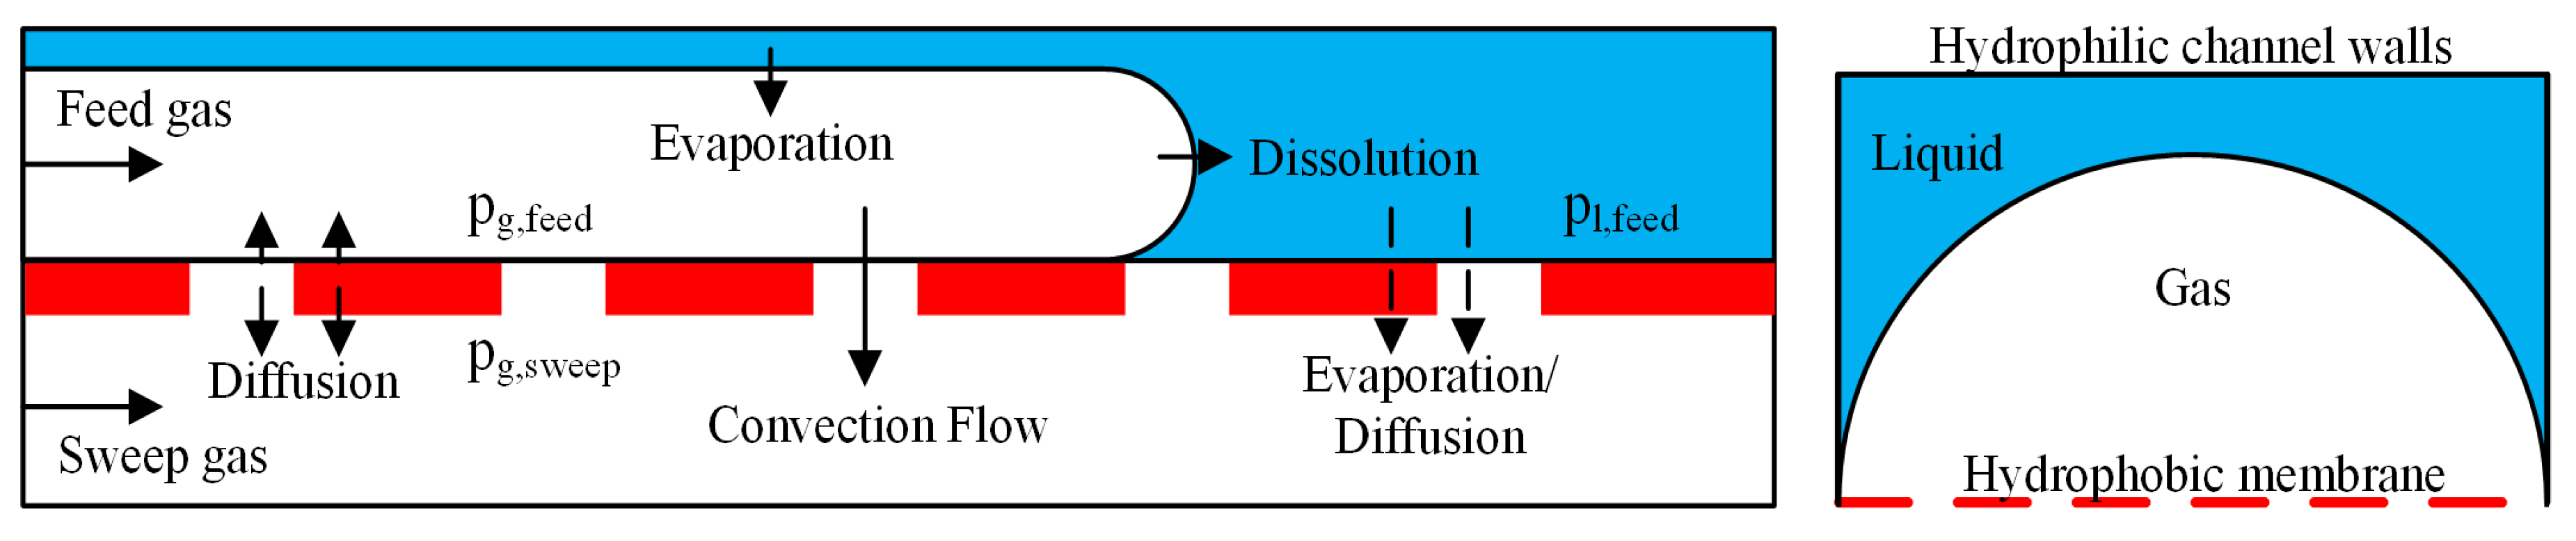
2.2. Mass Transfer
2.2.1. Convective Mass Transfer
2.2.2. Diffusive Mass Transfer
2.2.3. Dissolving of Feed Gas
2.2.4. Separation Performance
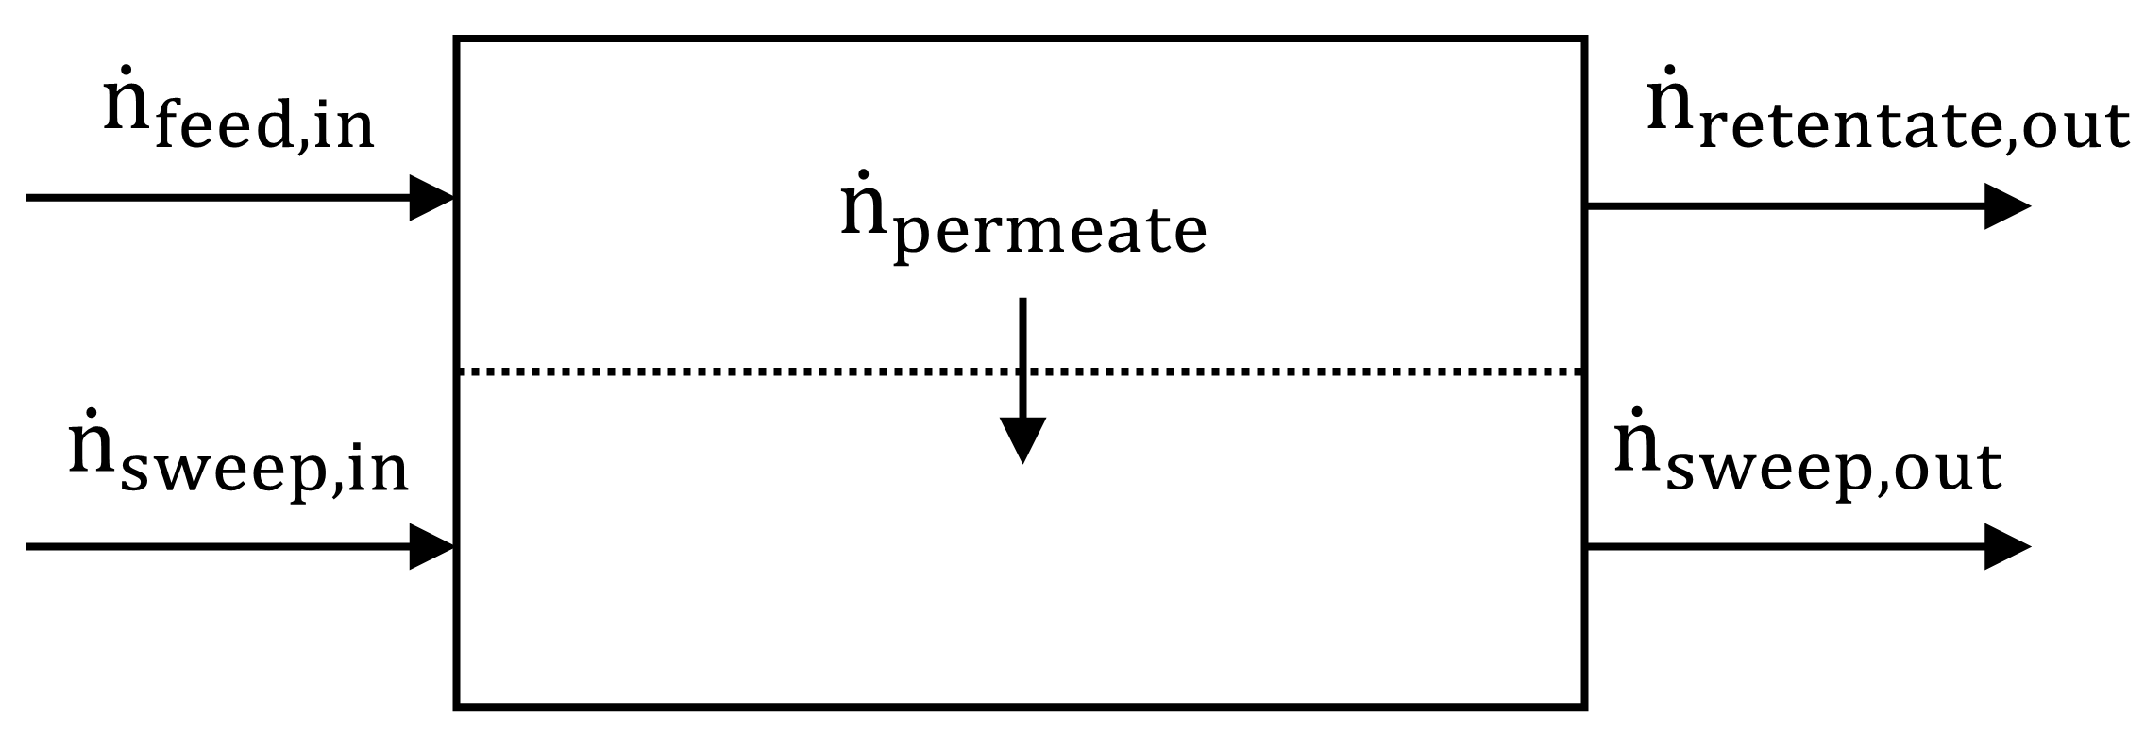
2.2.5. Mass Balance
3. Materials and Methods (Experimental)
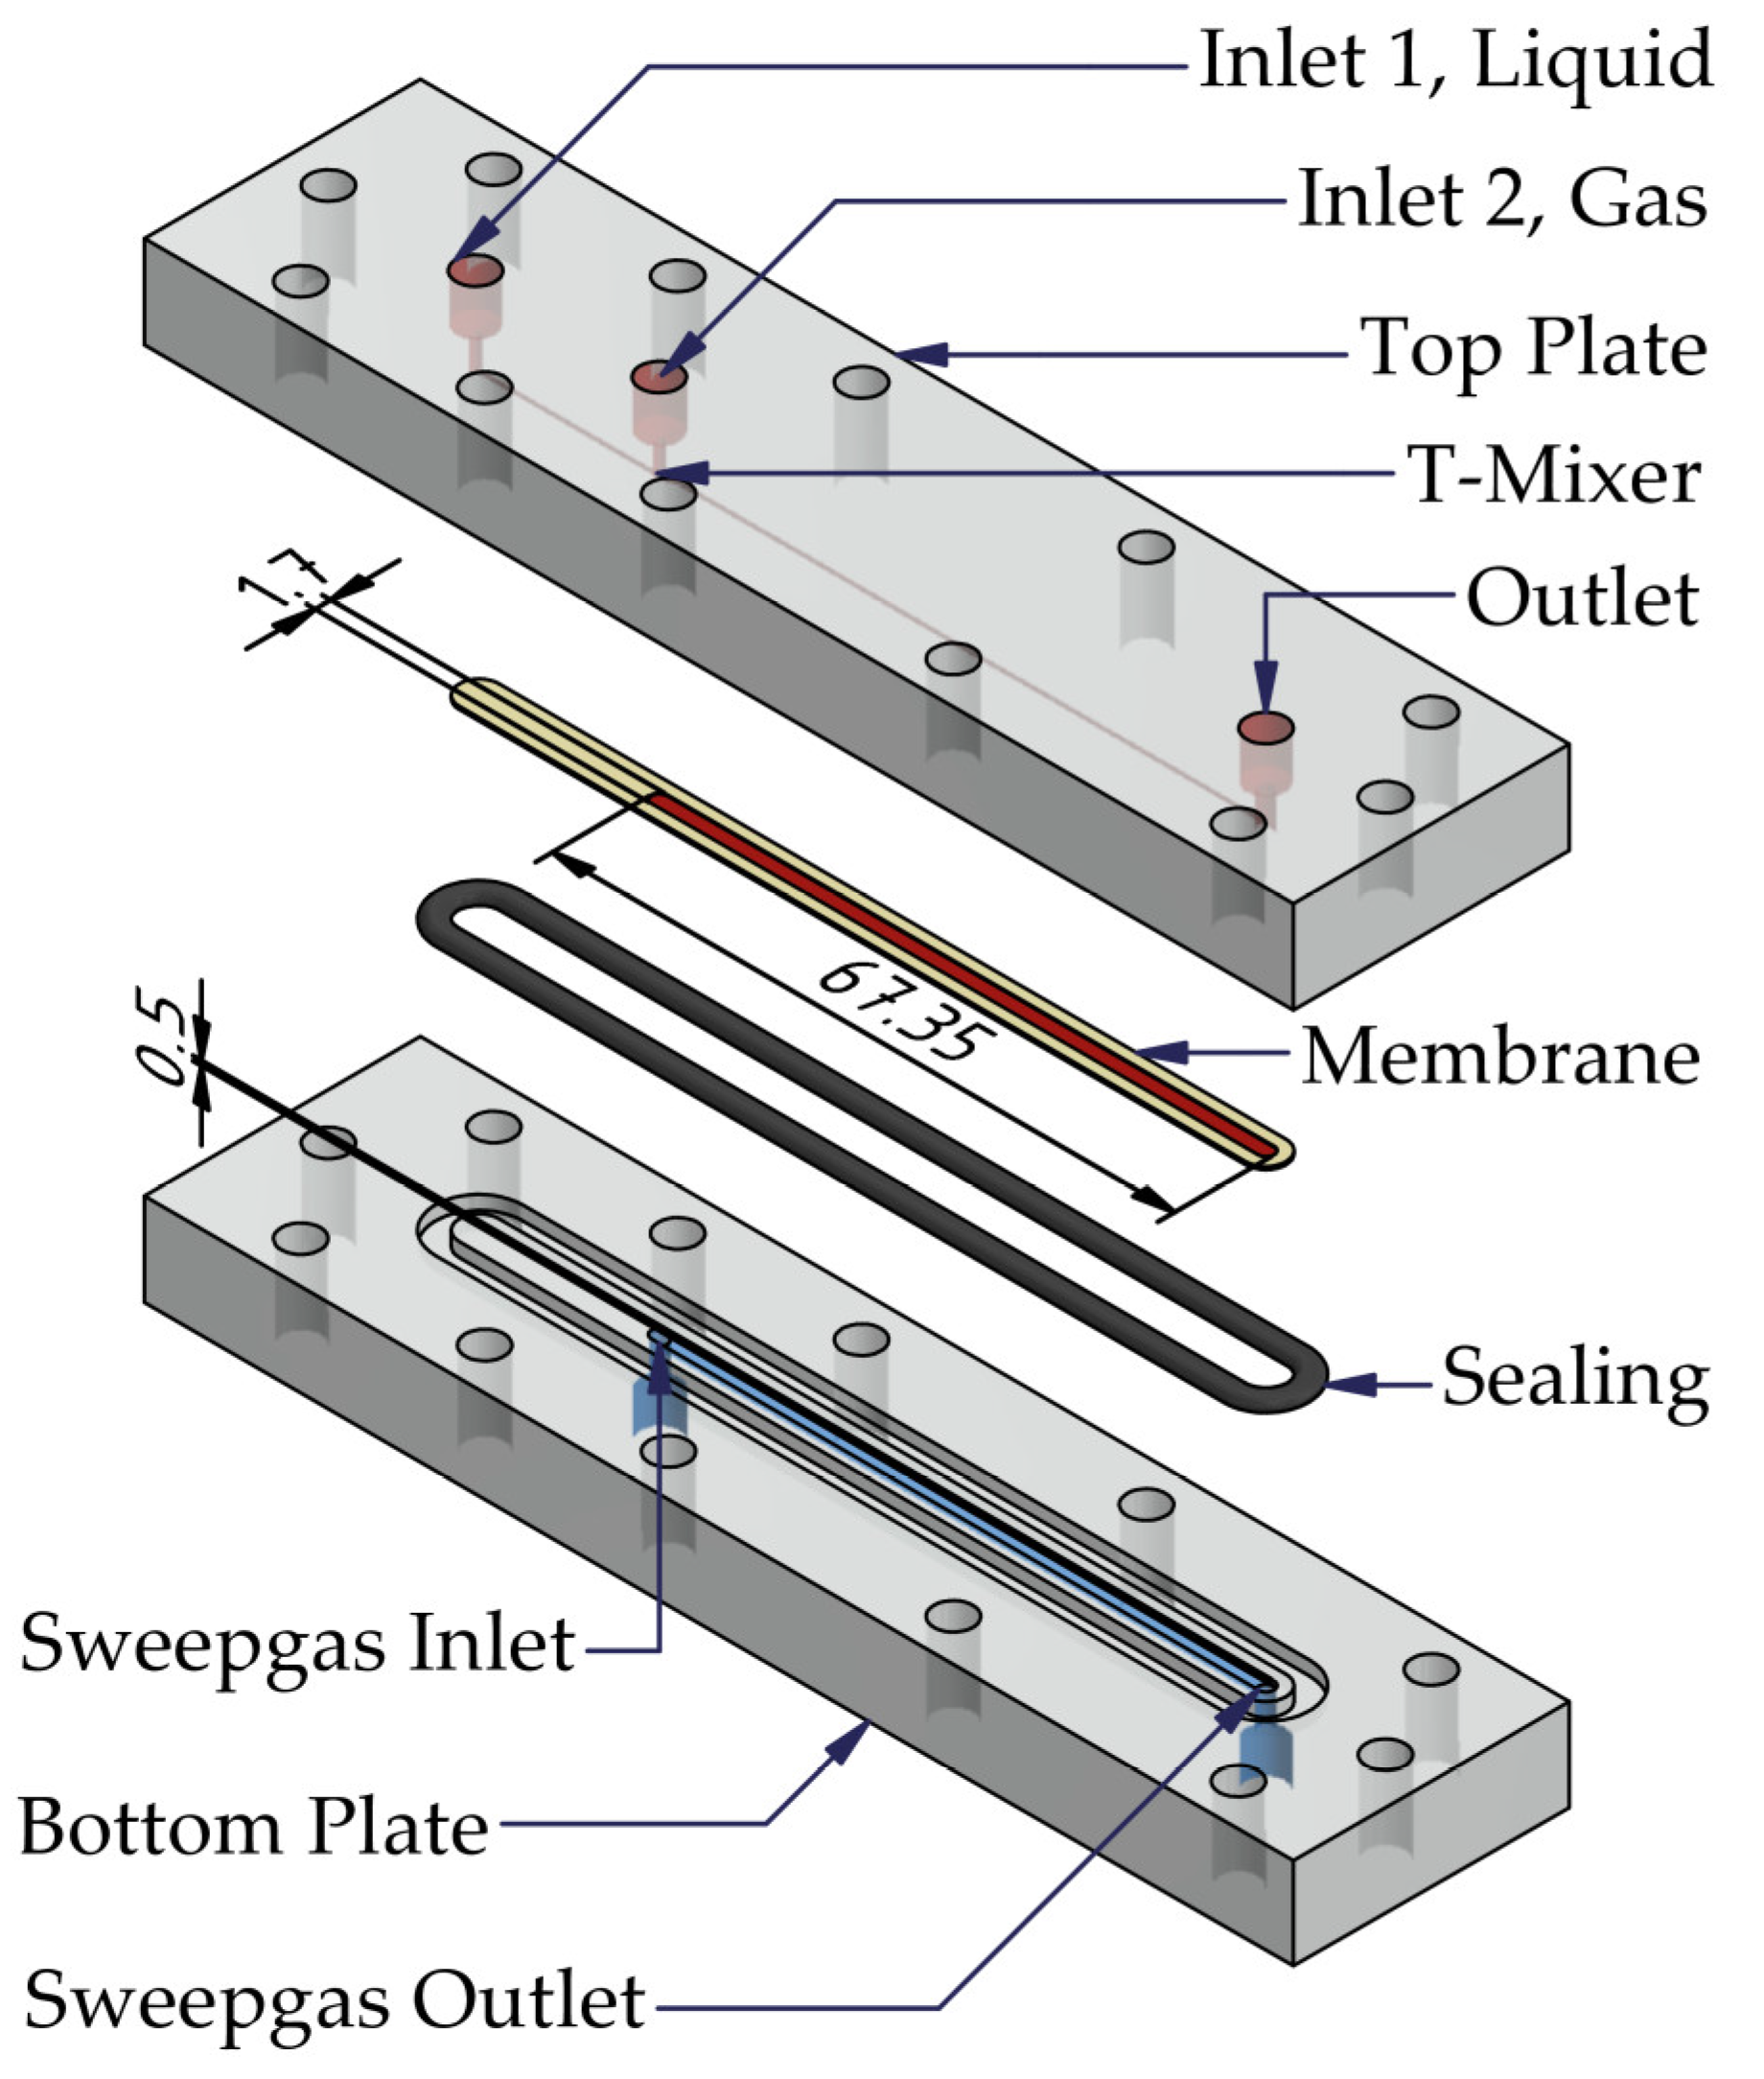
3.1. Micro Contactor
3.2. Porous Membranes
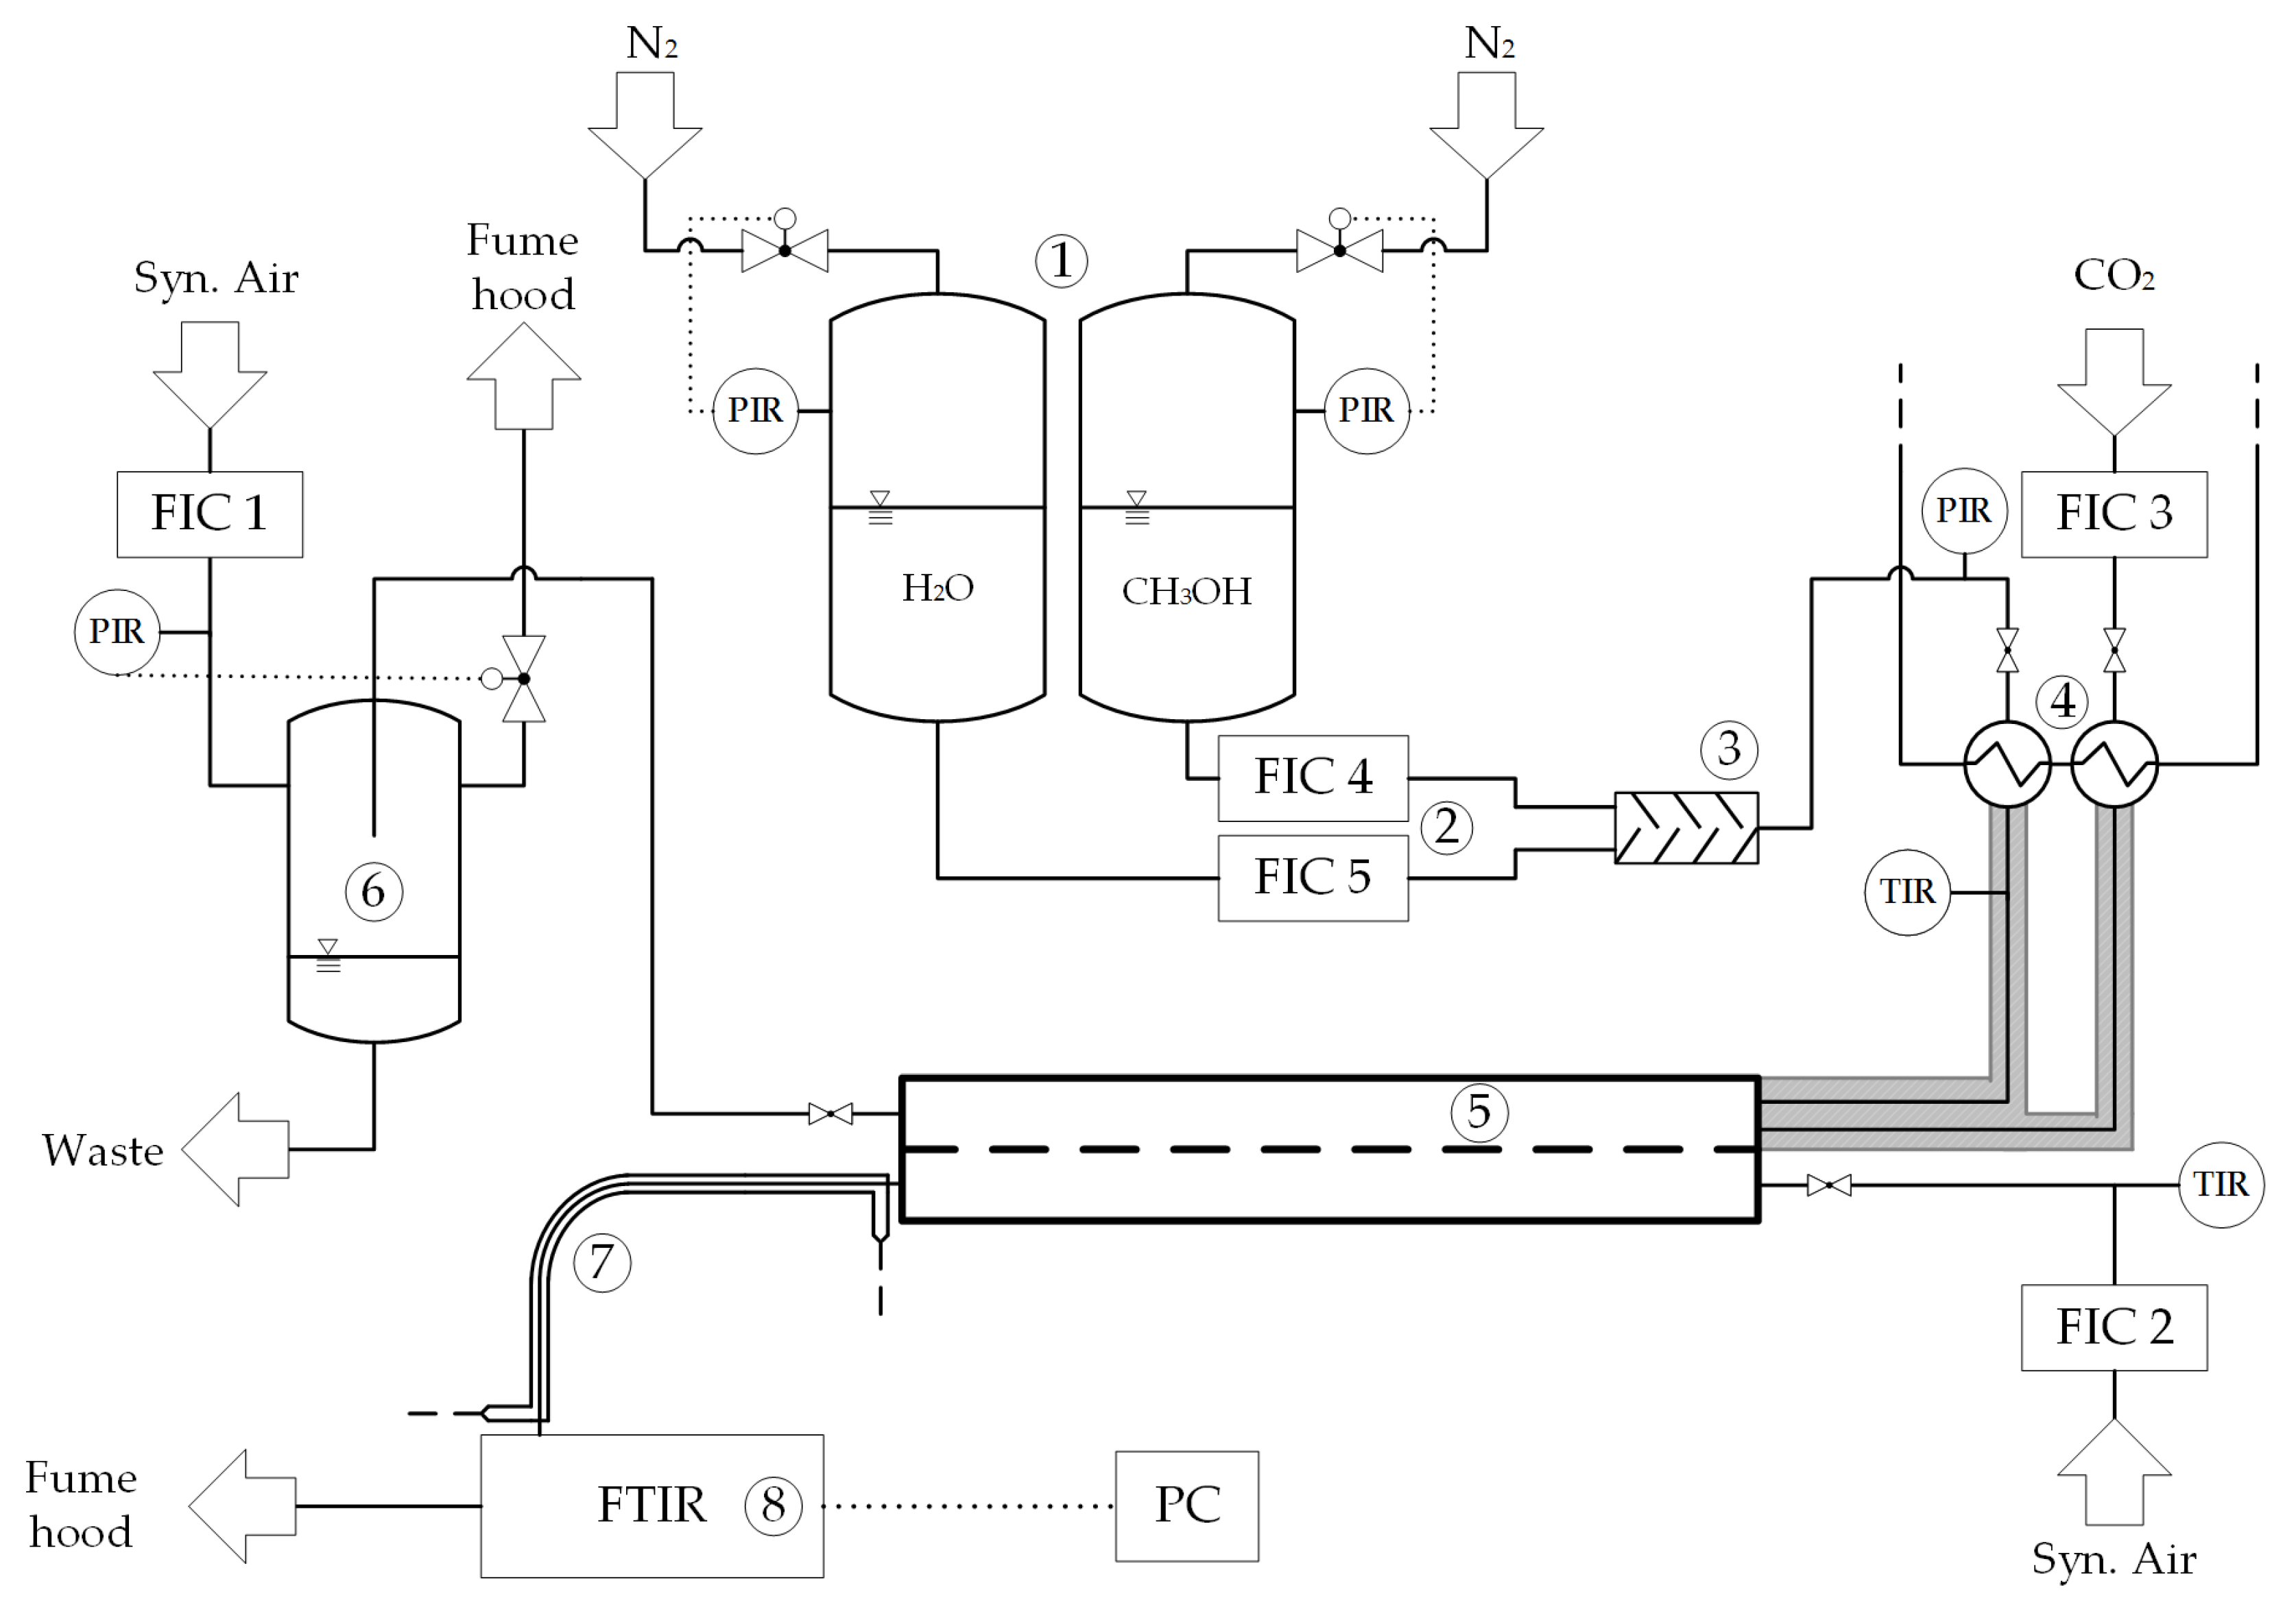
3.3. Experimental Setup
3.3.1. Equipment
3.3.2. Chemicals
3.4. Operation Conditions
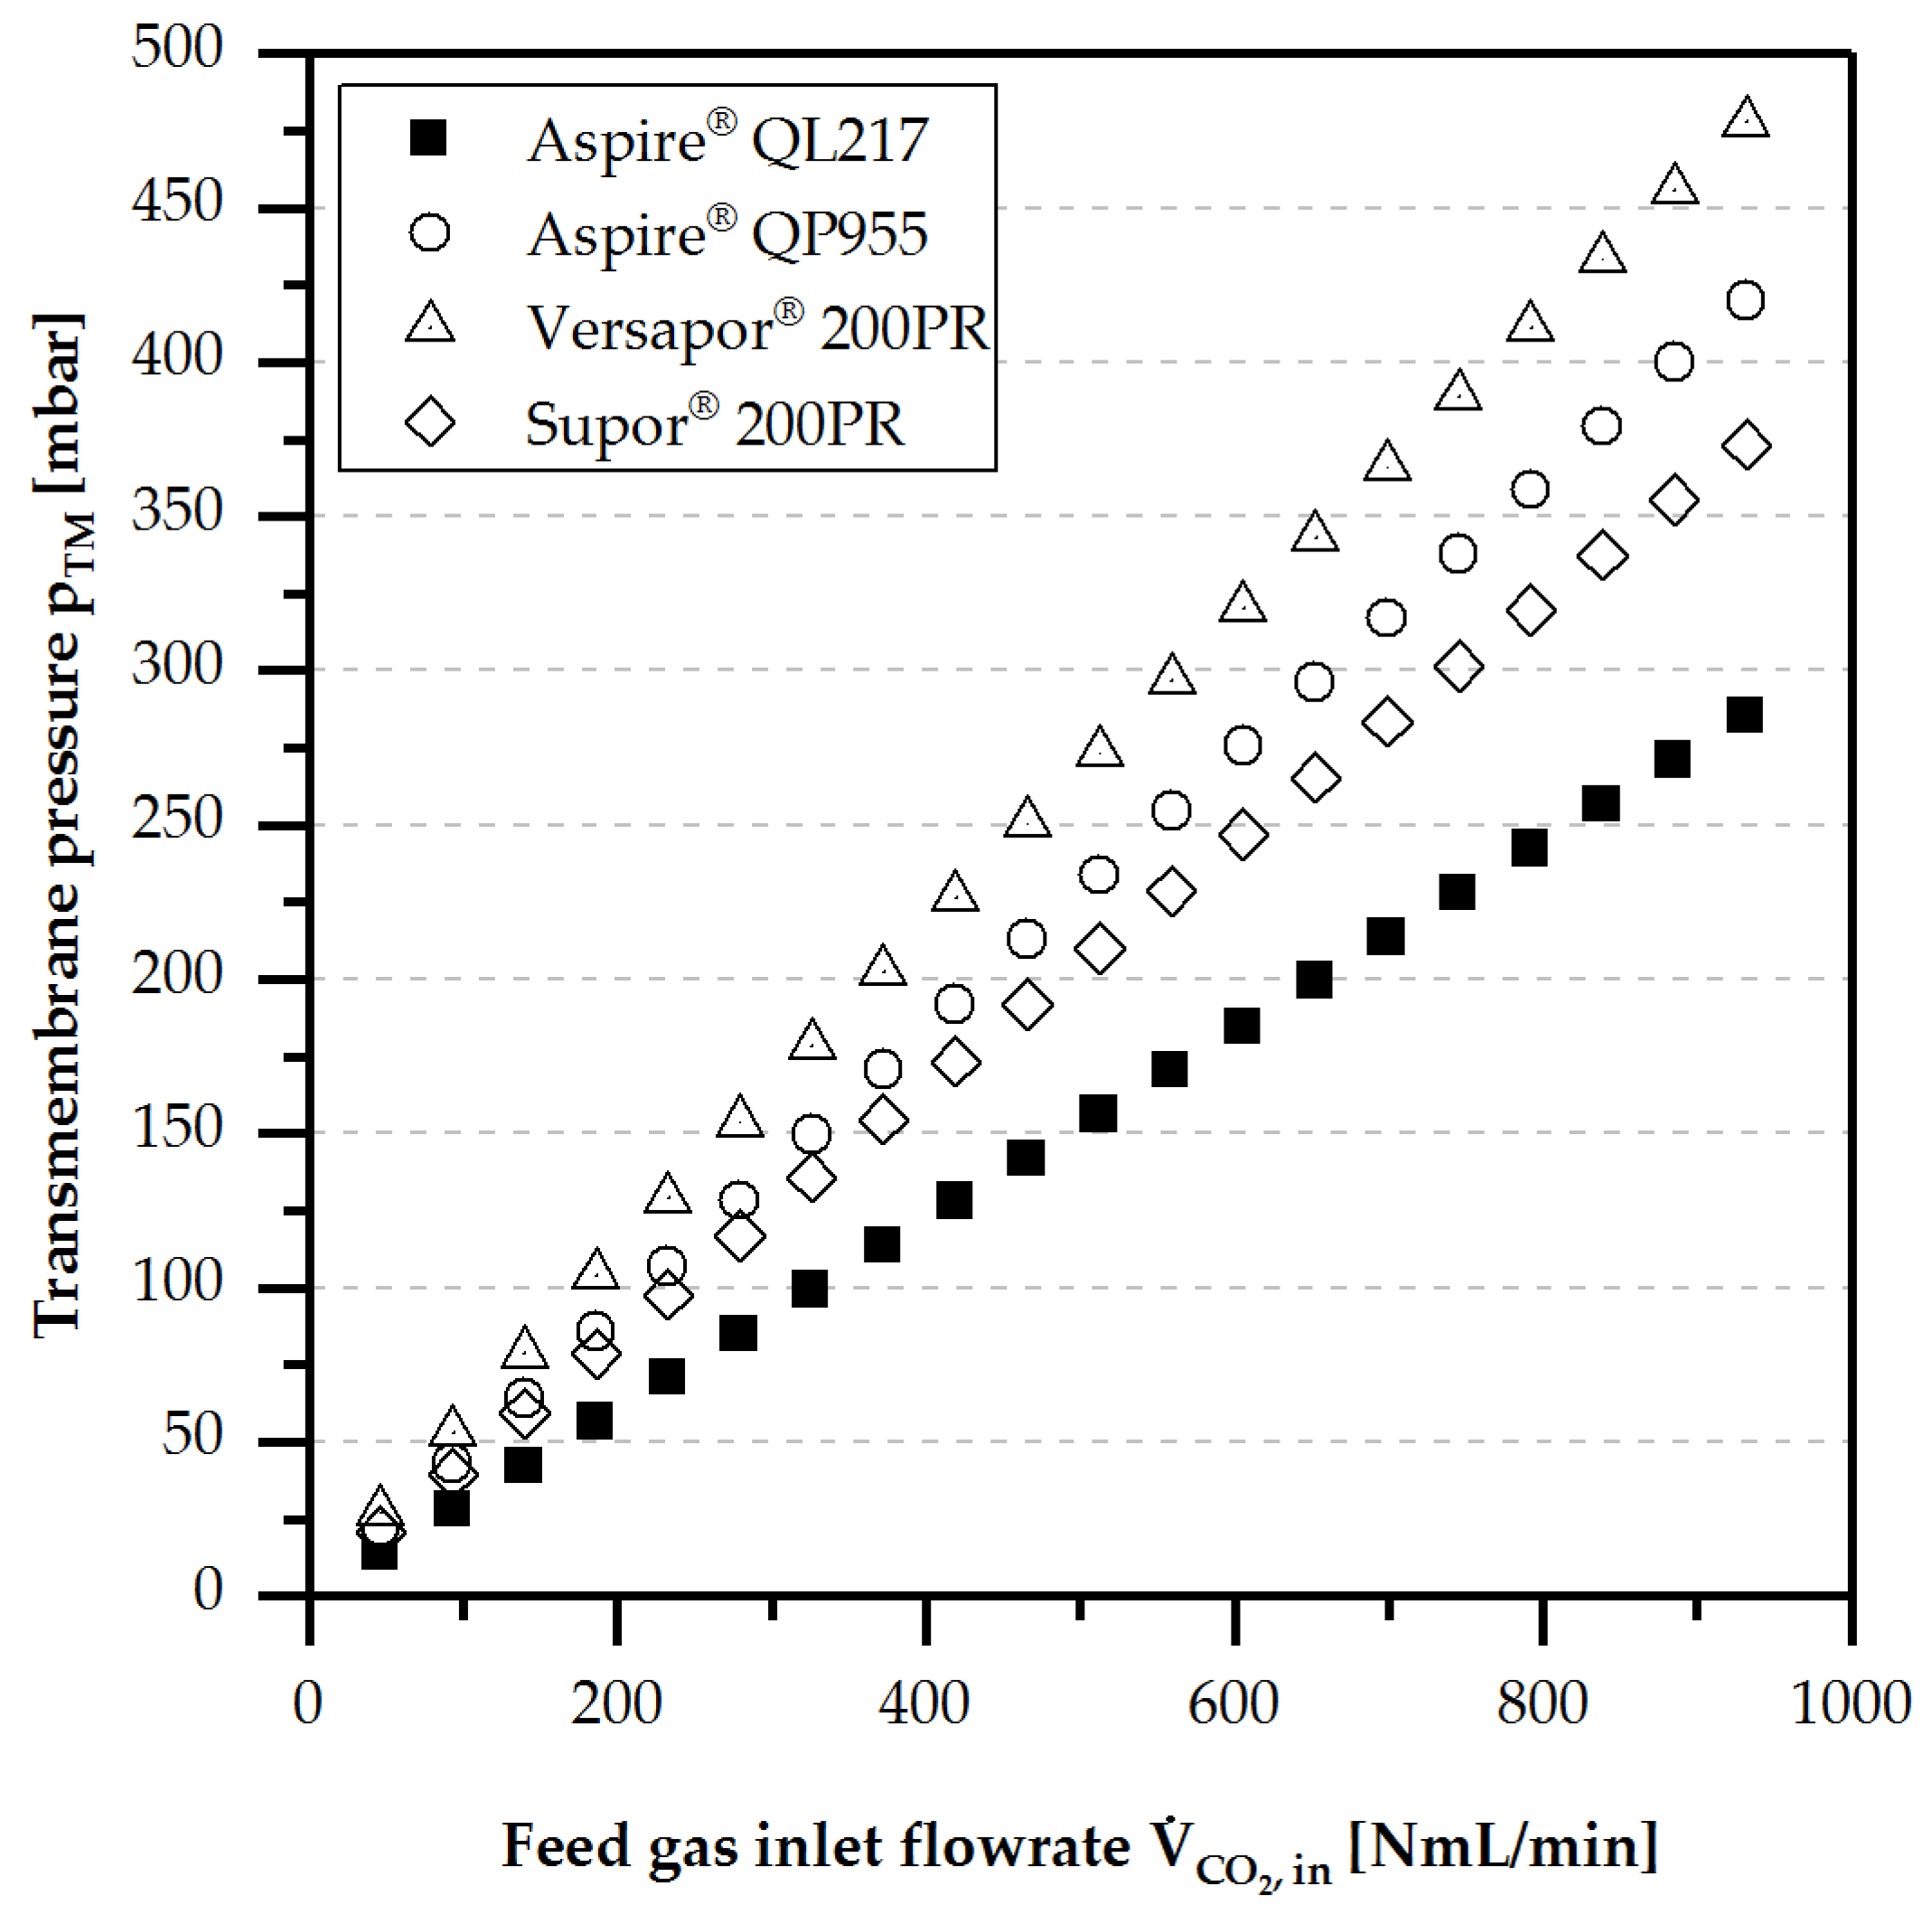
3.4.1. Gas Permeability
3.4.2. Separation Efficiency
- Separation performance
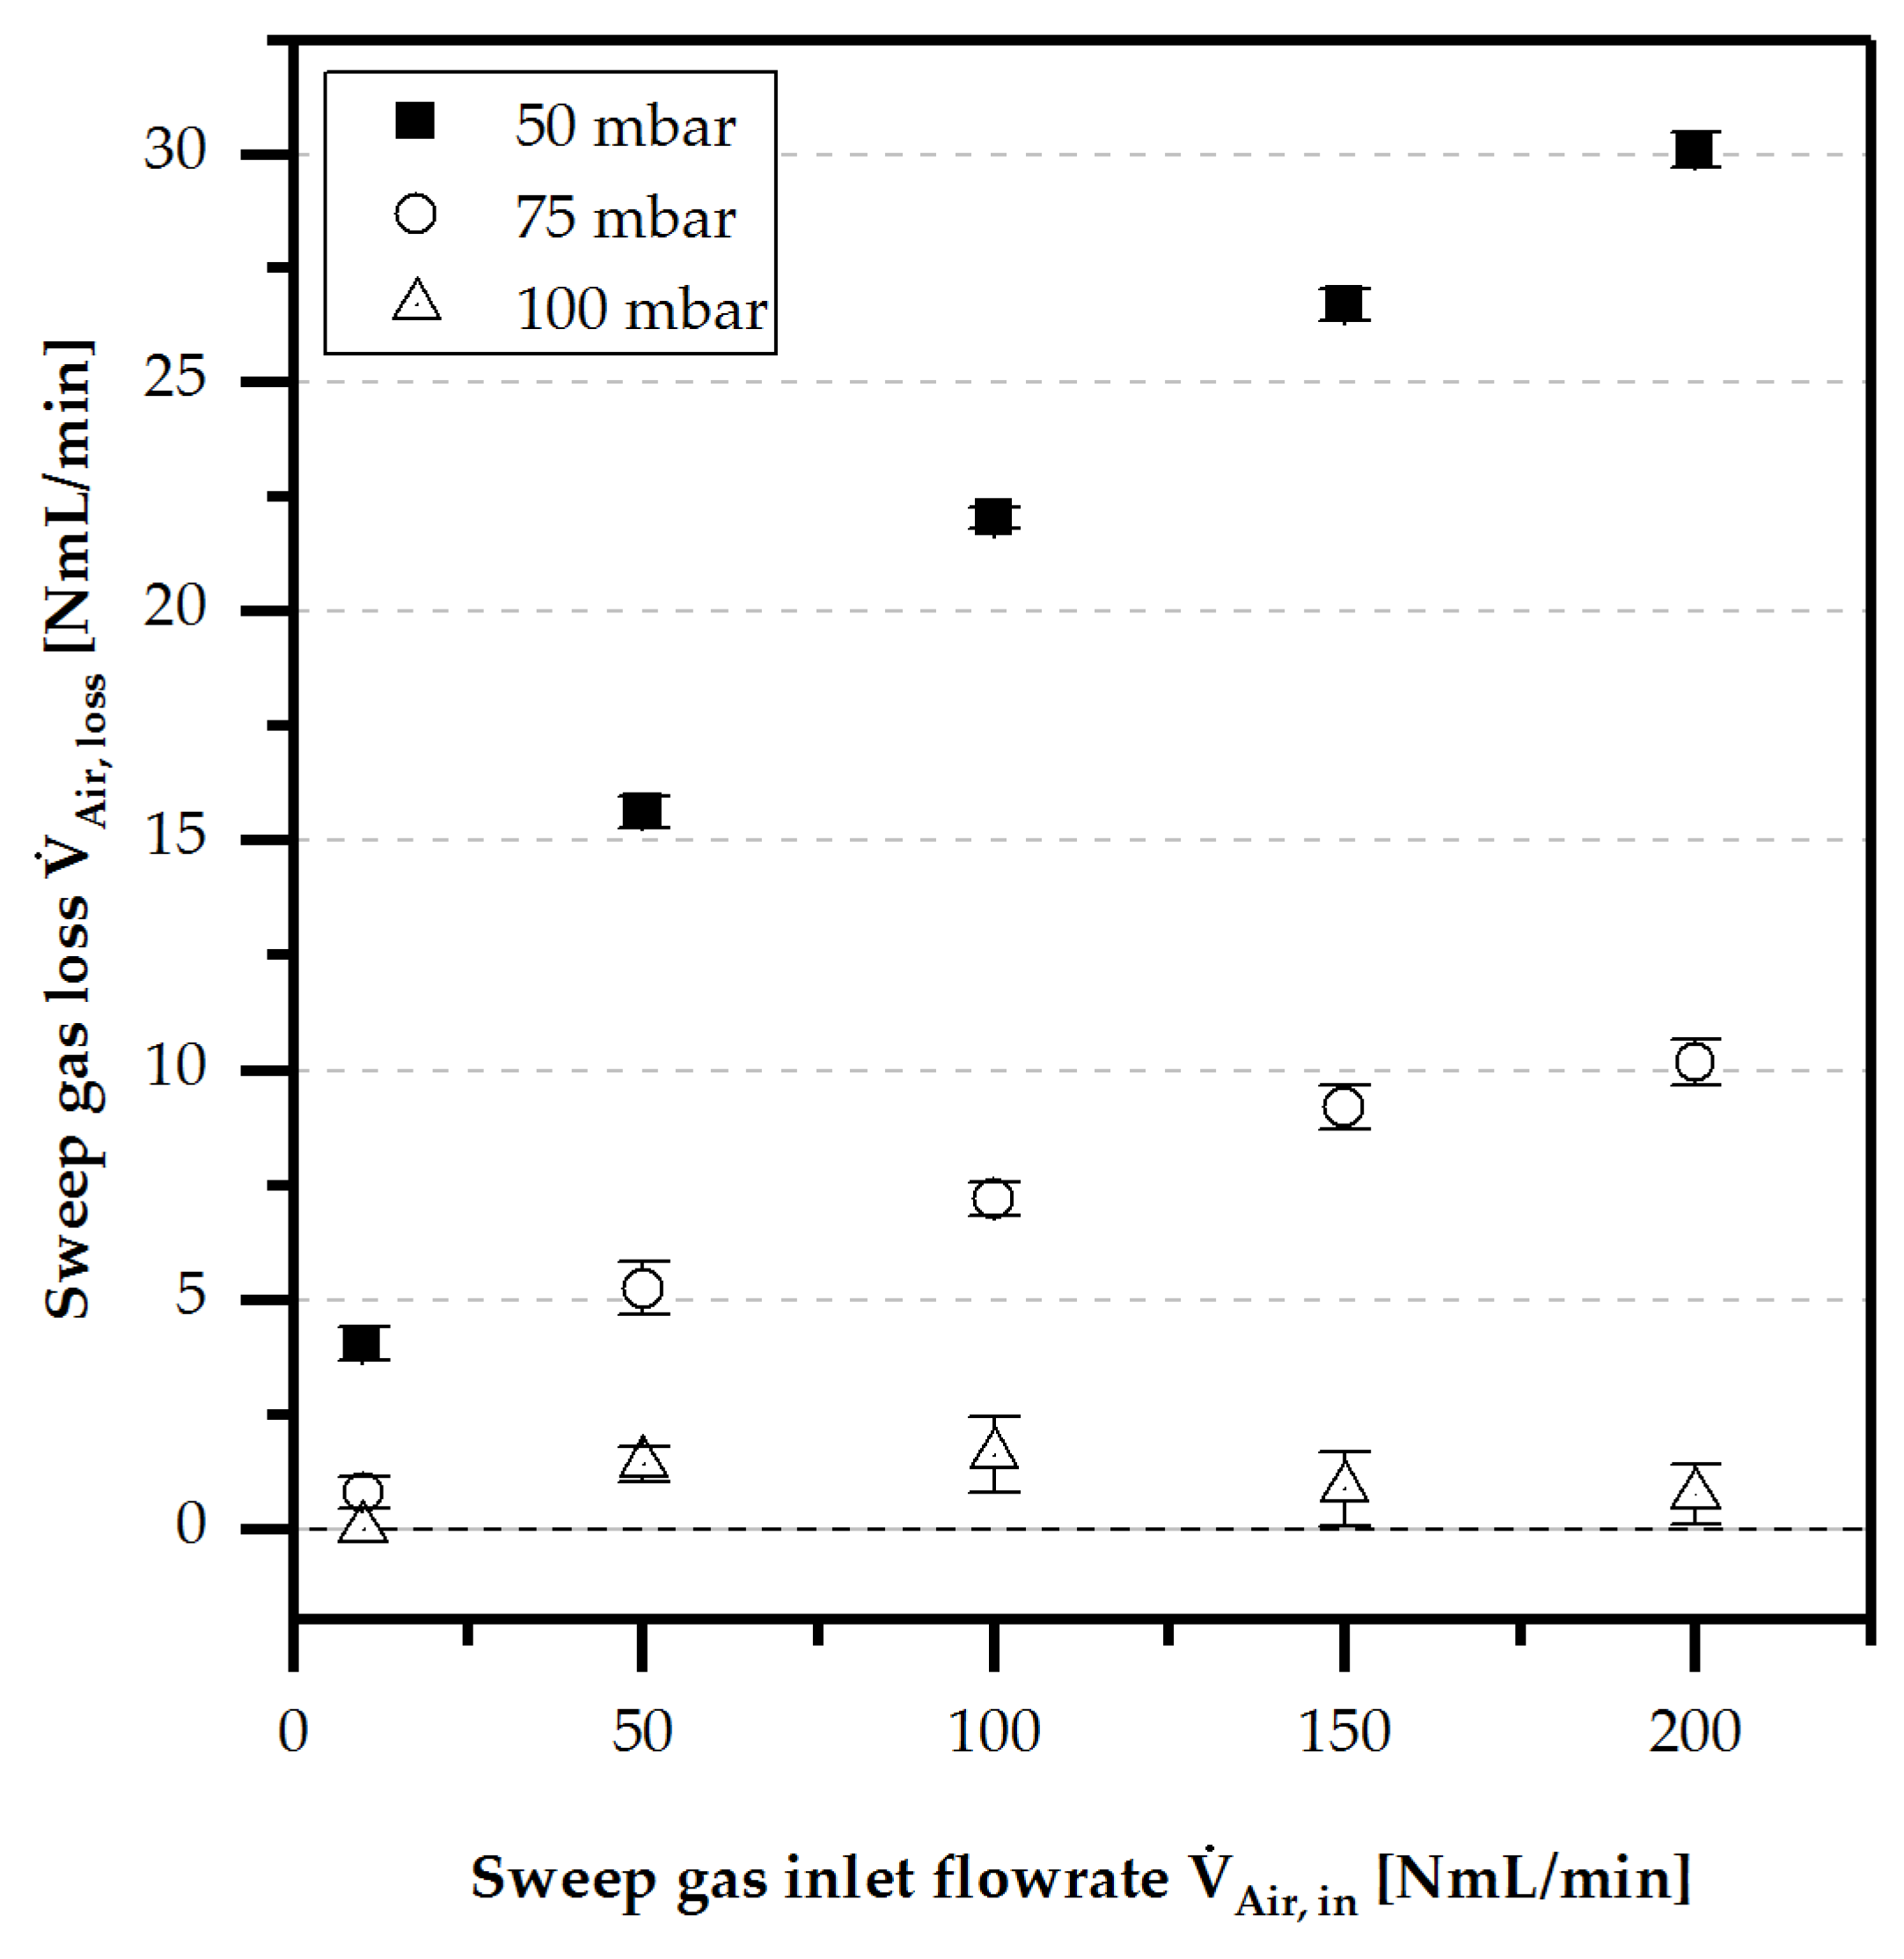
- Liquid loss by evaporation and diffusion
- Orientation independence
3.4.3. Active Membrane Area
4. Results
4.1. Gas Permeability
4.2. Diffusion
4.3. Separation Efficiency
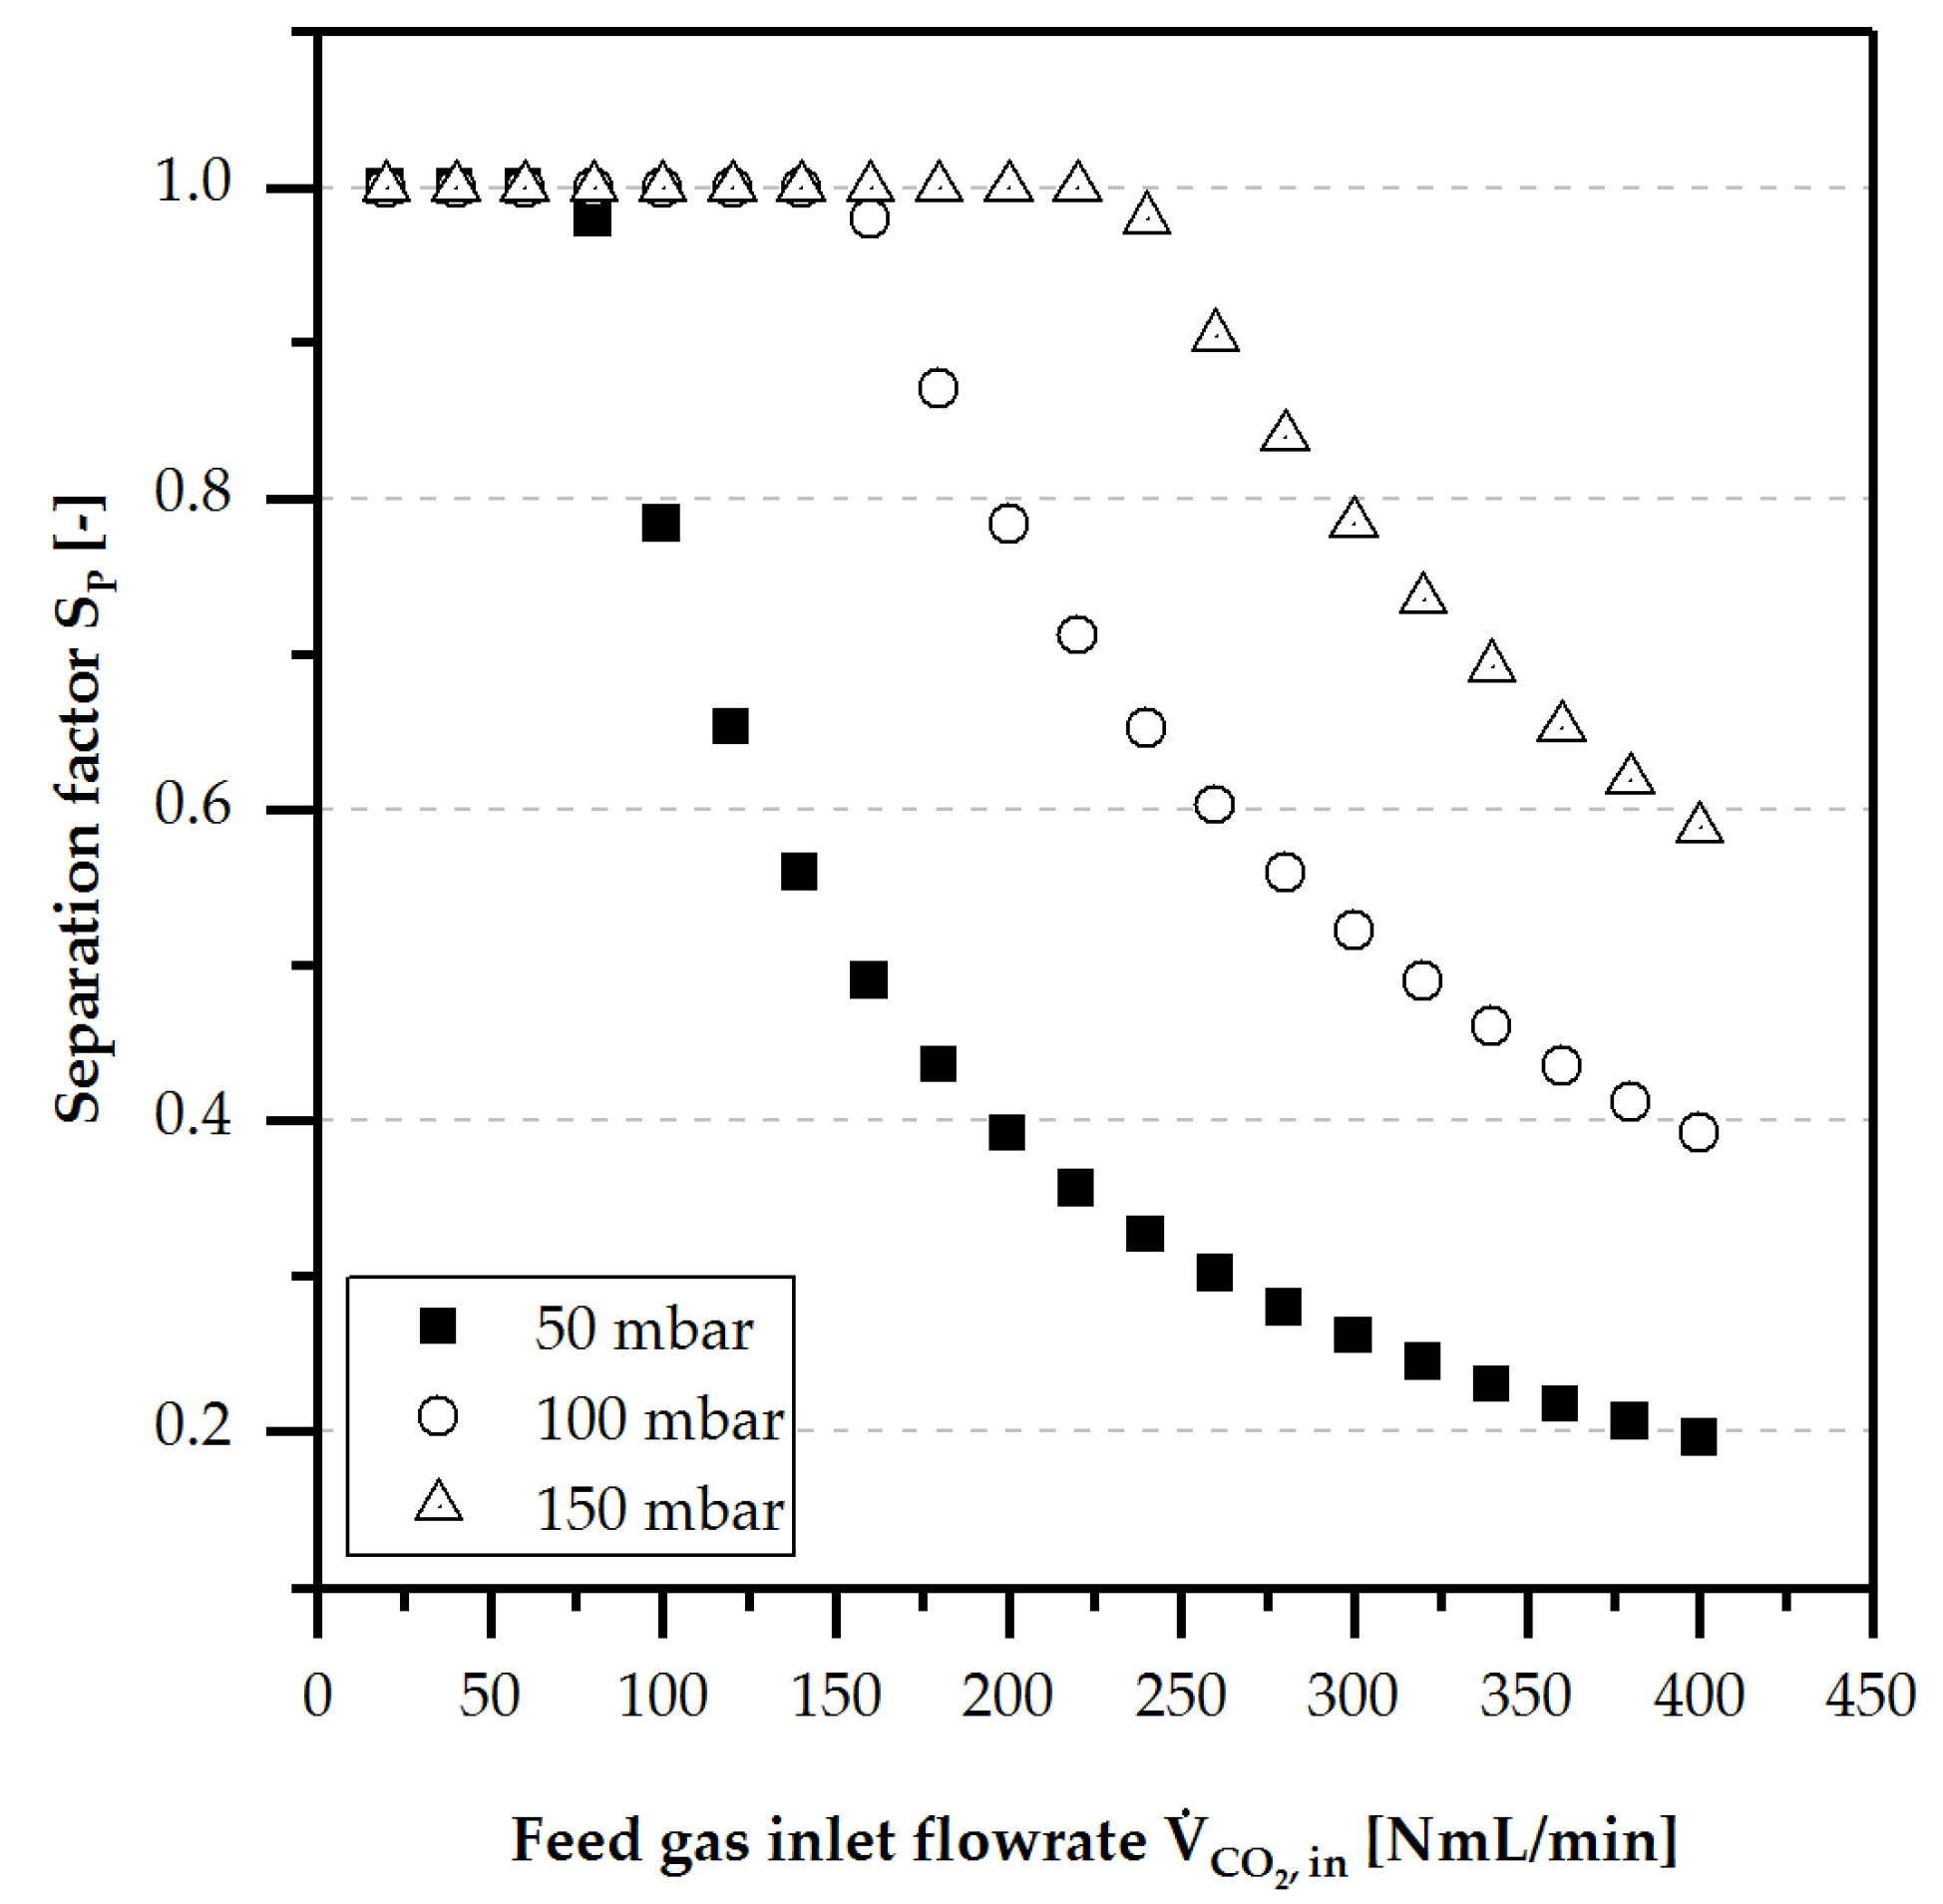
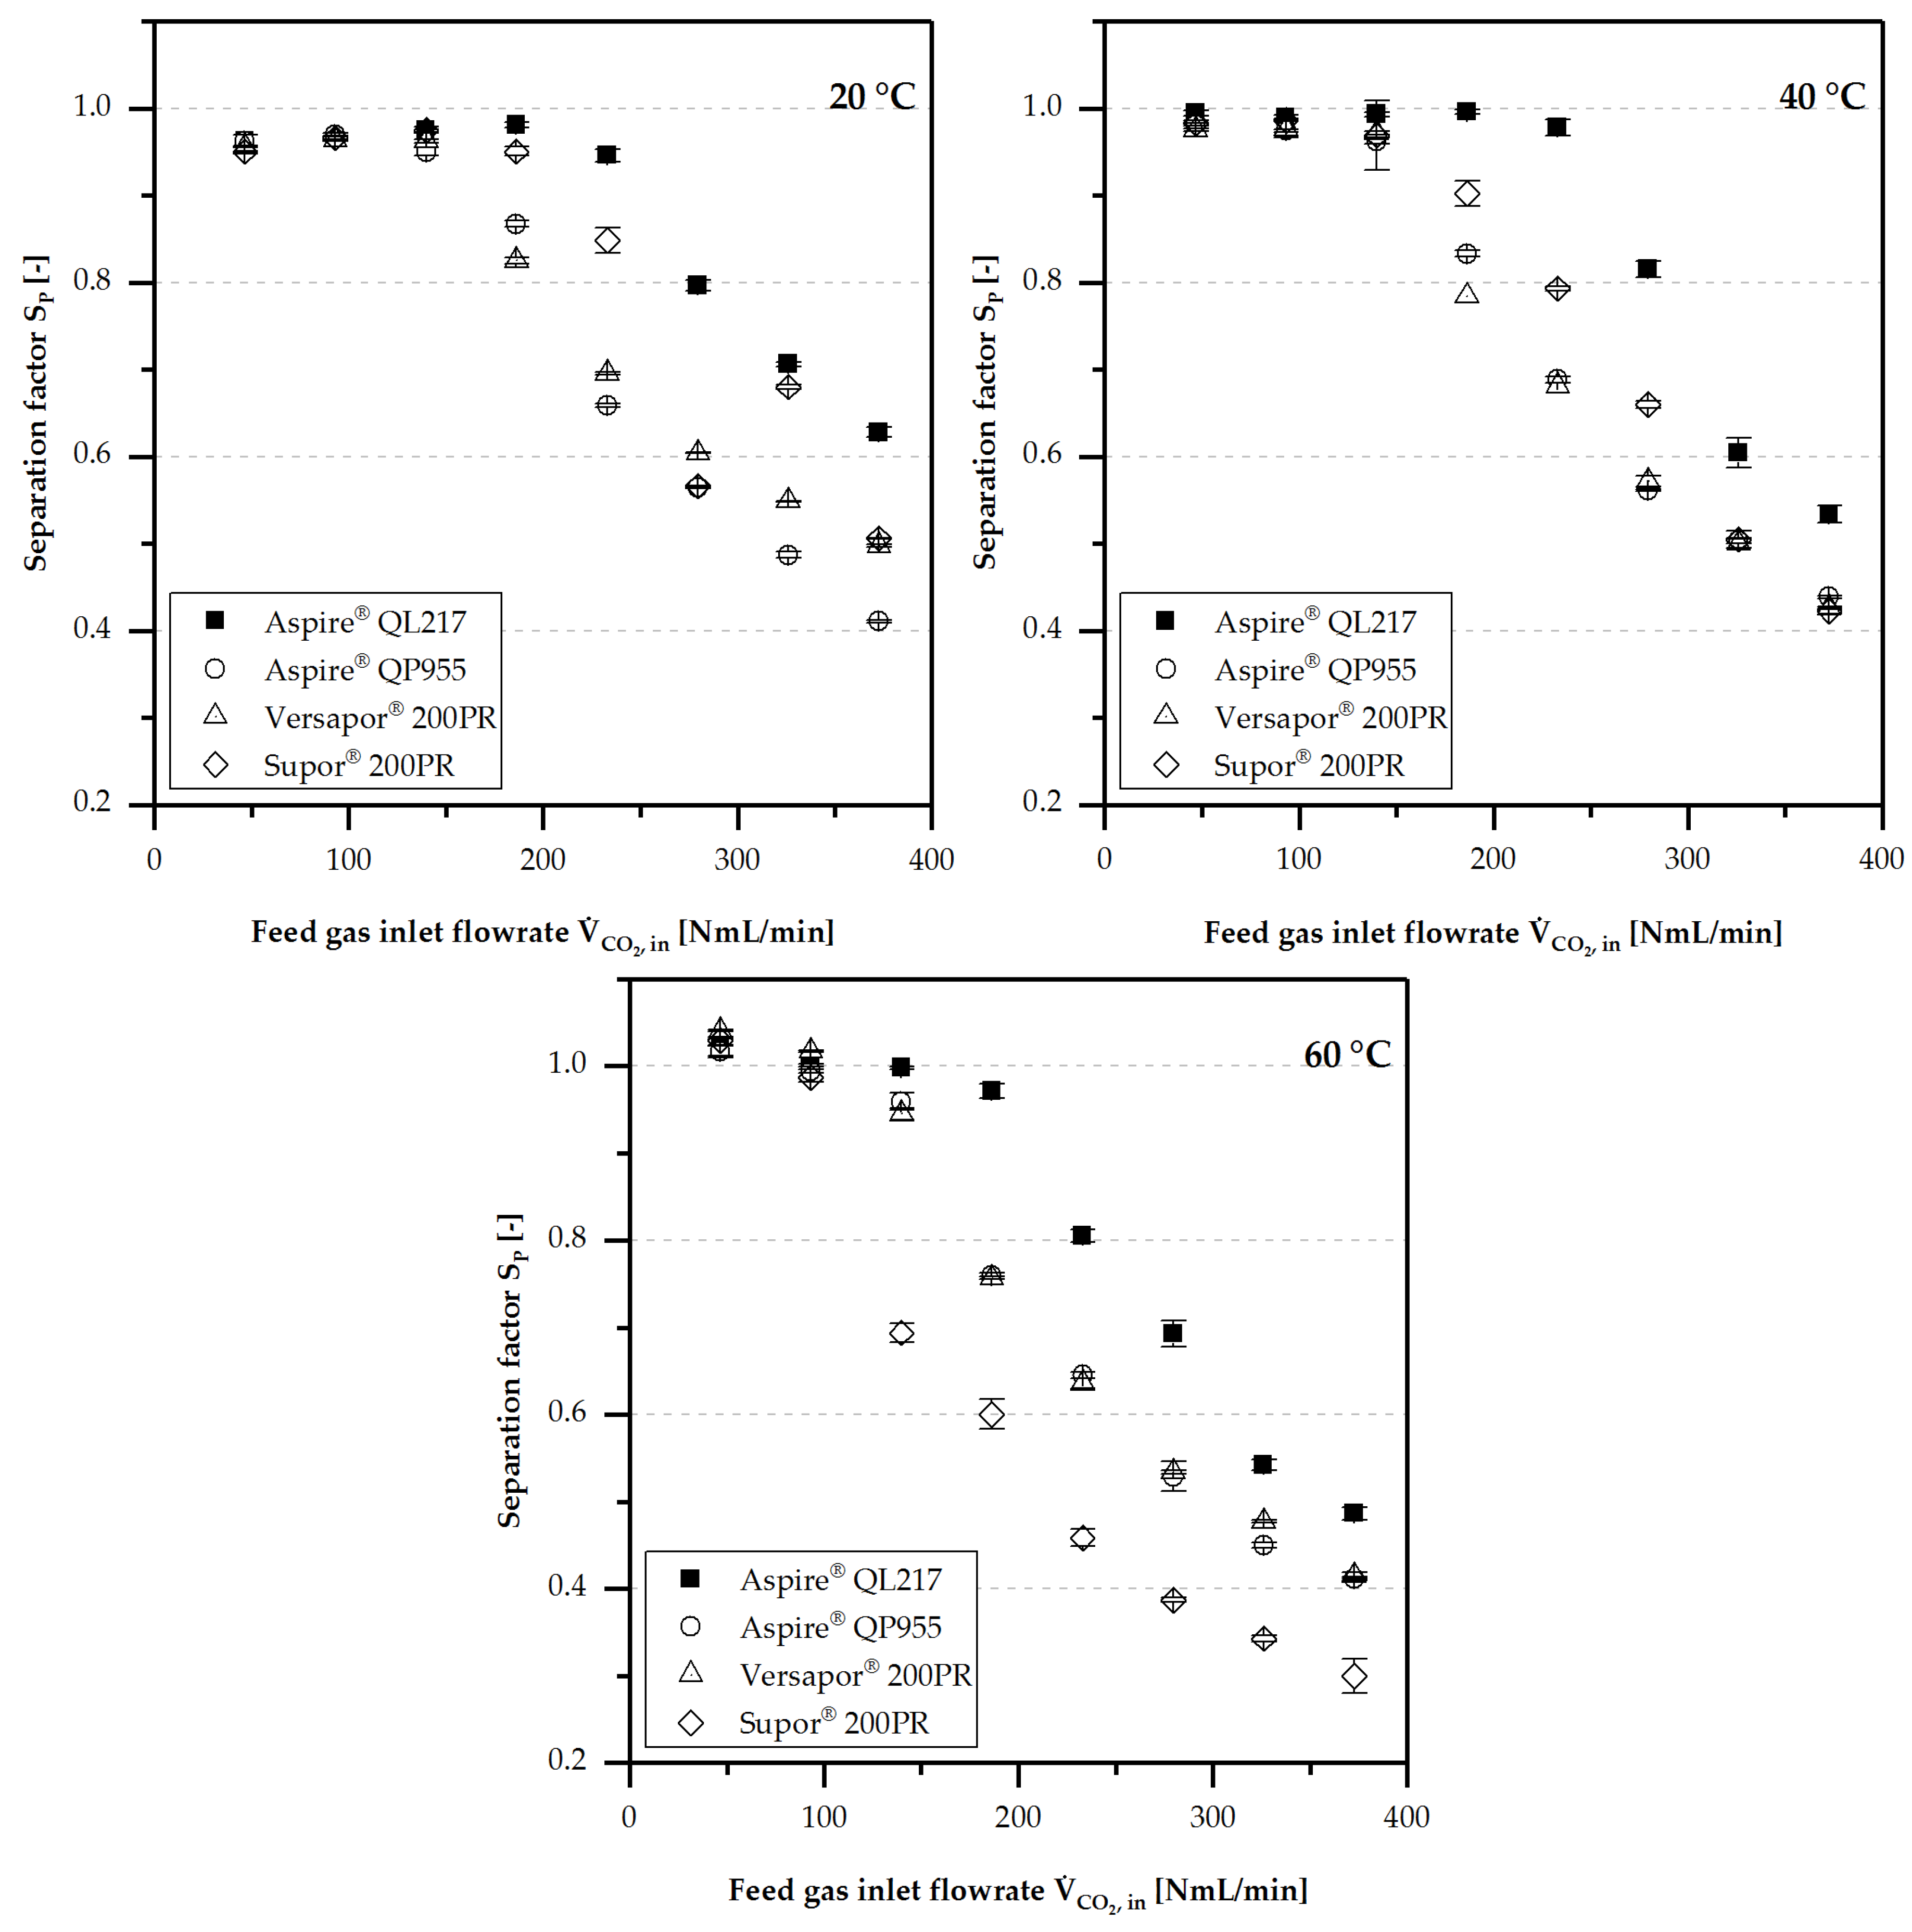
4.3.1. Separation Performance
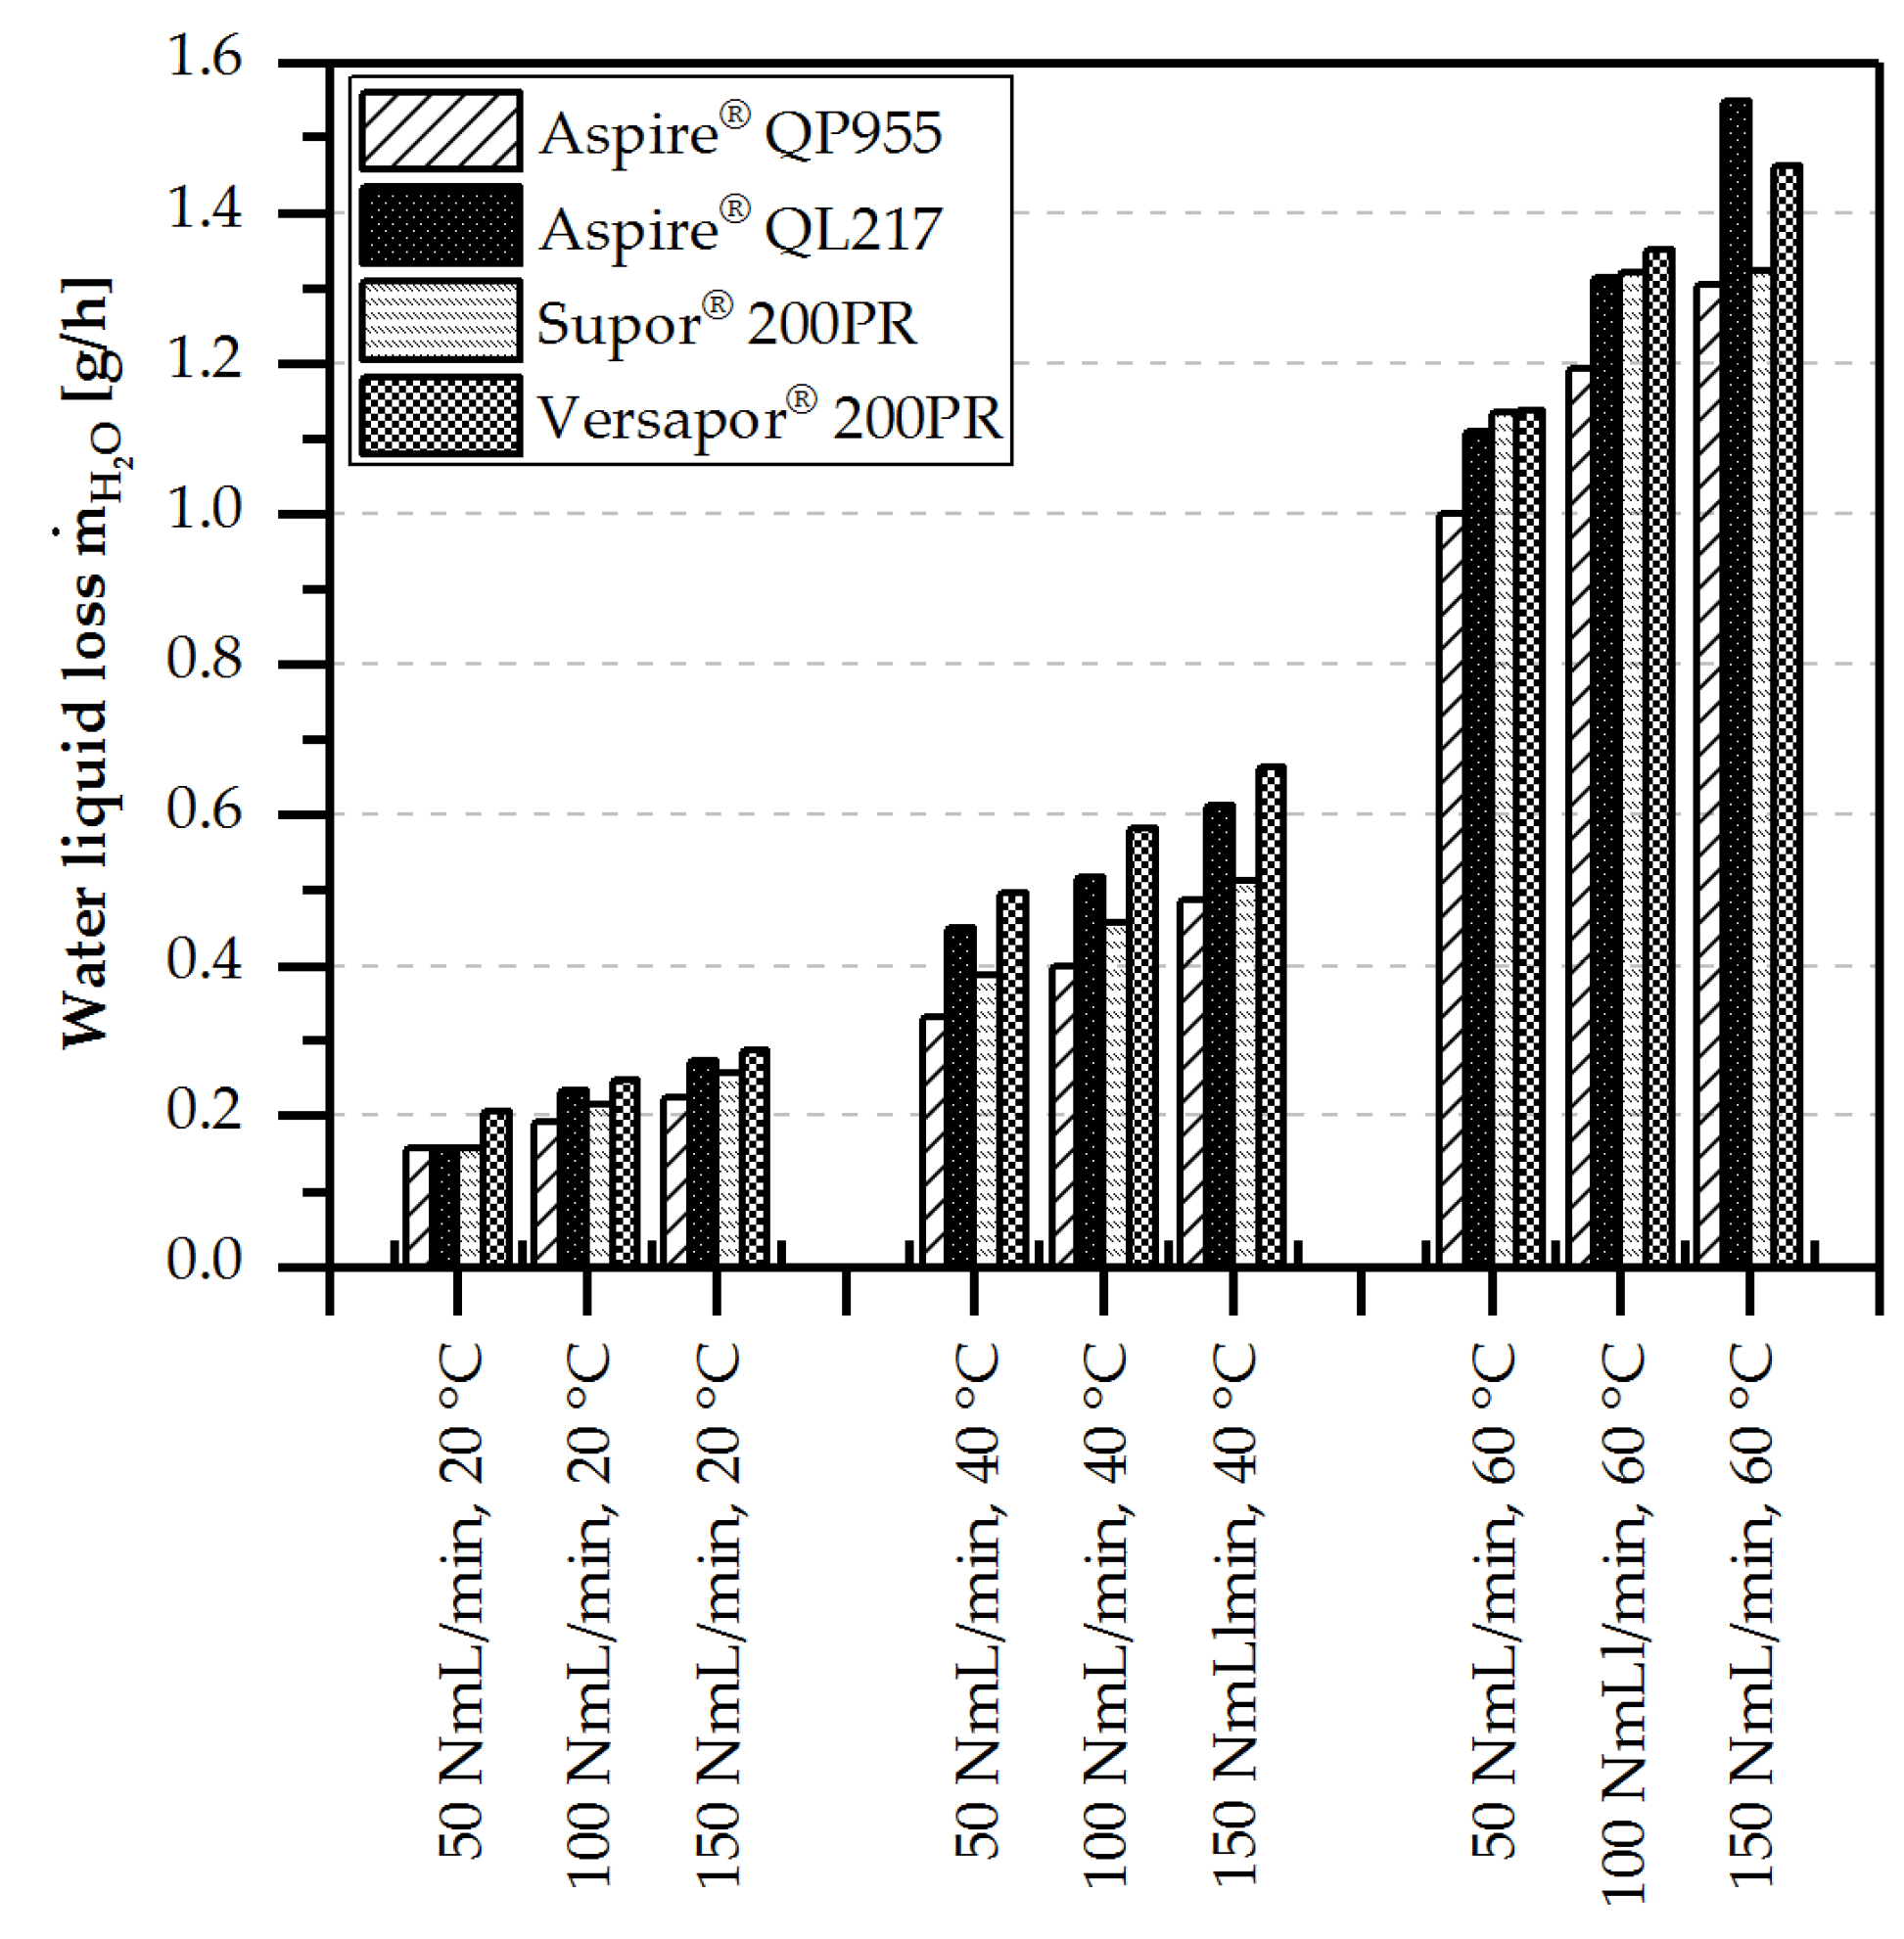
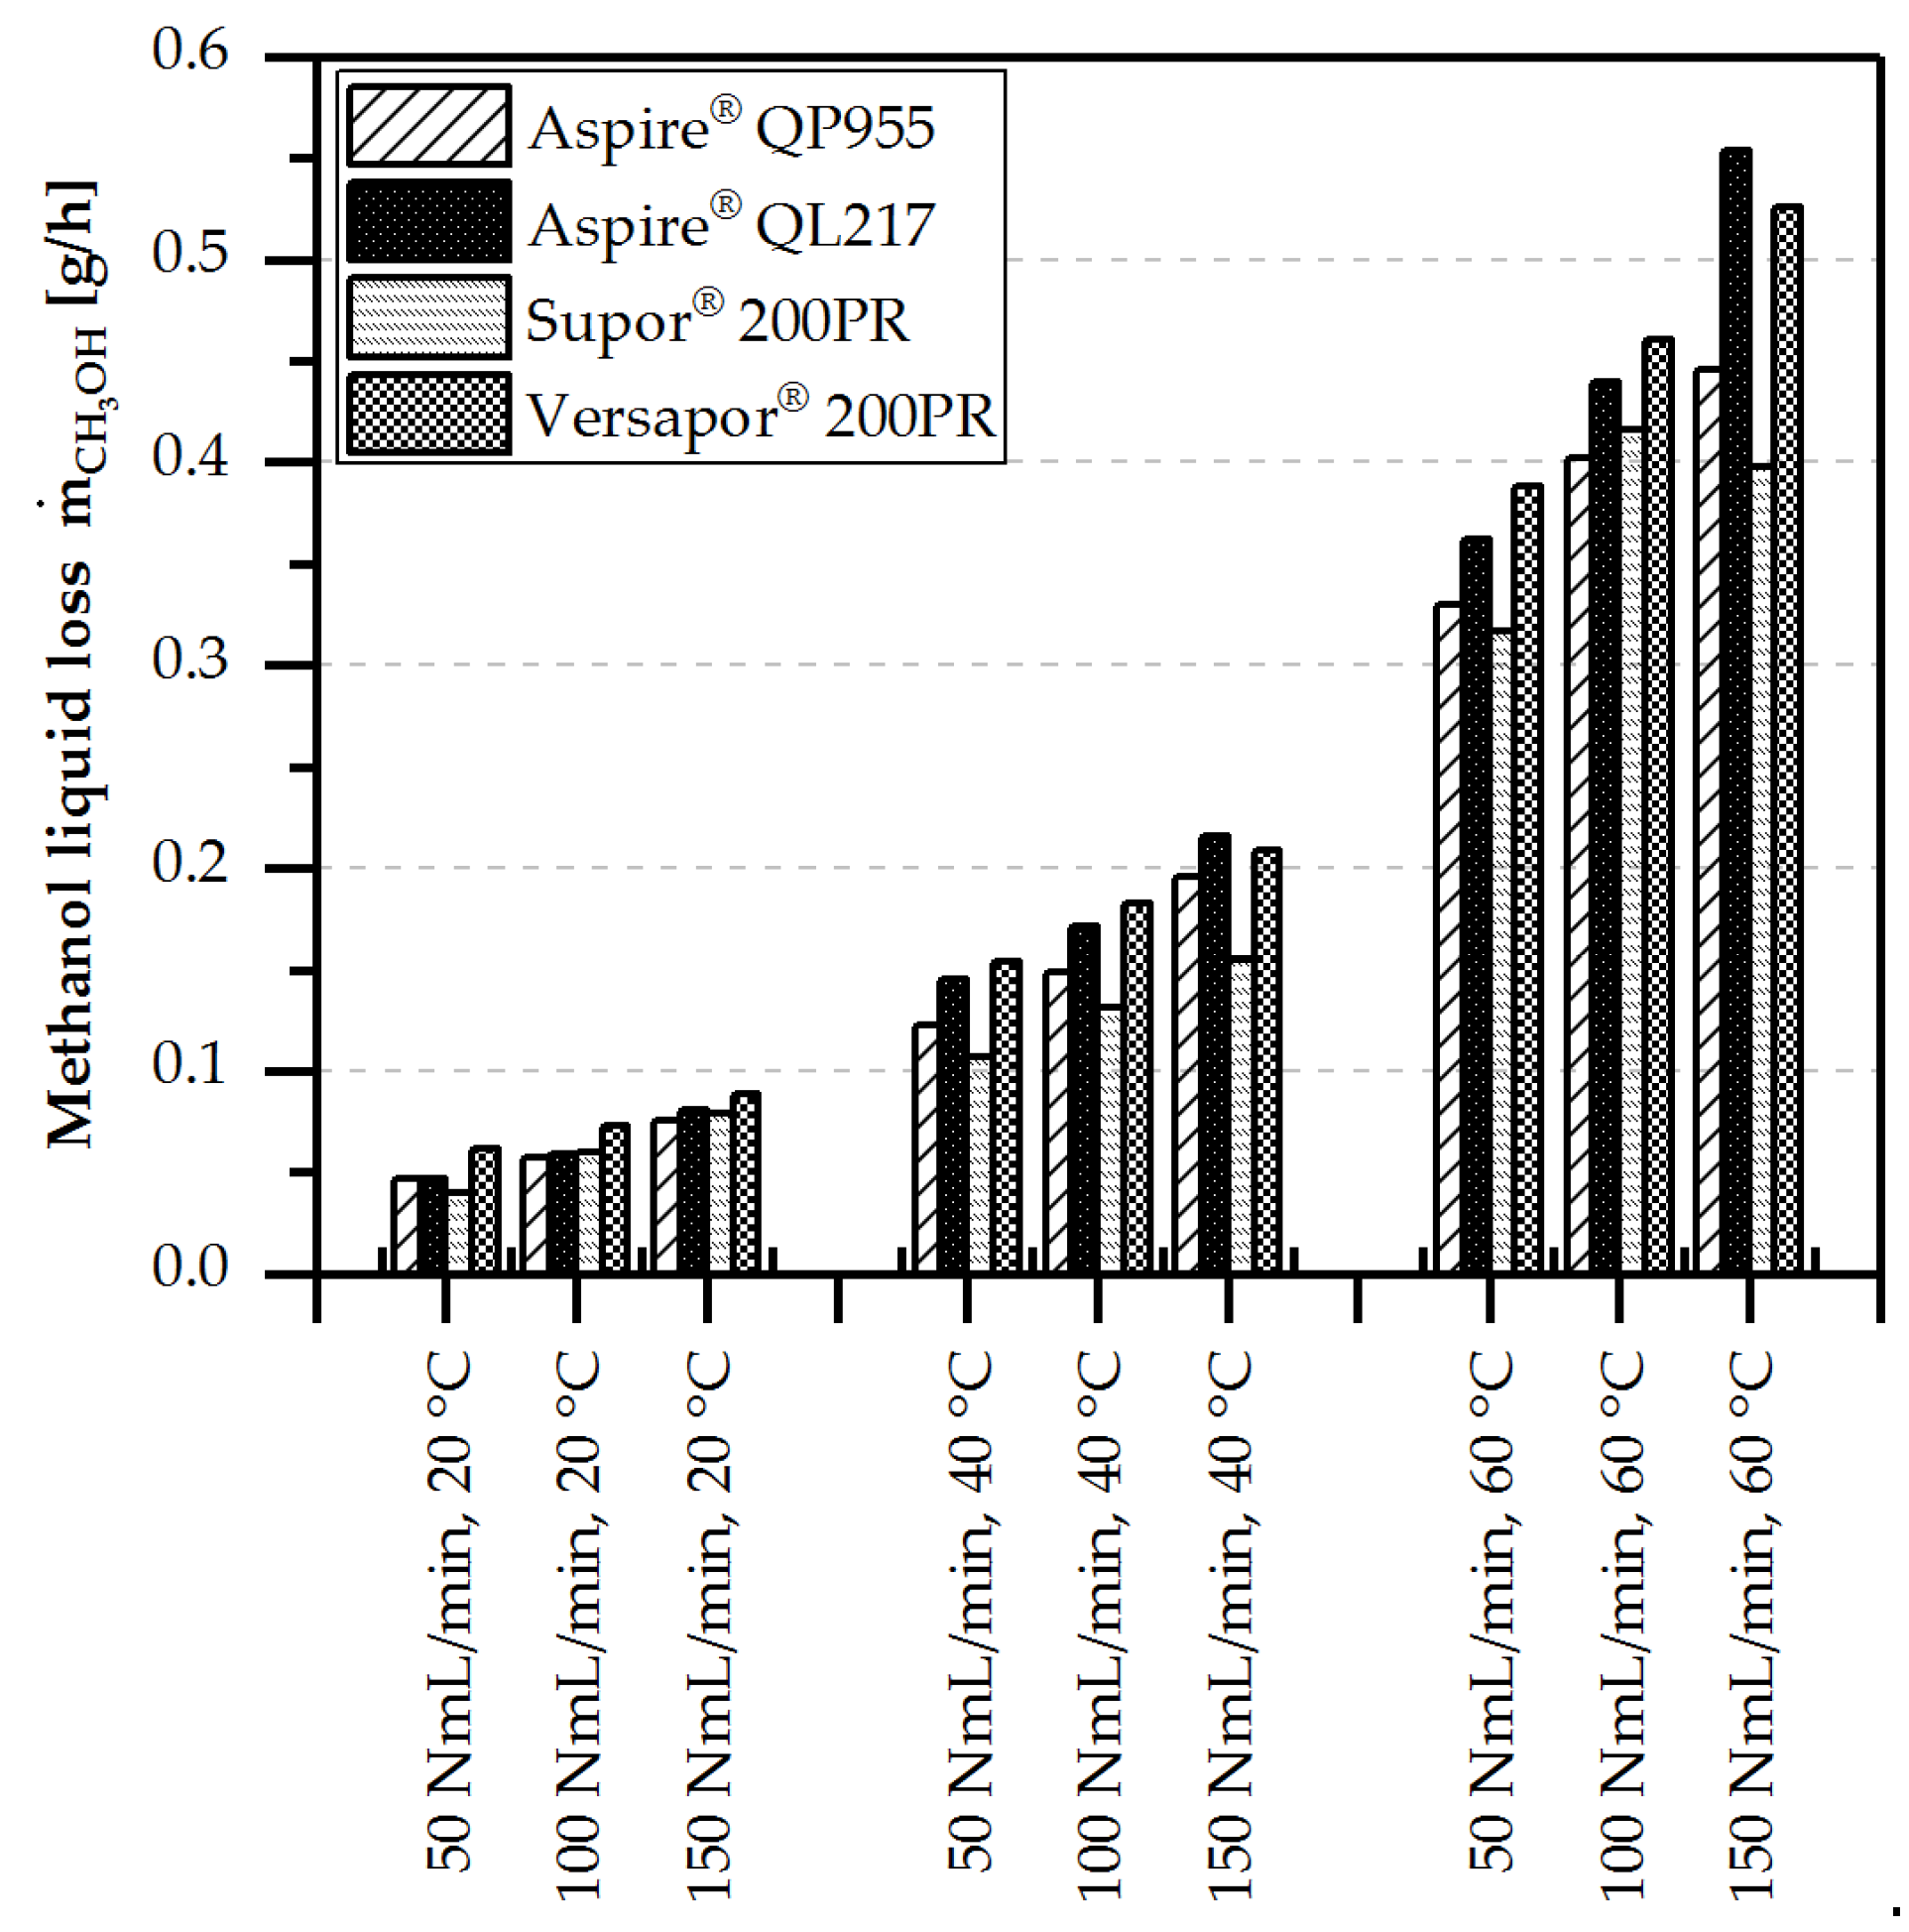
4.3.2. Liquid Loss of Water/Methanol
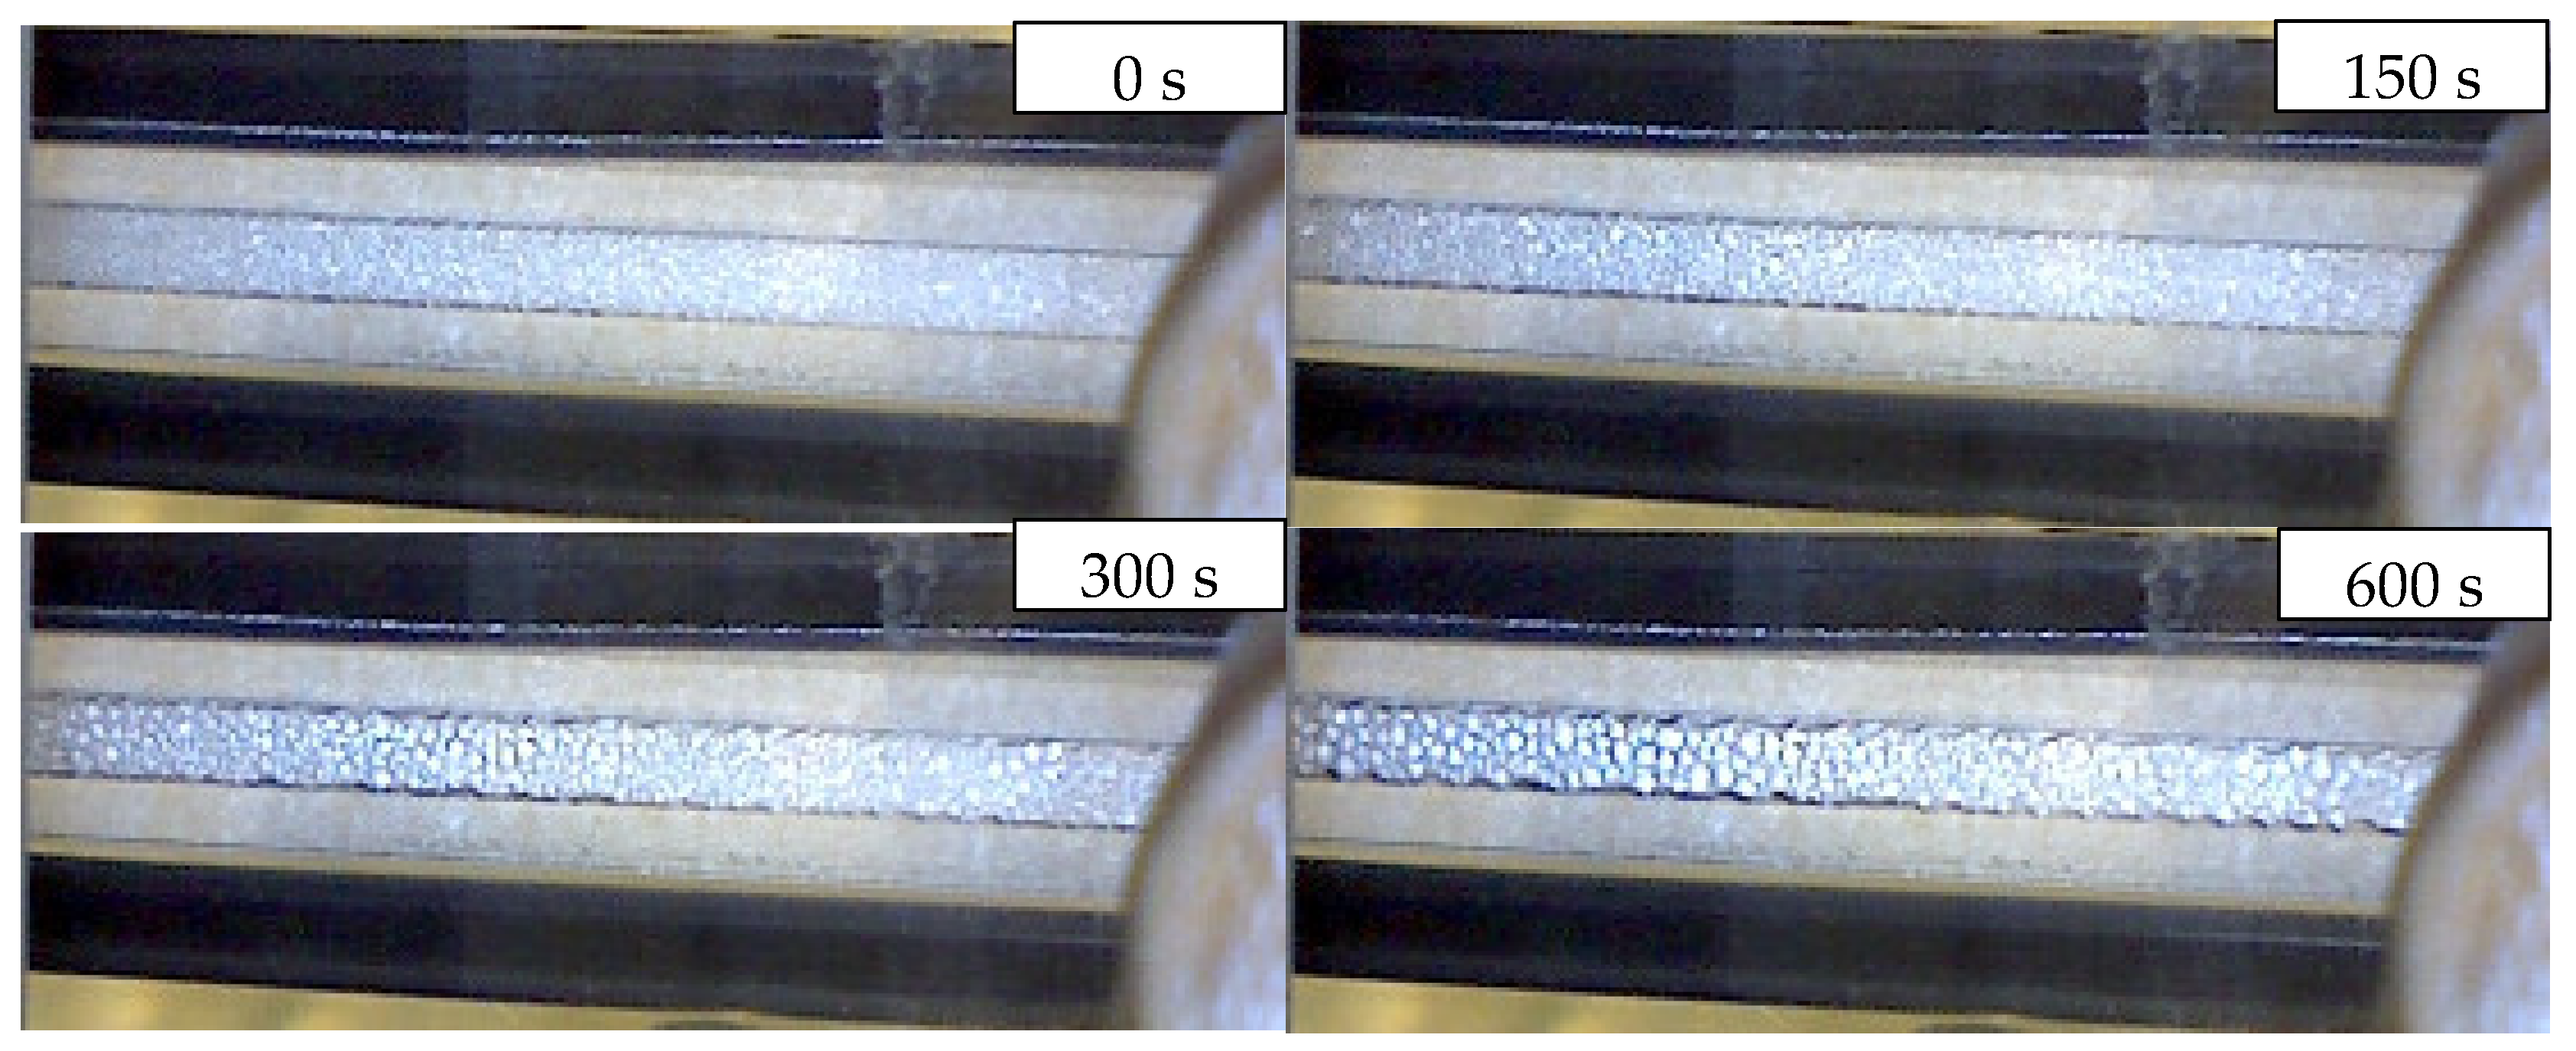
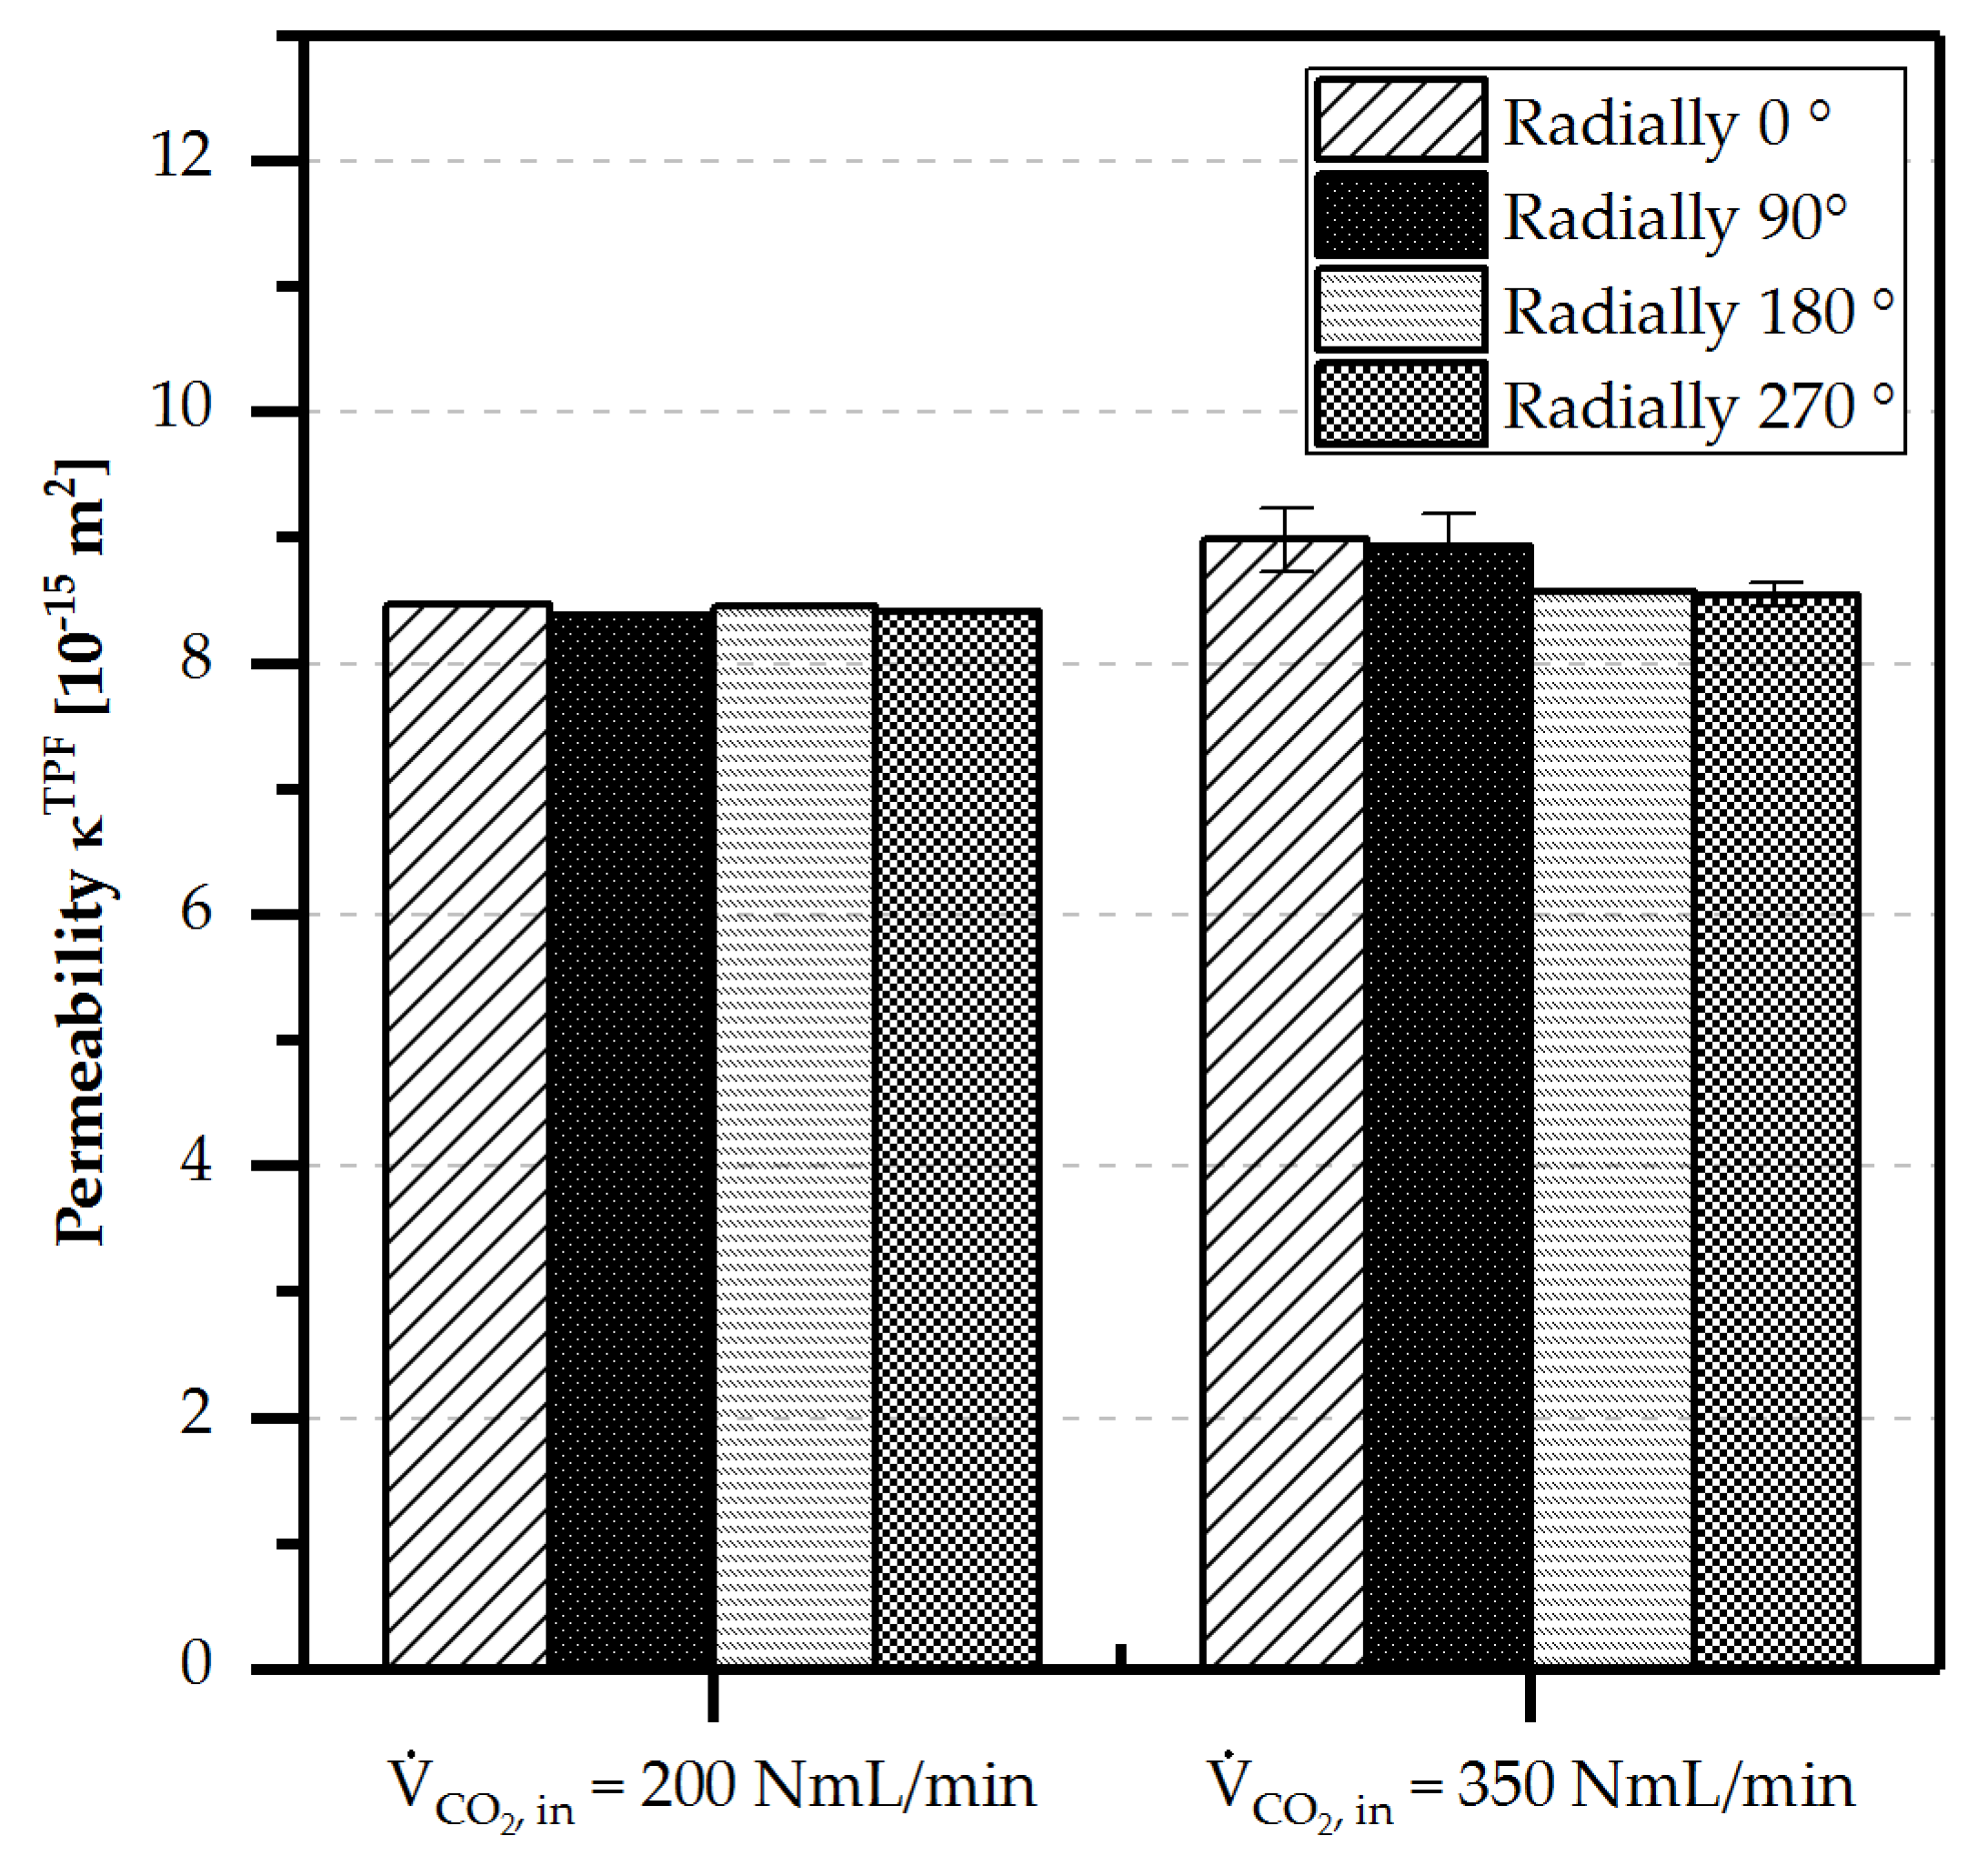
4.3.3. Orientation Independence
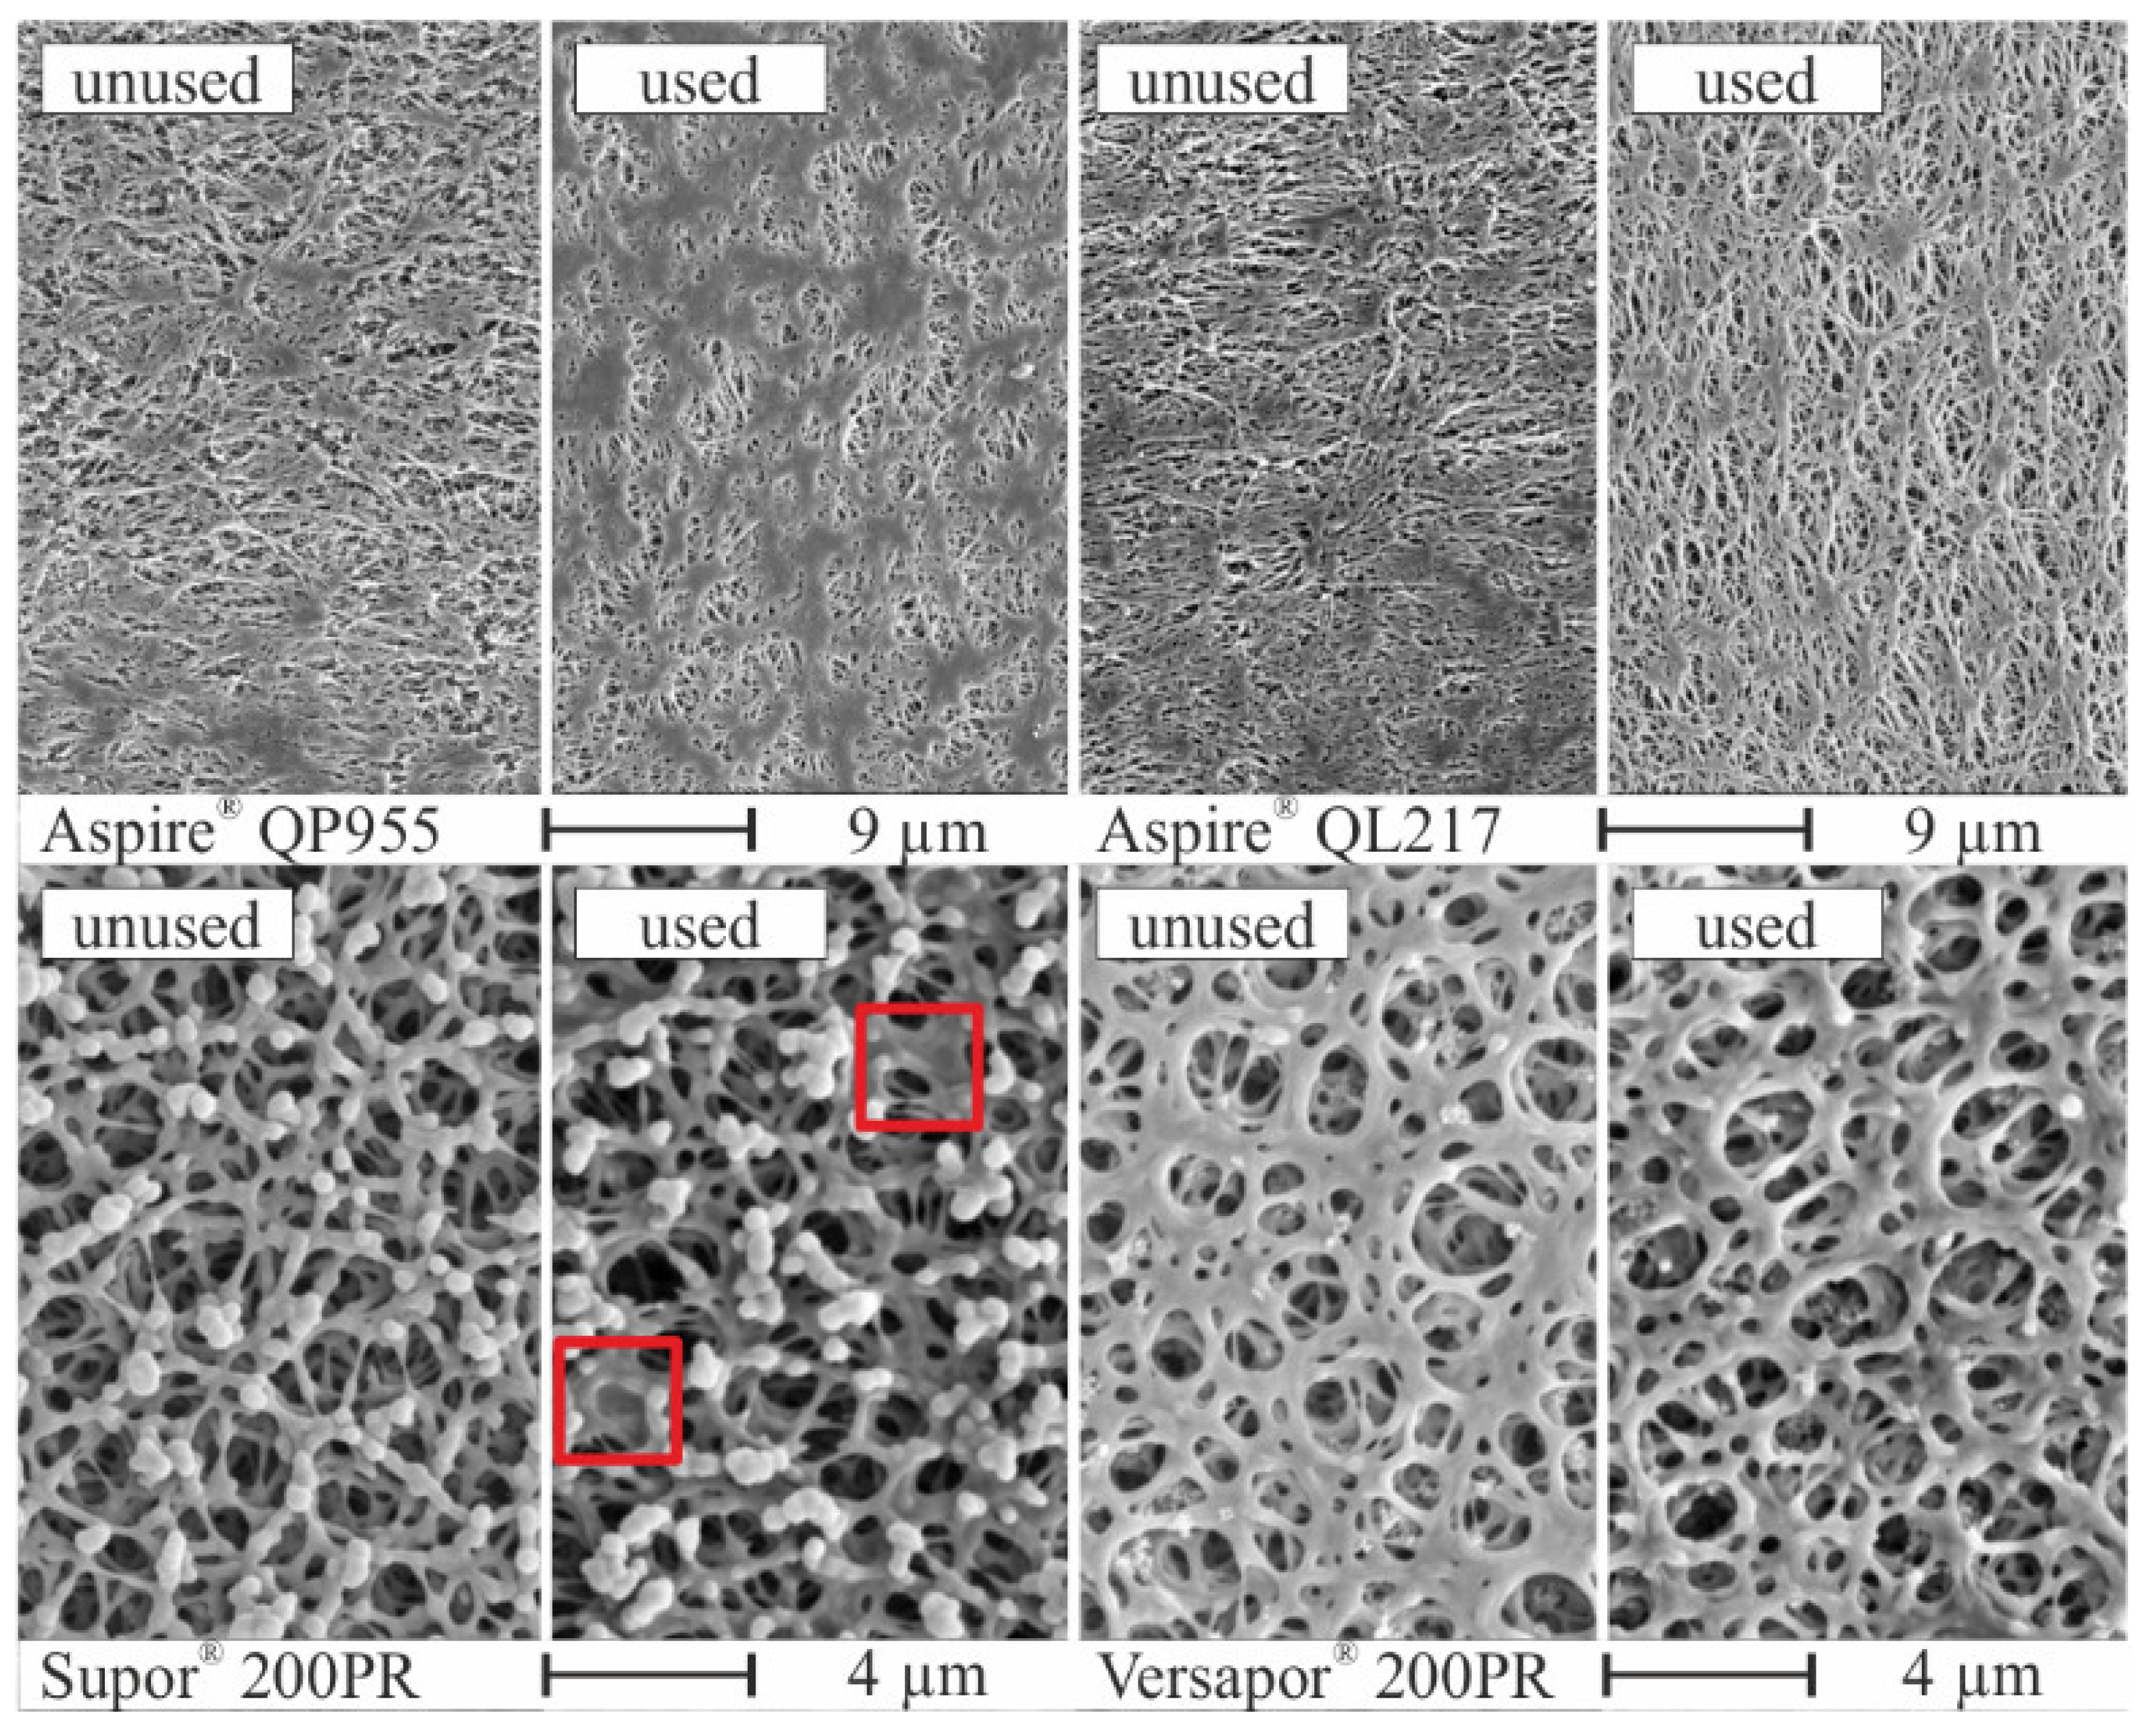
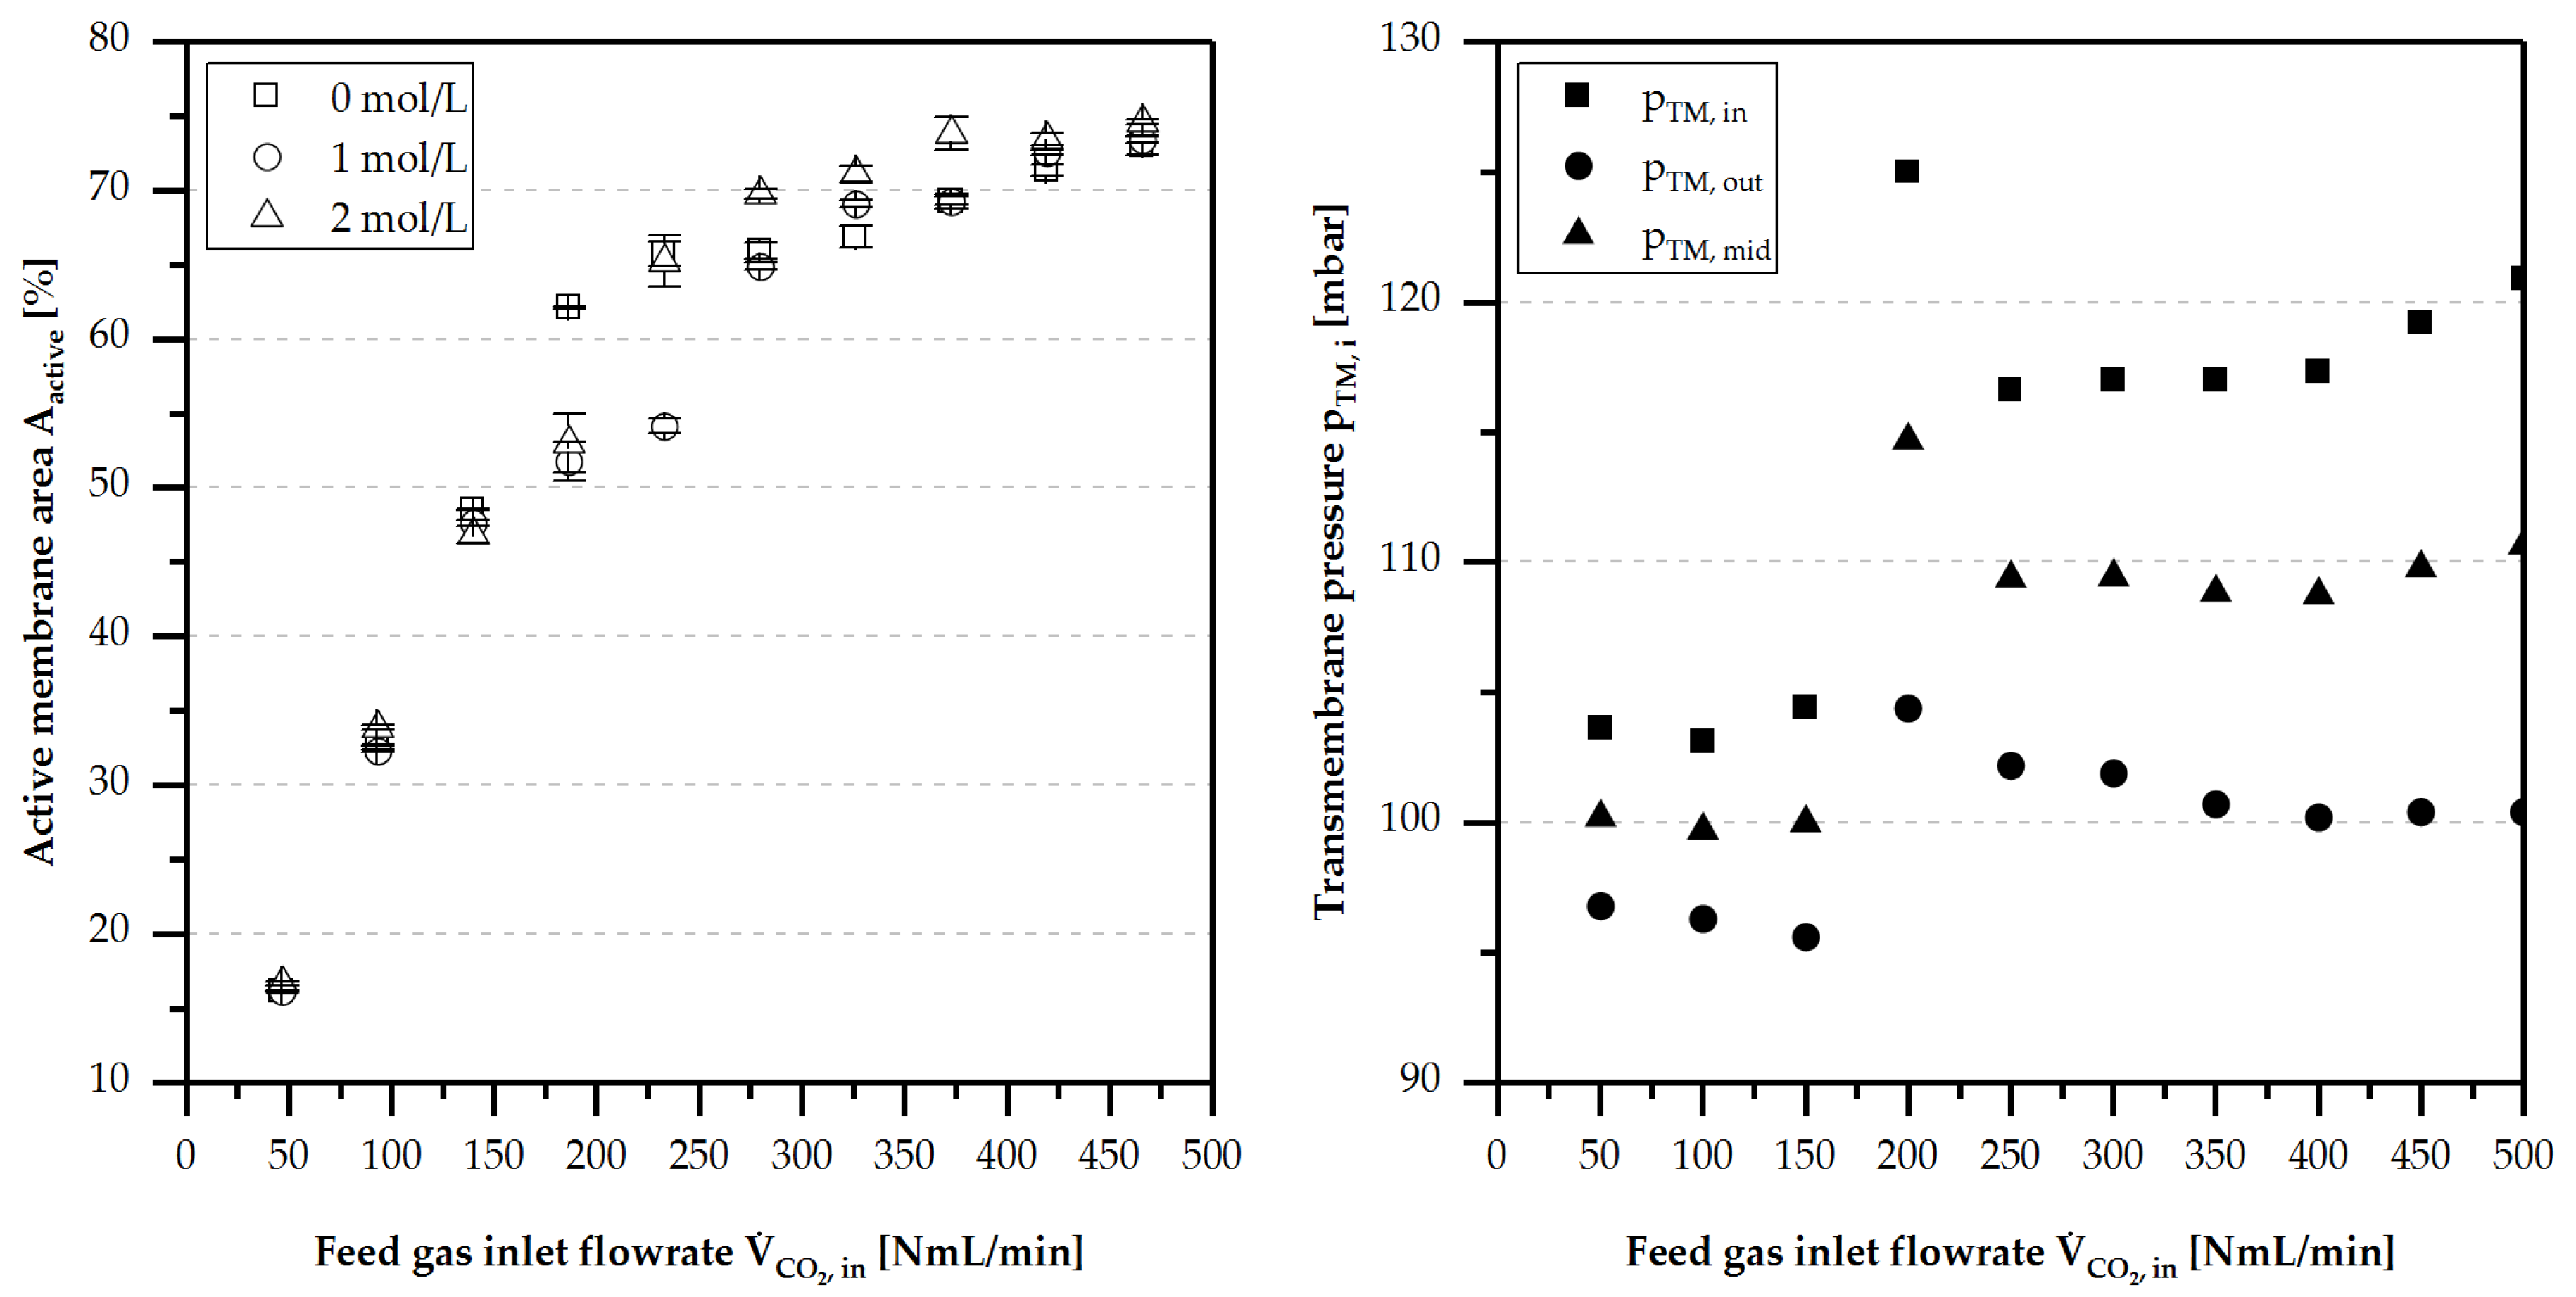
4.4. Active Membrane Area
5. Conclusions
Supplementary Materials
Author Contributions
Funding
Acknowledgments
Conflicts of Interest
Nomenclature
| Latin Symbols | |
| A | area (m2) |
| Co | confinement number (-) |
| d | diameter (m) |
| D | diffusion coefficient (m2 s−1) |
| dh | hydraulic dimeter (m) |
| Eö | Eötvös number (-) |
| f | multiplication factor (-) |
| g | standard gravity (9.981 kg m s−2) |
| h | height (m) |
| H | mean curvature (m−1) |
| k | curvature of sphere (m−1) |
| solubility coefficient (mol L−1 atm−1) | |
| K | Parameter (-) |
| kb | Boltzmann constant (1.38 10−23 J K−1) |
| Kn | Knudsen number (-) |
| l | thickness (m) |
| m | mass (kg) |
| M | molar mass (kg mol−1) |
| molar flux (mol s−1) | |
| p | pressure (Pa) |
| r | radius (m) |
| R | radius of channel geometry (m) |
| separation performance (-) | |
| T | temperature (K) |
| U | perimeter (m) |
| V | volume (m3) |
| volume flux (m3 s−1) | |
| Vm | molar volume (m3 mol−1) |
| v | diffusion volume (-) |
| w | width (-) |
| x/y | molar fraction (-) |
| X | solubility constant (-) |
| Y | molar loading (-) |
| Subscripts | |
| active | active |
| air | air |
| backer | backer material |
| cap | capillary |
| coll. | collision |
| crit | critical |
| CH3OH | methanol |
| CO2 | carbon dioxide |
| diff | diffusive |
| feed | feed |
| gas | gas |
| H2O | water |
| in | in |
| inlet | inlet |
| Kn | Knudsen |
| liq | liquid |
| lg | liquid-gas-interface |
| mem | membrane |
| mol | molecular |
| nw | non-wetted |
| out | out |
| p | pores |
| perm | permeate |
| sg | solid-gas-interface |
| sl | solid-liquid-interface |
| sol | dissolved |
| sweep | sweep |
| tm | trans membrane |
| TPF | two-phase-flow |
| w | wetted |
| t,b,l,r | top, bottom, left, right |
| Greek symbols | |
| β | mass transfer coefficient (m s−1) |
| η | dynamic viscosity (Pa s) |
| ϑ | temperature (°C) |
| κ | permeability (m2) |
| λ | mean free path length (m) |
| ρ | density (kg m−3) |
| σ | surface tension (N m−1) |
| collision diameter (m) | |
| φ | contact angle (°) |
| Δ | gradient (-) |
| ω | mass fraction (-) |
| Abbreviations | |
| µDMFC | micro-direct methanol fuel cell |
| DIK | Deutsches Institut für Kautschuktechnologie |
| FTIR | Fourier-transform infrared |
| IMVT | Institute for Micro Process Engineering |
| KIT | Karlsruhe Institute of Technology |
| LOC | lab on a chip |
| PMMA | polymethylmethacrylate |
| PP | polypropylene |
| PTFE | polytetrafluoroethylene |
| SEM | scanning electron microscope |
| separation performance | |
| TPF | two-phase flow |
| ZBT | Zentrum für Brennstoffzellentechnik |
References
- Schaevitz, S.B. Powering the wireless world with MEMS. Proc. SPIE 2012, 8248, 1–15. [Google Scholar] [CrossRef]
- Krewer, U. Portable Energiesysteme: Von elektrochemischer Wandlung bis Energy Harvesting. Chem. Ing. Tech. 2011, 83, 1974–1983. [Google Scholar] [CrossRef]
- Rummich, E. Energiespeicher. Elektrotech. Inftech. 2013, 130, 143–144. [Google Scholar] [CrossRef]
- Li, X.; Faghri, A. Review and advances of direct methanol fuel cells (DMFCs) part I: Design, fabrication, and testing with high concentration methanol solutions. J. Power Sources 2013, 226, 223–240. [Google Scholar] [CrossRef]
- Novosolution. Freezing Points of Methanol/Water Solutions. Available online: http://novosolution.ca/images/Freezing-Points-Methanol.pdf (accessed on 20 February 2018).
- Paust, N.; Krumbholz, S.; Munt, S.; Müller, C.; Koltay, P.; Zengerle, R.; Ziegler, C. Self-regulating passive fuel supply for small direct methanol fuel cells operating in all orientations. J. Power Sources 2009, 192, 442–450. [Google Scholar] [CrossRef]
- Zenith, F.; Krewer, U. Modelling, dynamics and control of a portable DMFC system. J. Process Control 2010, 20, 630–642. [Google Scholar] [CrossRef]
- Zenith, F.; Weinzierl, C.; Krewer, U. Model-based analysis of the feasibility envelope for autonomous operation of a portable direct methanol fuel-cell system. Chem. Eng. Sci. 2010, 65, 4411–4419. [Google Scholar] [CrossRef]
- Meng, D.D.; Kim, J.; Kim, C.-J. A distributed gas breather for micro direct methanol fuel cell (μ-DMFC). In Proceedings of the Sixteenth Annual International Conference on Micro Electro Mechanical Systems, Kyoto, Japan, 23 January 2003. [Google Scholar] [CrossRef]
- Lee, S.-W.; Wong, S.-C. Design and fabrication of multidirectional microbubble separator. Proc. SPIE 2005, 5718, 194–199. [Google Scholar] [CrossRef]
- Amon, C.H.; Yao, S.-C.; Tang, X.; Hsieh, C.-C.; Alyousef, Y.; Vladimer, M.; Fedder, G.K. Micro-electro-mechanical systems (MEMS)-based micro-scale direct methanol fuel cell development. Energy 2006, 31, 636–649. [Google Scholar] [CrossRef]
- Alexander, B.R.; Wang, E.N. Design of a Microbreather for Two-Phase Microchannel Heat Sinks. Nanoscale Microscale Thermophys. Eng. 2009, 13, 151–164. [Google Scholar] [CrossRef]
- Kraus, M.; Krewer, U. Experimental analysis of the separation efficiency of an orientation independent gas/liquid membrane separator. Sep. Purif. Technol. 2011, 81, 347–356. [Google Scholar] [CrossRef]
- Meng, D.D.; Kim, J.; Kim, C.-J. A degassing plate with hydrophobic bubble capture and distributed venting for microfluidic devices. J. Micromech. Microeng. 2006, 16, 419–424. [Google Scholar] [CrossRef]
- Meng, D.D.; Cubaud, T.; Ho, C.-M.; Kim, C.-J. A Methanol-Tolerant Gas-Venting Microchannel for a Microdirect Methanol Fuel Cell. J. Microelectromech. Syst. 2007, 16, 1403–1410. [Google Scholar] [CrossRef]
- Meng, D.D.; Kim, C.J. An active micro-direct methanol fuel cell with self-circulation of fuel and built-in removal of CO2 bubbles. J. Power Sources 2009, 194, 445–450. [Google Scholar] [CrossRef]
- Xu, J.; Vaillant, R.; Attinger, D. Use of a porous membrane for gas bubble removal in microfluidic channels: Physical mechanisms and design criteria. Microfluid. Nanofluid. 2010, 9, 765–772. [Google Scholar] [CrossRef]
- David, M.P.; Steinbrenner, J.E.; Miler, J.; Goodson, K.E. Adiabatic and diabatic two-phase venting flow in a microchannel. Int. J. Multiph. Flow 2011, 37, 1135–1146. [Google Scholar] [CrossRef]
- Fazeli, A.; Moghaddam, S. Microscale phase separator for selective extraction of CO2 from methanol solution flow. J. Power Sources 2014, 271, 160–166. [Google Scholar] [CrossRef]
- Diversified Enterprises. Surface Energy Data for PTFE. 2018. Available online: https://www.accudynetest.com/polymer_surface_data/ptfe.pdf (accessed on 20 February 2018).
- Huh, D.; Kuo, C.-H.; Grotberg, J.B.; Takayama, S. Gas-liquid two-phase flow patterns in rectangular polymeric microchannels: Effect of surface wetting properties. New J. Phys. 2009, 11, 75034. [Google Scholar] [CrossRef] [PubMed]
- Serizawa, A.; Feng, Z.; Kawara, Z. Two-phase flow in microchannels. Exp. Therm. Fluid Sci. 2002, 26, 703–714. [Google Scholar] [CrossRef]
- Suo, M. Two-Phase Flow in Capillary Tubes. Ph.D. Thesis, Massachusetts Institute of Technology, Cabridge, MA, USA, 1960. [Google Scholar]
- Brauner, N.; Maron, D.M. Identification of the range of ‘small diameters’ conduits, regarding two-phase flow pattern transitions. Int. Commun. Heat Mass Transf. 1992, 19, 29–39. [Google Scholar] [CrossRef]
- Cussler, E.L. Diffusion. Mass Transfer in Fluid Systems, 3rd ed.; Cambridge University Press: Cambridge, UK, 2011. [Google Scholar]
- Fuller, E.N.; Giddings, J.C. A Comparison of Methods for Predicting Gaseous Diffusion Coefficients. J. Chromatogr. Sci. 1965, 3, 222–227. [Google Scholar] [CrossRef]
- Weiss, R.F. Carbon dioxide in water and seawater: The solubility of a non-ideal gas. Mar. Chem. 1974, 2, 203–215. [Google Scholar] [CrossRef]
- Schüler, N.; Hecht, K.; Kraut, M.; Dittmeyer, R. On the Solubility of Carbon Dioxide in Binary Water–Methanol Mixtures. J. Chem. Eng. Data 2012, 57, 2304–2308. [Google Scholar] [CrossRef]
- Diversified Enterprises. Surface Energy Data for PMMA. 2018. Available online: https://www.accudynetest.com/polymer_surface_data/pmma_polymethylmethacrylate.pdf (accessed on 20 February 2018).
- Clarcor Industrial Air. Data Sheet aspire® ePTFE Membrane Laminate; Aspire® QP955; Clarcor Industrial Air: Overland Park, KS, USA, 2014. [Google Scholar]
- Clarcor Industrial Air. Data Sheet aspire® ePTFE Membrane Laminate; Aspire® QL217; Clarcor Industrial Air: Overland Park, KS, USA, 2014. [Google Scholar]
- Pall Corporaton. Data Sheet Supor® R Membrane. Supor 200PR. 2009. Available online: http://www.pall.de/pdfs/misc/IMGSRMEN.pdf (accessed on 20 February 2018).
- Pall Corporaton. Data Sheet Versapor® R Membrane. Versapor 200PR. 2010. Available online: http://www.pall.de/pdfs/misc/IMGVRMEN.pdf (accessed on 20 February 2018).
- Jennings, S.G. The mean free path in air. J. Aerosol Sci. 1988, 19, 159–166. [Google Scholar] [CrossRef]
- Rashidi, R.; Dincer, I.; Naterer, G.F.; Berg, P. Performance evaluation of direct methanol fuel cells for portable applications. J. Power Sources 2009, 187, 509–516. [Google Scholar] [CrossRef]


| Investigator | Research Topic | Membrane | Material | Fluids | Mode |
|---|---|---|---|---|---|
| Meng et al. [9] | Distributed Breather | Microsieve | Silicon | CO2 (g)/H2O (l) | P |
| Lee et al. [10] | Micro Bubble Separator | Microsieve | Silicon | CO2 (g)/H2O (l) | P |
| Amon et al. [11] | Micro-electro-mechanical based µDMFC | Microsieve | Silicon | CO2/H2O + CH3OH (l) | P |
| Alexander et al. [12] | Micro-breather (heat sink) | Microsieve | Silicon | H2O (g)/H2O (l) | P |
| Kraus et al. [13] | Orientation indipendent microseparator | Membrane | PTFE | CO2 (g)/H2O (l) | A |
| Meng et al. [14,15,16] | Membrane based micro separator in a µDMFC | Membrane | PTFE|PP | CO2 (g)/H2O + CH3OH (l) | A |
| Xu et al. [17] | Active gas/liquid phase separation | Membrane | ACP | N2 (g)/H2O (l) | A |
| David et al. [18] | Micro heat exchanger and microgas separator | Membrane | PTFE | Air (g)/H2O (l) | A |
| Fazeli et al. [19] | Differential pressure on the gas/liquid separation | Membrane | PTFE | CO2 (g)/H2O + CH3OH (l) | A |
| Hydrophobic Membranes | Functional Layer Material | Support Material | Thick-Ness | Pore Size | Contact Angle | Water Entry Pressure |
|---|---|---|---|---|---|---|
| Aspire® QP955 [30] | PTFE | Polyester | 200 µm | 100 nm | 120° | ≥4.5 bar |
| Aspire® QL217 [31] | PTFE | Polypropylen | 200 µm | 200 nm | 120° | ≥1.0 bar |
| Supor® 200PR [32] | Polyethersulfon | Polyester | 170 µm | 200 nm | 138° | ≥1.38 bar |
| Versapor® 200PR [33] | Acrylic Copolymer | Nylon | 230 µm | 200 nm | 120° | ≥1.79 bar |
| Evaluation Criteria | ||||||
|---|---|---|---|---|---|---|
| Separation Performance | 1 | 5 | 50 … 400 | 200 | 20, 40, 60 | 100 |
| Liquid Loss | 0, 1, 2 | 5 | 50 … 400 | 200 | 20, 40, 60 | 100 |
| Orientation Independence | 1 | 5 | 200, 350 | 200 | 40 | 100 |
| Membrane | |
|---|---|
| Aspire® QL217 | 9.3 |
| Aspire® QP955 | 14.0 |
| Versapor® 200PR | 10.3 |
| Supor® 200PR | 7.9 |
| Membrane | ||||
|---|---|---|---|---|
| Aspire® QP955 | 9.3 | 7.2 | 0.77 | 88.7 |
| Aspire® QL217 | 14.0 | 10.6 | 0.76 | 86.7 |
| Supor® 200PR | 10.3 | 9.0 | 0.87 | 100.0 |
| Versapor® 200PR | 9.1 | 7.7 | 0.85 | 96.9 |
© 2018 by the authors. Licensee MDPI, Basel, Switzerland. This article is an open access article distributed under the terms and conditions of the Creative Commons Attribution (CC BY) license (http://creativecommons.org/licenses/by/4.0/).
Share and Cite
Dyrda, K.M.; Wilke, V.; Haas-Santo, K.; Dittmeyer, R. Experimental Investigation of the Gas/Liquid Phase Separation Using a Membrane-Based Micro Contactor. ChemEngineering 2018, 2, 55. https://doi.org/10.3390/chemengineering2040055
Dyrda KM, Wilke V, Haas-Santo K, Dittmeyer R. Experimental Investigation of the Gas/Liquid Phase Separation Using a Membrane-Based Micro Contactor. ChemEngineering. 2018; 2(4):55. https://doi.org/10.3390/chemengineering2040055
Chicago/Turabian StyleDyrda, Kay Marcel, Vincent Wilke, Katja Haas-Santo, and Roland Dittmeyer. 2018. "Experimental Investigation of the Gas/Liquid Phase Separation Using a Membrane-Based Micro Contactor" ChemEngineering 2, no. 4: 55. https://doi.org/10.3390/chemengineering2040055
APA StyleDyrda, K. M., Wilke, V., Haas-Santo, K., & Dittmeyer, R. (2018). Experimental Investigation of the Gas/Liquid Phase Separation Using a Membrane-Based Micro Contactor. ChemEngineering, 2(4), 55. https://doi.org/10.3390/chemengineering2040055