Controlling the Synthesis Conditions for Tuning the Properties of Hydrotalcite-Like Materials at the Nano Scale


Abstract
1. Introduction
2. Results and Discussion
3. Materials and Methods
3.1. Aging without Further Treatment
3.2. Aging with Hydrothermal Treatment
3.3. Aging under Microwave Treatment
4. Experimental Techniques
5. Conclusions
Supplementary Materials
Author Contributions
Funding
Conflicts of Interest
References
- Evans, D.G.; Slade, R.C.T. Structural aspects of layered double hydroxides. In Layered Double Hydroxides; Structure and Bonding; Duan, X., Evans, G.D., Eds.; Springer: Berlin, German, 2006; Volume 119, Chapter 1; pp. 1–87. ISBN 10-3-540-28279-3. [Google Scholar]
- Yu, J.; Wang, Q.; O’Hare, D.; Sun, L. Preparation of two dimensional layered double hydroxide nanosheets and their applications. Chem. Soc. Rev. 2017, 46, 5950–5974. [Google Scholar] [CrossRef] [PubMed]
- Cavani, F.; Trifirò, F.; Vaccari, A. Hydrotalcite-type anionic clays: Preparation, properties and applications. Catal. Today 1991, 11, 173–301. [Google Scholar] [CrossRef]
- Monzón, A.; Romeo, E.; Marchi, A.J. Hydrogenation Catalysts by Mixed Oxides Prepared from LDHs. In Layered Double Hydroxides: Present and Future; Rives, V., Ed.; Nova Science Publishers: New York, NY, USA, 2001; Chapter 11; pp. 323–382. ISBN 1-59033-060-9. [Google Scholar]
- Li, P.; Yu, F.; Altaf, N.; Zhu, M.; Li, J.; Dai, B.; Wang, Q. Two-Dimensional Layered Double Hydroxides for Reactions of Methanation and Methane Reforming in C1 Chemistry. Materials 2018, 11, 221. [Google Scholar] [CrossRef] [PubMed]
- Willinton, Y.; Hernández, J.L.; Van Der Voort, P. Recent advances on the utilization of layered double hydroxides (LDHs) and related heterogeneous catalysts in a lignocellulosic-feedstock biorefinery scheme. Green Chem. 2017, 19, 5269–5302. [Google Scholar] [CrossRef]
- Sikander, U.; Sufian, S.; Salam, M.A. A review of hydrotalcite based catalysts for hydrogen production systems. Int. J. Hydrog. Energy 2017, 42, 19851–19868. [Google Scholar] [CrossRef]
- Basile, F.; Benito, P.; Fornasari, G.; Rosetti, V.; Scavetta, E.; Tonelli, D.; Vaccari, A. Electrochemical synthesis of novel structured catalysts for H2 production. Appl. Catal. B Environ. 2009, 91, 563–572. [Google Scholar] [CrossRef]
- Chai, R.; Li, Y.; Zhang, Q.; Fan, S.; Zhang, Z.; Chen, P.; Zhao, G.; Liu, Y.; Lu, Y. Foam-Structured NiO-MgO-Al2O3 NanocompositesDerived from NiMgAl Layered Double Hydroxides In Situ Grown onto Nickel Foam: A Promising Catalyst for High-Throughput Catalytic Oxymethane Reforming. Chem. Catal. Chem. 2017, 9, 268–272. [Google Scholar] [CrossRef]
- Chai, R.; Fan, S.; Zhang, Z.; Chen, P.; Zhao, G.; Liu, Y.; Lu, Y. Free-Standing NiO-MgO-Al2O3 Nanosheets Derived from Layered Double Hydroxides Grown onto FeCrAl-Fiber as Structured Catalysts for Dry Reforming of Methane. ACS Sustain. Chem. Eng. 2017, 5, 4517–4522. [Google Scholar] [CrossRef]
- Chai, R.; Zhang, Z.; Chen, P.; Zhao, G.; Liu, Y.; Lu, Y. Ni-foam-structured NiO-MOx-Al2O3 (M = Ce or Mg) nanocomposite catalyst for high throughput catalytic partial oxidation of methane to syngas. Microporous Mesoporus Mater. 2017, 253, 123–128. [Google Scholar] [CrossRef]
- Ho, P.H.; de Nolf, W.; Ospitali, F.; Gondolini, A.; Fornasari, G.; Scavetta, E.; Tonelli, D.; Vaccari, A.; Benito, P. Coprecipitated-like hydrotalcite-derived coatings on open-cell metallic foams by electrodeposition: Rh nanoparticles on oxide layers stable under harsh reaction conditions. Appl. Catal. A Gen. 2018, 560, 12–20. [Google Scholar] [CrossRef]
- Costantino, U.; Nocchetti, M. Layered Double Hydroxides and their Intercalation Compounds in Photochemistry and in Medicinal Chemistry. In Layered Double Hydroxides: Present and Future; Rives, V., Ed.; Nova Science Publishers: New York, NY, USA, 2001; Chapter 12; pp. 383–411. ISBN 1-59033-060-9. [Google Scholar]
- Mishra, G.; Dasha, B.; Pandey, S. Layered double hydroxides: A brief review from fundamentals to application as evolving biomaterials. Appl. Clay Sci. 2018, 153, 172–186. [Google Scholar] [CrossRef]
- Ray, S.S.; Mosangi, D.; Pillai, S. Layered Double Hydroxide-Based Functional Nanohybrids as Controlled Release Carriers of Pharmaceutically Active Ingredients. Chem. Rec. 2018, 1–16. [Google Scholar] [CrossRef] [PubMed]
- Saifullah, B.; Hussein, M.Z. Inorganic nanolayers: Structure, preparation, and biomedical applications. Int. J. Nanomed. 2015, 10, 5609–5633. [Google Scholar] [CrossRef]
- Senapati, S.; Mahanta, A.K.; Kumar, S.; Maiti, P. Controlled drug delivery vehicles for cancer treatment and their performance. Signal Transduct. Target. Ther. 2018, 3, 1–19. [Google Scholar] [CrossRef] [PubMed]
- Rives, V.; Del Arco, M.; Martín, C. Layered double hydroxides as drug carriers and for controlled release of non-steroidal antiinflammatory drugs (NSAIDs): A review. J. Control. Release 2013, 169, 28–39. [Google Scholar] [CrossRef] [PubMed]
- Rives, V.; Del Arco, M.; Martín, C. Intercalation of drugs in layered double hydroxides and their controlled release: A review. Appl. Clay Sci. 2014, 88–89, 239–269. [Google Scholar] [CrossRef]
- Chubar, N.; Gilmour, R.; Gerda, V.; Micušík, M.; Omastova, M.; Heister, K.; Man, P.; Fraissard, J.; Zaitsev, V. Layered double hydroxides as the next generation inorganic anion exchangers: Synthetic methods versus applicability. Adv. Colloid Interface Sci. 2017, 245, 62–80. [Google Scholar] [CrossRef] [PubMed]
- Chuang, Y.H.; Tzou, Y.M.; Wang, M.K.; Liu, C.H.; Chiang, P.N. Removal of 2-Chlorophenol from Aqueous Solution by Mg/Al Layered Double Hydroxide (LDH) and Modified LDH. Ind. Eng. Chem. Res. 2008, 47, 3813–3819. [Google Scholar] [CrossRef]
- Rives, V.; Labajos, F.M.; Herrero, M. Effect of preparation procedures on the properties of LDH/organo nancomposites. In Nanocomposites: Synthesis, Characterization and Applications; Wang, X.Y., Ed.; Nova Science Publishers: New York, NY, USA, 2013; Chapter 8; pp. 169–202. ISBN 978-1-62948-226-2. [Google Scholar]
- Rives, V.; Labajos, F.M.; Herrero, M. Layered double hydroxides as nanofillers of composites and nanocomposite materials based on polyethylene. In Polyethylene-Based Blends, Composites and Nanocomposites; Visakh, P.M., Martínez Morlanes, M.J., Eds.; Nova Science Publishers: New York, NY, USA, 2015; Chapter 6; pp. 163–199. ISBN 978-1-118-83128-1. [Google Scholar]
- Linghu, W.; Yang, H.; Sun, Y.; Sheng, G.; Huang, S.Y. One Pot Synthesis of LDH/GO Composites as Highly Effective Adsorbents for Decontamination of U(VI). Sustain. Chem. Eng. 2017, 5, 5608–5616. [Google Scholar] [CrossRef]
- Climent, J.; Corma, A.; Iborra, S.; Epping, K.; Velty, A. Increasing the basicity and catalytic activity of hydrotalcites by different synthesis procedures. J. Catal. 2004, 225, 316–326. [Google Scholar] [CrossRef]
- Fetter, G.; Hernández, F.; Maubert, A.M.; Lara, V.H.; Bosch, P. Microwave Irradiation Effect on Hydrotalcite Synthesis. J. Porous Mat. 1997, 4, 27–30. [Google Scholar] [CrossRef]
- Tichit, D.; Rolland, A.; Prinetto, F.; Fetter, G.; Martinez-Ortiz, M.J.; Valenzuela, M.A.; Bosch, P. Comparison of the structural and acid–base properties of Ga- and Al-containing layered double hydroxides obtained by microwave irradiation and conventional aging of synthesis gels. J. Mater. Chem. 2002, 12, 3832–3838. [Google Scholar] [CrossRef]
- Tathod, A.P.O.; Gazit, O.M. Fundamental Insights into the Nucleation and Growth of Mg−Al Layered Double Hydroxides Nanoparticles at Low Temperature. Cryst. Growth Des. 2016, 16, 6709–6713. [Google Scholar] [CrossRef]
- Theiss, F.L.; Ayoko, G.L.; Frost, R.L. Synthesis of layered double hydroxides containing Mg2+, Zn2+, Ca2+and Al3+layer cations by co-precipitation methods—A review. Appl. Surf. Sci. 2016, 383, 200–213. [Google Scholar] [CrossRef]
- Conterosito, E.; Gianotti, V.; Palin, L.; Boccareli, E.; Viterbo, D.; Milanesio, M. Facile preparation methods of hydrotalcite layered materials and their structrual characterization by combined techniques. Inorg. Chim. Acta 2018, 470, 36–50. [Google Scholar] [CrossRef]
- Benito, P.; Labajos, F.M.; Rocha, J.; Rives, V. Influence of microwave radiation on the textural properties of layered double hydroxides. Microporous Mesoporous Mater. 2006, 94, 148–158. [Google Scholar] [CrossRef]
- Benito, P.; Guinea, I.; Labajos, F.M.; Rives, V. Microwave-assisted reconstructionof Ni, Al hydrotalcite-like compounds. J. Solid State Chem. 2008, 181, 987–996. [Google Scholar] [CrossRef]
- Alvarez, A.; Trujillano, R.; Rives, V. Gallium-containing layered double hydroxides. Appl. Clay Sci. 2013, 80–81, 326–333. [Google Scholar] [CrossRef]
- Benito, P.; Herrero, M.; Labajos, F.M.; Rives, V. Effect of post-synthesis microwave-hydrothermal treatment on the properties of layered double hydroxides and related materials. Appl. Clay Sci. 2010, 48, 218–227. [Google Scholar] [CrossRef]
- Benito, P.; Labajos, F.M.; Rives, V. Microwaves and layered double hydroxides: A smooth understanding. Pure Appl. Chem. 2009, 81, 1459–1471. [Google Scholar] [CrossRef]
- Benito, P.; Labajos, F.M.; Rives, V. Uniform Fast Growth of Hydrotalcite-like Compounds. Cryst. Growth Des. 2006, 6, 1961–1966. [Google Scholar] [CrossRef]
- Labajos, F.M.; Rives, V.; Ulibarri, M.A. Effect of hydrothermal and thermal treatments on the physicochemical properties of Mg-Al hydrotalcite-like materials. J. Mater. Sci. 1992, 27, 1546–1552. [Google Scholar] [CrossRef]
- Sharma, S.K.; Kushwaha, P.K.; Srivastava, V.K.; Bhatt, S.D.; Jasra, R.V. Effect of hydrothermal conditions on structural and textural properties of synthetic hydrotalcites of varying Mg/Al ratio. Ind. Eng. Chem. Res. 2007, 46, 4856–4865. [Google Scholar] [CrossRef]
- Zadaviciute, S.; Baltakys, K.; Bankauskaite, A. The effect of microwave and hydrothermal treatments on the properties of hydrotalcite. J. Therm. Anal. Calorim. 2017, 127, 189–196. [Google Scholar] [CrossRef]
- Belloto, M.; Rebours, B.; Clause, O.; Lynch, J.; Bazin, D.; Elkaim, E. A reexamination of hydrotalcite crystal chemistry. J. Phys. Chem. 1996, 100, 8527–8534. [Google Scholar] [CrossRef]
- Drits, V.A.; Bookin, A.S. Crystal Structure and X-ray identification of Layered Double Hydroxides. In Layered Double Hydroxides: Present and Future; Rives, V., Ed.; Nova Science Publishers: New York, NY, USA, 2001; Chapter 2; pp. 39–92. ISBN 1-59033-060-9. [Google Scholar]
- Ruano-Casero, R.J.; Pérez-Bernal, M.E.; Rives, V. Preparation and Properties of Nickel and Iron Oxides obtained by Calcination of Layered Double Hydroxides. Z. Anorg. Allg. Chem. 2005, 631, 2142–2150. [Google Scholar] [CrossRef]
- Zhitova, E.S.; Krivovichev, S.V.; Pekov, I.V.; Yakovenchuk, V.N.; Pakhomovsky, Y.A. Correlation between the d-value and the M2+:M3+ cation ratio in Mg-Al-CO3 layered double hydroxides. Appl. Clay Sci. 2016, 130, 2–11. [Google Scholar] [CrossRef]
- Alexander, L.; Klug, H.P. Determination of Crystallite Size with the X-Ray Spectrometer. J. Appl. Phys. 1950, 21, 137–142. [Google Scholar] [CrossRef]
- Kloprogge, J.T.; Frost, R.L. Infrared and Raman Spectroscopic Studies of Layered Double Hydroxides (LDHs). In Layered Double Hydroxides: Present and Future; Rives, V., Ed.; Nova Science Publishers: New York, NY, USA, 2001; Chapter 5; pp. 139–192. ISBN 1-59033-060-9. [Google Scholar]
- Kloprogge, J.T. Infrared and Raman Spectroscopy of Naturally Occurring Hydrotalcites and Their Synthetic Equivalents. In The Application of Vibrational Spectroscopy to Clay Mineral and Layered Double Hydroxides; Kloprogge, J.T., Ed.; The Clay Minerals Society, CKS Worshops Lectures: Aurora, CO, USA, 2005; Chapter 8; pp. 204–238. ISBN 978-1-881208-14-1. [Google Scholar]
- Theiss, F.; Lopez, A.; Frost, R.L.; Scholz, R. Spectroscopic characterisation of the LDH mineral quintinite Mg4Al2(OH)12CO3·3H2O. Spectrochim. Acta Part A Mol. Biomol. Spectrosc. 2015, 150, 758–764. [Google Scholar] [CrossRef] [PubMed]
- Rives, V. Study of Layered Double Hydroxides by Thermal Methods. In Layered Double Hydroxides: Present and Future; Rives, V., Ed.; Nova Science Publishers: New York, NY, USA, 2001; Chapter 4; pp. 115–137. ISBN 1-59033-060-9. [Google Scholar]
- Kanezaki, E. Thermal behavior of the hydrotalcite-like layered structure of Mg and Al-layered double hydroxides with interlayer carbonate by means of in situ powder HRXRD and DTA/TG. Solid State Ion. 1998, 106, 279–284. [Google Scholar] [CrossRef]
- Hibino, T.; Yamashita, Y.; Kosuge, K.; Tsunashima, A. Decarbonation Behavior of Mg-Al-CO3 Hydrotalcite-like Compounds during Heat Treatment. Clays Clay Miner. 1995, 43, 427–432. [Google Scholar] [CrossRef]
- Rives, V. Comment on “Direct Observation of a Metastable Solid Phase of Mg/Al/CO3−Layered Double Hydroxide by Means of High-Temperature in Situ Powder XRD and DTA/TG”. Inorg. Chem. 1998, 38, 406–407. [Google Scholar] [CrossRef]
- Conterosito, E.; Palin, L.; Antonioli, D.; Viterbo, D.; Mugnaioli, E.; Kolb, U.; Perioli, L.; Milanesio, M.; Gianotti, V. Structural characterisation of complex layered double hydroxides ad TGA-GC-MS study on thermal response and carbonate contamination in nitrtate- and organic-exchanged hydrotalcites. Chem. Eur. J. 2015, 21, 14975–14986. [Google Scholar] [CrossRef] [PubMed]
- Lowell, S.; Shields, J.E.; Thomas, M.A.; Thommes, M. Characterization of Porous Solids and Powders: Surface Area, Pore Size and Density; Kluwer Academc Pub.: Dordrecht, The Netherlands, 2010; ISBN 978-90-481-6633-6. [Google Scholar]
- Duan, X.; Feng, L. Applications of Layered Double Hydroxides. In Layered Double Hydroxides; Duan, X., Evans, D.G., Eds.; Springer: Berlin, German, 2005; pp. 193–223. ISBN 3-540-28279-3. [Google Scholar]
- De Roy, A.; Forano, C.; Besse, J.-P. Layered Double Hydroxides: Synthesis and Post-Synthesis Modification. In Layered Double Hydroxides: Present and Future; Rives, V., Ed.; Nova Science Publishers: New York, NY, USA, 2001; Chapter 1; pp. 1–37. ISBN 1-59033-060-9. [Google Scholar]


| Sample | Aging | Mg a | Al a | 1 − x | x | Mg/Al b |
|---|---|---|---|---|---|---|
| M11 | In air | 18.75 | 10.42 | 0.666 | 0.334 | 2.0 |
| M12 | In air | 19.86 | 10.43 | 0.679 | 0.321 | 2.1 |
| M21 | Hydrothermal | 20.98 | 10.79 | 0.683 | 0.317 | 2.2 |
| M31 | Microwave hydrothermal | 20.58 | 10.87 | 0.678 | 0.322 | 2.1 |
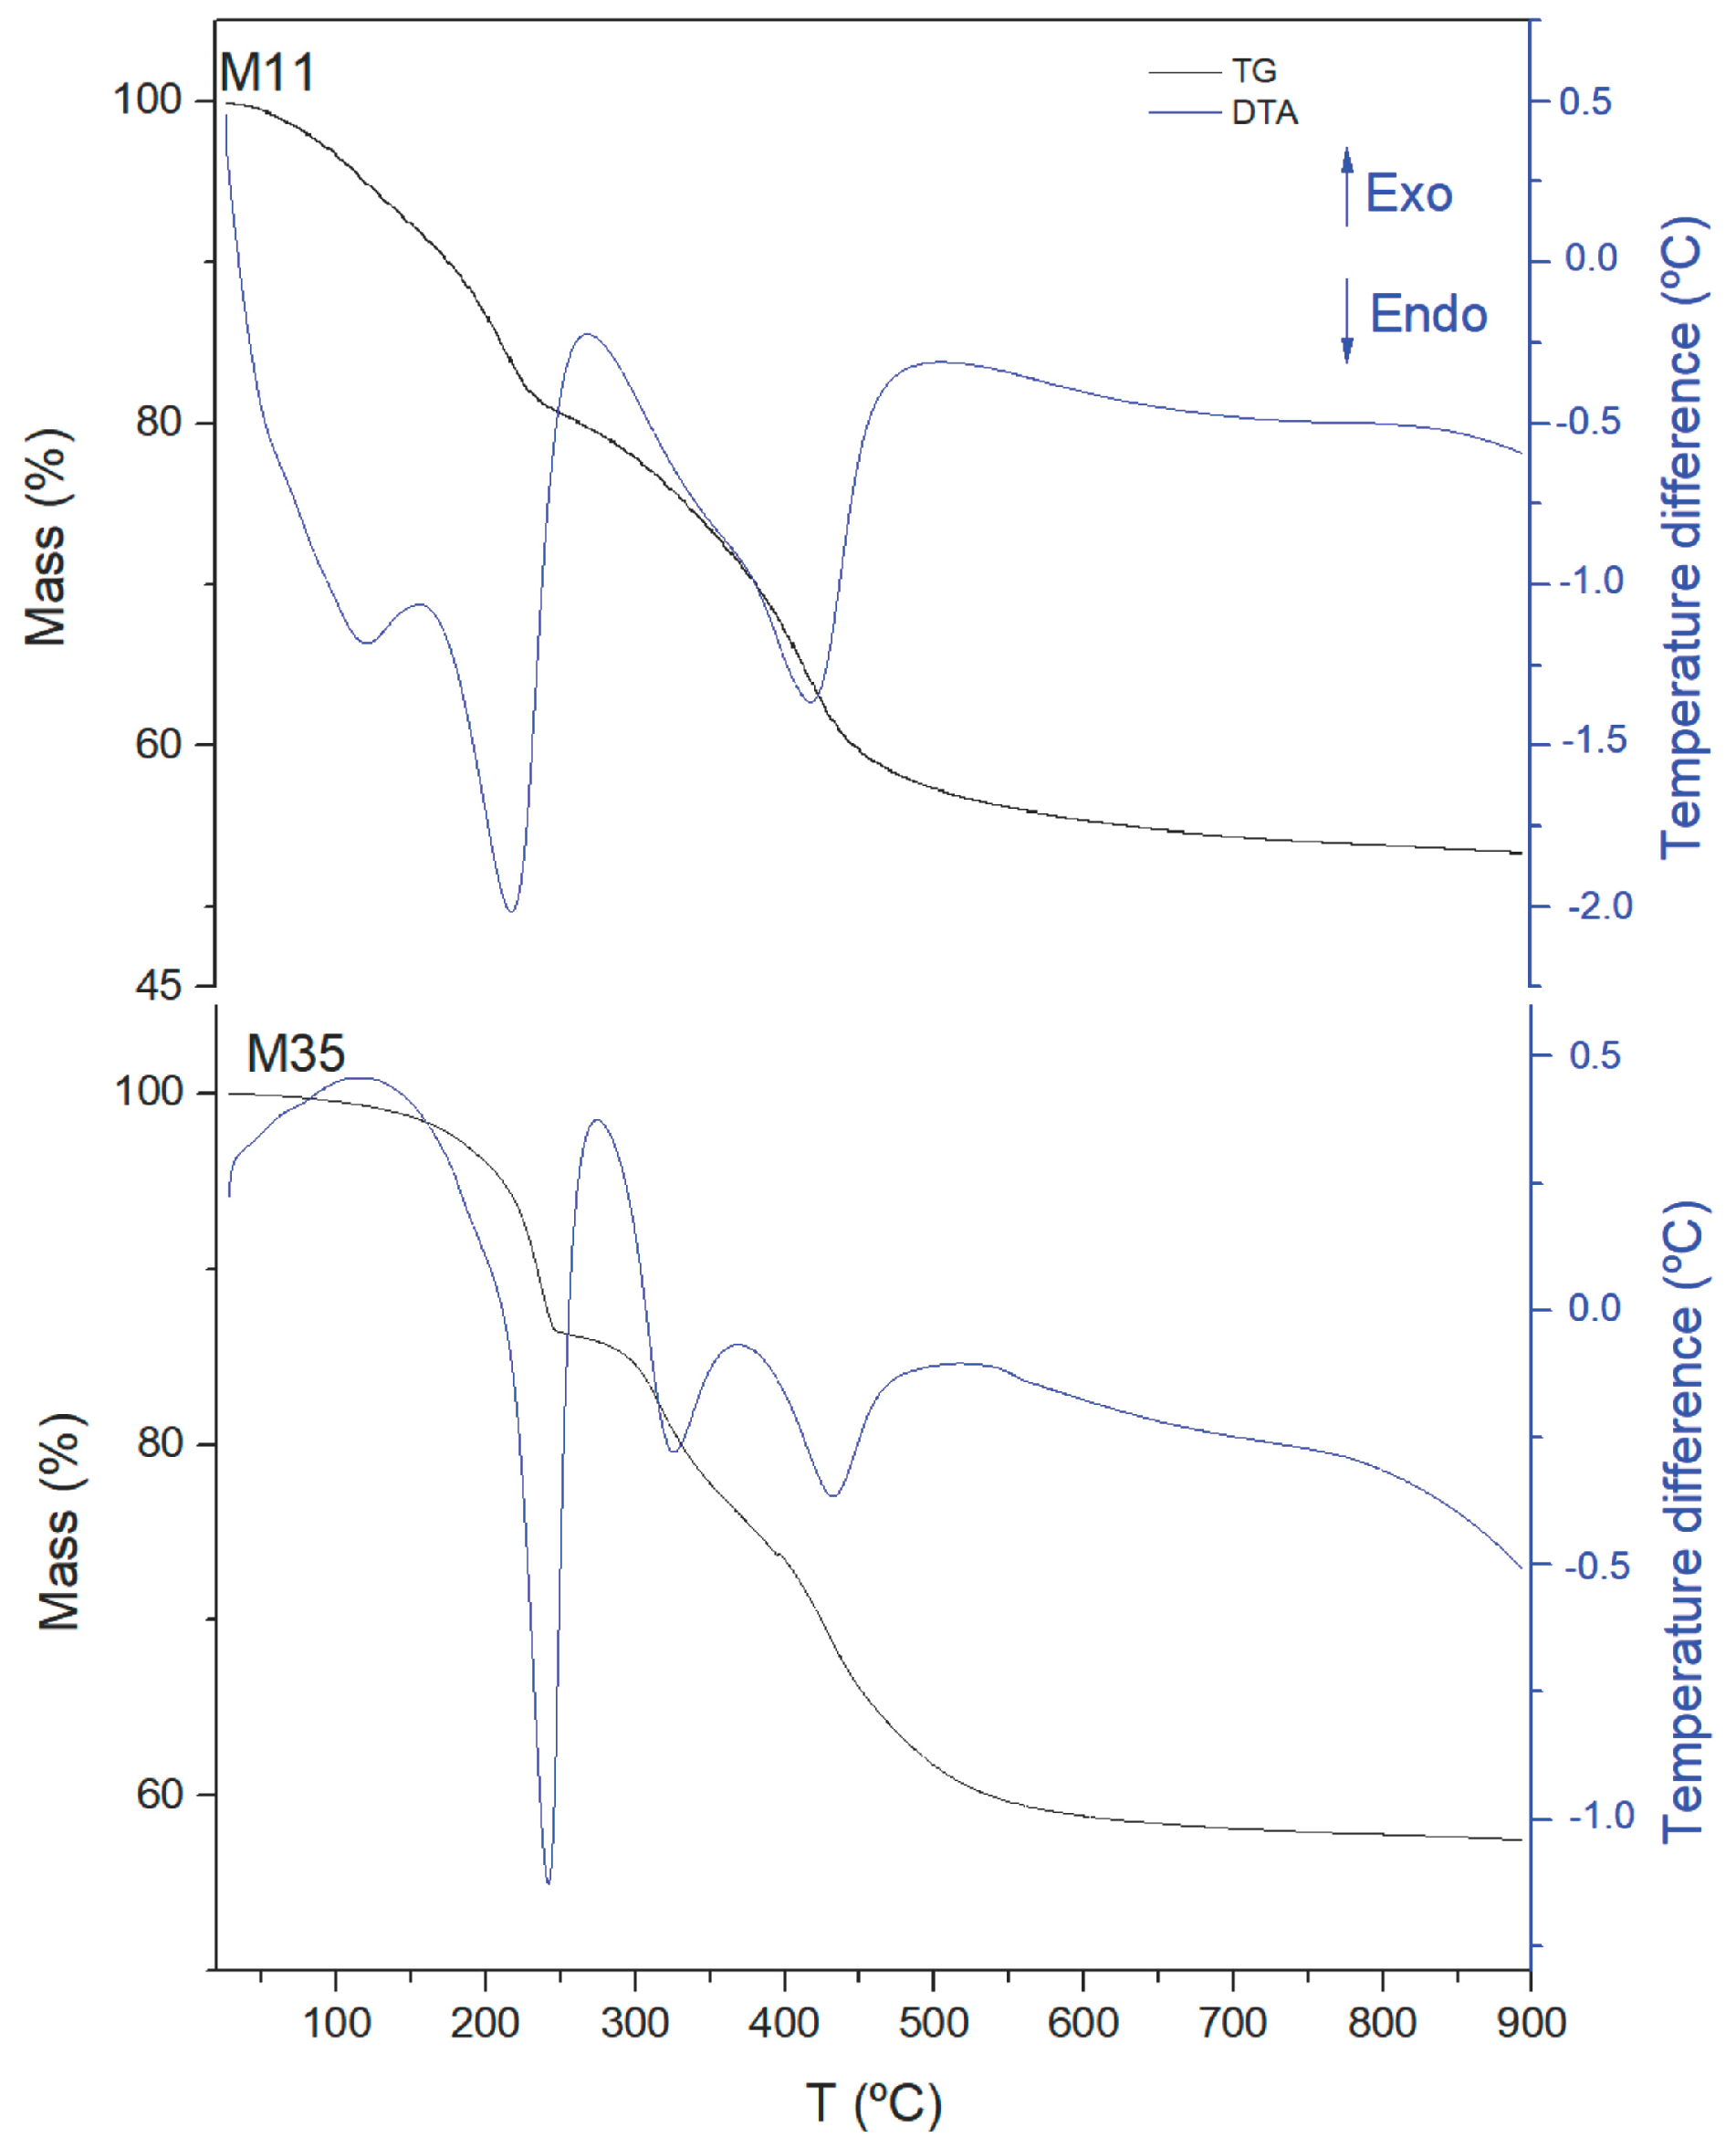
| Sample | Total Mass Loss % | m * | Formula |
|---|---|---|---|
| M11 | 47 | 0.72 | [Mg0.67Al0.33(OH)2](CO3)0.165·0.72H2O |
| M12 | 46 | 0.68 | [Mg0.68Al0.32(OH)2](CO3)0.160·0.68H2O |
| M21 | 43 | 0.44 | [Mg0.68Al0.32(OH)2](CO3)0.160·0.44H2O |
| M31 | 45 | 0.63 | [Mg0.68Al0.32(OH)2](CO3)0.160·0.63H2O |
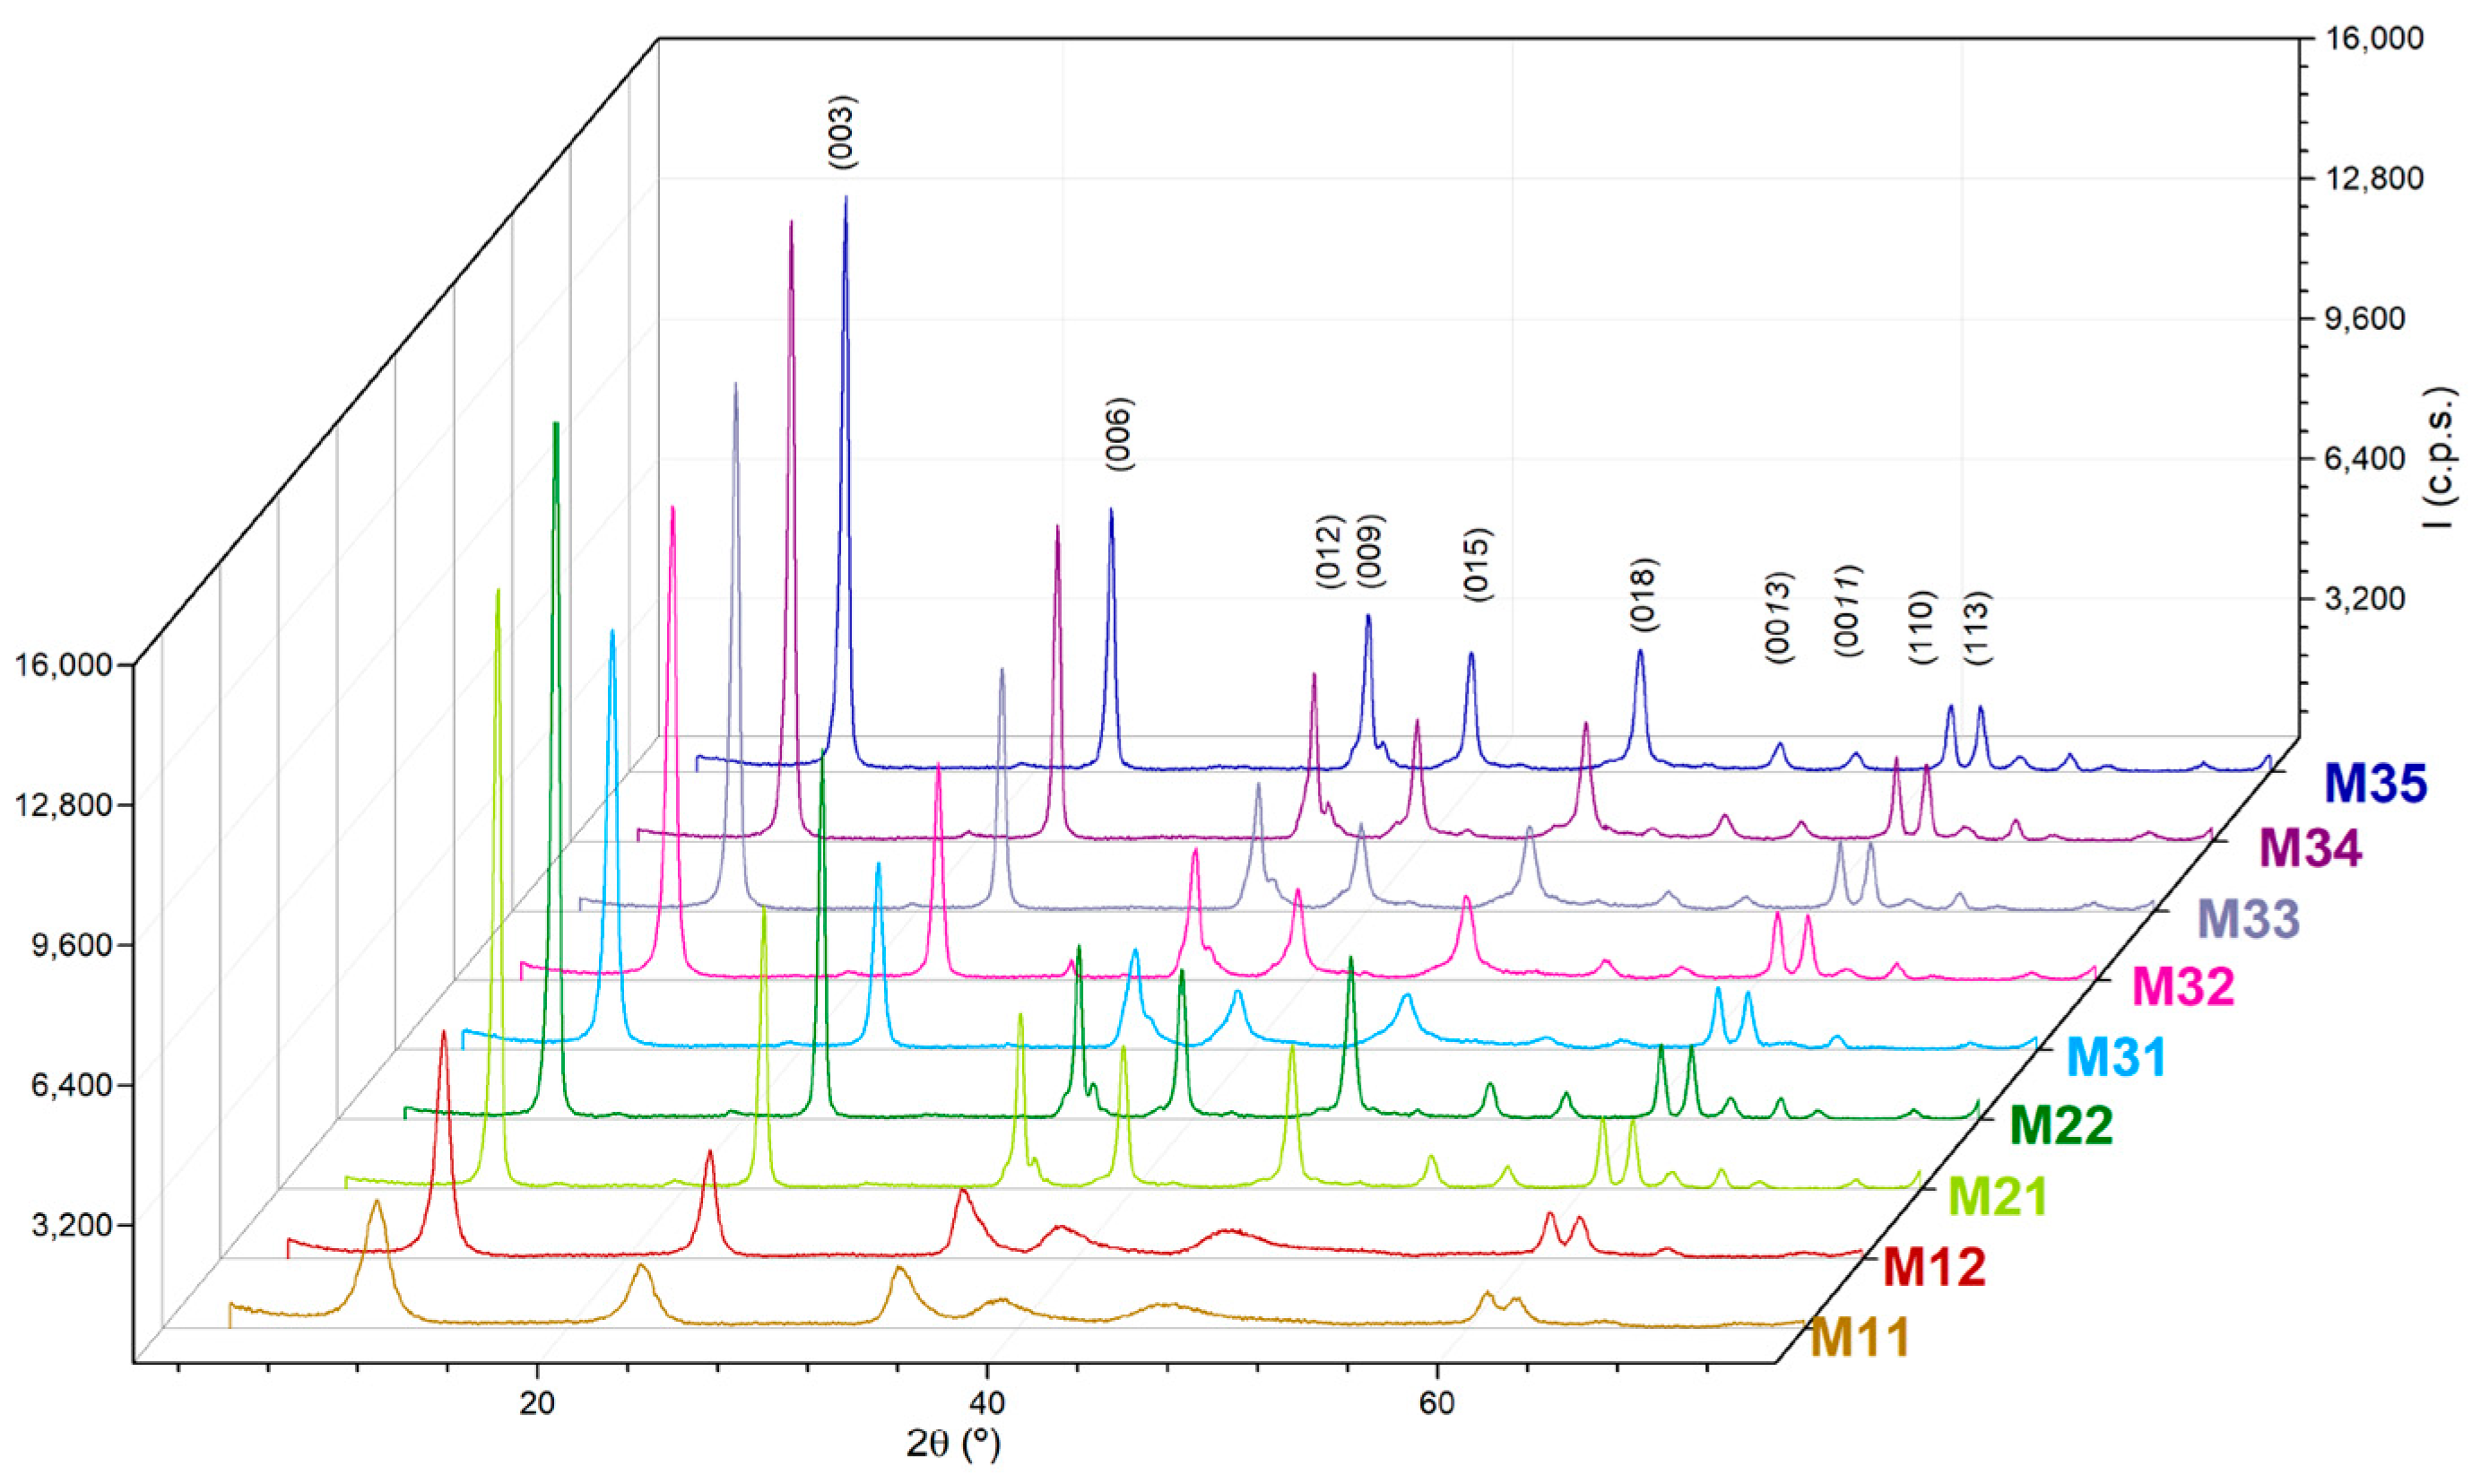
| Sample | Aging | a a | c a | d-Value a | D(003) b | D(110) b | N c |
|---|---|---|---|---|---|---|---|
| M11 | In air | 3.037 | 22.93 | 7.65 | 7 | - | 9 |
| M12 | In air | 3.033 | 22.38 | 7.46 | 12 | 21 | 17 |
| M21 | Hydrothermal | 3.042 | 22.61 | 7.54 | 24 | 29 | 31 |
| M22 | Hydrothermal | 3.040 | 22.61 | 7.54 | 23 | 32 | 31 |
| M31 | Microwave hydrothermal | 3.044 | 22.73 | 7.57 | 17 | 28 | 22 |
| M32 | Microwave hydrothermal | 3.042 | 22.66 | 7.55 | 18 | 30 | 24 |
| M33 | Microwave hydrothermal | 3.033 | 22.31 | 7.44 | 21 | 35 | 29 |
| M34 | Microwave hydrothermal | 3.037 | 22.47 | 7.49 | 25 | 39 | 34 |
| M35 | Microwave hydrothermal | 3.044 | 22.76 | 7.59 | 23 | 29 | 31 |
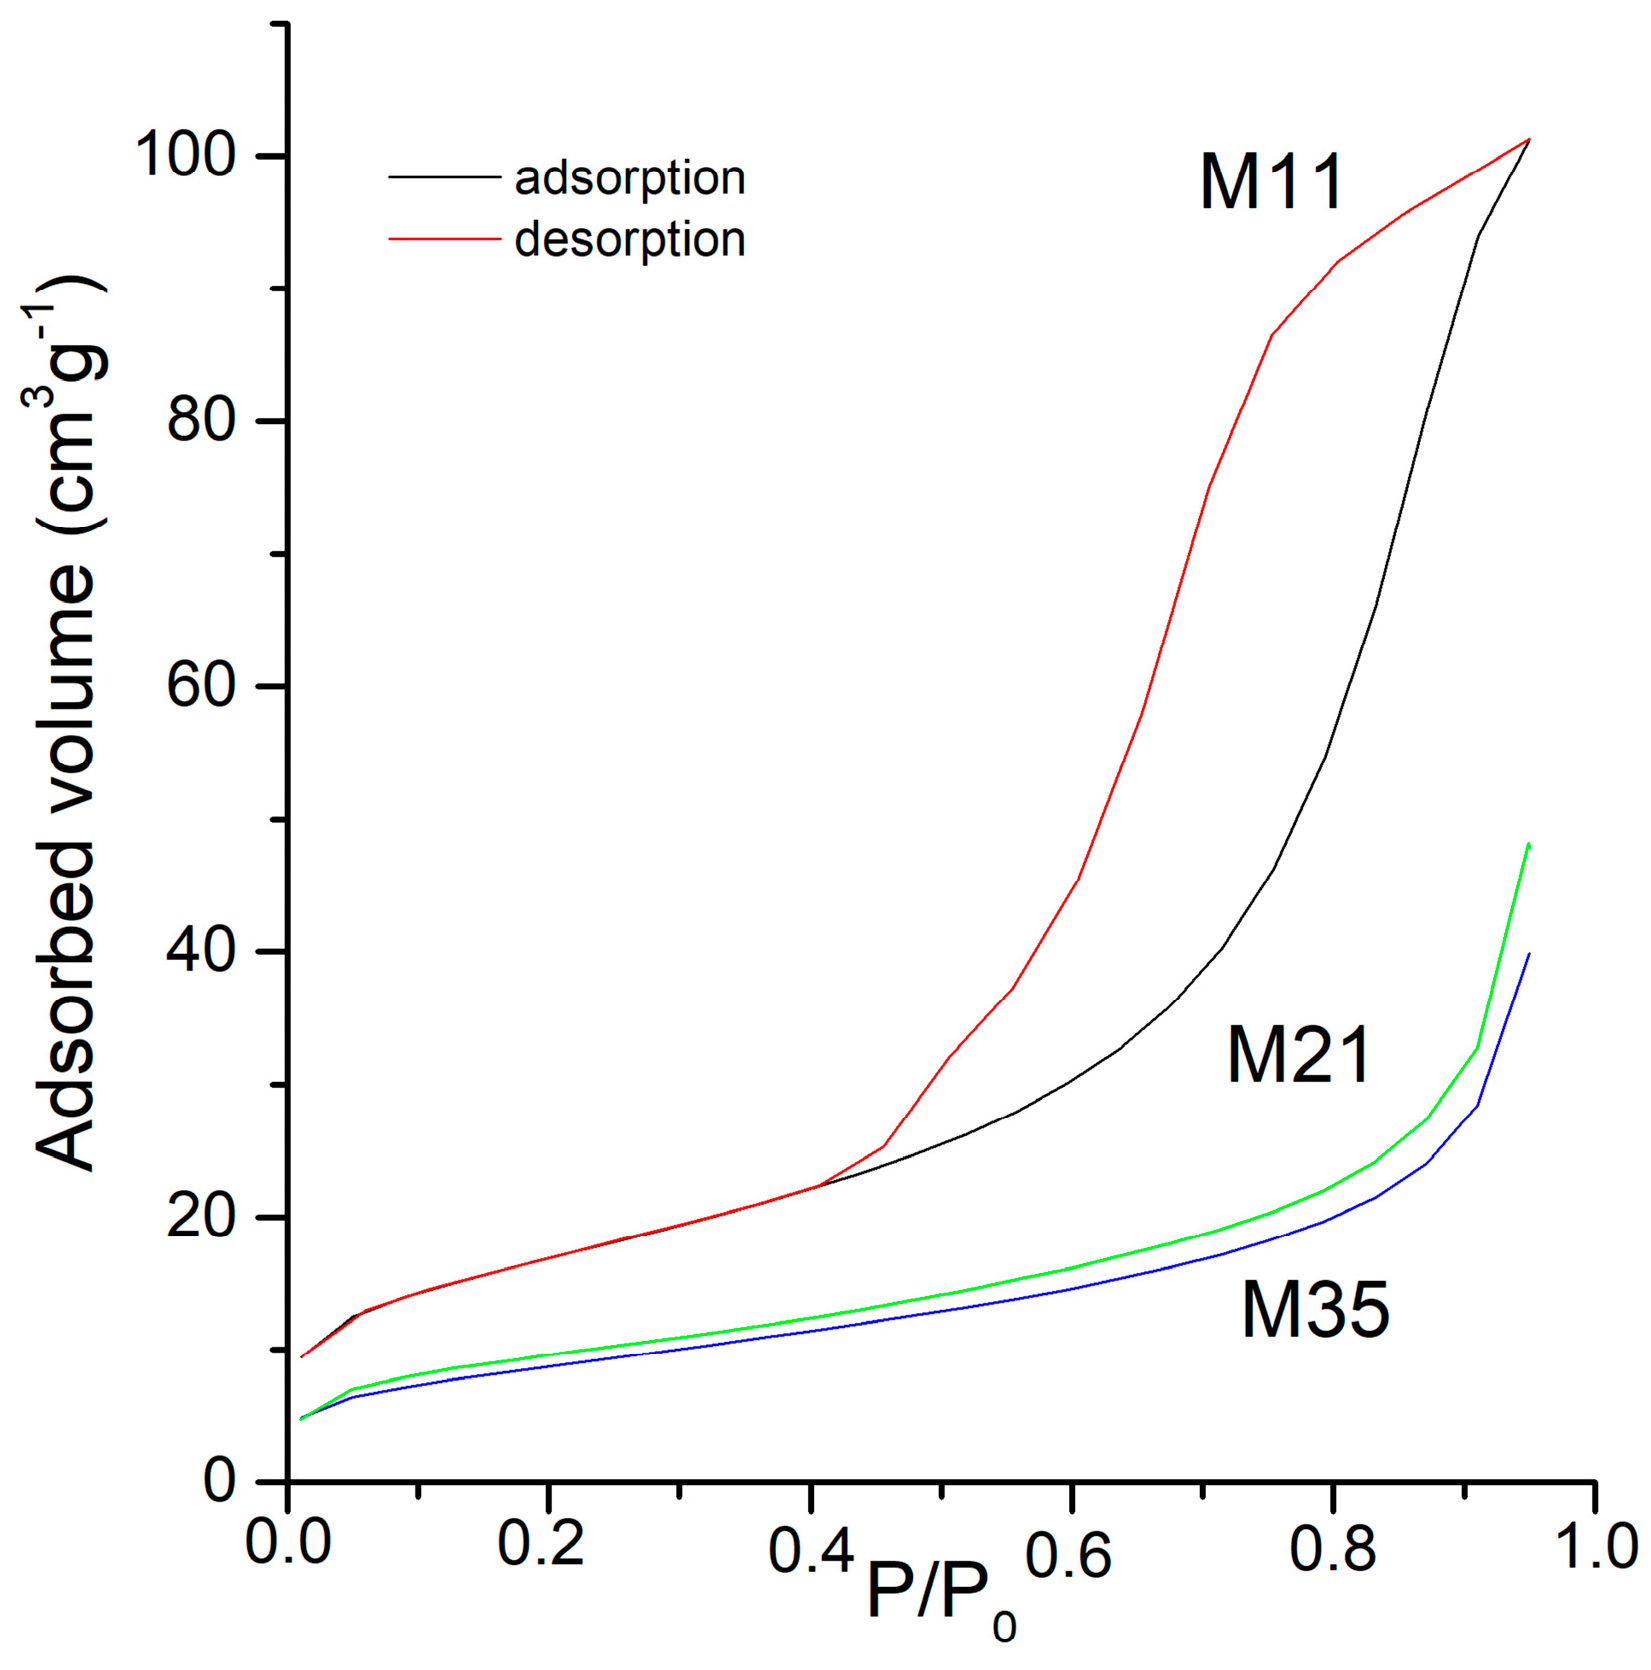
| Sample | Vm a | SBET b | St c | Smp d | Vp e | Dp f |
|---|---|---|---|---|---|---|
| M11 | 13.72 | 60 | 60 | - | 157 | 6 |
| M12 | 22.54 | 98 | 90 | 8 | 416 | 13 |
| M21 | 7.11 | 31 | 32 | - | 58 | 8 |
| M22 | 5.03 | 22 | 21 | 1 | 39 | 8 |
| M31 | 14.21 | 62 | 55 | 7 | 203 | 13 |
| M32 | 12.35 | 54 | 47 | 7 | 141 | 17 |
| M33 | 11.13 | 48 | 46 | 3 | 120 | 10 |
| M34 | 8.60 | 37 | 34 | 3 | 84 | 9 |
| M35 | 7.74 | 34 | 33 | 1 | 69 | 9 |
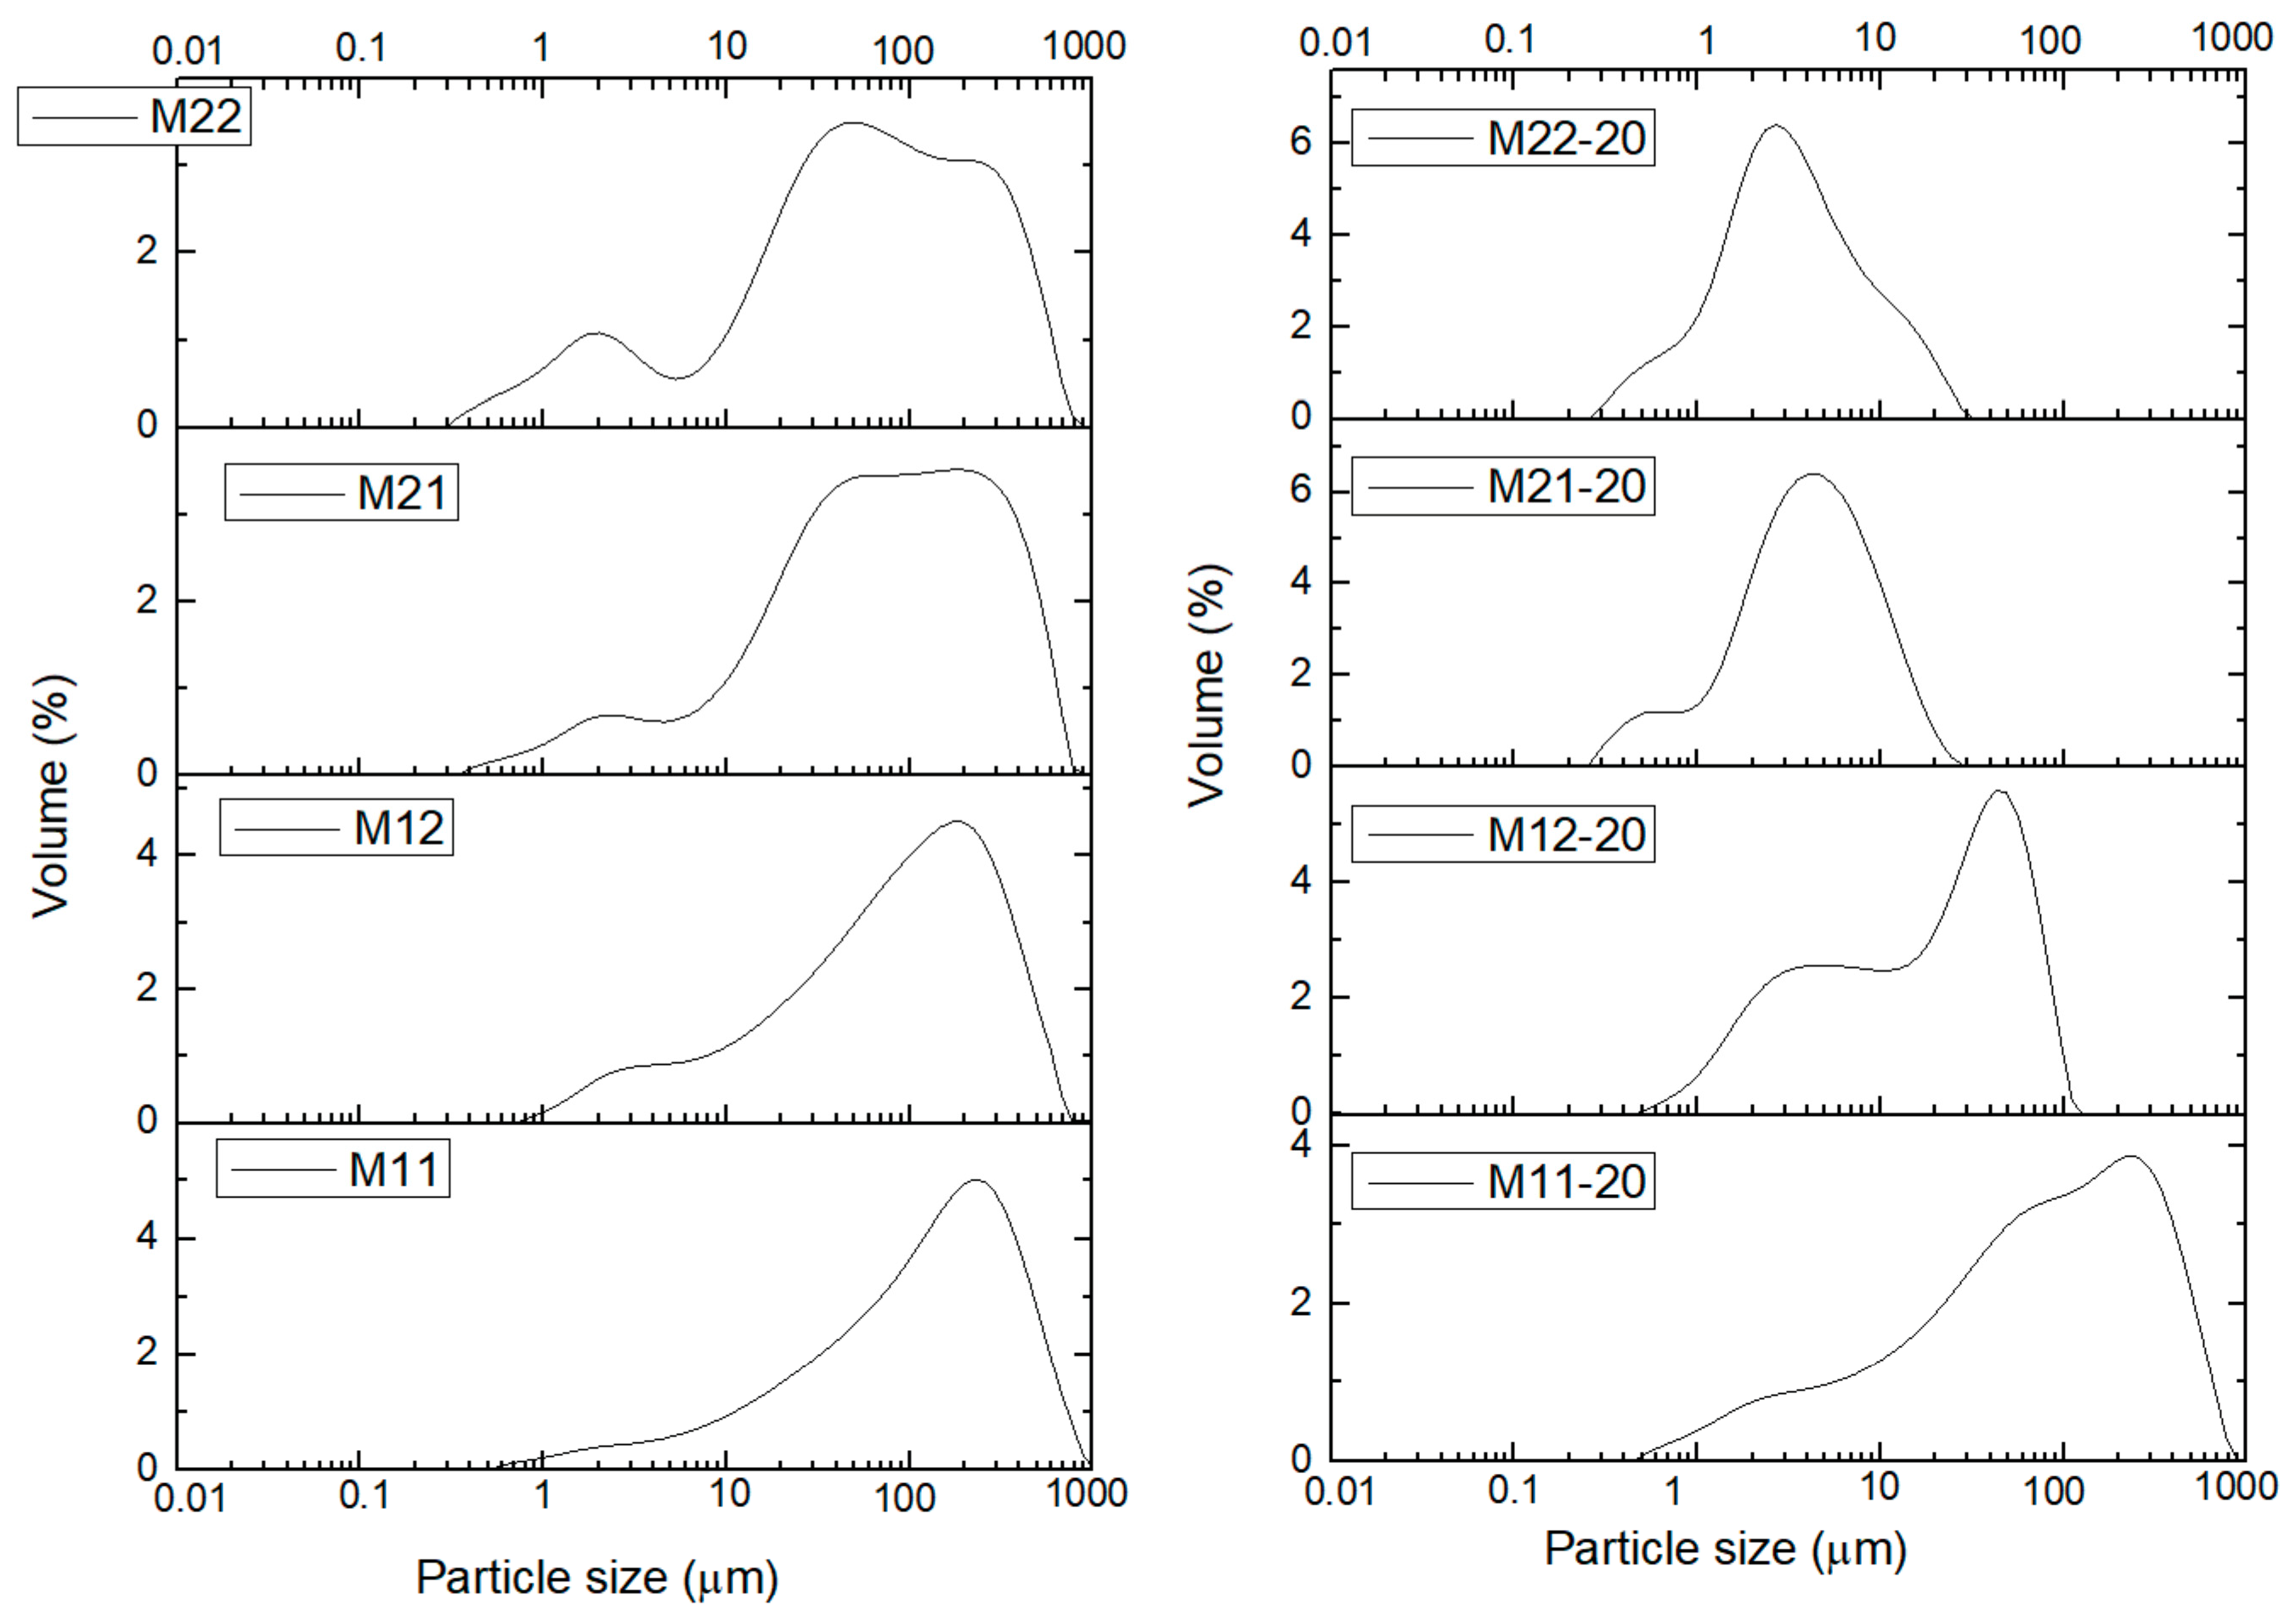
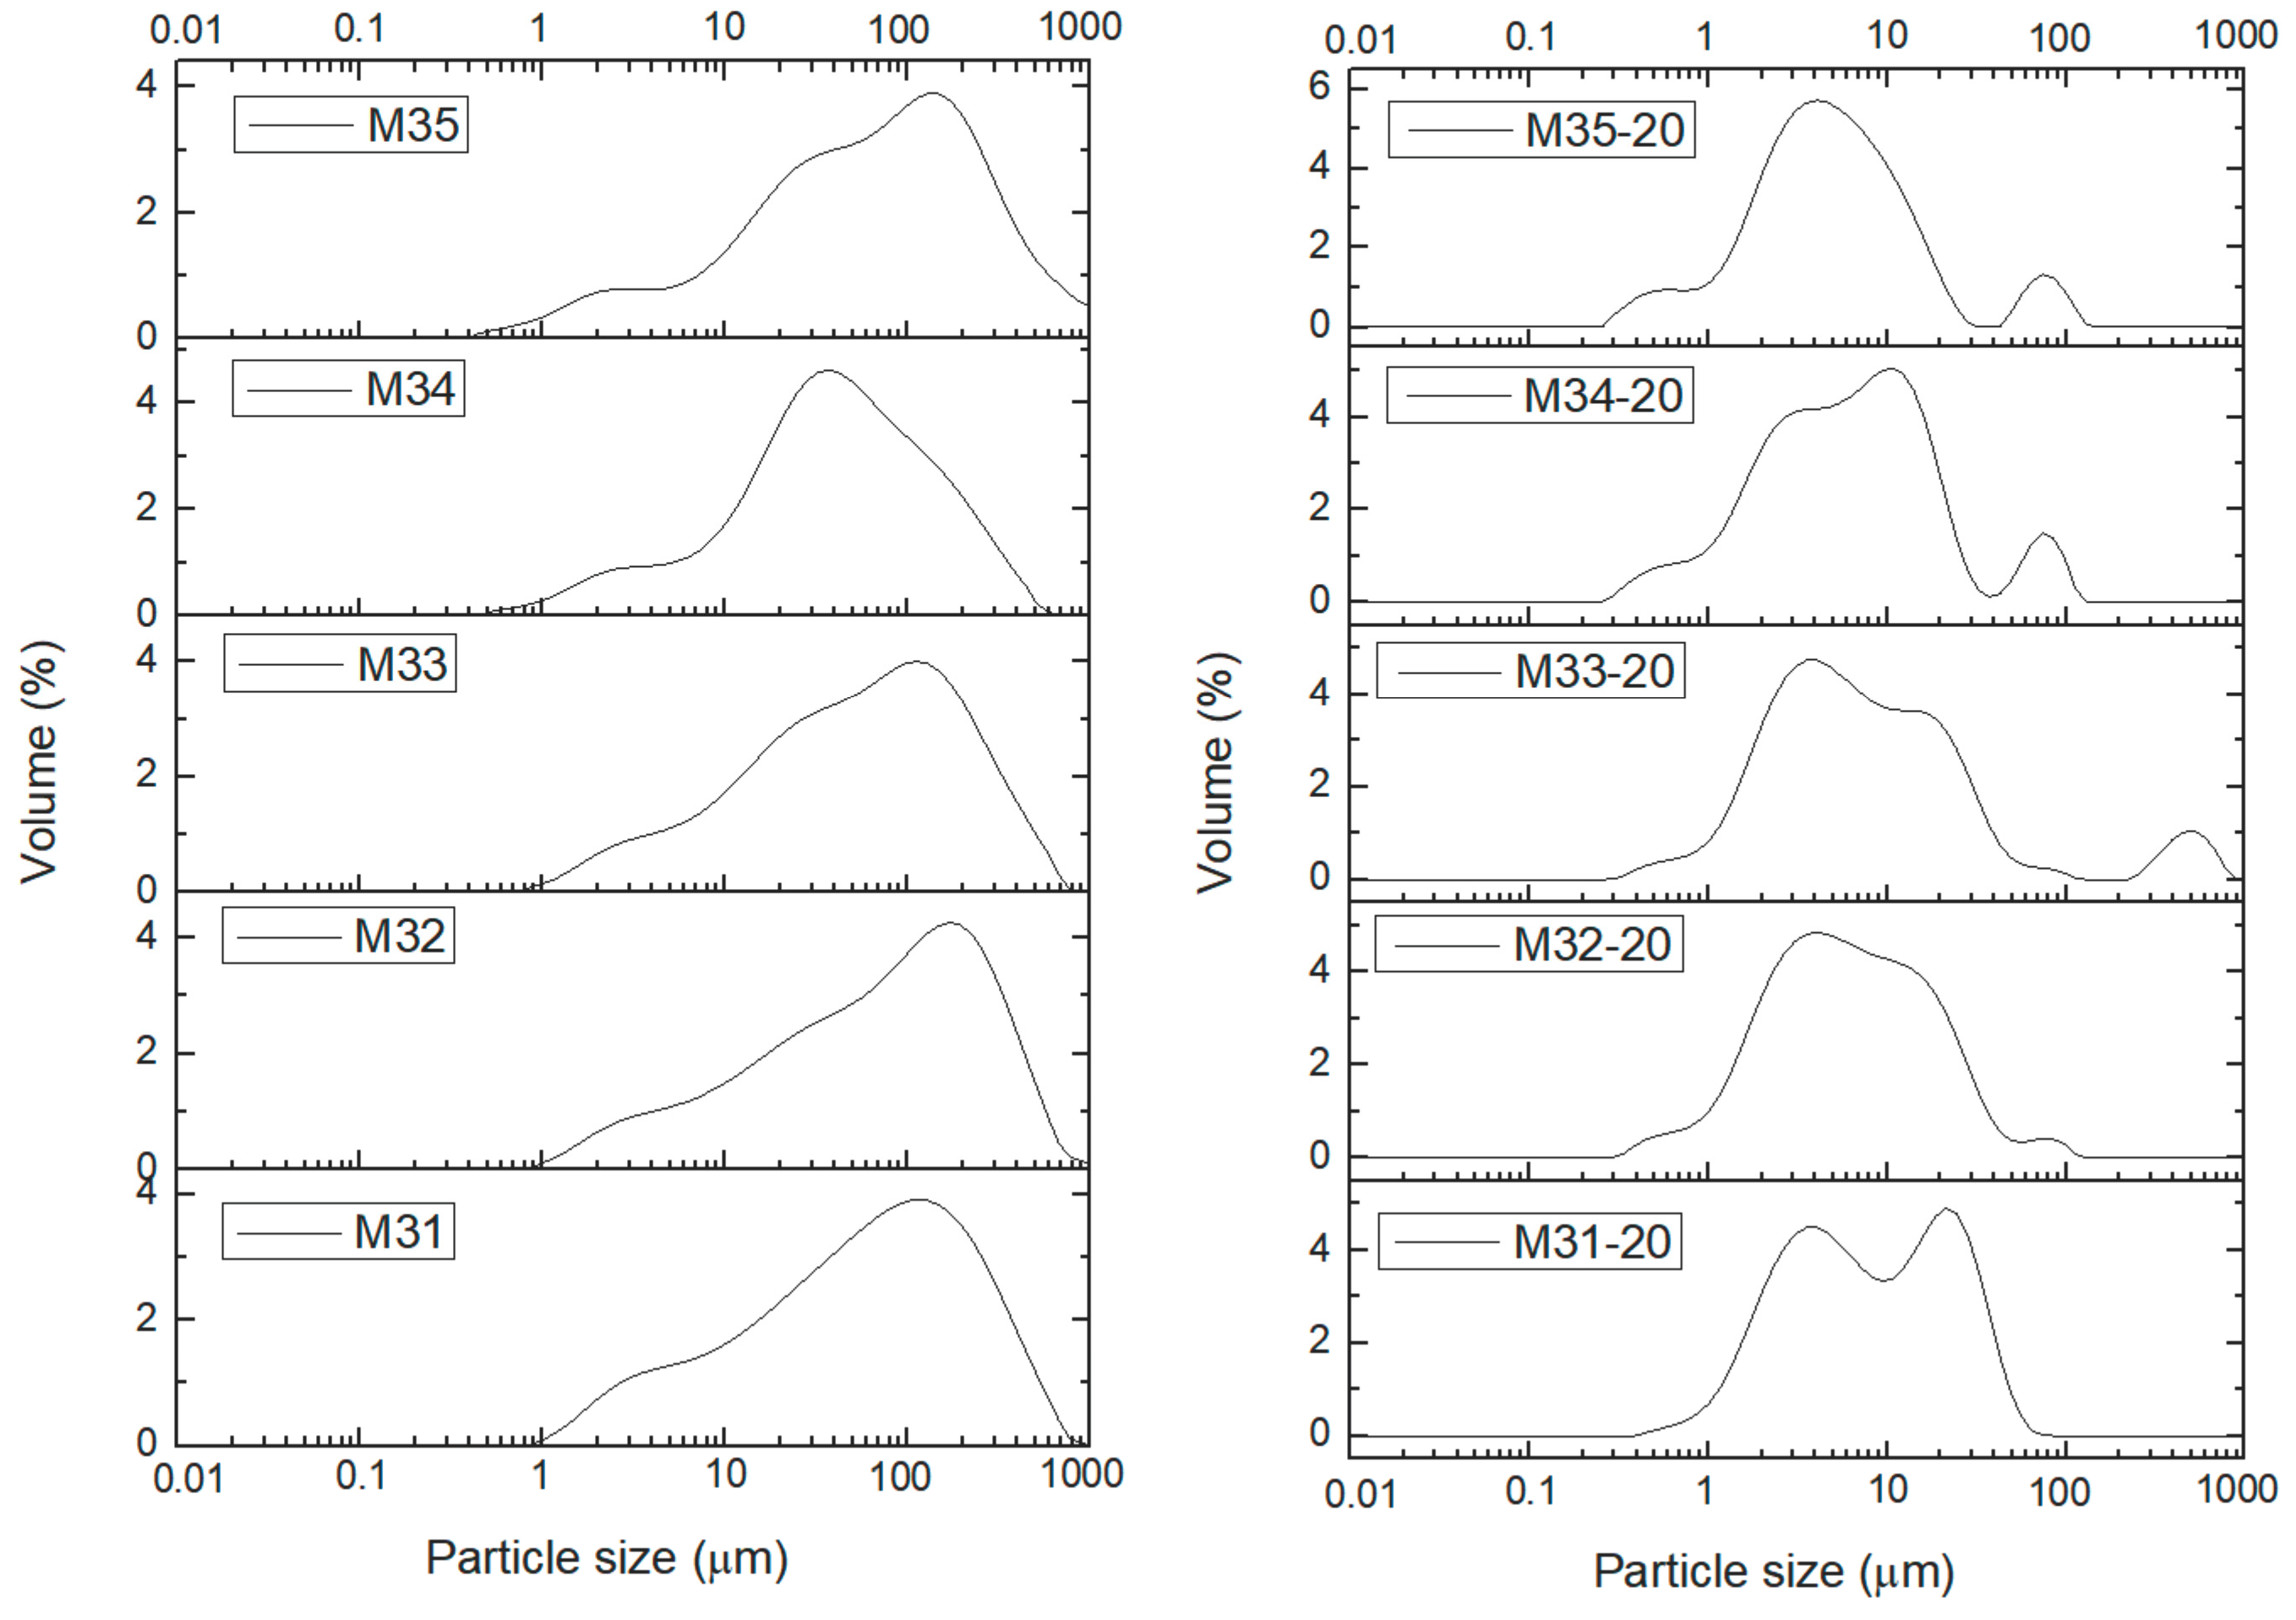
| Sample | Without US Treatment | With (20 min) US Treatment | Ratio × 100 |
|---|---|---|---|
| M11 | 483 | 422 | 87 |
| M12 | 386 | 72 | 19 |
| M21 | 414 | 12 | 3 |
| M22 | 378 | 13 | 3 |
| M31 | 254 | 34 | 13 |
| M32 | 372 | 26 | 7 |
| M33 | 301 | 38 | 13 |
| M34 | 212 | 25 | 12 |
| M35 | 392 | 19 | 5 |
| Sample | Aging Treatment | Temperature (°C) | Time (h) |
|---|---|---|---|
| M11 | In air | 25 | 24 |
| M12 | 168 | ||
| M21 | conventional hydrothermal treatment | 150 | 24 |
| M22 | 48 | ||
| M31 | microwave hydrothermal treatment | 150 | 2 |
| M32 | 3 | ||
| M33 | 5 | ||
| M34 | 7 | ||
| M35 | 10 |
© 2018 by the authors. Licensee MDPI, Basel, Switzerland. This article is an open access article distributed under the terms and conditions of the Creative Commons Attribution (CC BY) license (http://creativecommons.org/licenses/by/4.0/).
Share and Cite
Trujillano, R.; González-García, I.; Morato, A.; Rives, V. Controlling the Synthesis Conditions for Tuning the Properties of Hydrotalcite-Like Materials at the Nano Scale. ChemEngineering 2018, 2, 31. https://doi.org/10.3390/chemengineering2030031
Trujillano R, González-García I, Morato A, Rives V. Controlling the Synthesis Conditions for Tuning the Properties of Hydrotalcite-Like Materials at the Nano Scale. ChemEngineering. 2018; 2(3):31. https://doi.org/10.3390/chemengineering2030031
Chicago/Turabian StyleTrujillano, Raquel, Inés González-García, Alvaro Morato, and Vicente Rives. 2018. "Controlling the Synthesis Conditions for Tuning the Properties of Hydrotalcite-Like Materials at the Nano Scale" ChemEngineering 2, no. 3: 31. https://doi.org/10.3390/chemengineering2030031
APA StyleTrujillano, R., González-García, I., Morato, A., & Rives, V. (2018). Controlling the Synthesis Conditions for Tuning the Properties of Hydrotalcite-Like Materials at the Nano Scale. ChemEngineering, 2(3), 31. https://doi.org/10.3390/chemengineering2030031