Article

Smart Tools for Optimizing Dye Loading in Efficient DSSCs: Hybrid ANN-MOGA Strategy

by
Mozhgan Hosseinnezhad
1,*,
Alireza Mahmoudi Nahavandi
2,* and
Sohrab Nasiri
3
1
Department of Organic Colorants, Institute for Color Science and Technology, Tehran P.O. Box 16765-654, Iran
2
Department of Color Imaging and Color Image Processing, Institute for Color Science and Technology, Tehran P.O. Box 16765-654, Iran
3
Faculty of Mechanical Engineering and Design, Kaunas University of Technology, Studentu Street 56, LT 51373 Kaunas, Lithuania
*
Authors to whom correspondence should be addressed.
ChemEngineering 2026, 10(6), 72; https://doi.org/10.3390/chemengineering10060072

Submission received: 4 February 2026 / Revised: 23 May 2026 / Accepted: 2 June 2026 / Published: 9 June 2026

Abstract

The production of sustainable and cost-effective energy remains a global challenge, with photovoltaic technology emerging as a promising solution. Sensitizers play a key role in electron production in dye-sensitized solar cells, which are emerging photovoltaic devices; thus, different chemical structures have been introduced to achieve the best results. Determining the optimal conditions for the coating and application of dye materials to obtain optimal efficiency and performance is of great importance. For this purpose, an organometallic dye was used to extract the optimal coating conditions. Two factors—ambient temperature during photoanode preparation and anti-aggregation agent concentration—were selected as effective parameters, and the optimal conditions for achieving high efficiency and durability were determined using machine learning. Finally, the findings were analyzed from two perspectives: the preparation of laboratory devices using the selected dye and the evaluation of similar dye materials to validate the proposed optimal conditions.

1. Introduction

Technological development and population growth have led to an increase in the consumption of various types of energy, including optical and electrical energy for domestic and industrial applications [1]. Despite the growing need for electrical energy, most conventional sources cause environmental pollution and are also finite [2,3]. Therefore, attention is increasing toward renewable energy sources that are cheap, abundant, and do not pollute the environment. One of the most important renewable energy sources is sunlight [4]. For decades, the conversion of solar energy into electrical energy has been the subject of research, and three generations of photovoltaic devices have been introduced for this purpose [5,6]. Nowadays, silicon photovoltaic devices are used on a commercial scale, but they have several limitations, such as sensitivity to temperature and environmental conditions, as well as high costs, which have prevented their further development [7]. The third generation of this technology, known as dye-sensitized solar cells (DSSCs) [7], has a promising future in this field. These devices have five different parts that are placed in sequence [8,9]. The heart of this device is the sensitizer, which generates electrons upon exposure to sunlight and has a direct effect on the efficiency and ultimate lifespan of the device [10,11]. Sensitizers based on organometallic compounds, organic dyes, and natural dyes have been introduced for use in dye-sensitized solar cells [12]. The dye is prepared in the solution phase and coated onto a semiconductor, making it necessary to prepare a solution with optimal concentration and conditions so that the dye does not aggregate after the coating procedure [13]. The synthesis of new and efficient dyes for the preparation of devices with high efficiency and long lifetimes has been the subject of extensive research [14]. The results show that the use of computational methods and artificial intelligence, such as Response Surface Methodology (RSM) and Desirability Function (DF), can be very useful in controlling and managing sensitization process conditions to achieve high efficiency and lifetimes simultaneously [15,16]. While conventional design of experiments (DoE) and response surface methodology (RSM) are widely used for DSSC optimization, these methods are fundamentally limited to linear or quadratic models [17]. However, the relationship between processing parameters (temperature and concentration) and device performance (efficiency and durability) exhibits complex, higher-order non-linearities that cannot be captured by low-ordered polynomial models. Recent studies have demonstrated that machine learning approaches are better suited to capturing such complex relationships in DSSC optimization [18,19].
Using these artificial intelligence techniques is highly efficient for the sustainable development of renewable energies, although further research is required to fully optimize machine learning applications in this field—a gap addressed in the current study.
Machine learning (ML) techniques and Density Functional Theory (DFT) have been combined to find efficient solar cell dye molecules [20]. Using 61 known dyes, thousands of D-π-A, D-π-A′-A, and D-A′-π-A structures were generated. Using molecular and quantum descriptors, several dyes with power conversion efficiency (PCE) > 29% were predicted.
Varga et al. [18] built a comprehensive database from 213 scientific papers and gathered 520 samples. Film thickness, synthesis temperature, synthesis time, precursor type, dye type, morphological structure, resistance, electrolyte concentration, irradiance, and operating temperature were used as independent variables to predict efficiency at four levels. They found that thin film thickness, synthesis temperature and synthesis time werethe most influential factors affecting efficiency within the studied dataset.
Onah et al. [21] utilized machine learning regression to predict the short-circuit current density (Jsc) and maximum power output (Pmax) of a modified Eu3+-doped Y2WO6/TiO2 photoanode-based solar cell. They reached errors of 0.73% for Jsc and 1.01% for Pmax prediction using different ML algorithms.
A review paper by Tomar et al. [22] offers a comprehensive study of machine learning techniques, particularly Artificial Neural Networks (ANN), for predicting the design, material selection, and power conversion efficiency of DSSCs. The review covers various ML approaches, including ANN, genetic algorithms (GAs), QSPR, QSAR, Random Forest, Support Vector Machines, Decision Trees, and K-Nearest Neighbors, with a particular focus on ANN and hybrid ANN-GA models for predicting optical properties (absorption maxima and HOMO-LUMO gaps) and the electrical and physical properties of DSSC components, such as electrolytes, semiconductor oxides (TiO2 and ZnO), dyes, and catalysts.
This brief review of ML algorithms shows that the new horizon opened by ML techniques is promising. Molecular design, efficiency prediction and process optimization represent the key focal points of these studies [18,20,21,22]. However, the application of ML to ambient temperature and anti-aggregation agent concentration remains largely unexplored. The current study addresses this gap by simultaneously optimizing solar cell efficiency and durability using ML, followed by a multi-objective genetic algorithm (MOGA) to determine the optimal coating parameters. Experimental validation through laboratory device fabrication is the key distinguishing feature of this work, confirming that the ML-predicted optimal conditions indeed yield enhanced device performance and long-term stability.
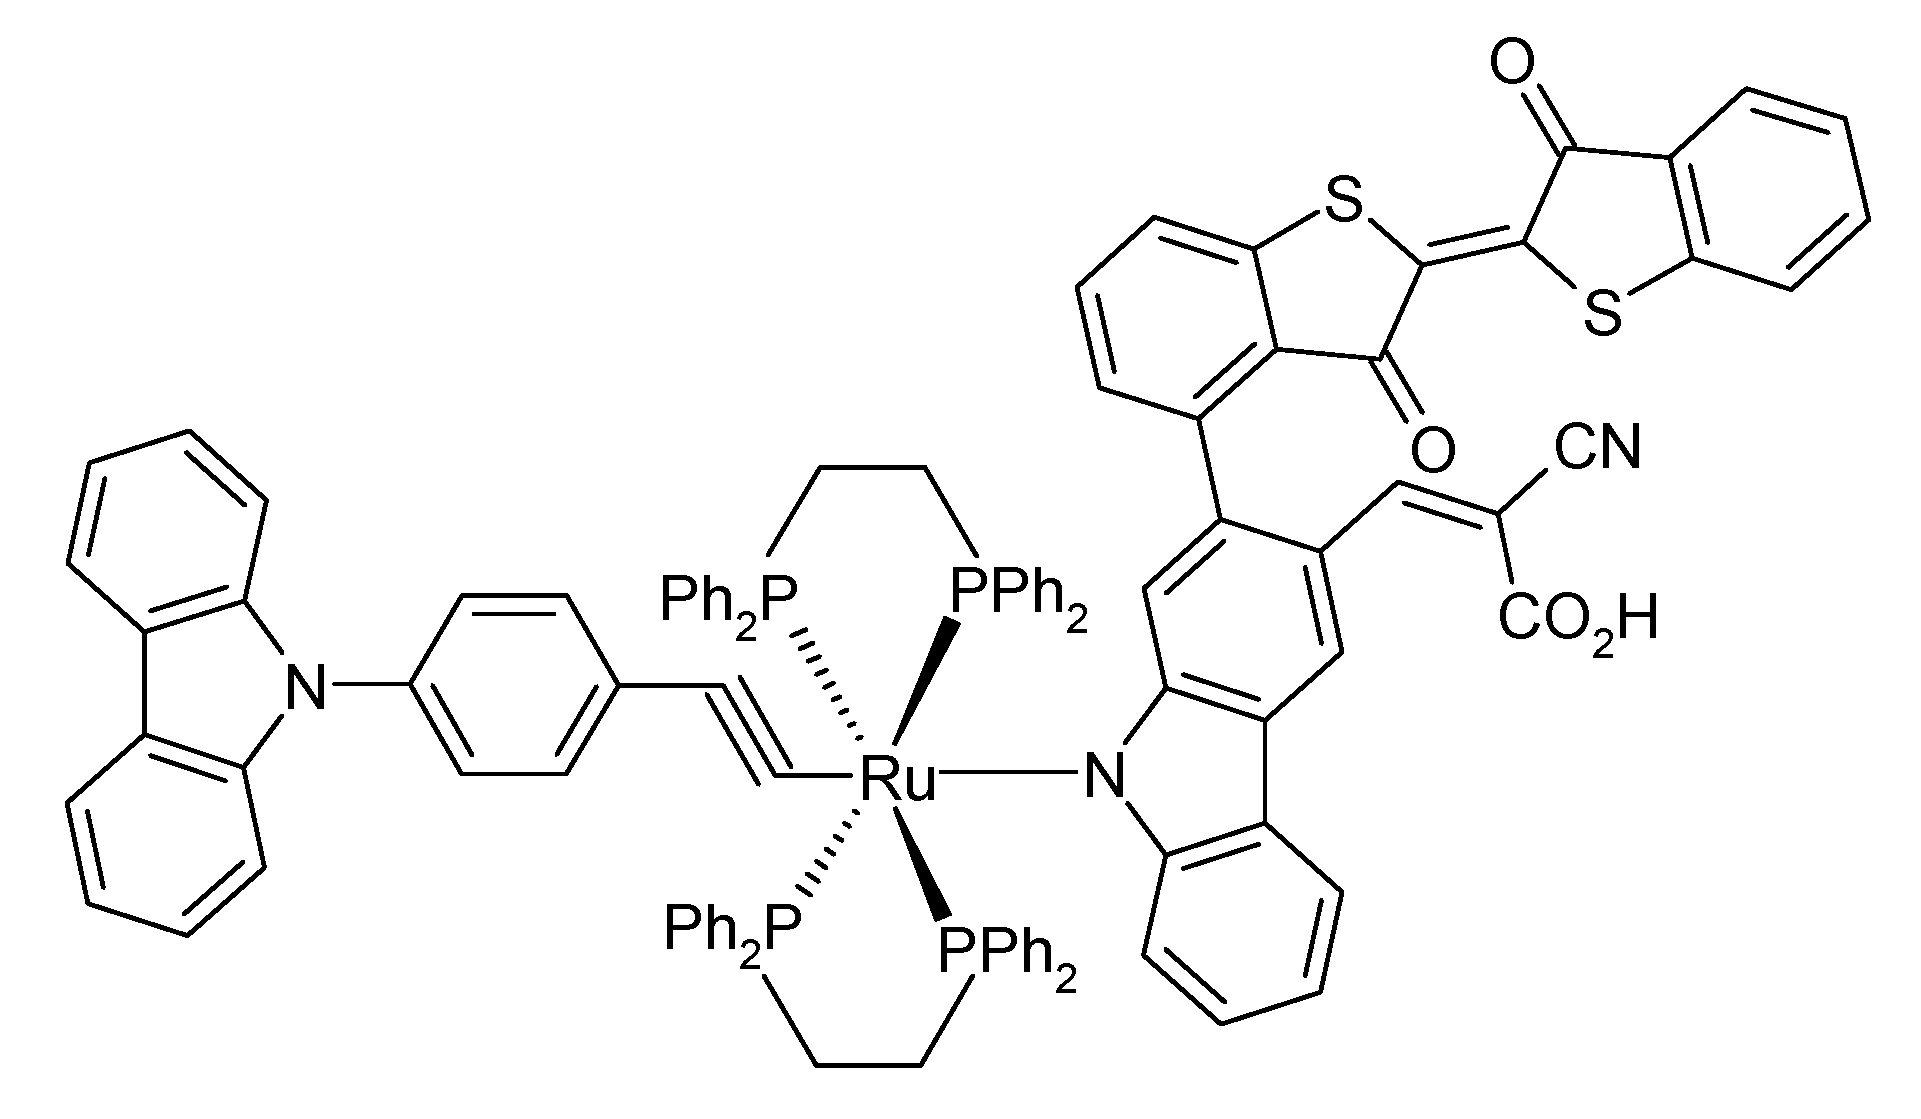
An organic–mineral complex dye synthesized in our group (Figure 1) was selected for the preparation of a photovoltaic device (DSSC). Machine learning techniques were used to prepare an optimal solution in terms of concentration and anti-aggregation agent content. This research pursues two primary objectives: (1) fabricating an efficient device with maximized power conversion efficiency and lifetime, and (2) minimizing resource and energy consumption during fabrication. The efficiency in DSSCs was calculated using the formula η = (Jsc× Voc × FF)/Pin × 100, with Pin = 100 mW/cm2.

2. Theoretical Background

2.1. Artificial Neural Networks (ANNs) and Feedforward Shallow Neural Networks (FFSNNs)

ANNs possess the capability to model a wide range of complex engineering problems [23]. Feedforward shallow neural networks (FFSNNs), as a simple variant of ANNs, have been utilized as a powerful tool in this regard [24]. An FFSNN is composed of three layers: the input, hidden and output layers. Each layer is composed of neurons. Data are fed into the input layer. The number of neurons in the input layer is equal to the dimension of the input data. The layer after the input layer is the hidden layer. This layer processes the inputs using weighted sums, biases and activation functions, where the net input zi to the i-th hidden neuron is expressed in Equation (1). In this equation, xj is the input value of the j-th neuron, wij is the weight of the connection between the j-th input and the i-th neuron in the hidden layer, and bi is the bias of the i-th neuron in the hidden layer. Finally, yi is the value of the i-th neuron in the hidden layer, obtained by passing zi through an activation function f. The activation function is usually a sigmoid, hyperbolic tangent, tansig or Rectified Linear Unit (ReLU) function to introduce non-linearity to the model. The goal of network optimization is to find these weights and biases so that the errors are minimized. Finally, the last layer is the output layer. This layer produces the final set of predictions [25,26].
z i = i w i j x j + b i ,     y i = f z i
The network starts with a randomized set of weights and biases. The hidden layer is then calculated. Using the first estimation of the hidden layer and the randomized weights and biases, the first guess of the output layer is made. The difference between the prediction and the ground truth output is calculated using a loss function, typically the mean square of error (MSE). One cycle of calculation from the input layer to the output layer is called an epoch. Utilizing the gradient descent technique, the error is then back propagated through the network to update the initial weights and biases. The network then recalculates the new weights and biases repeatedly until the stopping criteria are met [25,26].
The data used for optimization of prediction errors are the training dataset. By means of adjusting weights and biases, the network learns the underlying patterns, features and relationships between the inputs and outputs. Meanwhile, the validation set is used to tune the hyperparameters, helping to monitor model performance and prevent overfitting during the training process. Finally, the test set is used to evaluate the performance of the trained network on samples that were not previously introduced to the model.
The stopping criteria can vary. Commonly applied stopping criteria include the maximum number of epochs, convergence of the loss function to a small value, an increase in validation loss, and the gradient norm threshold [27,28].

2.2. Multi-Objective Optimization (MOO)

Multi-objective optimization is a mathematical optimization that copes with problems involving the simultaneous optimization of two or more variables. In these problems, the Pareto front is the locus of non-dominated solutions, where one objective cannot be improved without worsening at least one other objective.
MOO has found applications in many fields, such as economics, logistics and environmental sciences. For instance, it can be used to balance fuel efficiency and engine power in an automobile [29,30] or to evaluate the trade-off between profit and environmental pollution in a textile dyeing factory [31].
Evolutionary algorithms [32], weighted sum methods [33], the Ɛ-constraint method [28], goal programming [27], interactive methods [34] and multi-criteria decision-making methods [35] are among the methods proposed for solving multi-objective problems. However, among the listed methods, evolutionary algorithms are the most common and versatile method for multi-objective optimization, especially when it comes to complex and non-convex problems, as they provide a good approximation of the Pareto front [29,30].

2.3. Multi-Objective Genetic Algorithm Optimization (MOGA)

Multi-objective genetic algorithm optimization is the most popular evolutionary-based method for solving multi-objective optimization problems. It is a generalization of the single-objective genetic algorithm and uses its classical operators, such as selection, crossover and mutation. These operators are used to evolve early populations toward the Pareto front.
Any variable in the genetic algorithm is considered a gene, and a group of genes is called an individual or a chromosome. In fact, an individual is a set of values that enters the function. Individuals are assessed by their dominance. Assuming that better solutions mean smaller values for all objectives, for two individuals x1 and x2, x1 dominates x2 provided that:
If x1 is no worse than x2 for all objectives (Equation (2)):
f j ( x 1 ) f j ( x 2 )     j = 1 , 2 , . . . , M
x(x) is strictly better than x(2) in at least one objective (Equation (3))
f j ( x 1 ) < f j ( x 2 )     ! j = 1 , 2 , . . . , M
Based on dominance, the selection process determines which individuals are eligible to pass their genes to the next generation.
Just like in animal breeding, during crossover, two individuals combine their genes to create new offspring. Single-point, multi-point and uniform crossovers are all possible and can be applied in crossover. In single-point crossover, parents swap their genes from a single split point along the chromosome. In multi-point crossover, the swapping occurs at multiple designated locations. Finally, in uniform crossover, the genes of the offspring are selected randomly from the parents. Mutation is the operation of randomly changing genes in an individual. This helps maintain genetic diversity and provides the possibility of exploration of all locations of the solution space.
The fitness of each individual is sorted based on how many other individuals it dominates. This is termed the dominance rank. The crowding distance is another vital metric monitored during selection; it assesses how close an individual is to its neighbors in the objective space. High rank and less crowded individuals get a better fitness value. Based on the three aforementioned operations, the genetic algorithm creates new generations. In each generation, the most fitted individuals are selected and are sent to the three operators. This loop is repeated until a stopping criterion is met.

3. Experimental

3.1. Materials and Techniques

The dye used in the preparation of the photovoltaic devices was prepared according to the method published in our previous article [36], in which the chemical compounds were purchased from Merck Co (Rahway, NJ, USA). A light illumination intensity of 100 mW/cm2 was applied to characterize the prepared devices. The samples were exposed to simulated sunlight at an ambient temperature of 25 °C until the durability threshold was reached.

3.2. Preparation of Photovoltaic Devices

The elements of the DSSCs, including the sensitizer solution, titanium dioxide semiconductor, conductive substrates, and platinum electrode, were assembled under clean conditions using the sandwich method and stored in a dark environment prior to photovoltaic characterization [37,38,39].

3.3. Implementation of FFSNN

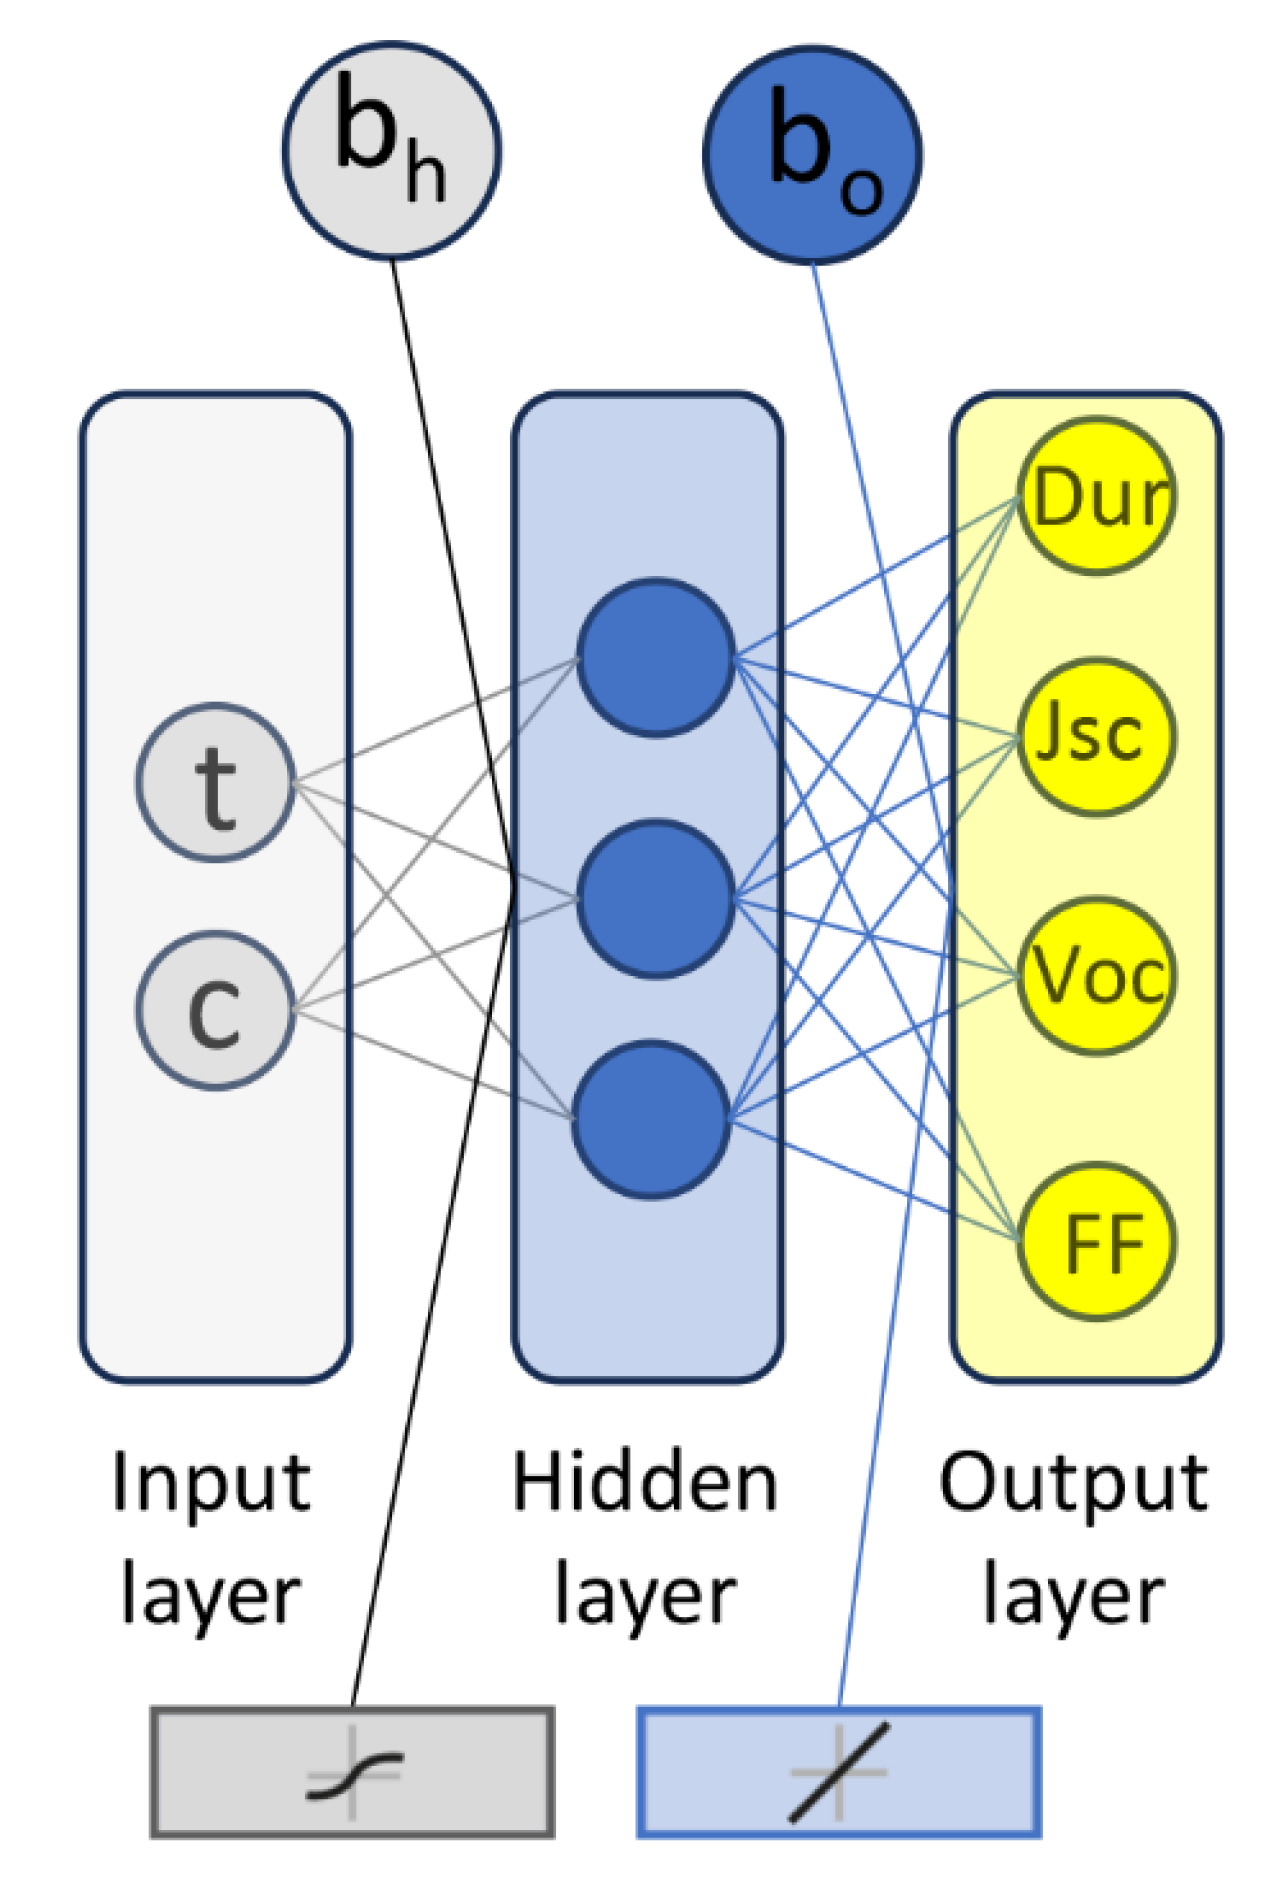
For network modeling, 15 distinct samples were fabricated using different concentrations of anti-aggregation agent and different ambient temperatures (Table S1). The durability, Jsc, Voc and FF parameters for the mentioned combinations were measured and fed into the ANN model. Although efficiency could be directly calculated from Jsc, Voc and FF, these parameters were fed into the system independently in order to map complex non-linear relationships. The settings of the network, including the training, validation and testing percentages, network structure and other settings, are shown in Table 1. The schematic architecture of the network is illustrated in Figure 2. As shown, the ambient temperature and anti-aggregation agent concentration constitute the input layer, while durability, Jsc, Voc, and FF represent the nodes of the output layer.
The Deep Learning Toolbox (formerly Neural Network Toolbox) in MATLAB R2023a was utilized for network training and modeling. The resulting trained network was subsequently integrated into the multi-objective optimization framework to determine the optimal ambient temperature and anti-aggregation agent concentration.

3.4. Network Optimization

The trained neural network from the previous step was utilized for the optimization process. This network serves as a mapping function that links the input variables (ambient temperature and anti-aggregation agent concentration) to the four output parameters (durability, Jsc, Voc, and FF).
This function could be solved for the best set of durability and efficiency, provided that the network adequately fits the measurements. As explained, multi-objective genetic optimization was utilized to find the Pareto front. To do so, the optimization toolbox in MATLAB 2023a was used. The optimization settings are shown in Table 2.

4. Results and Discussion

Dye-sensitized solar cells (DSSCs) are the third generation of photovoltaic technology, attracting attention due to their sustainable and pollution-free energy production [40]. Dyes are excited by the absorption of light to produce electrons, and the rate of electron production depends on their chemical structure. Therefore, the design of efficient systems with high absorption and ease of electron preparation is of great importance. Research has shown that organic–inorganic compounds have the ability to produce suitable electrons due to their high absorption intensity. Therefore, molecular engineering aimed at improving the structure in this class is an attractive research topic [41,42]. The effects of different ligands in the design of organometallic systems for application in DSSCs have been evaluated. The results showed that phosphite ligands containing amino alcohols [43] and thiocyanates [36,44] can be effective in improving the photocatalytic properties of novel sensitizers. Numerous studies have been published in this regard; however, the key question is how to best apply the sensitizer to the solar cell structure after effective synthesis. As mentioned, organometallic sensitizers show the best performance in DSSC structures. However, factors such as aggregation on the semiconductor and application temperature must be managed to obtain optimal conditions. For this purpose, an organometallic dye (Figure 1), which had previously been synthesized and whose performance had been confirmed [36], was used, and the processing conditions were engineered using machine learning tools.
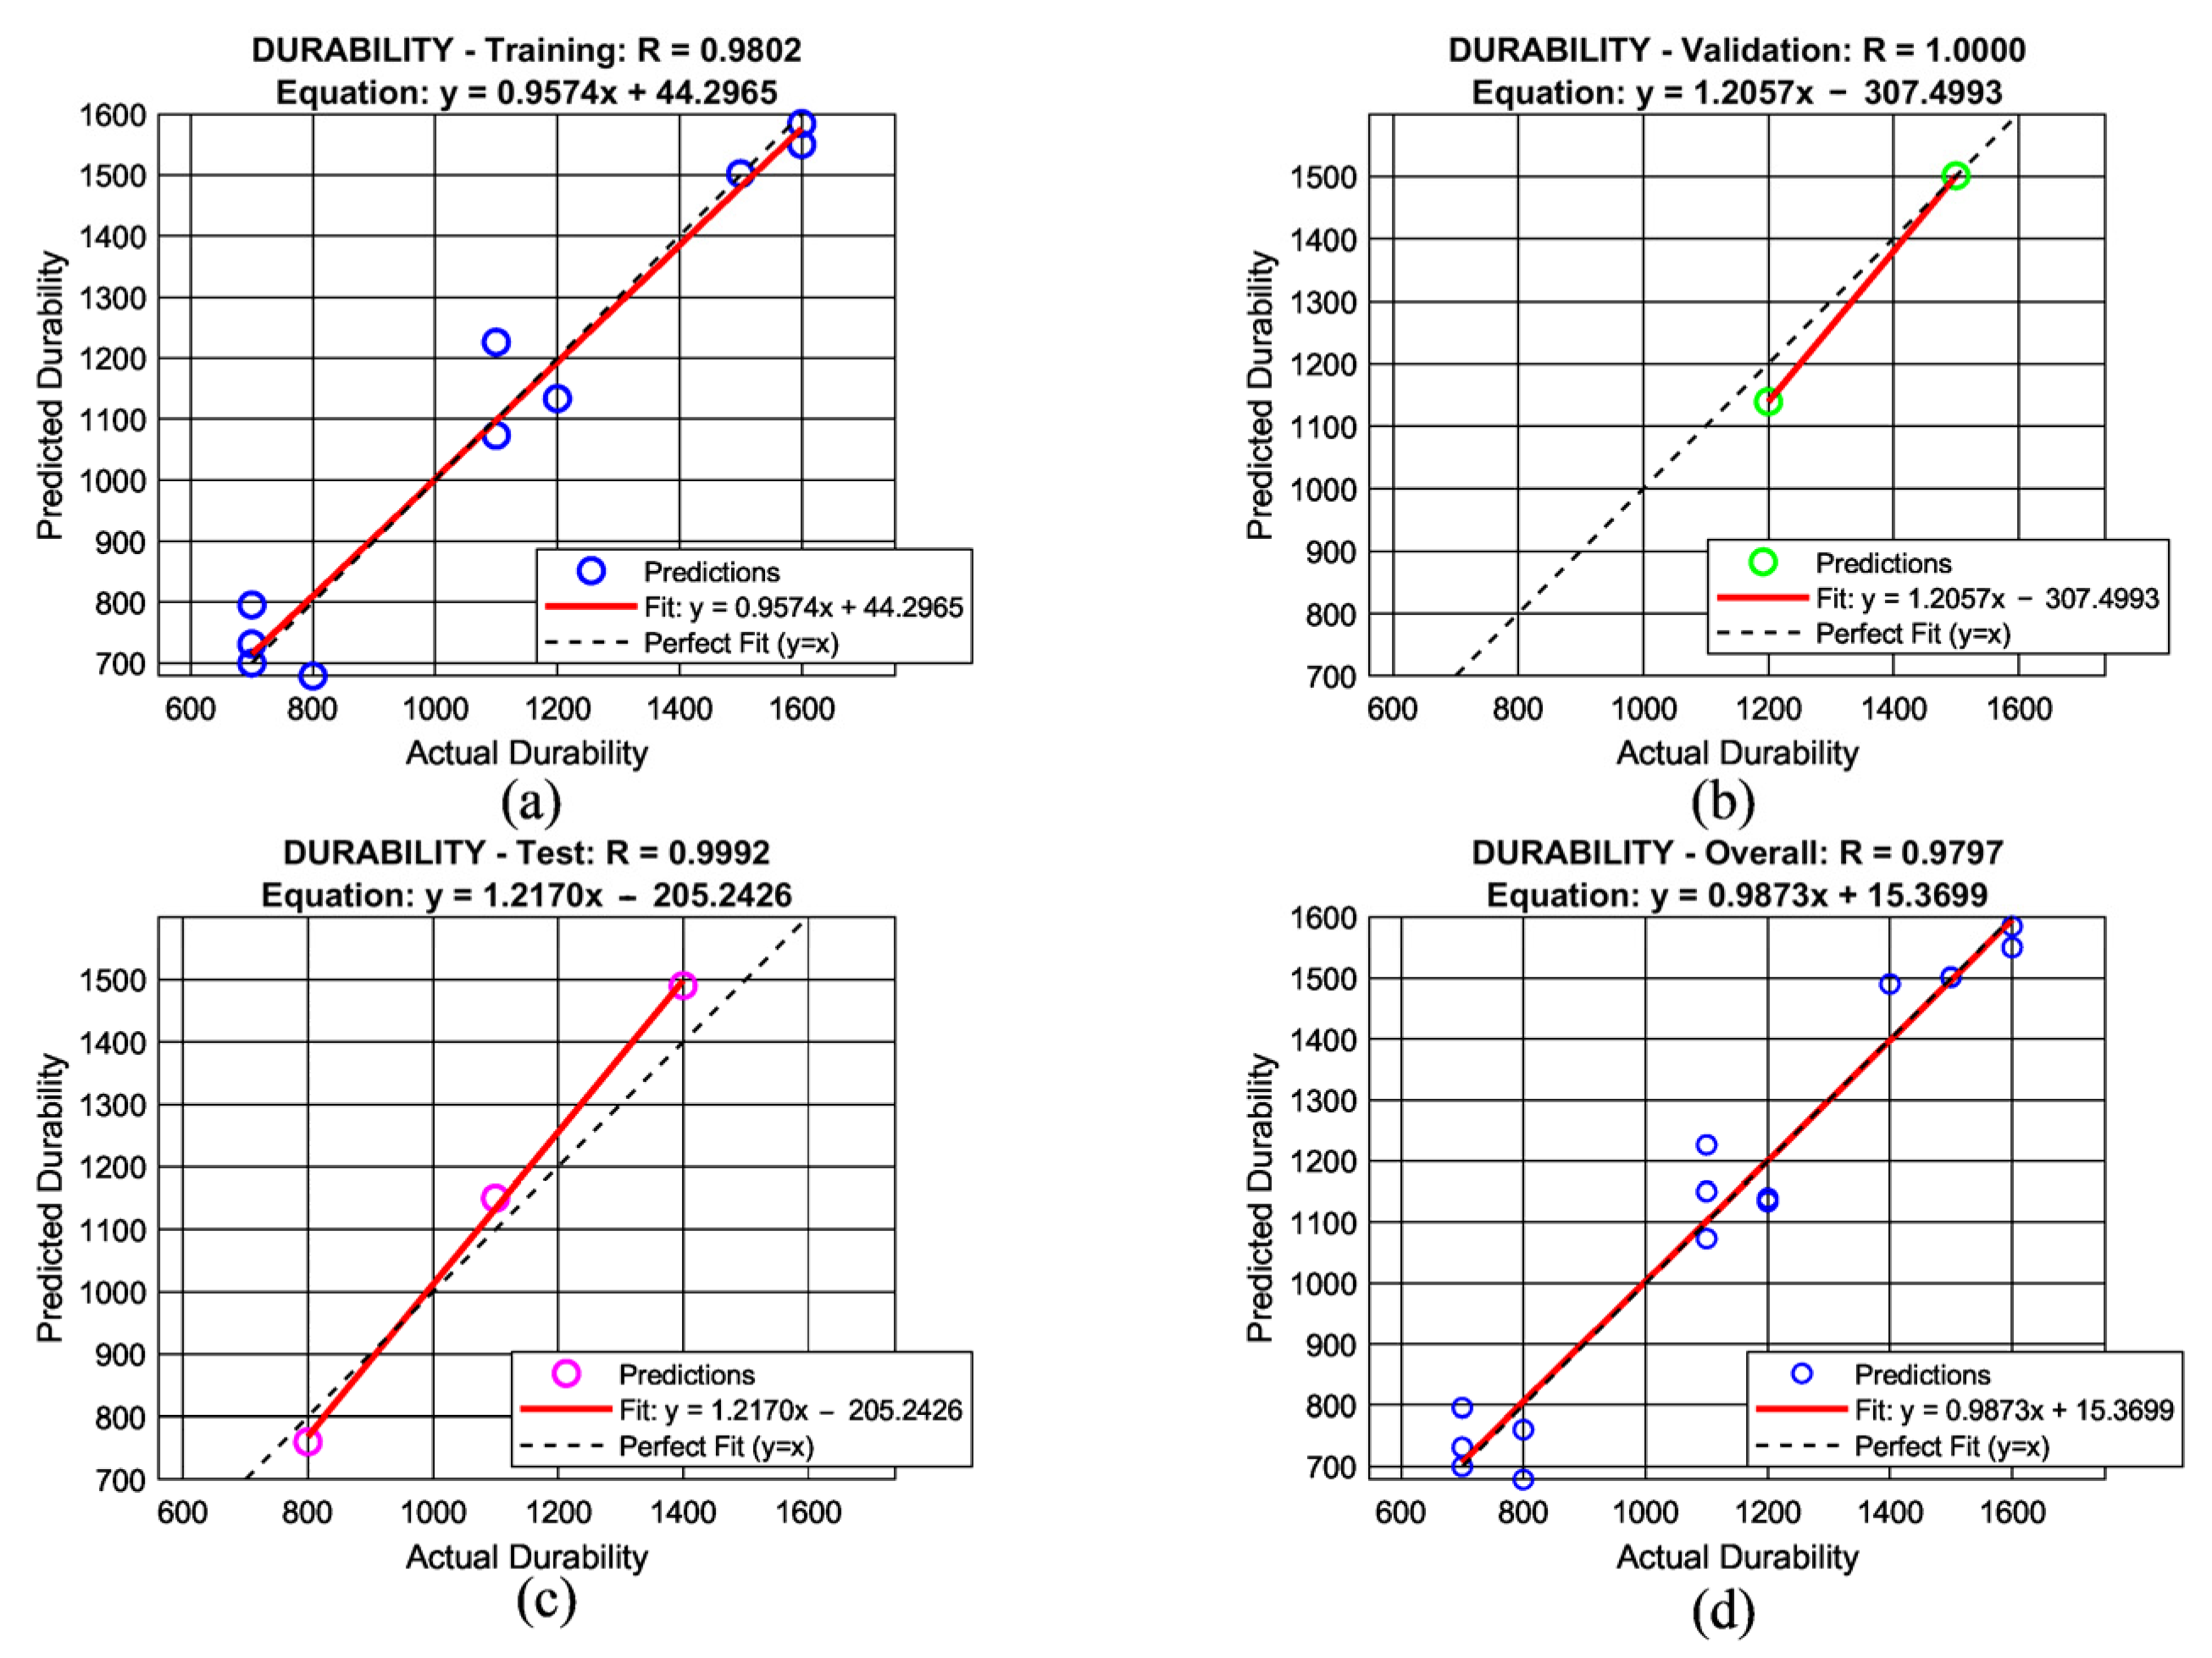
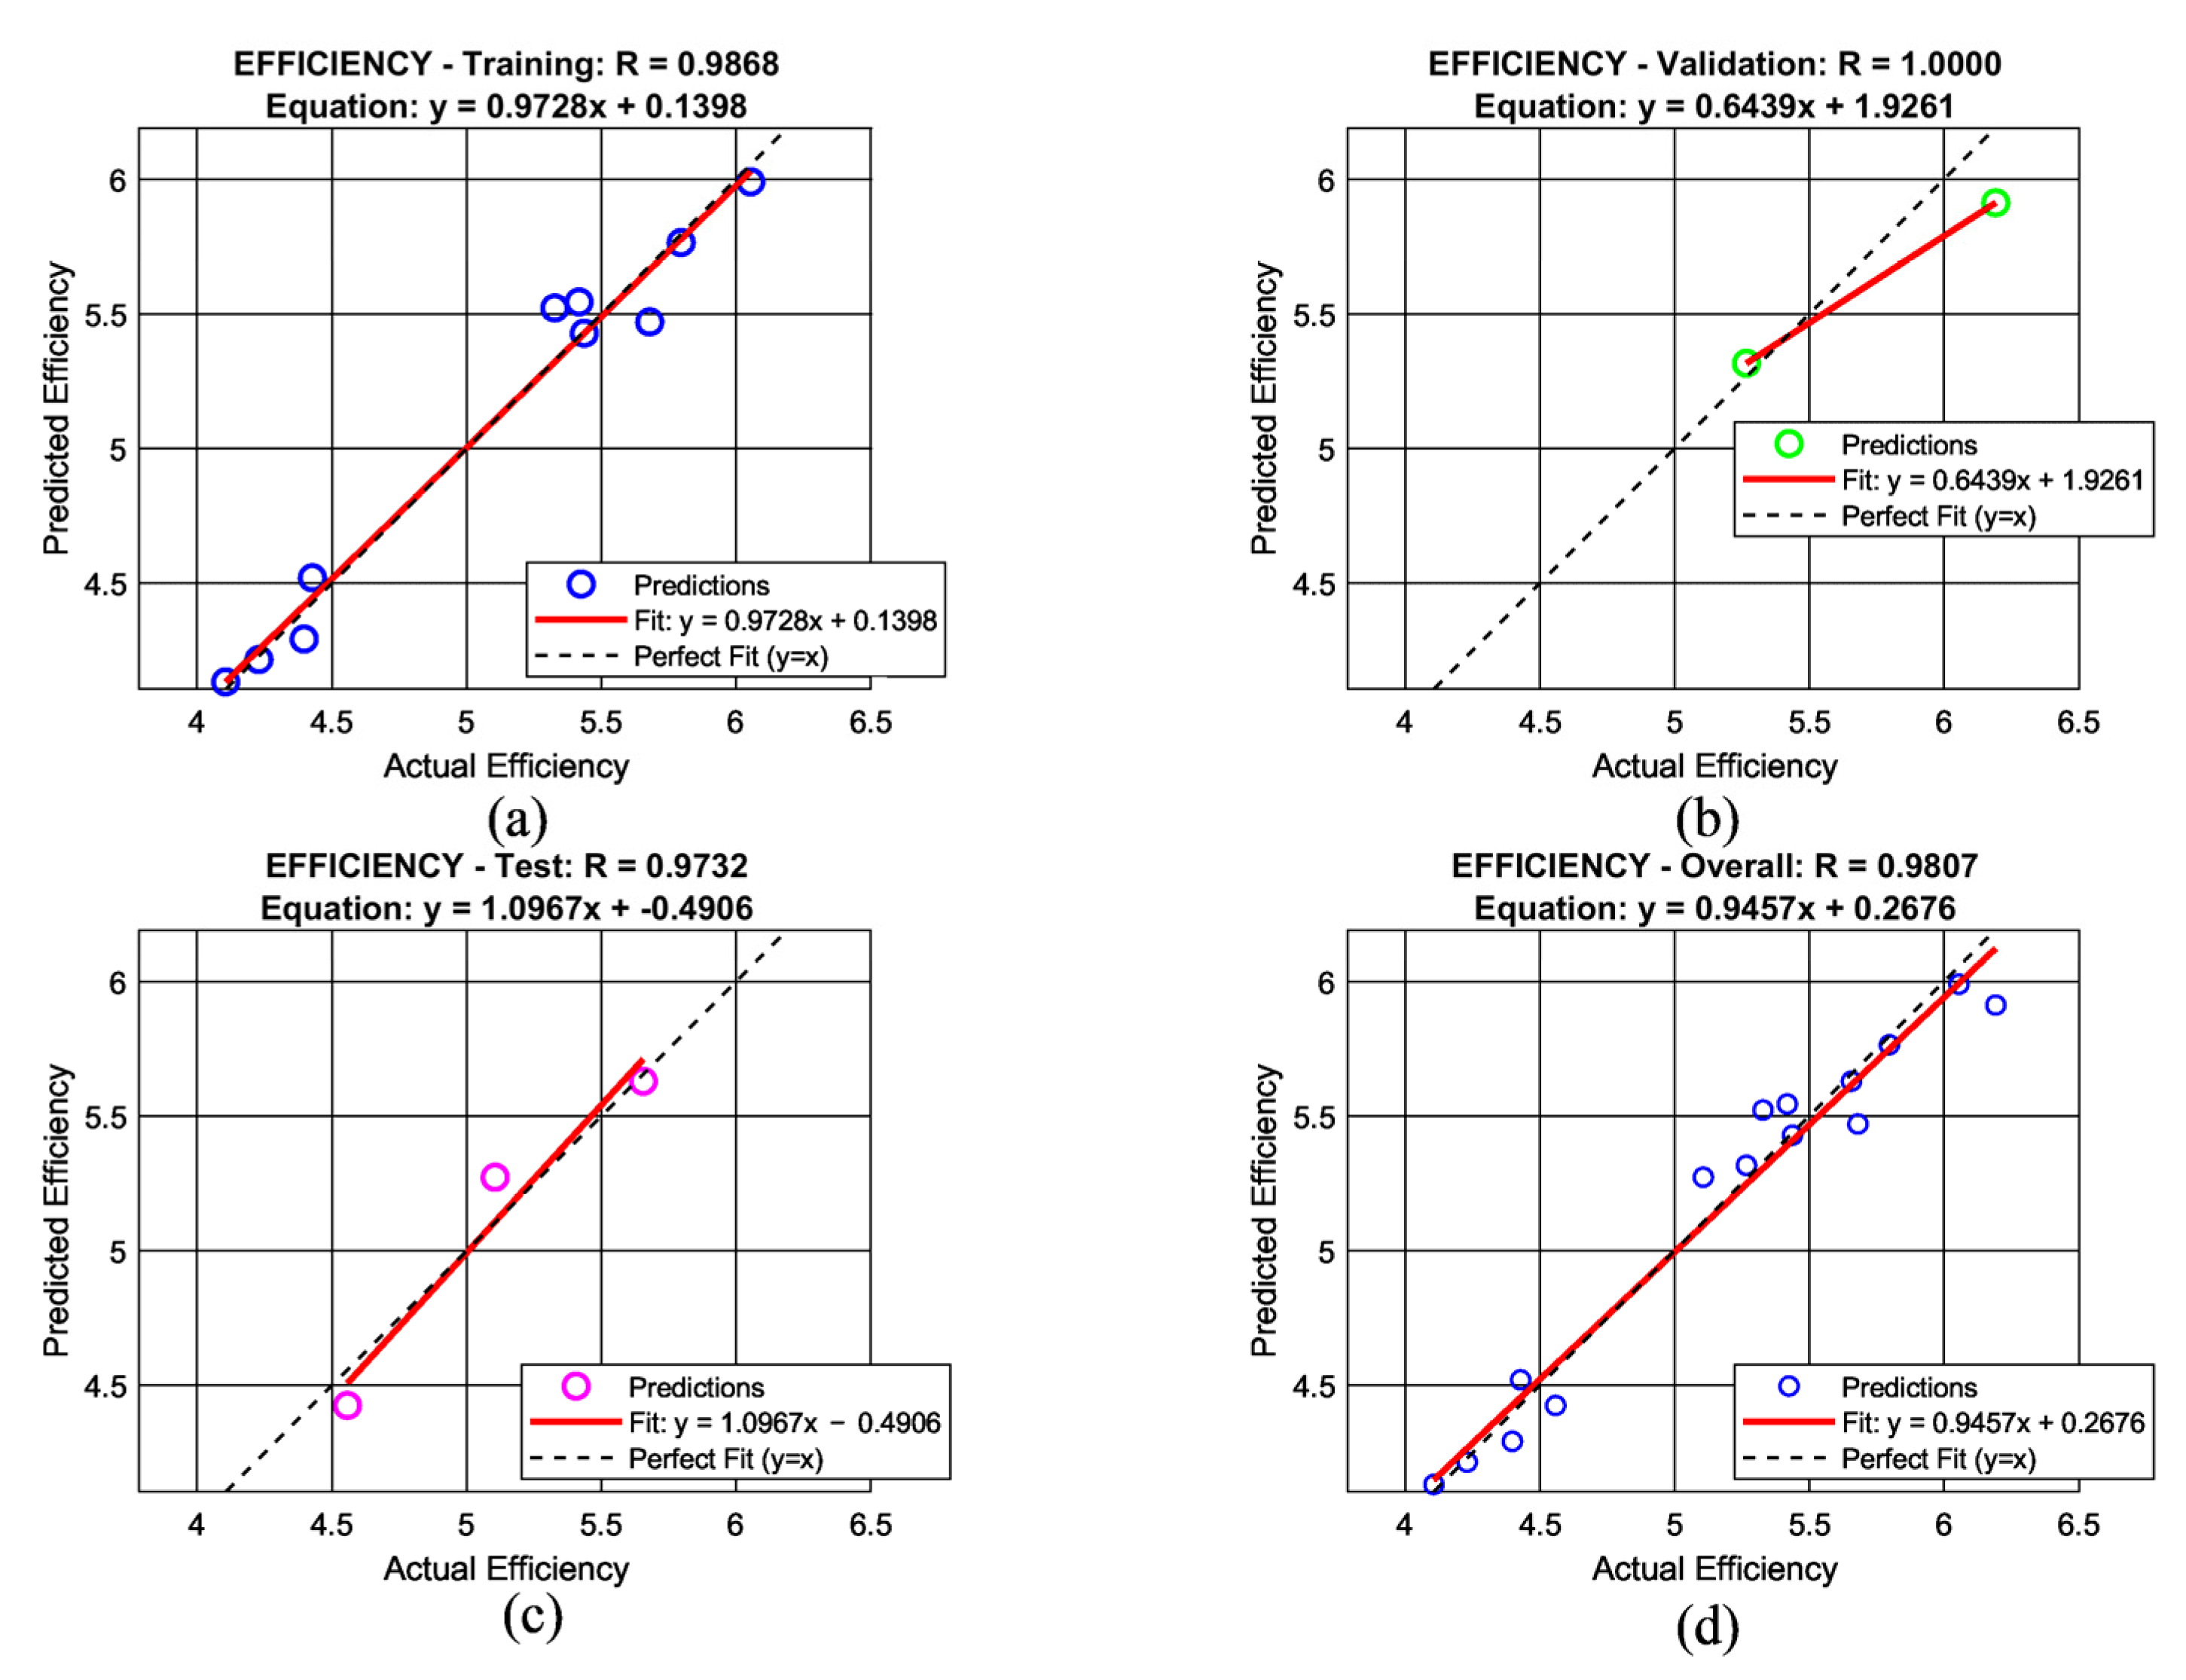
The neural network weights and biases were optimized after 14 epochs. The regression plots for the training, validation, testing and complete datasets are shown in Figure 3 and Figure 4 for durability and efficiency, respectively. In order to check the networks for overfitting, leave-one-out cross-validation (LOOCV) was performed on the data. The results are shown in Table 3. The LOOCV results demonstrate that our ANN model predicts durability with an R = 0.9078 and efficiency with an R = 0.9147 across all 15 data points.
Comparison between the original hold-out test set (n = 3 samples) and LOOCV (n = 15 models) reveals a performance gap. The original split yielded R = 0.9992 for durability and R = 0.9732 for efficiency, while LOOCV gave more conservative estimates of R = 0.9078 and R = 0.9147, respectively. The Root Mean Square Error (RMSE) values increased from 63.92 to 135.87 for durability and from 0.1240 to 0.3103 for efficiency under LOOCV. Similarly, the Mean Absolute Error (MAE) (±standard deviation) changed from 60.10 ± 26.67 to 111.97 ± 79.66 for durability and from 0.1085 ± 0.0736 to 0.2270 ± 0.2190 for efficiency.
This performance gap indicates mild to moderate overfitting, which is expected given the limited dataset size (n = 15). The larger standard deviations in LOOCV reflect the model’s variable performance across different samples. Nevertheless, the LOOCV R-values remain above 0.9 for both targets, confirming that the network learned meaningful patterns rather than simply memorizing specific data points. The model maintains acceptable predictive accuracy for practical screening applications.
As can be seen, the network was able to predict the two parameters, durability and efficiency, from temperature and anti-aggregation agent concentration with acceptable accuracy (Table S1). The reason for using, Jsc, Voc and FF instead of efficiency in the output layer was to expand the network’s output layer capacity and improve optimization accuracy by using the independent data. This shows the potential of the proposed model for optimization to find the best temperature and anti-aggregation concentration.
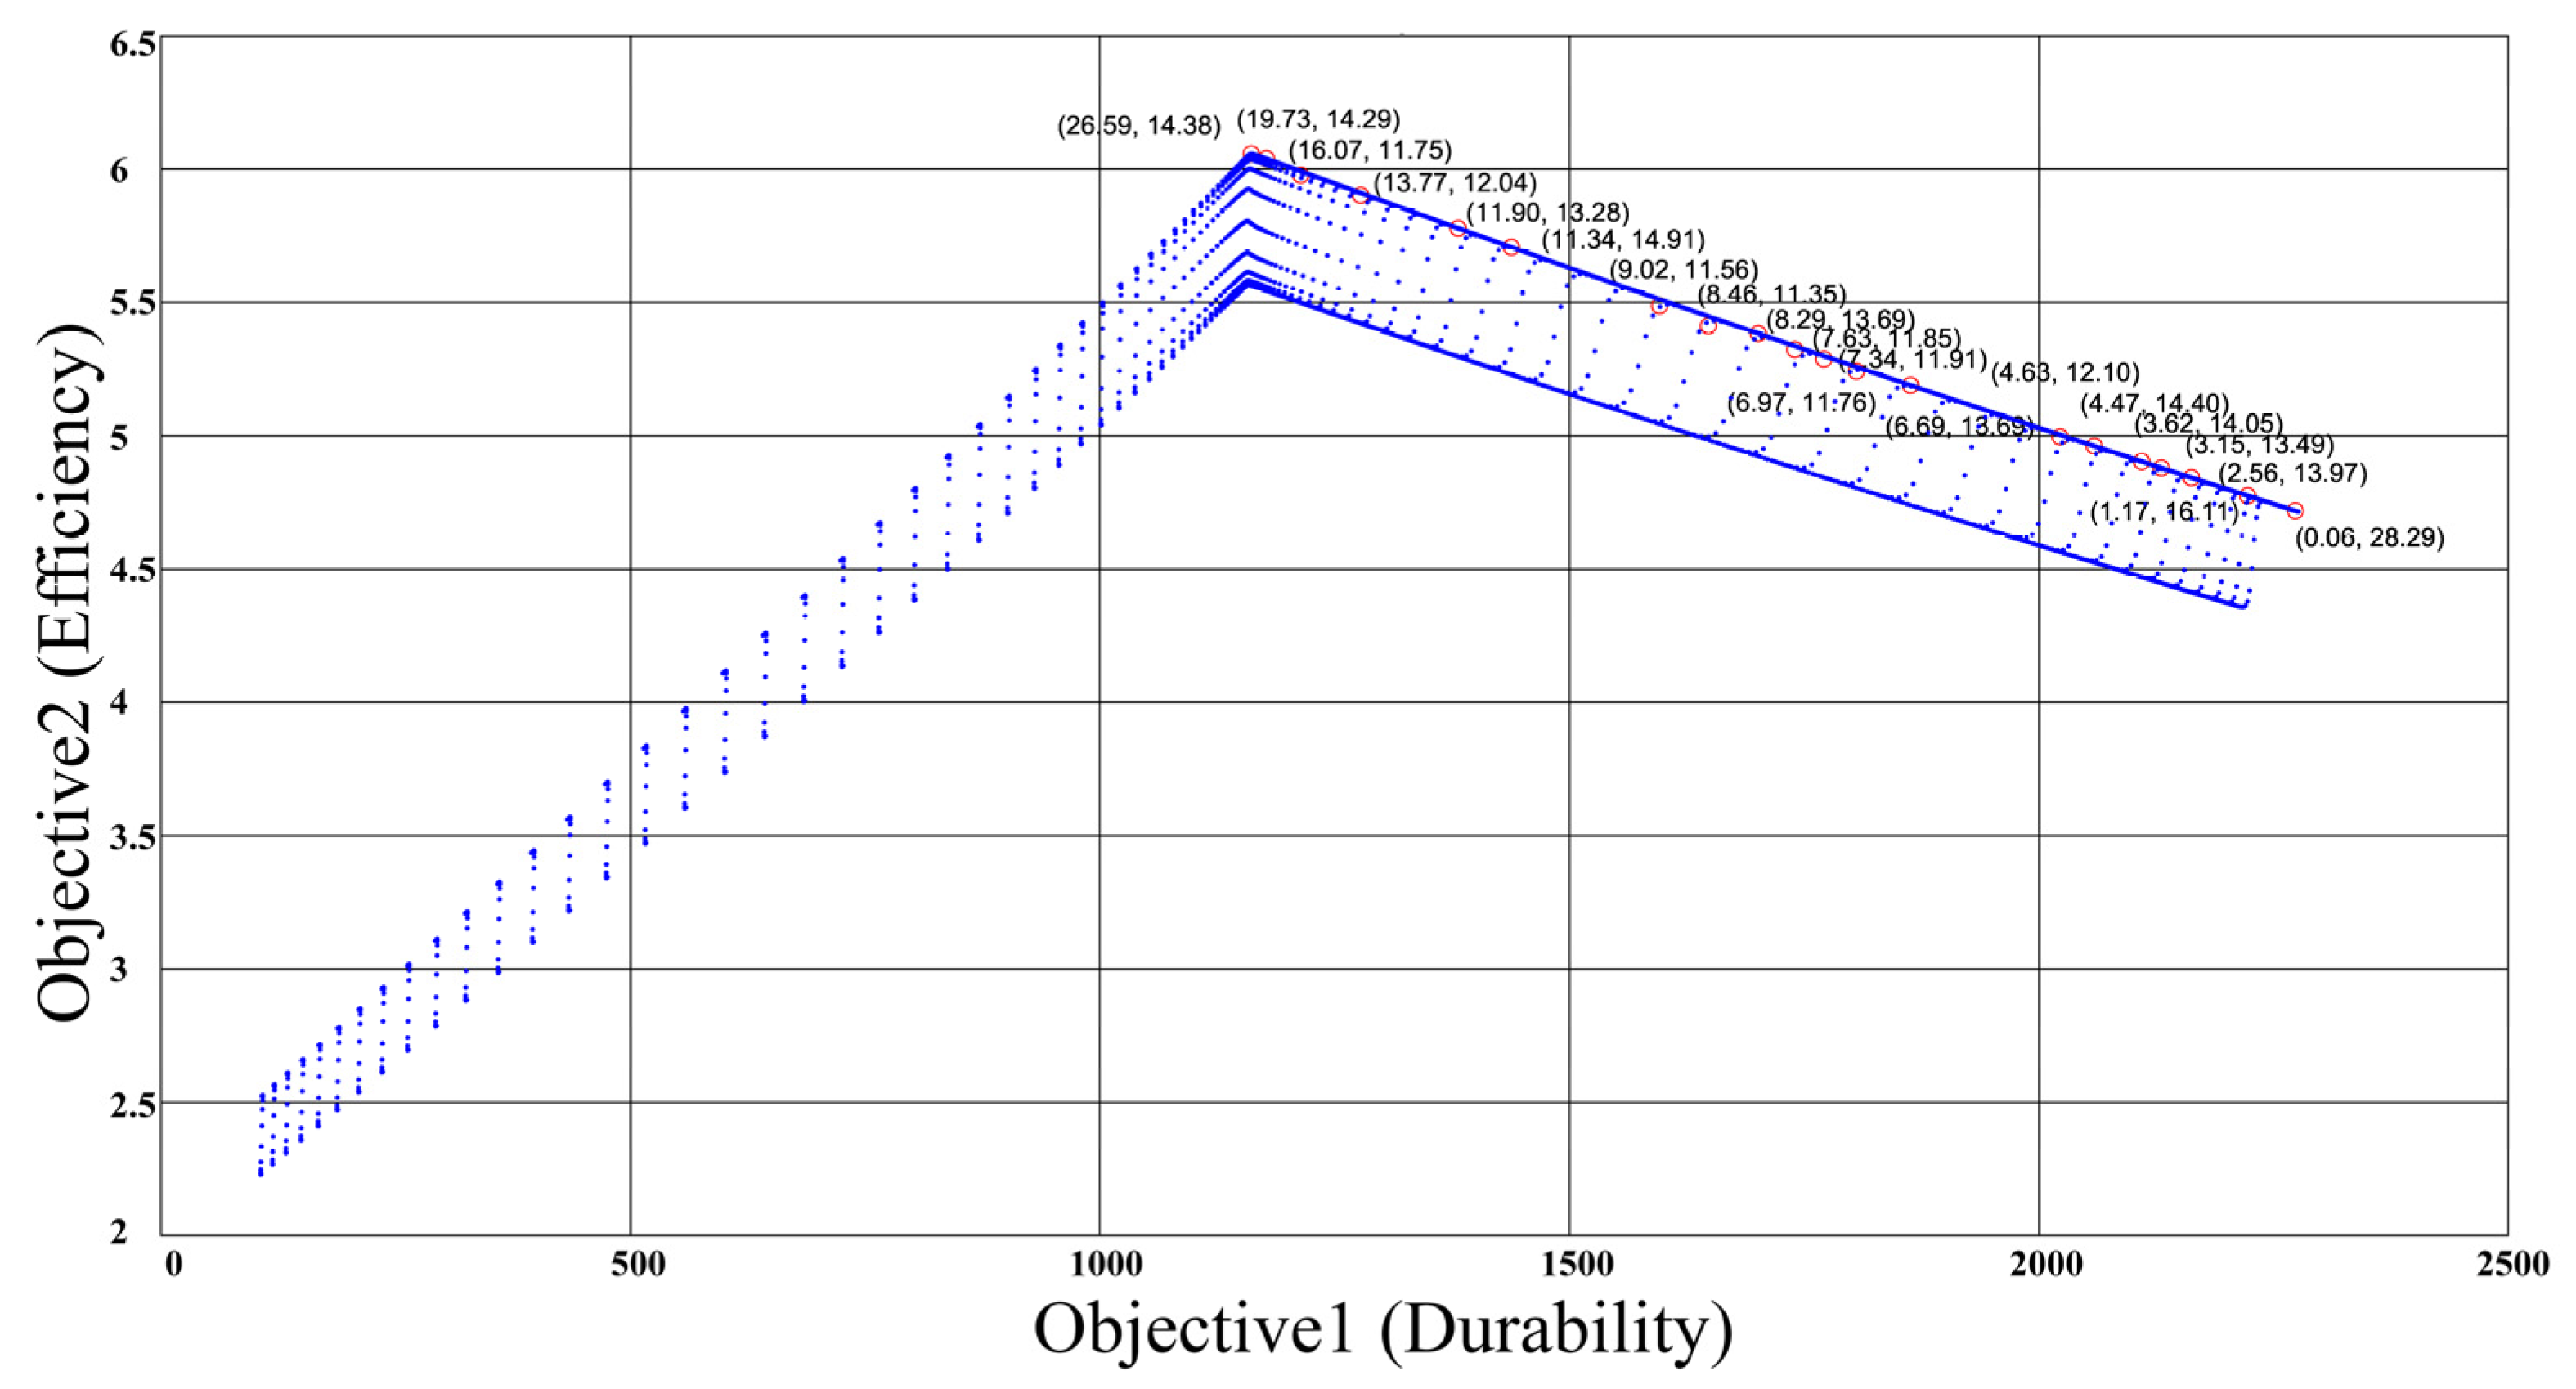
The ANN model was utilized for optimization using MOGA. The optimization ran for 175 generations, and the average change in the spread of the Pareto solutions caused the algorithm to stop. The optimization results are shown in Figure 5. The Pareto front, depicted by red circles, shows the two objectives’ values in parentheses for each solution. It can be observed that the Pareto front is suitably positioned in a region where no other point nearby has better values for both objectives. This is in complete accordance with what has been stated in Equations (2) and (3).
The blue points in Figure 5 are plotted using the extracted ANN model. This was achieved by scanning the possible combinations of anti-aggregation agent concentration and temperature. It can be argued that this scanning was sufficient for determining the optimal concentration and temperature. While this might initially appear controversial, for three or more objectives, visual assessment becomes practically impossible.
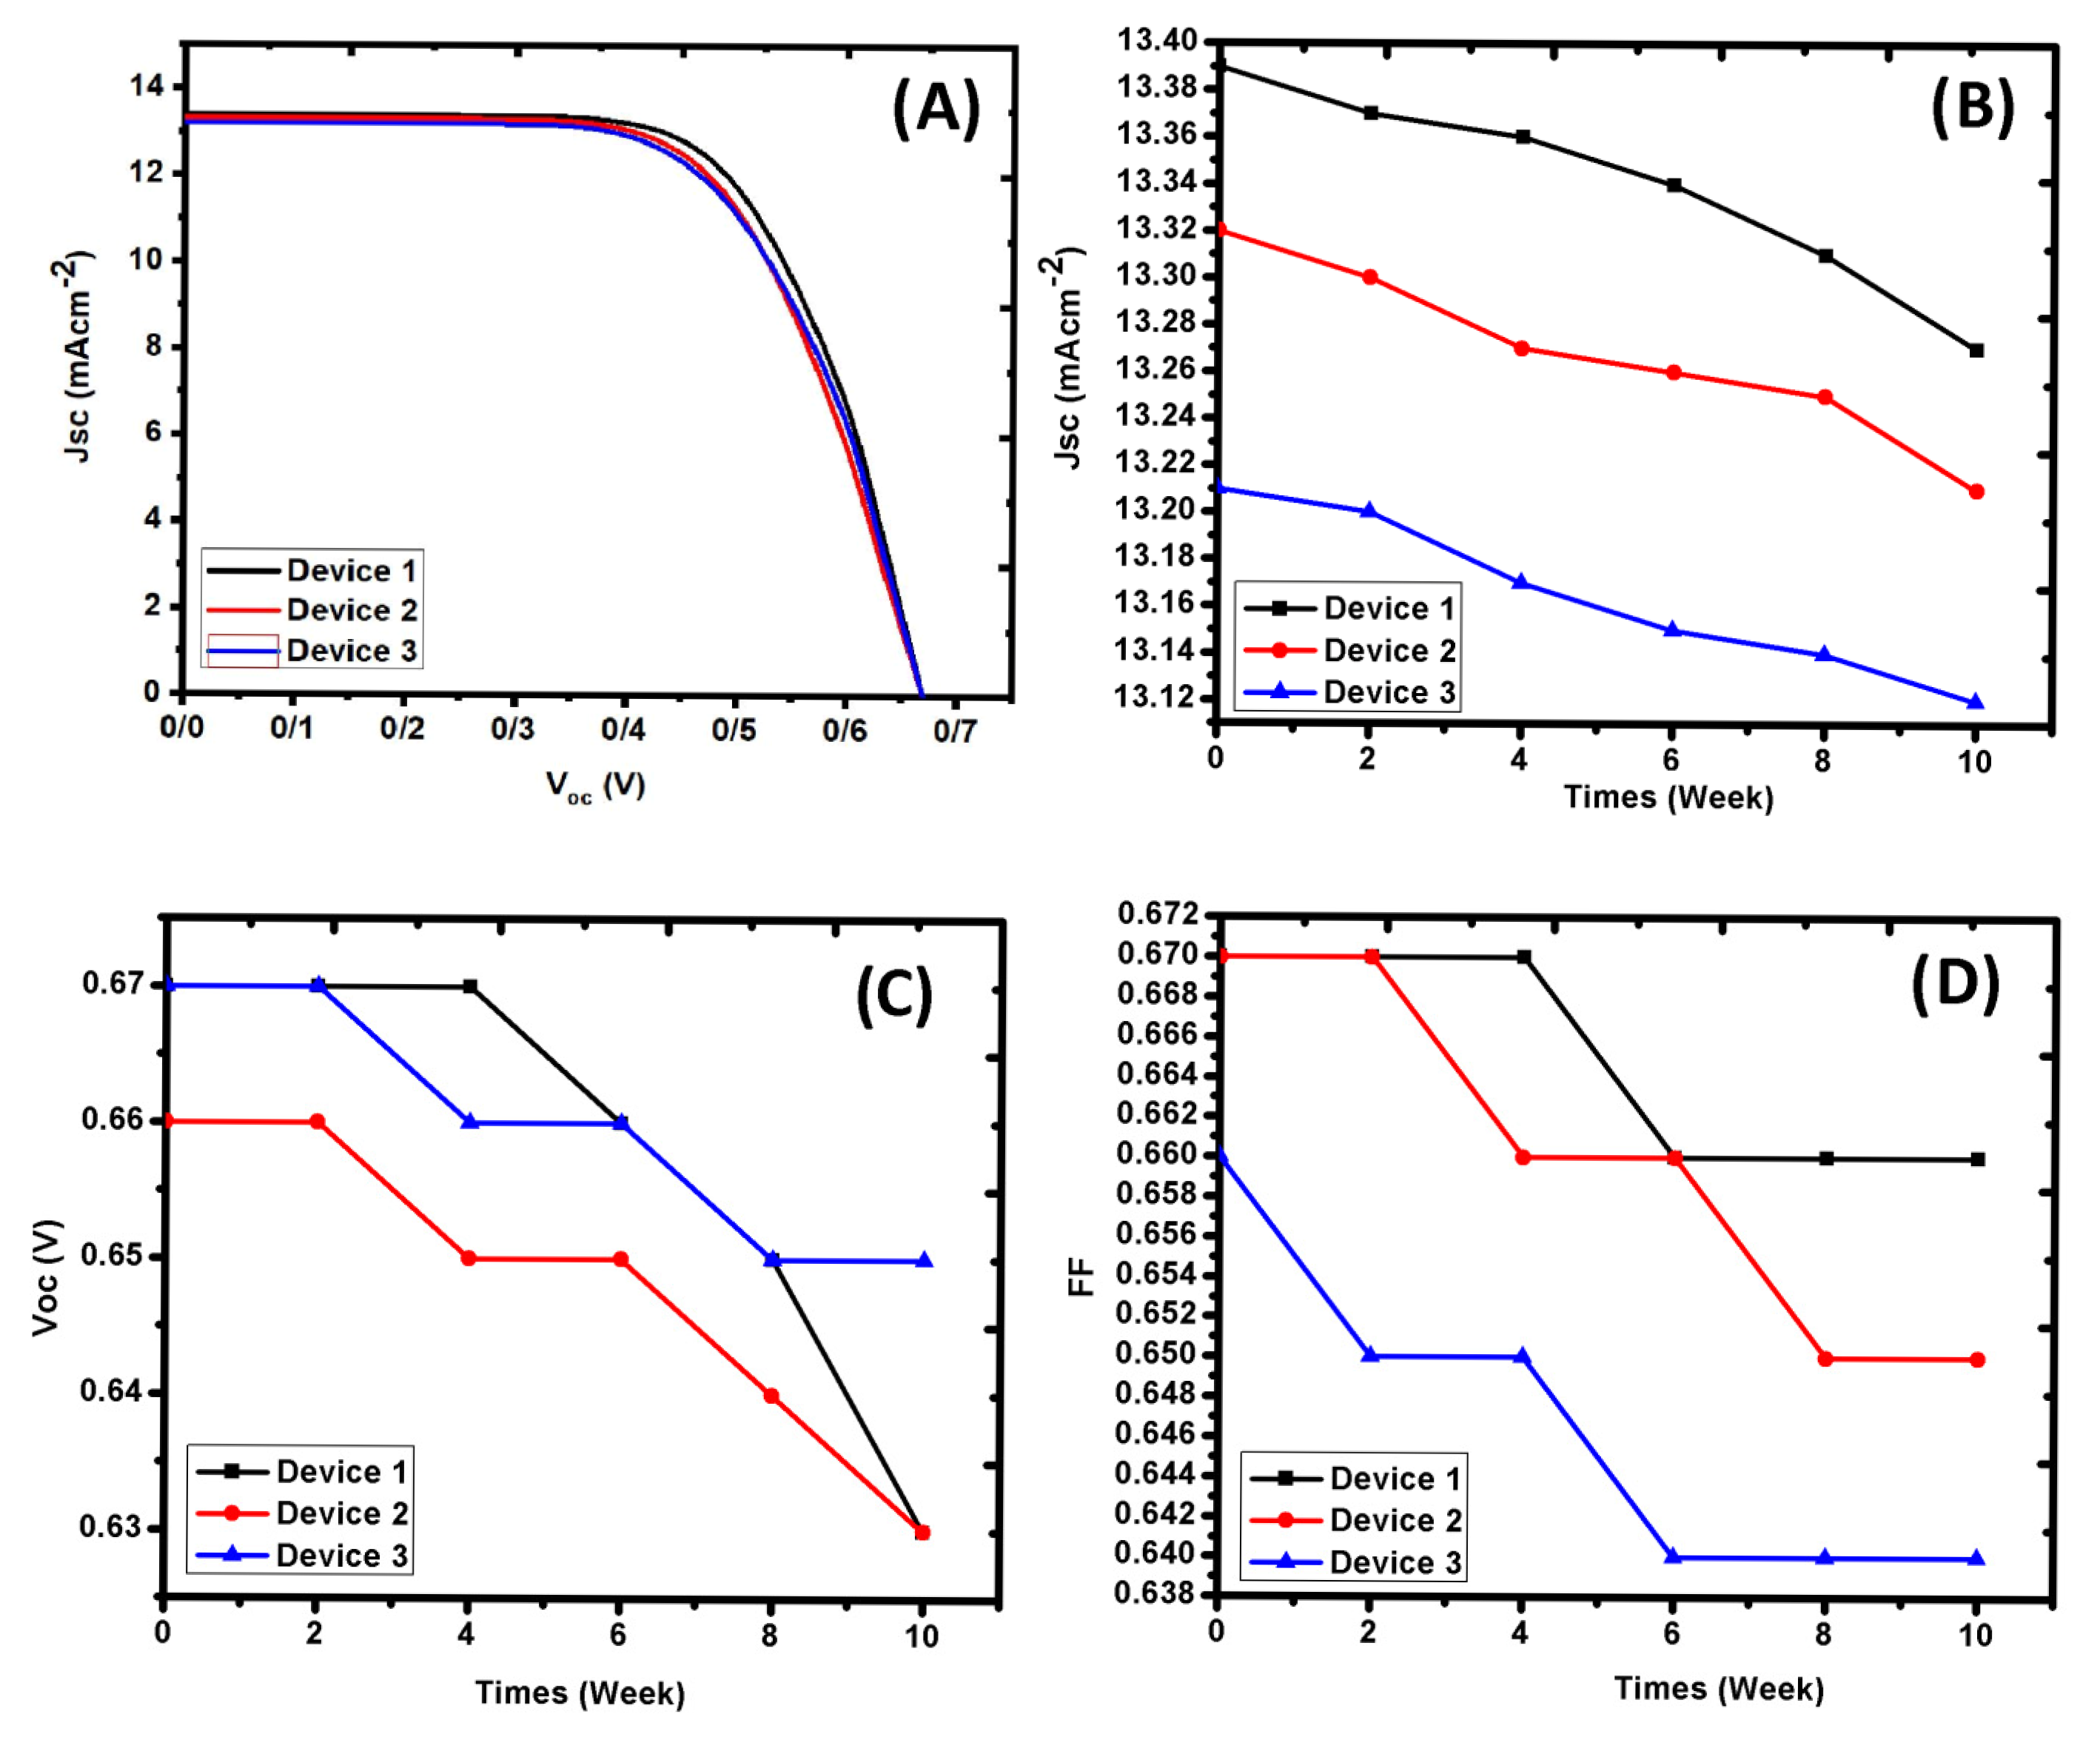
The stopping criterion for MOGA is controlled by spread. Additionally, different runs of the algorithm are influenced by random initialization, mutation, crossover, and the stochastic nature of the algorithm. In such a complex algorithm, although each run correctly identifies the Pareto front, they represent different points on the Pareto front. In other words, multiple runs of the algorithm result in different answers, all of which are correct. Based on this rationale, three practically desired sets of temperature and concentration were selected. These sets were tested in practice, and the predicted durability and efficiency were compared to the actual measured results. The results are shown in Table 4 and presented in Figure 6. The results predicted by the model are in very good agreement with the experimental results, indicating the achievement of maximum durability and efficiency under the proposed experimental conditions.
The J-V curves and the trend of changes in the photovoltaic parameters over time are shown in Figure 6. A comparison of the changes in the two parameters, photocurrent and photovoltage, over time (Figure 6B,C) shows that the changes in photocurrent are smaller than those in photovoltage. This result could be due to fluctuations in electron production by the dye, caused by a reduction in excited electron production or mass transport limitations during the electron–hole regeneration and electron acceptance from the electrolyte. However, the observed changes were not significant, and the device maintained repeatable efficiency of up to about 1700 h. The smallest changes were observed in the FF (Figure 6D), indicating stabilization of the device’s internal charge transport resistance over time. Our research group had previously synthesized and characterized three analog chemical structures in Figure 1 [11,36]. A relevant question is whether the optimal conditions obtained in this study are also responsible for these structures. To answer this question, devices containing the three synthesized dyes were prepared, and their photovoltaic parameters were investigated (Table 5 and Table S2). The results show that the devices prepared under the optimal conditions had high efficiency and durability. Therefore, it is predicted that the optimal parameters obtained for loading the dye on the semiconductor can be generalized to similar structures. So far, four organometallic dyes based on ruthenium with high efficiency and acceptable durability have been introduced and are widely used in many studies to compare results. All of these compounds have ruthenium as the central metal. The efficiencies of these compounds vary among different papers depending on the conditions of device preparation and its components. In this study, the efficiency obtained for the dye used (Figure 1) was about 14% lower compared to N719 [15,16,45].

5. Conclusions

Machine learning methods were used to optimize the conditions for loading a novel organometallic dye onto the semiconductor substrate of DSSCs. For this purpose, 15 different devices were prepared with varying concentrations of anti-aggregation agent (0, 5, 10, and 20 mM) and ambient temperatures (10, 30 and 50 °C). The temperature and concentration of anti-aggregation agents for achieving the highest efficiency and durability were predicted. New devices were prepared under optimized conditions, and the efficiency and durability results of the experimentally prepared devices showed strong agreement with the predictions, indicating acceptable model performance. The peak photovoltaic performance—achieving a power conversion efficiency of approximately 8.01%—was achieved at T = 15 °C and AG = 12 mM, as confirmed by the proposed hybrid ANN–MOGA. Different dyes from the original sample were evaluated to compare the results with organometallic structures. The results showed that the optimal conditions obtained for other organometallic structures were also responsive, suggesting that the proposed model can be used for similar compounds. Finally, we emphasize that the simplicity of modeling using two variables is a deliberate strength because it enables direct visual validation of the ANN’s ability to capture non-linear patterns. The same procedure can be employed to higher dimensions. Therefore, what has been introduced is not a trivial optimization but rather a scalable, non-linear, multi-objective framework that discovers hidden Pareto frontiers without pre-specified models. Additionally, the results demonstrated that the LOOCV procedure can be employed to evaluate the validity and robustness of the ANN model; however, such techniques should be accompanied by a larger sample size to ensure reliable generalization.

Supplementary Materials

The following supporting information can be downloaded at: https://www.mdpi.com/article/10.3390/chemengineering10060072/s1, Figure S1: Synthesis process of the Ru-dye; Figure S2: Chemical structure of the dyes; Figure S3: FTIR spectra of the dyes; Figure S4: 1HNMR spectra of the dyes; Figure S5: 13CNMR spectra of the dyes; Figure S6: Mass spectra of the dyes; Table S1: Details of the photovoltaic characteristics of the prepared devices; Table S2: Chemical structure of the dyes. References [46,47,48,49] are cited in the supplementary materials.

Author Contributions

Software, A.M.N. and S.N.; validation, M.H., A.M.N. and S.N.; data curation, A.M.N.; visualization, M.H.; supervision, M.H. All authors have read and agreed to the published version of the manuscript.

Funding

This research received no external funding.

Data Availability Statement

The raw data supporting the conclusions of this article will be made available by the authors on request.

Conflicts of Interest

The authors declare no conflict of interest.

References

  1. Kumar, A.; Kathuria, I.; Kumar, S. Recent advances in applications of merocyanine dye as sensitizers in solar cells. Next Mater. 2025, 7, 100352. [Google Scholar] [CrossRef]
  2. Prajapat, K.; Mahajan, U.; Sahu, K.; Dhonde, M. The evolution of natural dye-sensitized solar cells: Current advances and future outlook. Sol. Energy 2024, 284, 113081. [Google Scholar] [CrossRef]
  3. Qamar, S.; Ela, S.E. Dye-sensitized solar cells (DSSC): Principles, materials and working mechanism. Curr. Opin. Colloid Interface Sci. 2024, 74, 101871. [Google Scholar] [CrossRef]
  4. Muchuweni, E.; Mombeshora, E.T.; Muiva, C.M.; Sathiaraj, T.S.; Yildiz, A.; Pugliese, D. Towards high-performance dye-sensitized solar cells by utilizing reduced graphene oxide-based composites as potential alternatives to conventional electrodes: A review. Next Mater. 2025, 6, 100477. [Google Scholar] [CrossRef]
  5. Iman, R.N.; Younas, M.; Harrabi, K.; Mekki, A. A comprehensive review on advancements and optimization strategies in dye-sensitized solar cells: Components, characterization, stability and efficiency enhancement. Inorg. Chem. Commun. 2024, 165, 112488. [Google Scholar] [CrossRef]
  6. Hosseinnezhad, M.; Nasiri, S.; Nutalapati, V.; Gharanjig, K.; Arabi, A.M. A review of the application of organic dyes based on naphthalimide in optical and electrical devices. Prog. Color Color. Coat. 2024, 17, 417–433. [Google Scholar]
  7. Saud, P.S.; Bist, A.; Kim, A.A.; Yousef, A.; Abutaleb, A.; Park, M.; Park, S.J.; Pant, B. Dye-sensitized solar cells: Fundamentals, recent progress, and optoelectrical properties improvement strategies. Opt. Mater. 2024, 150, 115242. [Google Scholar] [CrossRef]
  8. Wu, W.; Li, Y.; Zhang, J.; Guo, X.; Wang, L.; Agren, H. Theoretical modelling of metal-based and metal-free dye sensitizers for efficient dye-sensitized solar cells: A review. Sol. Energy 2024, 277, 112748. [Google Scholar] [CrossRef]
  9. Sasikumar, R.; Thirumalaisamy, S.; Kim, B.; Hwang, B. Dye-sensitized solar cells: Insights and research divergence towards alternatives. Renew. Sustain. Energy Rev. 2024, 199, 114549. [Google Scholar] [CrossRef]
  10. Prajapat, K.; Dhonde, M.; Sahu, K.; Bhojane, P.; Murty, V.; Shirage, P.M. The evolution of organic materials for efficient dye-sensitized solar cells. J. Photochem. Photobiol. C Photochem. Rev. 2023, 55, 100589. [Google Scholar] [CrossRef]
  11. Hosseinnezhad, M.; Nasiri, S.; Nutalapati, V.; Gharanjig, K.; Nunzi, J.M. Heart engineering of photovoltaic devices: Preparation of new Ru dyes using thioindigo and phenothiazine. Appl. Organomet. Chem. 2024, 39, e7766. [Google Scholar] [CrossRef]
  12. Yashwantrao, G.; Saha, S. Perspective on the rational design strategies of quinoxaline derived organic sensitizers for dye-sensitized solar cells (DSSC). Dyes Pigments 2022, 199, 110093. [Google Scholar] [CrossRef]
  13. Al-Marhabi, A.R.; El-Shishtawy, R.M.; Al-Footy, K.O. An overview of metal-free diazine-based dyes for dye-sensitized solar cells: Synthesis, optical, and photovoltaic properties. Mater. Today Sustain. 2024, 28, 101014. [Google Scholar] [CrossRef]
  14. Sen, A.; Putra, M.H.; Biswas, A.K. Insight on the choice of sensitizers/dyes for dye sensitized solar cells: A review. Dyes Pigments 2023, 213, 111087. [Google Scholar] [CrossRef]
  15. Hosseinnezhad, M.; Shadman, A.; Saeb, M.R.; Mohammadi, Y. A new direction in design and manufacture of co-sensitized dye solar cells: Toward concurrent optimization of power conversion efficiency and durability. Opto-Electron. Rev. 2017, 25, 229–237. [Google Scholar] [CrossRef]
  16. Hosseinnezhad, M.; Saeb, M.R.; Garshasbi, S.; Mohammadi, Y. Realization of manufacturing dye-sensitized solar cells with possible maximum power conversion efficiency and durability. Sol. Energy 2017, 149, 314–322. [Google Scholar] [CrossRef]
  17. Osberghaus, A.; Baumann, P.; Hepbildikler, S.; Nath, S.; Haindl, M.; von Lieres, E.; Hubbuch, J. Detection, Quantification, and Propagation of Uncertainty in High-Throughput Experimentation by Monte Carlo Methods. Chem. Eng. Technol. 2012, 35, 1456–1464. [Google Scholar] [CrossRef]
  18. Varga, Z.; Bobeck, M.; Conka, Z.; Racz, E. Machine Learning-Based Prediction of Dye-Sensitized Solar Cell Efficiency for Manufacturing Process Optimization. Energies 2025, 18, 5011. [Google Scholar] [CrossRef]
  19. Liotier, J.; Riquelme, A.J.; Mwalukuku, V.; Huaulmé, Q.; Kervella, Y.; Demadrille, R.; Aumaître, C. Data-driven modelling for electrolyte optimisation in dye-sensitised solar cells and photochromic solar cells. Mater. Horiz. 2025, 12, 3803–3814. [Google Scholar] [CrossRef]
  20. Coppola, C.; Visibelli, A.; Parisi, M.L.; Santucci, A.; Zani, L.; Spiga, O.; Sinicropi, A. A combined ML and DFT strategy for the prediction of dye candidates for indoor DSSCs. npj Comput. Mater. 2025, 11, 28. [Google Scholar] [CrossRef]
  21. Onah, E.H.; Lethole, N.L.; Mukumba, P. Optoelectronic Devices Analytics: Machine Learning-Driven Models for Predicting the Performance of a Dye-Sensitized Solar Cell. Electronics 2025, 14, 1948. [Google Scholar] [CrossRef]
  22. Tomar, N.; Rani, G.; Dhaka, V.S.; Surolia, P.K. Role of artificial neural networks in predicting design and efficiency of dye sensitized solar cells. Int. J. Energy Res. 2022, 46, 11556–11573. [Google Scholar] [CrossRef]
  23. Alanis, A.Y.; Arana-Daniel, N.; Lopez-Franco, C. Artificial Neural Networks for Engineering Applications; Elsevier Science: Amsterdam, The Netherlands, 2019. [Google Scholar]
  24. Fine, T.L. Feedforward Neural Network Methodology; Springer: New York, NY, USA, 2006. [Google Scholar]
  25. Goodfellow, I.; Bengio, Y.; Courville, A. Deep Learning; MIT Press: Cambridge, MA, USA, 2016. [Google Scholar]
  26. Nielsen, M.A. Neural Networks and Deep Learning; Determination Press: San Francisco, CA, USA, 2015. [Google Scholar]
  27. Colapinto, C.; Mejri, I. The relevance of goal programming for financial portfolio management: A bibliometric and systematic literature review. Ann. Oper. Res. 2025, 346, 917–943. [Google Scholar] [CrossRef]
  28. Ehrgott, M.; Ruzika, S. Improved ε-constraint method for multiobjective programming. J. Optim. Theory Appl. 2008, 138, 375–396. [Google Scholar] [CrossRef]
  29. Deb, K. Multi-Objective Optimisation Using Evolutionary Algorithms: An Introduction; Springer: London, UK, 2011; pp. 3–34. [Google Scholar]
  30. Tan, K.C.; Lee, T.H.; Khor, E.F. Evolutionary algorithms for multi-objective optimization: Performance assessments and comparisons. Artif. Intell. Rev. 2002, 17, 251–290. [Google Scholar] [CrossRef]
  31. Kim, M.; Shim, J.Y.; Lim, S.; Lee, H.; Kwon, S.C.; Hong, S.; Ryu, S. Reduction of greenhouse gas emissions by optimizing the textile dyeing process using digital twin technology. Fash. Text. 2024, 11, 17. [Google Scholar] [CrossRef]
  32. Hua, Y.; Liu, Q.; Hao, K.; Jin, Y. A survey of evolutionary algorithms for multi-objective optimization problems with irregular Pareto fronts. IEEE/CAA J. Autom. Sin. 2021, 8, 303–318. [Google Scholar] [CrossRef]
  33. Marler, R.T.; Arora, J.S. The weighted sum method for multi-objective optimization: New insights. Struct. Multidiscip. Optim. 2010, 41, 853–862. [Google Scholar] [CrossRef]
  34. Mavrotas, G. Effective implementation of the ε-constraint method in Multi-Objective mathematical programming problems. Appl. Math. Comput. 2009, 213, 455–465. [Google Scholar] [CrossRef]
  35. Triantaphyllou, E. Multi-Criteria Decision Making Methods: A Comparative Study; Springer: New York, NY, USA, 2013. [Google Scholar]
  36. Hosseinnezhad, M.; Nasiri, S.; Nutalapati, V.; Gharanjig, K.; Nunzi, J.M. Introduction thioindigo as new high stability unit in Ru-complex for DSSCs: Theoretical and photovoltaic investigation. Opt. Mater. 2024, 150, 115273. [Google Scholar] [CrossRef]
  37. Cao, J.X.; Wang, L.; Liu, T.G.; Wang, J.Y. A series of fluorescent dyes based on 4-phenylacetylene-1,8-naphthalimide: Synthesis, theoretical calculations, photophysical properties and application in two-color imaging and dynamic behavior monitoring of lipid droplets and lysosomes. Spectrochim. Acta Part A Mol. Biomol. Spectrosc. 2023, 303, 123207. [Google Scholar] [CrossRef]
  38. Mojan, B.; Noushijo, M.K.; Shanmugaraju, S. Amino-1,8-naphthalimide-based fluorescent chemosensors for Zn(II) ion. Tetrahedron Lett. 2022, 109, 154155. [Google Scholar] [CrossRef]
  39. Yi, L.; Xi, Z. Thiolysis of NBD-based dyes for colorimetric and fluorescence detection of H2S and biothiols: Design and biological applications. Org. Biomol. Chem. 2017, 15, 3828–3839. [Google Scholar] [CrossRef]
  40. Park, H.; Kim, J.C. Optimization of hybrid powertrains: Enhancing fuel efficiency through advanced engineering strategies. Int. J. Automot. Eng. 2024, 5, 28–30. [Google Scholar]
  41. Chauhan, R. Scanning prevalent technologies to promote scalable devising of DSSCs: An emphasis on dye component precisely with a shift to ambient algal dyes. Inorg. Chem. Commun. 2022, 139, 109368. [Google Scholar] [CrossRef]
  42. Yahya, M.; Bouziani, A.; Oaak, C.; Seferoglu, Z.; Sillanpaa, M. Organic/metal-organic photosensitizers for dye-sensitized solar cells (DSSC): Recent developments, new trends, and future perceptions. Dyes Pigments 2021, 192, 109227. [Google Scholar] [CrossRef]
  43. Meric, N.; Isik, U.; Dauletbakov, A.; Zolotareva, D.; Zazybin, A.; Sever, M.S.; Okumus, V.; Binbay, N.E.; Binbay, V.; Kayan, C.; et al. Advanced-designed Ru(II) complexes containing phosphinite ligands derived from chiral amino alcohols: Electrochemical behavior, DFT calculations, and biological activity. J. Organomet. Chem. 2025, 1023, 123410. [Google Scholar] [CrossRef]
  44. Kerraj, S.; Salah, M.; Bellaouad, S.; Mohammed, M. Effects of chelate ligands containing NN, PN, and PP on the performance of half-sandwich ruthenium metal complexes as sensitizers in dye sensitized solar cells (DSSCs): Quantum chemical investigation. Polyhedron 2023, 230, 116190. [Google Scholar] [CrossRef]
  45. Hosseinnezhad, M.; Gharanjig, K.; Nasiri, S.; Fathi, M. Study of the presence of thioindigo in photosensitizers based on phenothiazine: Synthesis and photovoltaic evaluation in DSSCs. Synth. Met. 2025, 312, 117885. [Google Scholar] [CrossRef]
  46. De Sousa, S.; Ducasse, L.; Kauffmann, B.; Toupance, T.; Olivier, C. Functionalization of a Ruthenium–Diacetylide Organometallic Complex as a Next-Generation Push–Pull Chromophore. Chem. Eur. J. 2014, 20, 7017–7024. [Google Scholar] [CrossRef]
  47. Hosseinnezhad, M.; Moradian, S.; Gharanjig, K. Novel organic dyes based on thioindigo for dye-sensitized solar cells. Dyes Pigments 2015, 123, 147–153. [Google Scholar] [CrossRef]
  48. Hosseinnezhad, M. Enhanced Performance of Dye-Sensitized Solar Cells Using Perovskite/DSSCs Tandem Design. J. Electron. Mater. 2019, 48, 5403–5408. [Google Scholar] [CrossRef]
  49. Verbitskiy, E.V.; Steparuk, A.S.; Zhilina, E.F.; Emets, V.V.; Grinberg, V.A.; Krivogina, E.V.; Kozyukhin, S.A.; Belova, E.V.; Lazarenko, P.I.; Rusinov, G.L.; et al. Pyrimidine-Based Push–Pull Systems with a New Anchoring Amide Group for Dye-Sensitized Solar Cells. Electron. Mater. 2021, 2, 142–153. [Google Scholar] [CrossRef]
Figure 1. Chemical structure of the organic dye.
Chemengineering 10 00072 g001
Figure 2. The network diagram of the FFSNN.bh and b0 are the biases for the hidden and the output layer. The sigmoid and linear signs below the input and the output layer indicate the tansig and linear trigger functions.
Chemengineering 10 00072 g002
Figure 3. Regression plots of the durability network. Panels (ad) show the training, validation, test and overall data results, respectively.
Chemengineering 10 00072 g003
Figure 4. Regression plots of the efficiency network. Panels (ad) show the training, validation, test and overall data results, respectively.
Chemengineering 10 00072 g004
Figure 5. Pareto front locus (red circles) found by MOGA. The temperature and anti-aggregation agent concentration for each point on the Pareto front are shown in parentheses. The blue points are the calculated durability and efficiency obtained by scanning the temperature range of [0,60] and [0,30].
Chemengineering 10 00072 g005
Figure 6. (A) J-V curve of optimized devices and (BD) changes in photovoltaic parameters over time.
Chemengineering 10 00072 g006
Table 1. Settings for optimization of the network parameters representing durability and efficiency as a function of temperature and anti-aggregation agent concentration.
SpecificationDetails
Input DataTemperature and anti-aggregation agent concentration (two variables)
Target DataDurability, Jsc, FF, Voc (four variables)
Training FunctionLevenberg–Marquardt backpropagation (trainlm)
Hidden Layer Sizeround(sqrt(dim(x) × dim(y))) = round( 2 × 4 ) = 3 (geometric mean calculated from input and output dimensions)
Preprocessingremove constant rows and mapminmax for both input and output
Performance FunctionMean squared error (MSE)
Plot Functionsplotperform, plottrainstate, ploterrhist, plotregression, plotfit
Data Division Functiondivideind (custom indices for training, validation, and testing)
Training Percentage65%
Validation Percentage15%
Testing Percentage20%
Training IndicesShuffled indices for training
Validation IndicesShuffled indices for training
Testing IndicesShuffled indices for training
NormalizationStandard normalization for performance parameter
Table 2. Settings for the multi-objective optimizations of the network.
SpecificationDetailsNotes
Objective FunctionDurability and efficiency
Optimization Functiongamultiobj
Population Size50
Pareto Fraction0.35Selected empirically based on preliminary analysis. According to MATLAB documentation, typical values for Pareto fraction range from 0.3 to 0.6.
Number of Objectives2
Lower Bounds[0 0]
Upper Bounds[60 30]
Crossover Probability0.8MATLAB default (crossover fraction)
Mutation RateAdaptive feasibleAdaptive feasible mutation
Elite Count (Conceptual)35% of population (for reference, not direct option)
Crowding Distance MethodCrowding distanceMATLAB default
Number of Generations per Run100Default value
Stall Generations100Convergence criteria
Function Tolerance0.000001Weighted average relative change
Constraint Tolerance0.001Maximum constraint violation
Number of Variables2
Number of Independent Runs10Multiple runs for statistical reliability
Table 3. Comparison of model performance between the original hold-out test set and LOOCV.
ParameterMetricOriginal Split TestLOOCV In15 Models
R0.99920.9078
DurabilityRMSE63.9239135.8661
MAE ± Standard Deviation60.1005 ± 26.6701111.9710 ± 79.6561
R0.97320.9147
EfficiencyRMSE0.12400.3103
MAE ± Standard Deviation0.1085 ± 0.07360.2270 ± 0.2190
Table 4. Three points belonging to the Pareto front in practice.
Point No.T (°C) 1AG (mM) 2PredictionGround Truth
DurabilityEfficiencyDurabilityEfficiency
115121243.915.9312506.0 ± 0.4
212121327.785.8314005.8 ± 0.4
312141381.665.7814205.8 ± 0.4
1 Sensitizing temperature (°C); 2 Concentration of anti-aggregation agent (mM).
Table 5. Optimal points belonging to the Pareto front in practice.
PhotosensitizerT (°C) 1AG (mM) 2Photovoltaic PropertiesDurability
JSC (mAcm−2)Voc (V)FF η (%)
115127.82 ± 0.20.66 ± 0.030.66 ± 1.63.4 ± 0.31650
3151210.29 ± 0.20.66 ± 0.030.65 ± 1.84.4 ± 0.31650
4151219.03 ± 0.30.65 ± 0.040.65 ± 1.98.0 ± 0.41700
1 Sensitizing temperature (°C); 2 Concentration of anti-aggregation agent (mM).
Disclaimer/Publisher’s Note: The statements, opinions and data contained in all publications are solely those of the individual author(s) and contributor(s) and not of MDPI and/or the editor(s). MDPI and/or the editor(s) disclaim responsibility for any injury to people or property resulting from any ideas, methods, instructions or products referred to in the content.