Article

Tailoring Ni/Beta Zeolite Catalysts for Efficient Dry Methane Reforming: A Study on Pretreatment and Reaction Conditions


by
Gema Gil-Muñoz
and
Juan Alcañiz-Monge
*
MCMA Group, Department of Inorganic Chemistry, Materials Institute (IUMA), Faculty of Sciences, University of Alicante, E-03080 Alicante, Spain
*
Author to whom correspondence should be addressed.
ChemEngineering 2026, 10(4), 46; https://doi.org/10.3390/chemengineering10040046
Submission received: 23 January 2026 / Revised: 4 March 2026 / Accepted: 1 April 2026 / Published: 3 April 2026

Abstract

This study evaluates the performance of Ni-La2O3/Beta catalysts for the dry reforming of methane, focusing on the effects of nickel loading, catalyst pretreatment, reaction temperature, and gas composition and flow rate. Catalysts with nickel contents ranging from 3 to 20 percent by weight were prepared via wet impregnation and characterized by gas adsorption, X-ray diffraction, temperature-programmed reduction with hydrogen, thermogravimetric analysis, and transmission electron microscopy. The results indicate that nickel gradually incorporates into the zeolitic support, preferentially occupying the most stable sites. Direct reduction of the impregnated catalyst precursors—omitting the calcination step—yielded materials with slightly higher methane conversion (ca. 3.5%) and enhanced stability. This improved performance is attributed to the reduction occurring during the thermal decomposition of supported nickel nitrate, which promotes finer nickel dispersion and stronger interaction with the La2O3-modified Beta zeolite.

1. Introduction

Dry reforming of methane (DRM) is a catalytic process that converts CO2 and CH4 into H2 and CO, garnering significant interest for its potential in environmental sustainability and energy production [1,2,3,4]. Among the various catalytic metals, nickel stands out due to its high activity and relatively low cost compared to noble metals [3,4,5]. However, Ni-based catalysts face challenges such as nanoparticle sintering and carbon deposition during DRM, prompting extensive research into synthetic methods to mitigate these issues [4,5,6,7,8]. The most widely investigated approach involves dispersing the metal phase on a support—a common strategy in heterogeneous catalysis. Typically, nickel catalysts are prepared by impregnating a support with a nickel precursor. A wide variety of supports—used individually or in combination—have been employed for this purpose, including alumina (Al2O3) [9], zirconia (ZrO2) [10,11], silica (SiO2) [12], magnesium oxide (MgO) [13], calcium oxide (CaO) [11], lanthanum oxide (La2O3) [14], and ceria (CeO2) [12,15]. Zeolites also represent a highly suitable option, with numerous studies [16,17,18,19,20] utilizing different types of zeolites as Ni supports for the DRM reaction. Among these, ZSM-5 (MFI framework type) has been one of the most extensively studied [16,21], though other zeolites such as zeolite A (LTA) [22], zeolite X (FAU) [22], zeolite Y (FAU) [22,23], and β-zeolite (BEA) [24] have also been investigated. Specifically, high-silica zeolites such as ZSM-5 or β-zeolite are well-known for their high affinity for organic molecules like CH4 and their robust thermal stability under high-temperature conditions.
Beyond the influence of the support material, nickel loading and DRM temperature emerge as two of the most extensively studied variables in catalyst synthesis and optimization. To ensure economic viability, nickel loading must be minimized while preserving sufficiently high catalytic activity and conversion rates. A similar principle applies to the reaction temperature. Consequently, the most commonly optimized ranges in DRM studies are nickel loadings of 5–10 wt.% and operating temperatures around 700 °C, as they balance cost efficiency with catalytic performance [25,26,27]. However, coke deposition and catalyst deactivation critically influence these optimization parameters, leading to reported variations in optimal loading and reaction temperature conditions. This aspect constrains the operable temperature range. Thermodynamic equilibrium analysis indicates that operating within 700–800 °C suppresses methane cracking and CO disproportionation reactions, thereby minimizing carbonaceous deposit formation [28]. Regarding Ni loading, Luengnaruemitchai et al. [22] demonstrated this trade-off by testing Ni/zeolite catalysts with loadings of 3, 5, and 7 wt.%. While the 7 wt.% Ni catalyst exhibited optimal DRM activity at 700 °C, it also showed higher carbon deposition. Similarly, Chang et al. [16] analyzed Ni/ZSM5 catalysts with loadings ranging from 1 to 10 wt.%, observing a significant increase in conversions at 700 °C (from 25% for 1 wt.% to 78% for 5 wt.%). A further increase to 10 wt.% improved conversions marginally (84%), but at the expense of higher coke deposition. In contrast, Bacariza et al. [19] reported optimal performance with 15 wt.% Ni over USY zeolite. For hydrothermally synthesized encapsulated Ni-based catalysts, the best results were achieved at 7 wt.% Ni loading [29].
Another key aspect is the experimental methodology used in catalyst preparation. The synthesis protocol consists of two main stages: (1) calcination, followed by (2) reduction. Calcination is typically conducted under air flow at approximately 550 °C for 6 h, applied to samples prepared by wetness impregnation [27,30], hydrothermal synthesis [29], or solid-state grinding methods [31]. However, a review of the literature shows no consensus on this temperature, as multiple studies report calcination at different values—such as 400 °C or 900 °C—during this stage. Shittu et al. [32] reported the calcination of Ni functionalized with oxalate ligands supported on zeolite A under N2 flow at 400 °C. Other studies describe calcination in air at varying temperatures for wet impregnation-derived samples: 500 °C [19,22], 600 °C [25], 700 °C [26], 800 °C [33], and 900 °C [34]. For Ni-embedded zeolite samples prepared via solid-state grinding, calcination was performed at 600 °C [35]. A similar trend is observed for the reduction step, which commonly employs similar conditions, typically performed at ~700 °C for 1 h under H2 flow (pure or diluted in N2 or Ar). However, substantial discrepancies exist in reported methodologies, with variations in temperature (500–900 °C), duration (1–4 h), and H2 concentration (5–100%). For instance, Bacariza et al. reduced samples at 470 °C for 2 h under 5% H2/Ar [19], while Coelho et al. used 500 °C for 1 h under pure H2 [27]. Other studies applied 600 °C for 1 h under pure H2 [22,25] or 10% H2 for 2 h [30]. Higher-temperature reductions include 700 °C for 3 h (pure H2) [29], 50% H2 for 4 h [33], and 10% H2 for 1 h [29]. Contrasting reports feature 750 °C at 5% H2 for 1–2 h [26,35], 800 °C under 20% H2 for 1 h [32], and even 900 °C with 10% H2 for 0.5 h [34]. The significant variability in reported experimental conditions (temperature: 400–900 °C; duration: 0.5–6 h; H2 concentration: 5–100%) demonstrates the absence of established optimization criteria for calcination and reduction parameters in catalytic material synthesis.
In this regard, few studies have analyzed this aspect of catalyst pretreatment prior to the reaction. Notably, the work by Juan-Juan et al. [36] examined the effect of calcination treatment (or its absence) before the reduction step. For this purpose, a Ni/Al2O3 catalyst was subjected to two different treatments: (1) a conventional calcination procedure at 500 or 700 °C for 12 h, followed by reduction in H2 flow at 500 °C for 2 h; and (2) direct reduction in H2 flow at 500 or 700 °C for 2 h. The results indicated that the catalytic activity was not affected by the pretreatment; however, a significant effect on the amount of deposited coke was observed, likely due to the influence of the pretreatment on the size and structure of the nickel particles. The aforementioned results were obtained using Al2O3 as the support; however, studies employing zeolites as supports remain scarce. Notably, Frontera et al. [37] extended the methodology of Juan-Juan et al. to a Ni/zeolite catalyst synthesized via impregnation. By employing solely a reductive pretreatment under H2 flow at 400 °C for 1 h, they achieved a highly active catalyst with significantly reduced carbon deposition.
Previous studies have extensively analyzed the influence of various zeolite support frameworks—including ZSM-5, β-zeolite, MCM-41, and Type A—on catalytic performance and deactivation in DRM. Among these, La2O3-modified β-zeolite emerged as the most effective Ni support [38] due to its specific pore architecture and the synergistic interaction between the metal and the modified support. However, as mentioned above, a critical review of the literature reveals significant inconsistencies in pretreatment protocols across studies. This lack of standardized methodology complicates direct comparisons of catalytic performance. To address this gap, the present work systematically evaluates the effects of different pretreatments on the catalytic behavior of an Ni-La2O3/β-zeolite catalyst in DRM. The work further examines the combined influence of nickel loading, reaction temperature, and gas composition and flow on process efficiency and catalyst deactivation behavior.

2. Materials and Methods

2.1. Catalyst Preparation

The primary support employed in this study comprised a commercially available β-zeolite (BEA) (Si/Al ratio 12.5) procured from Alfa Aesar (Thermo Fisher Scientific; Waltham, MA, USA) in the ammonium form. This was subsequently calcined at 550 °C under air for 2 h to convert it into its protonated form, designated by the initial letter: B (Beta).
A series of catalysts with different nickel loadings were synthesized via the wet impregnation method, employing Ni(NO3)2·6H2O (Merck; Darmstadt, Germany) as the metal precursor and the aforementioned Β-zeolite as support. One gram of zeolite support was mixed and stirred with an appropriate volume of nickel nitrate solution to achieve nominal nickel loadings ranging from 3 to 20 wt.% after reduction, along with lanthanum nitrate to attain a lanthanum oxide (La2O3) content of 20 wt.% post-reduction. Elemental analysis of the supported reduced catalysts was performed by inductively coupled plasma-atomic emission spectroscopy (ICP-AES) following dissolution of the zeolites in an HF solution (Table S1, Supplementary Material). Following impregnation, all catalyst samples were dried overnight at 100 °C. To systematically evaluate the effect of the thermal history on catalyst performance, four distinct pretreatment protocols were applied prior to the catalytic tests. To ensure clarity, these protocols are defined as follows:
  • Calcination + Isothermal Reduction: The sample was first calcined in air (at 600 °C for 3 h or 800 °C for 1 h). Subsequently, it was heated to the target reduction temperature (600 or 800 °C) under an inert He atmosphere. Once the target temperature was reached, the gas flow was switched to 10% H2/Ar for an isothermal reduction of 1 h.
  • Calcination + Temperature-Programmed Reduction (TPR): The sample was pre-calcined in air (as in protocol 1). Then, it was heated from room temperature to the target temperature (600 or 800 °C at 20 °C/min) directly under a reducing flow of 10% H2/Ar, followed by a 1 h isothermal hold.
  • Isothermal Reduction (Non-calcined): The as-synthesized (non-calcined) sample was heated to the target temperature under an inert He atmosphere. Upon reaching the target temperature, the flow was switched to 10% H2/Ar for a 1 h isothermal reduction.
  • Direct Reduction (Non-calcined): The as-synthesized (non-calcined) sample was subjected to a continuous reducing environment. It was heated from room temperature to the target temperature (600 or 800 °C at 20 °C/min) under a 10% H2/Ar flow, followed by a 1 h hold. This exposes the catalyst to H2 during the entire heating ramp without any prior calcination step.”
The precise nomenclature of the samples and their corresponding pretreatment conditions are comprehensively summarized in Table 1.
The catalyst labeling follows a sequential notation system: Ni[x]LaB[y][z]-[W]
[x]: Nickel loading in wt.% (e.g., 3, 5, 10).
LaB: Denotes the La2O3-modified β-zeolite support.
[y]: Reduction temperature (6 for 600 °C, 8 for 800 °C).
[z]: Reduction mode (I for Isothermal reduction, D for Direct reduction from room temperature).
[W]: Initial pretreatment step. C6 or C8 indicates air calcination at 600 °C or 800 °C, respectively. He6 or He8 indicates an inert pre-heat treatment in Helium for non-calcined samples. If the non-calcined sample was subjected to direct reduction without any prior step, this suffix is omitted.
For example, Ni10LaB6I-C8 denotes a 10 wt.% Ni catalyst calcined at 800 °C, heated under inert gas, and then isothermally reduced at 600 °C. Conversely, Ni10LaB8D refers to the non-calcined catalyst subjected directly to a hydrogen reduction ramp from room temperature up to 800 °C.

2.2. Catalyst Characterization

The analysis of the porous texture of all samples was conducted via N2 adsorption at −196 °C and CO2 adsorption at 0 °C. Adsorption isotherms were measured using two instruments: a 3FLEX (Micromeritics Instrument Corporation, Norcross, GA, USA) and an Autosorb-6 (Anton Paar, Boynton Beach, FL, USA), respectively. Prior to the adsorption test, the samples were degassed at 250 °C under a vacuum (1 Pa) for a period of 4 h. The specific pore volumes were determined in accordance with the following procedure [39]: (i) the volume of narrow micropores (pore size < 0.7 nm) by applying the Dubinin-Radushkevich (DR) equation [40] to the CO2 adsorption data at relative pressures < 0.015; (ii) the total micropore volume (pore size < 2 nm), which includes the volume of the narrow micropores and supermicropores, by applying the DR equation to the N2 adsorption data at relative pressures < 0.14, and (iii) the volume and the distribution of the mesopore sizes, by applying the Barrett-Joyner-Halenda (BJH) method [41]. The specific surface area was determined using the Brunauer–Emmett–Teller (BET) equation [42].
The characterization of the calcined, reduced, and spent catalysts was carried out using various techniques, including powder X-ray diffraction (PXRD), transmission electron microscopy (TEM), temperature programmed reduction with H2 (H2-TPR). For the H2-TPR analyses, 30 mg of the sample was loaded into a quartz reactor and subjected to a reducing gas flow of 30 cm3/min of H2 (10% vol. diluted in Ar). The temperature was ramped from room temperature to 900 °C at a heating rate of 10 °C/min using a Micromeritics Pulse Chemisorb 2705 system. Hydrogen consumption was monitored in real-time using a thermal conductivity detector (TCD).
The crystalline structure was analyzed by powder X-ray diffraction (Panalytical Empyrean diffractometer (Malvern Panalytical, Almelo, The Netherlands) operating with Cu Kα radiation), and TEM (JEOL JEM-2010, 300 keV, JEOL Ltd., Tokyo, Japan) was used to identify the presence of nickel nanoparticles and carbon nanotubes. The range between 5° and 70° (2θ) was examined at a scanning speed of 0.025° every 3 s, with a wavelength of λ = 0.15418 nm (CuKα). To ensure the representativeness of the TEM observations, particularly regarding the formation of carbon nanotubes (CNTs), a standard sampling approach was followed. For each spent catalyst, 10 different copper grids were prepared and analyzed. Multiple regions within each grid were comprehensively surveyed to verify that the observed carbon nanostructures and their distribution were representative of the bulk sample.
Following the reduction pretreatment of the impregnated and calcined samples, thermogravimetric and differential thermal analysis (TG-DTA) was performed using a simultaneous thermal analyzer (SDT Q600, TA Instruments, New Castle, DE, USA) coupled to a mass spectrometer (Balzers QMS 100, Balzers AG, Balzers, Liechtenstein). For the experiments, approximately 15 mg of sample were subjected to heat treatment at a heating rate of 20 °C/min up to 900 °C under a 40 cm3/min flow of H2 (10 vol% in Ar). Additional experiments under identical conditions, but using He or air atmospheres, were conducted for selected samples.
The dispersion of metallic nickel on the reduced Ni10LaB8D-C6 and Ni10LaB8D catalysts was determined by H2 chemisorption using a volumetric Autosorb iQ adsorption system (Quantachrome Instruments, Boynton Beach, FL, USA) [43,44]. Approximately 100 mg of sample were subjected to an in situ pretreatment, which consisted of degassing at 300 °C under Ar, followed by reduction at 800 °C under a 5% H2/Ar flow. After cooling to 40 °C, a H2 isotherm was recorded between 100 and 500 Torr. The corresponding isotherms are provided in Figure S2 of the Supplementary Material.

2.3. Catalytic Test

The catalysts were tested in a fixed-bed reactor housed within a furnace, which was connected on-line to a gas chromatograph (Agilent 8860 GC System, Agilent Technologies, Santa Clara, CA, USA) equipped with a thermal conductivity detector and a Porapak Q column. Two types of experiments were performed: isothermal dry reforming of methane and temperature-programmed DRM. For the isothermal tests, a reaction temperature of 700 °C was selected for most experiments. Additionally, for the catalyst Ni10LaB8D-C6, several experiments were conducted over a broader temperature range of 600 to 850 °C. Temperature-programmed reaction experiments were performed by heating the catalyst from 330 to 850 °C at a constant rate of 8 K/min. For the catalytic performance tests, an appropriate amount of the fresh catalyst (sieved to a 100–200 µm fraction) was loaded so that, after reduction, a final mass of 80 mg was obtained. The sample was loaded into a U-shaped tubular quartz reactor featuring an internal diameter of 14 mm, a length of 200 mm per arm, and a wall thickness of 2 mm. To ensure a homogeneous gas flow distribution and prevent channeling across the catalyst bed, the powder was uniformly deposited onto a porous quartz frit integrated within the reactor. This configuration provided optimal gas–solid contact despite the relatively low height of the catalytic bed. In all experiments, the sample was placed into the reactor and heated following the pre-selected calcination/reduction program. Then, the atmosphere was changed to He and the sample was cooled/heated to the selected reaction temperature. The reduced sample was then exposed to the reaction gas mixture (40 cm3/min, CH4/CO2/He = 1/1/2 vol), and the reactor effluent was analyzed by gas chromatography (GC). Any water produced during the reaction was condensed before introducing the reactants and products into the chromatograph. The experiments were carried out at a mass hourly space velocity of 58.000 mL/g·h. The conversion percentages of CO2 and CH4 were calculated from the chromatogram using the following equations:
X C O 2 ( % ) =   F C O 2   i n i m o l F C O 2   r e a m o l F C O 2   i n i m o l · 100   X C H 4 ( % ) =   F C H 4   i n i m o l F C H 4   r e a c m o l F C H 4   i n i m o l · 100
F C O 2   i n i m o l   and F C H 4   i n i m o l   are the inlet molar flows of CO2 and CH4 of the mixture passing through the bypass, corresponding to the initial concentration, while F C O 2   r e a m o l and F C H 4   r e a m o l   are the molar flows of the same after passing through the reactor, corresponding to the final concentration, respectively.
In the dry reforming of methane (DRM), the reaction yields a net increase in gas volume. To accurately calculate conversions and yields without artifacts from volume expansion, a rigorous mass balance was applied. Instead of introducing N2 as an internal standard—which exhibited peak overlapping with CO and CH4 in the GC under these high-concentration conditions—Helium was utilized as an internal reference (FHe in = FHe out). This was coupled with the online measurement of the total volumetric outlet flow.
The exact molar flow of each species i ( F i   r e a m o l ) was calculated using their respective GC areas (Ai) and pre-calibrated relative response factors (Ri), linked by a global proportionality constant (K): F i   r e a m o l = K ( A i r e a R i )
The constant K for each injection was experimentally determined by isolating it from the total outlet molar flow ( F r e a m o l ) balance: K = F r e a m o l n H e i n i i H e ( A i r e a c R i )
By defining K, the true molar flow rates of all effluent gases were obtained, inherently correcting for the reaction-induced volume expansion prior to the calculation of reactant conversions. Further details on how this calculation was performed can be found in the Supplementary Material.
For post-reaction samples, the designation “DRM” is appended to the catalyst name. The amount of carbon deposited during the reaction was estimated by the mass difference of the entire reactor system before and after the reaction. This measurement has an uncertainty strictly limited to the precision of the analytical balance employed (±0.0001 g) and includes a correction for the catalyst mass loss during reduction, determined from TG-DTA reduction profiles. It should be noted that the calculated carbon deposition is primarily considered an indicative parameter to compare the gasification capacity among the different catalyst systems, rather than an exclusive deactivation factor. Traditional Temperature-Programmed Oxidation (TPO/TGA) in air was discarded for these specific spent catalysts due to their relatively low coke content. During a TG-TPO experiment, the accurate quantification of mass loss due to carbon gasification is severely hindered by simultaneous thermal events: the mass loss from the decarbonation of lanthanum species (e.g., La2O2CO3) and the mass gain from the oxidation of metallic nickel (Ni0→NiO). To justify the chosen methodology for carbon quantification, a thermogravimetric (TG) analysis of a representative spent catalyst was performed (Supplementary Information, Figure S1). Consequently, the mass difference approach provides a more reliable estimation of the overall carbon formation for this system.

3. Results and Discussion

3.1. Characterization of Catalyst

3.1.1. Pore Texture

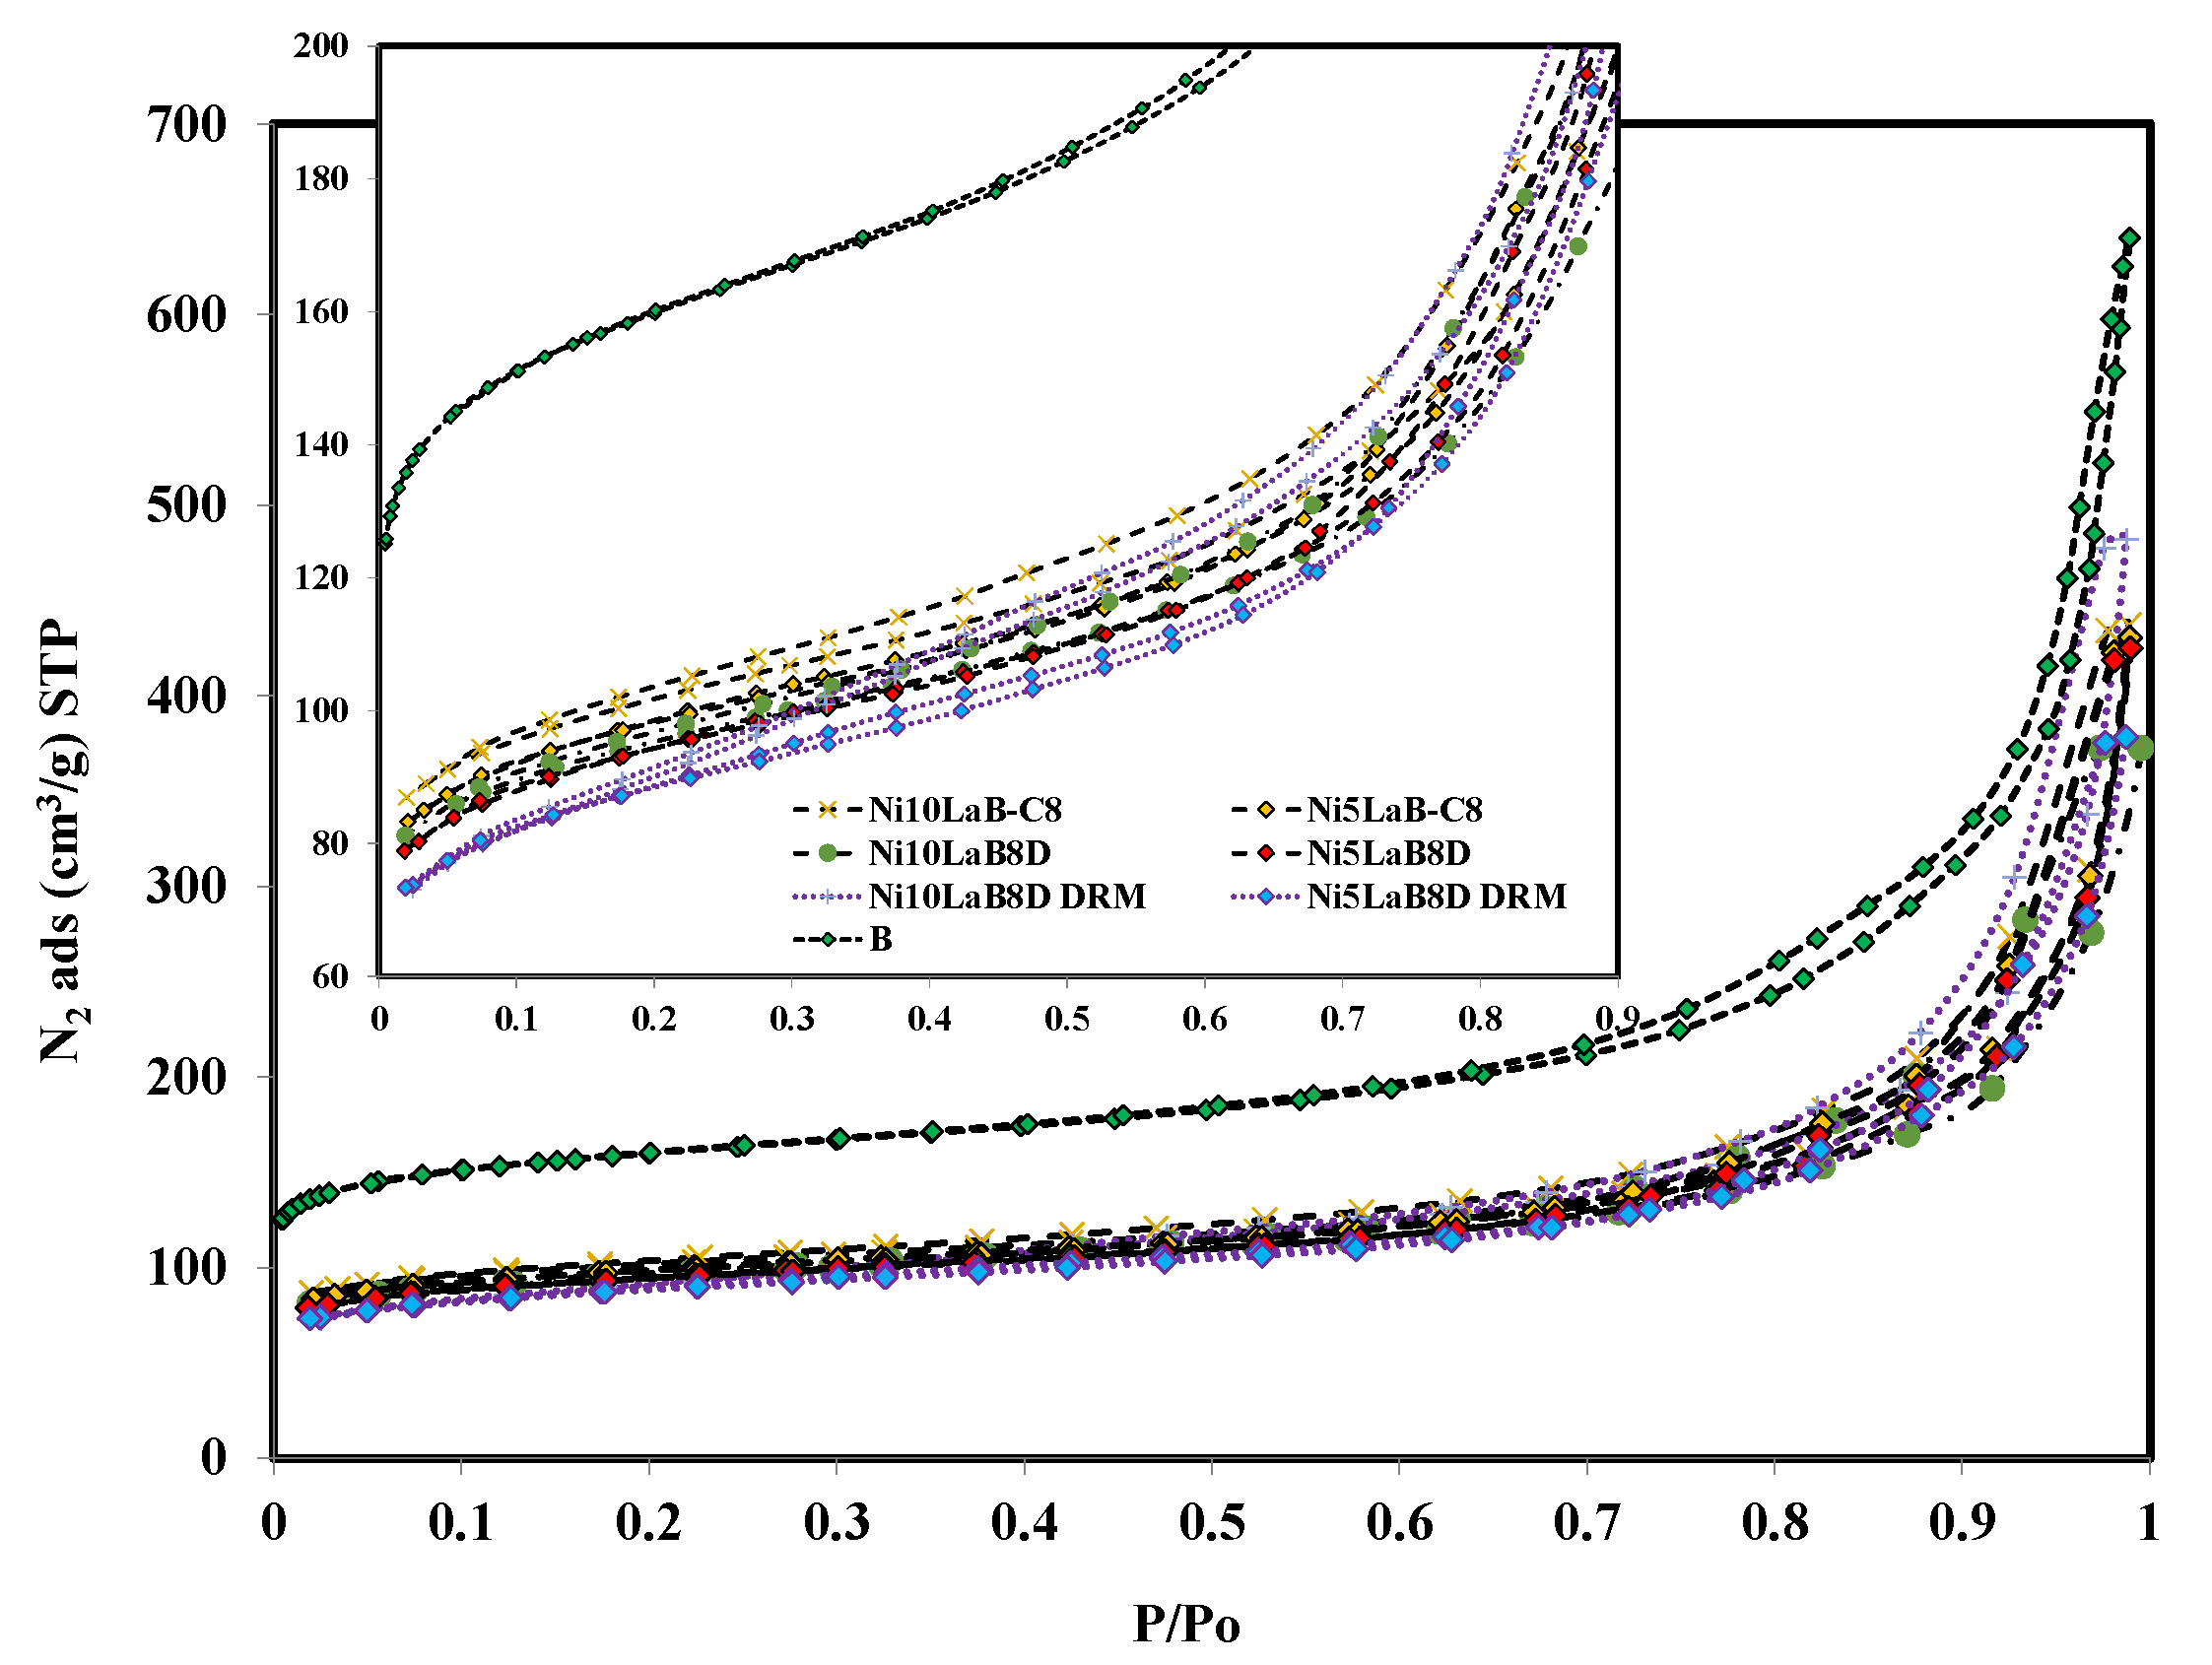
Figure 1 presents the N2 adsorption isotherms of the samples Ni10LaB and Ni5LaB calcined at 800 °C, directly reduced at 800 °C and after DRM reaction at 700 °C for 96 h. Table 2 contains the porous texture characterization results obtained from N2 and CO2 adsorption isotherms.
Regarding the pore texture of the β-zeolite support, it exhibits significant microporosity, as evidenced by the high BET-specific surface area and the micropore volume derived from N2 adsorption (VN2), which provides information across the full micropore range. The comparable micropore volumes obtained from N2 (VN2) and CO2 (VCO2) adsorption suggest a predominant micropore size of approximately 1 nm [39]. Additionally, the Β-zeolite support demonstrates a substantial contribution from mesoporosity and macroporosity. As depicted in Figure 1, the N2 adsorption isotherm shows a uniform decrease across the entire relative pressure range following impregnation and calcination, indicating a proportional reduction in porosity across all scales (micro-, meso-, and macroporosity). This reduction is consistent with the mass loading of supported oxides (~30 wt.%), which, while non-porous, are included in the normalization of specific porosity volumes per unit of sample mass. This interpretation is further supported by the close agreement between experimental and theoretical values (see Table 2, values in parentheses). Remarkably, the pore texture demonstrates exceptional stability, showing only negligible variations in porosity distribution following either (i) higher calcination temperatures, (ii) prolonged exposure to reducing and dry reforming conditions (96 h DRM treatment), or (iii) increased Ni content from 5 to 10 wt.% (Table 2). The aforementioned results demonstrate that the varying calcination and reduction pretreatment protocols produce catalysts with an analogous porous texture.

3.1.2. Crystalline Phases Identification by Powder X-Ray Diffraction

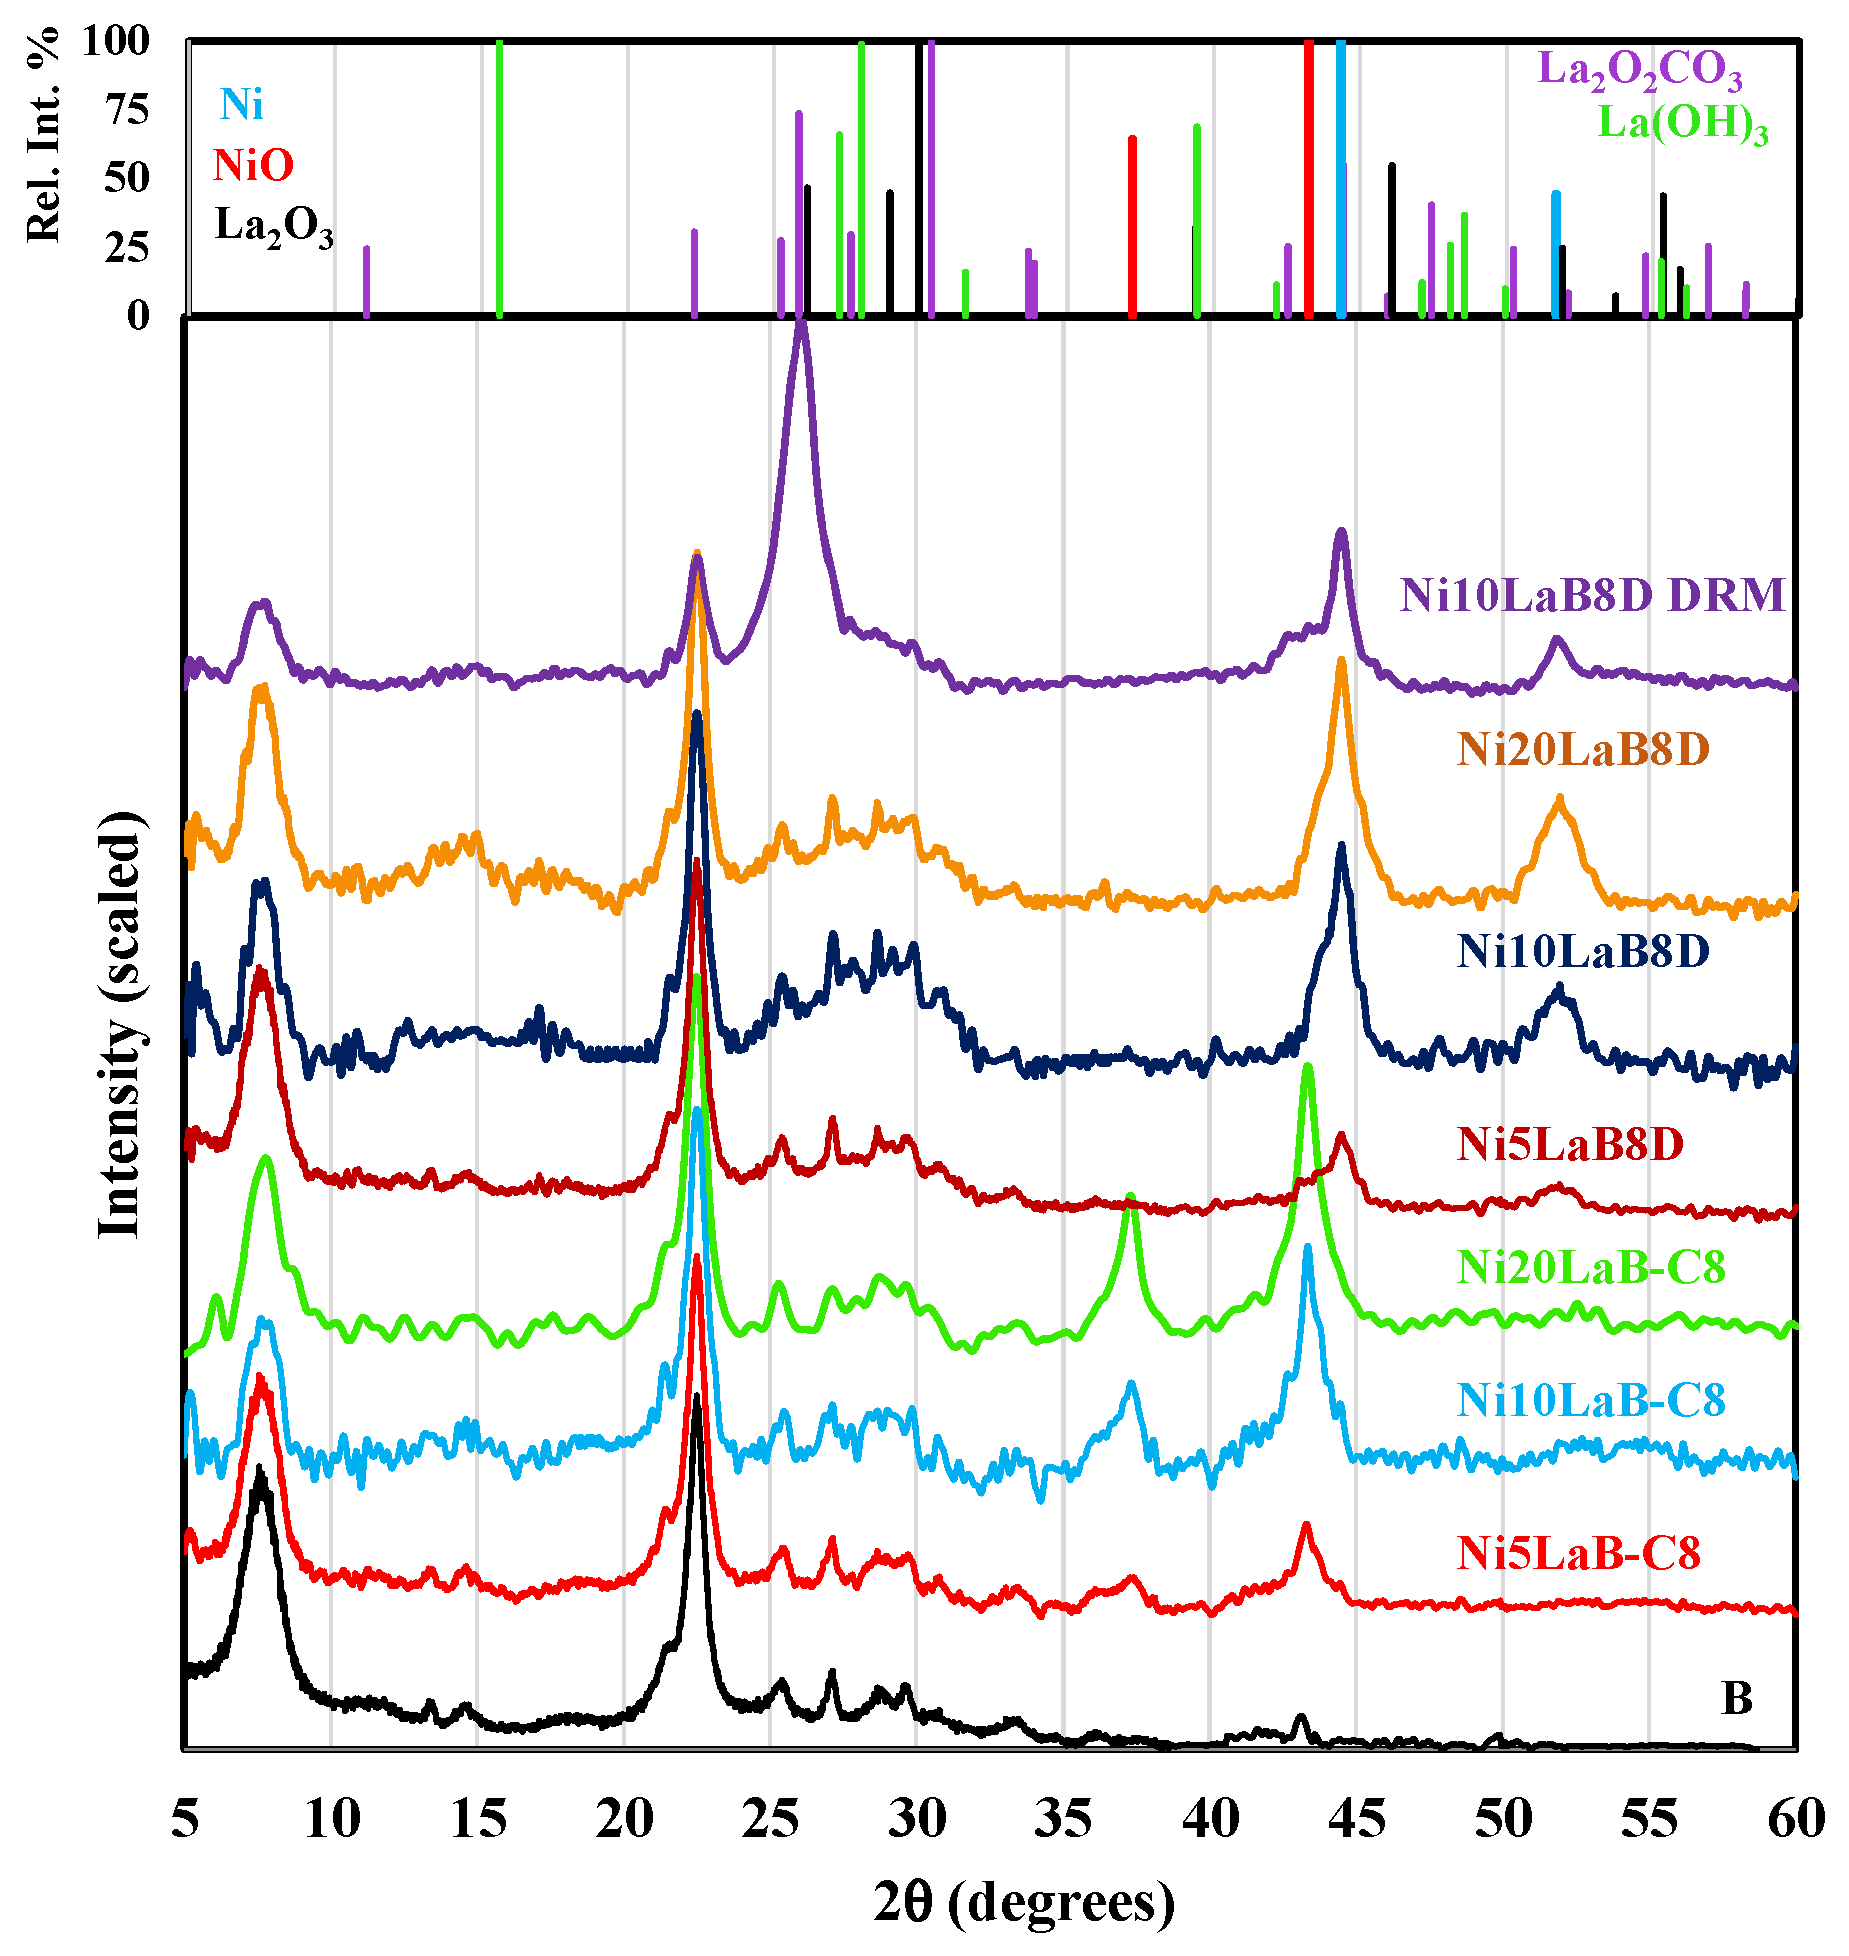
The crystalline structure of the synthesized catalysts was analyzed by PXRD to verify the successful incorporation of Ni into the Β support. Figure 2 presents the PXRD patterns of the NiLaB catalyst with varying Ni contents (5, 10, and 20 wt.%; with a fixed 20 wt.% La2O3) for both the calcined (800 °C) and directly reduced (800 °C) samples. Additionally, the PXRD pattern of the Ni10LaB8D catalyst after the DRM reaction at 700 °C (96 h) is shown.
First, the high structural stability of the β-zeolite is evident from the persistence of its characteristic diffraction peaks (~7.6° and 22.5°) [45] throughout all stages of catalyst synthesis and reaction. Notably, after impregnation and calcination, the PXRD patterns confirm the presence of the cubic NiO phase (JCPDS-ICDD 75-0197), with characteristic peaks at 37.3° (111) and 43.4° (200). In contrast, no diffraction peaks corresponding to the hexagonal La2O3 phase (JCPDS-ICDD 02-0688/05-0622)—expected at 26.7° (100), 29.6° (002), 30.3° (101), 39.8° (102), 46.8° (110), and 52.2° (103)—were detected in any sample. Despite the relatively high lanthanum loading (up to 20 wt.%), characteristic diffraction peaks for bulk, crystalline La2O3 were not clearly detected. This absence suggests that the lanthanum species are either highly dispersed on the support (with domain sizes below the XRD detection limit of typically ~3–5 nm) or exist in a predominantly amorphous or poorly crystalline state due to strong interactions with the silicate support. While an unidentified broad signal was observed, an unequivocal assignment remains elusive. The formation of lanthanum silicates (such as La2SiO5 or La2Si2O7) was considered due to a slight decrease in the β-zeolite main peaks; however, the absence of secondary characteristic peaks for these silicates in the 2θ = 18–20° range prevents a definitive confirmation. Therefore, considering the limitations of PXRD regarding peak overlap and detection thresholds, we cautiously conclude that the La promoter is present as highly dispersed, poorly crystalline, or amorphous species rather than bulk La2O3 crystallites. A comparative analysis of the NiO diffraction peaks in catalysts with varying Ni loadings reveals an increase in peak intensity proportional to the Ni content, indicating enhanced crystallinity at higher Ni concentrations.
From a practical perspective, the PXRD analysis of the reduced samples is particularly relevant for evaluating their catalytic potential. The analysis of the reduced catalysts confirmed the expected transformation, with NiO phases fully reduced to metallic Ni (JCPDS-ICDD 4-0850), evidenced by the appearance of characteristic peaks at 44.6° (111) and 51.9° (200) on all supports. Furthermore, the diffraction peak intensities of metallic Ni scale with the initial Ni loading, with the most pronounced difference observed between the 5 wt.% and 10 wt.% Ni catalysts. Notably, increasing the Ni content to 20 wt.% yields comparable peak intensities to the 10 wt.% sample. This plateau effect may reflect either limitations in XRD detection sensitivity or constraints on Ni dispersion at higher loadings.
Post-reaction characterization after 96 h of DRM revealed the remarkable stability of the metallic Ni phase, evidenced by persistent diffraction peaks. Additionally, a broad and intense diffraction feature emerged at 2θ = 25–28°. While this peak is tentatively attributed to the formation of La2O2CO3 during extended operation—a known characteristic of La-promoted DRM catalysts [46]—the lack of long-range crystallinity of the highly dispersed precursor on the microporous silicate support prevents a conclusive match with standard crystalline databases. Alternative phases, such as lanthanum silicates, were considered but ruled out due to the absence of secondary characteristic peaks.
Finally, it should be noted that the various calcination and reduction pretreatments yield final reduced samples with no appreciable differences observable by PXRD. This suggests that the protocols do not significantly alter the dispersion of supported metallic Ni, or that PXRD lacks the sensitivity to resolve the subtle structural differences introduced.

3.1.3. Temperature Programmed Reduction Analysis: H2-TPR and TG-DTA Experiments

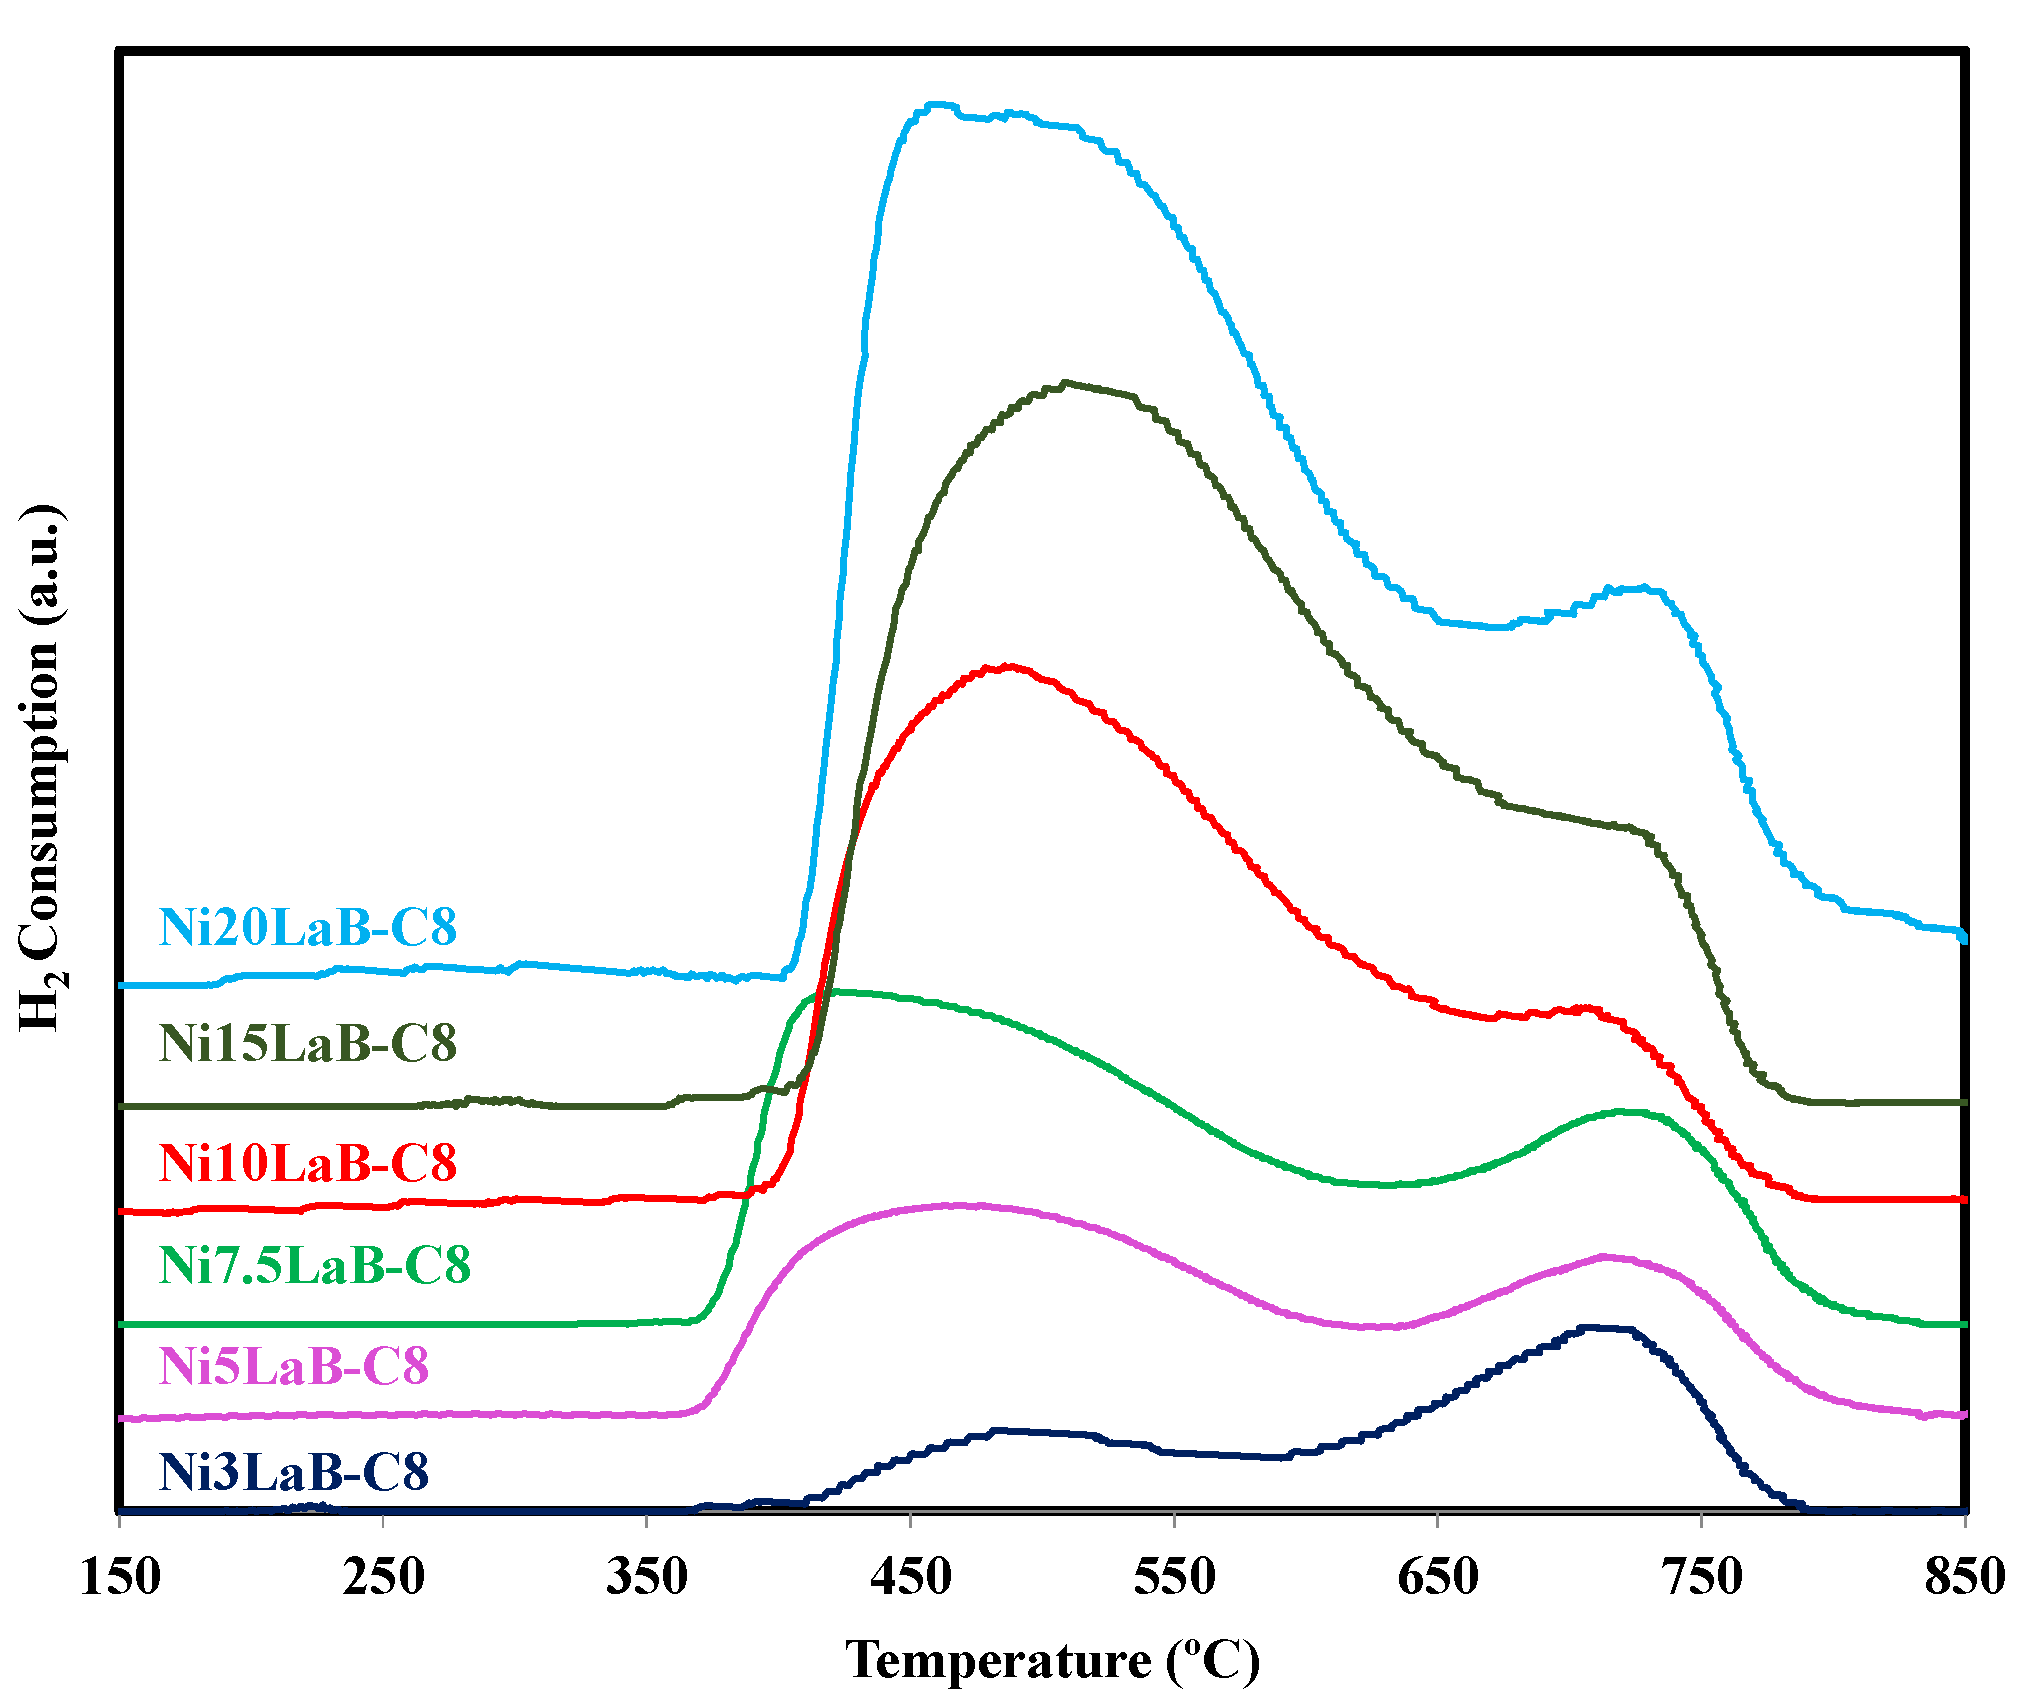
For both the impregnated and calcined nickel-containing samples, a hydrogen reduction step is essential to convert NiO into supported Ni nanoparticles active for the dry reforming of methane reaction. The reduction behavior of NiO can be analyzed by H2-TPR. Figure 3 displays the H2-TPR profiles specifically for the 800–calcined samples.
As evidenced by the H2-TPR profiles (Figure 3), all calcined NiLaB catalysts exhibit two well-defined reduction peaks spanning significant temperature ranges (approximately 350–630 °C and 630–780 °C). Notably, these peaks display distinct intensities, as quantified by their integrated areas, which correlate directly with the Ni loading. Quantitative analysis (Table 3) reveals a linear increase in the low-temperature peak area with higher Ni content, whereas the high-temperature peak area shows only a marginal enhancement.
H2-TPR analysis indicates multiple NiO reduction regimes, each characteristic of distinct Ni species environments [47,48,49,50]: surface-localized NiO (reducing below 500 °C), pore-confined NiO (500–650 °C), and Ni-support mixed phases formed during calcination (above 650 °C). Based on these observations, the H2-TPR results indicate that a specific fraction of the supported NiO is preferentially associated with active surface sites on the β-support, where the interaction is most pronounced. This strong interaction is consistent with a strong metal-support interaction (SMSI) [51]. The higher intensity of the high-temperature reduction peak at lower Ni loadings suggests that these specific sites are occupied first. Following the saturation of these preferential sites, additional Ni species deposit as NiO on external surfaces and within the pore structure. This interpretation is supported by the linear increase in the low-temperature reduction peak area with increasing Ni loading. It is highly probable that these specific sites correspond to the H+ protons within the zeolite β-framework, which are exchangeable. The theoretical number of these exchangeable protons is 1.28 mmol per gram of pure β-zeolite [52]. To determine the actual exchange capacity of the synthesized catalysts, the mass basis must account for the specific zeolite fraction remaining after the addition of the other components. Since the catalysts contain a constant 20 wt.% of La2O3 and varying amounts of Ni (from 3 to 20 wt.%), the mass of zeolite constitutes the balance (e.g., exactly 0.70 g of zeolite per gram of total catalyst for the reference Ni10LaB sample). Furthermore, because the ionic charge of Ni2+ is double that of H+, one Ni2+ ion replaces two protons. Thus, the maximum theoretical ion exchange capacity corresponds to 0.64 mmol of Ni2+ per gram of pure zeolite, which translated to approximately 0.45 mmol of Ni2+ per gram of catalyst when normalized to the total catalyst mass (using the ~70 wt.% zeolite fraction as an average representative basis) (Table S2 contains the capacity for all catalyst). For comparison, the actual total amounts of Ni impregnated, expressed per gram of final catalyst, were: 0.32 mmol/g (Ni3LaB), 0.53 mmol/g (Ni5LaB), 0.80 mmol/g (Ni7.5LaB), 1.07 mmol/g (Ni10LaB), 1.63 mmol/g (Ni15LaB), and 2.20 mmol/g (Ni20LaB). These calculated impregnation values align well with the trends observed in the H2-TPR profiles, supporting the hypothesis that initial Ni deposition occurs via ion exchange until the capacity is approached, after which different Ni species form.
Nevertheless, it is important to note that this work analyzes two types of catalysts: those that were calcined and subsequently reduced, and those that were directly reduced. The H2-TPR analysis is inherently limited by the detection principle of the technique, which monitors changes in the thermal conductivity of the effluent gas stream relative to an Ar reference. For the calcined samples, the signal variation directly correlates with hydrogen consumption during the reduction of NiO (as shown in Figure 3). In contrast, the thermal decomposition of nickel and lanthanum precursors in the non-calcined samples releases effluent gases (such as NOx and CO2) that interfering with the thermal conductivity, complicating the interpretation of the H2-TPR profiles and making the quantitative measurement of H2 consumption unreliable. Consequently, the quantitative reduction analysis discussed above is, in principle, directly applicable only to the calcined samples. However, the impregnated samples—whether they are directly reduced or first calcined and then reduced—originate from the same precursor material. While calcination provides sufficient thermal energy for the surface diffusion of NiO species, bulk agglomeration is thermodynamically restricted because the temperature remains far below the Tammann temperature of bulk NiO (1970 °C), which governs bulk lattice mobility. Thus, although some surface rearrangement is inevitable, the lack of bulk mobility, combined with the strong interaction between the NiO precursor and the microporous support preserves high dispersion and prevents large-scale particle agglomeration prior to reduction. This implies that the location of the Ni species is initially the same in both cases. Therefore, it is reasonable to extrapolate the conclusion from the calcined to the non-calcined samples.
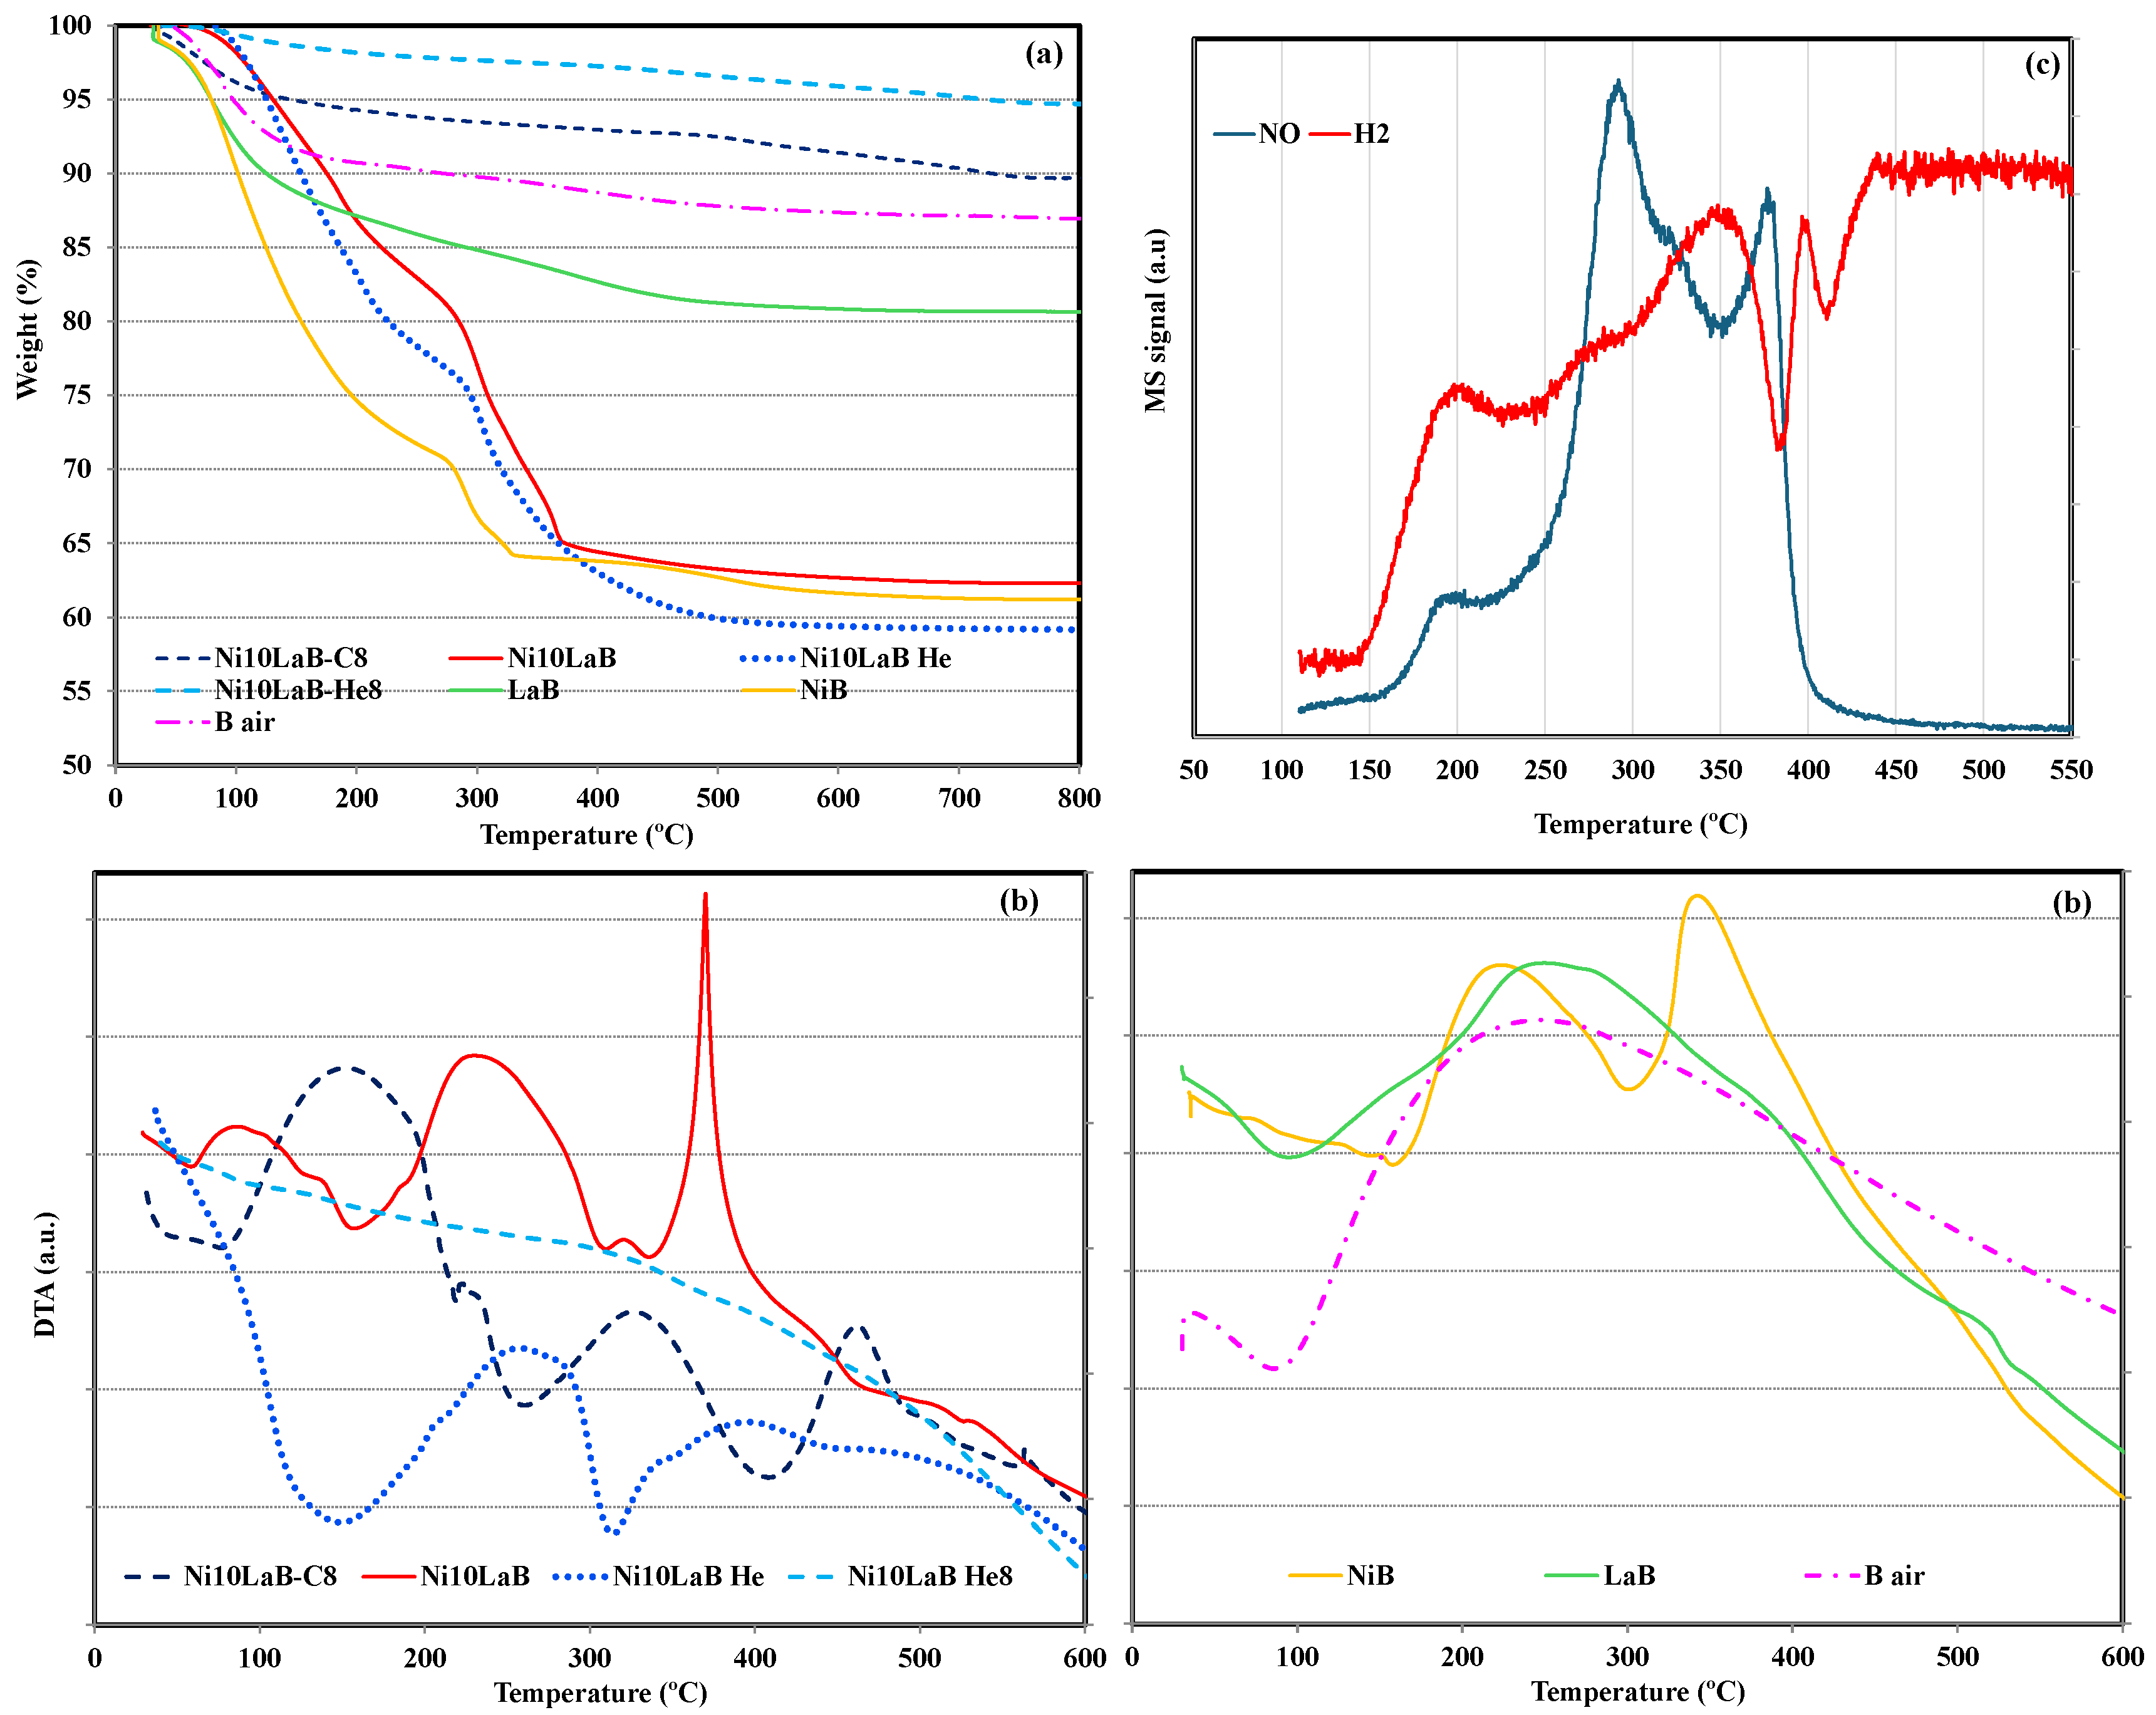
To gain deeper insight into the comparative behavior of these materials, thermogravimetric (a) and differential thermal analysis (b) of the H2 reduction pretreatment (10 vol% in Ar) for calcined and non-calcined Ni10LaB catalyst, alongside non-calcined NiB and LaB samples, are shown in Figure 4. The thermal analysis of the heat-treated β-support (included for reference) shows a primary mass loss in two regions: 70–250 °C, associated with the evolution of adsorbed water [53], and 300–500 °C, attributed to the release of strongly retained CO2 from the porous structure [54]. For the LaB sample, prepared by impregnation with La(NO3)3·xH2O, a similar initial mass loss occurs up to 270 °C. This is related to the release of water from the zeolitic support and the dehydration of La(NO3)3 [55]. A subsequent, more significant mass loss is observed up to 450 °C, which is attributed to the decomposition of the nitrate species [55]. The nickel-impregnated sample (NiB) also exhibits a substantial initial mass loss due to water release/decomposition up to 270 °C. More importantly, the NiB profile shows two well-defined mass loss steps between 275–305 °C and 305–335 °C, attributed to the partial and complete decomposition of nitrate species, respectively, yielding NiO [56]. The mass loss between 450–550 °C corresponds to the reduction of NiO to metallic Ni. Regarding the DTA curves (Figure 4b), using the curve of the β-support as an approximate baseline, the profile for the LaB sample is quite similar. It exhibits two exothermic shoulders at approximately 350 °C and 500 °C, which are related to the two-stage decomposition of the nitrate species. In contrast, the NiB exhibits a more intense and defined exothermic band in the 300–400 °C range. This pronounced feature is attributed to the rapid and highly exothermic decomposition of nickel nitrate to nickel oxide.
The TG curve of the NiLaB catalyst under an inert helium atmosphere (denoted as NiLaB He) exhibits a profile resembling a combination of the NiB and LaB profiles, suggesting an interaction between the nickel and lanthanum precursors during the decomposition process. Notably, the TG analysis of the reduction profile for the Ni10LaB catalyst (corresponding to sample Ni10LaB8D, tested in DRM) is presented. This profile is similar to the aforementioned NiLaB-He; however, it displays a more defined final temperature for the weight loss event between 275–370 °C. This indicates that nitrate decomposition occurs more rapidly in a H2 atmosphere. This observation is corroborated by differential thermal analysis (DTA), where a sharp exothermic peak appears within this temperature range, revealing an accelerated process. Mass spectrometry (MS) analysis of the NO+ signal for this sample (Figure 4c) shows that the nitrate decomposition proceeds primarily in two steps. Correlation with the H2 signal reveals concurrent H2 consumption during the latter decomposition stage (320–370 °C). This suggests that the formation of Ni2O3 from nitrate decomposition [Ni(NO3)2 → Ni2O3 + 4 NO2 + ½ O2] [56] is followed by its simultaneous reduction to NiO and metallic Ni, which is associated with a second H2 consumption peak. Subsequently, the sample exhibits a minor weight loss, which concludes around 570 °C, indicating the complete reduction of nickel species to their metallic state.
In the case of the calcined or heat-treated samples, the TG profiles exhibit a lower weight loss, as expected, since the initial decomposition process has already occurred. These samples primarily contain supported metal oxides of Ni and La. The observed weight loss occurs over a broad temperature range of 350–750 °C, consistent with TPR experiments, and corresponds to the reduction of NiO species with varying reducibility. This aspect is noteworthy because the Ni10LaB8D sample shows a more defined and narrower NiO reduction temperature range, suggesting the presence of more uniform and homogeneous Ni nanoparticles. H2 chemisorption characterization of the reduced Ni10LaB8D and Ni10LaB8-C6 catalysts supports this conclusion, as it shows a higher Ni dispersion for Ni10LaB8D compared to Ni10LaB8-C6 (14.1% vs. 7.8%, respectively).

3.1.4. Transmission Electron Microscopy

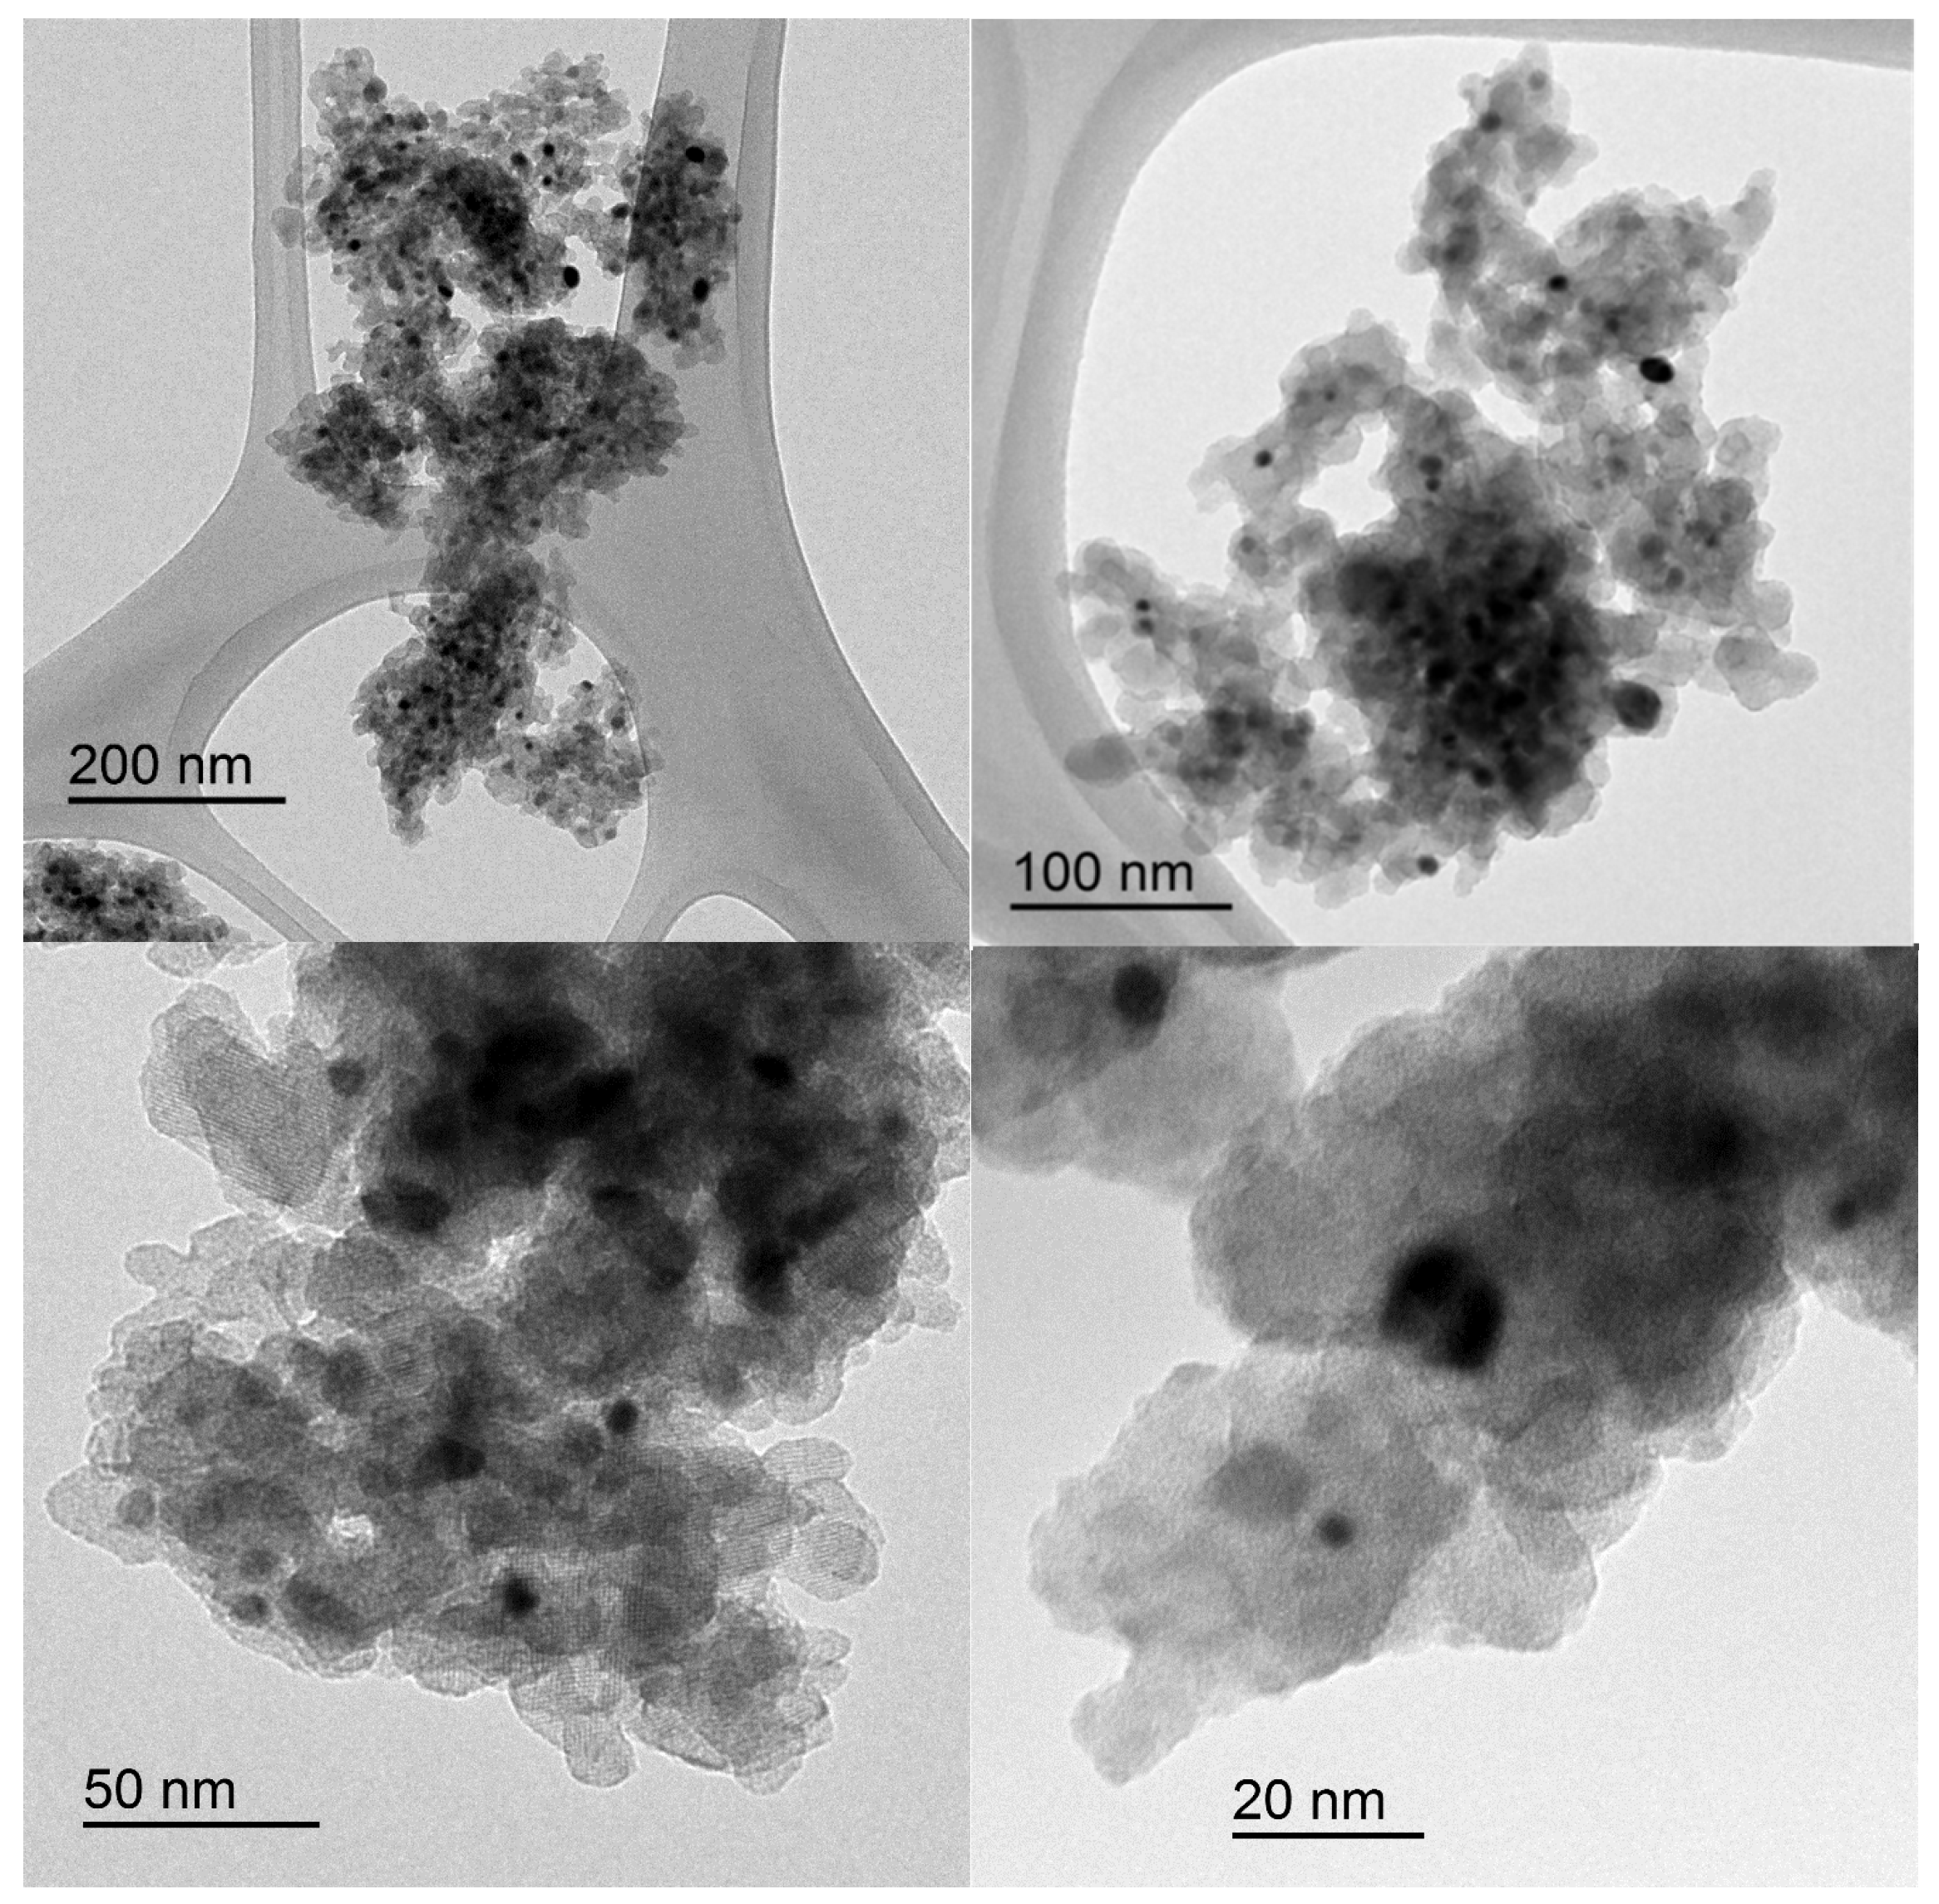
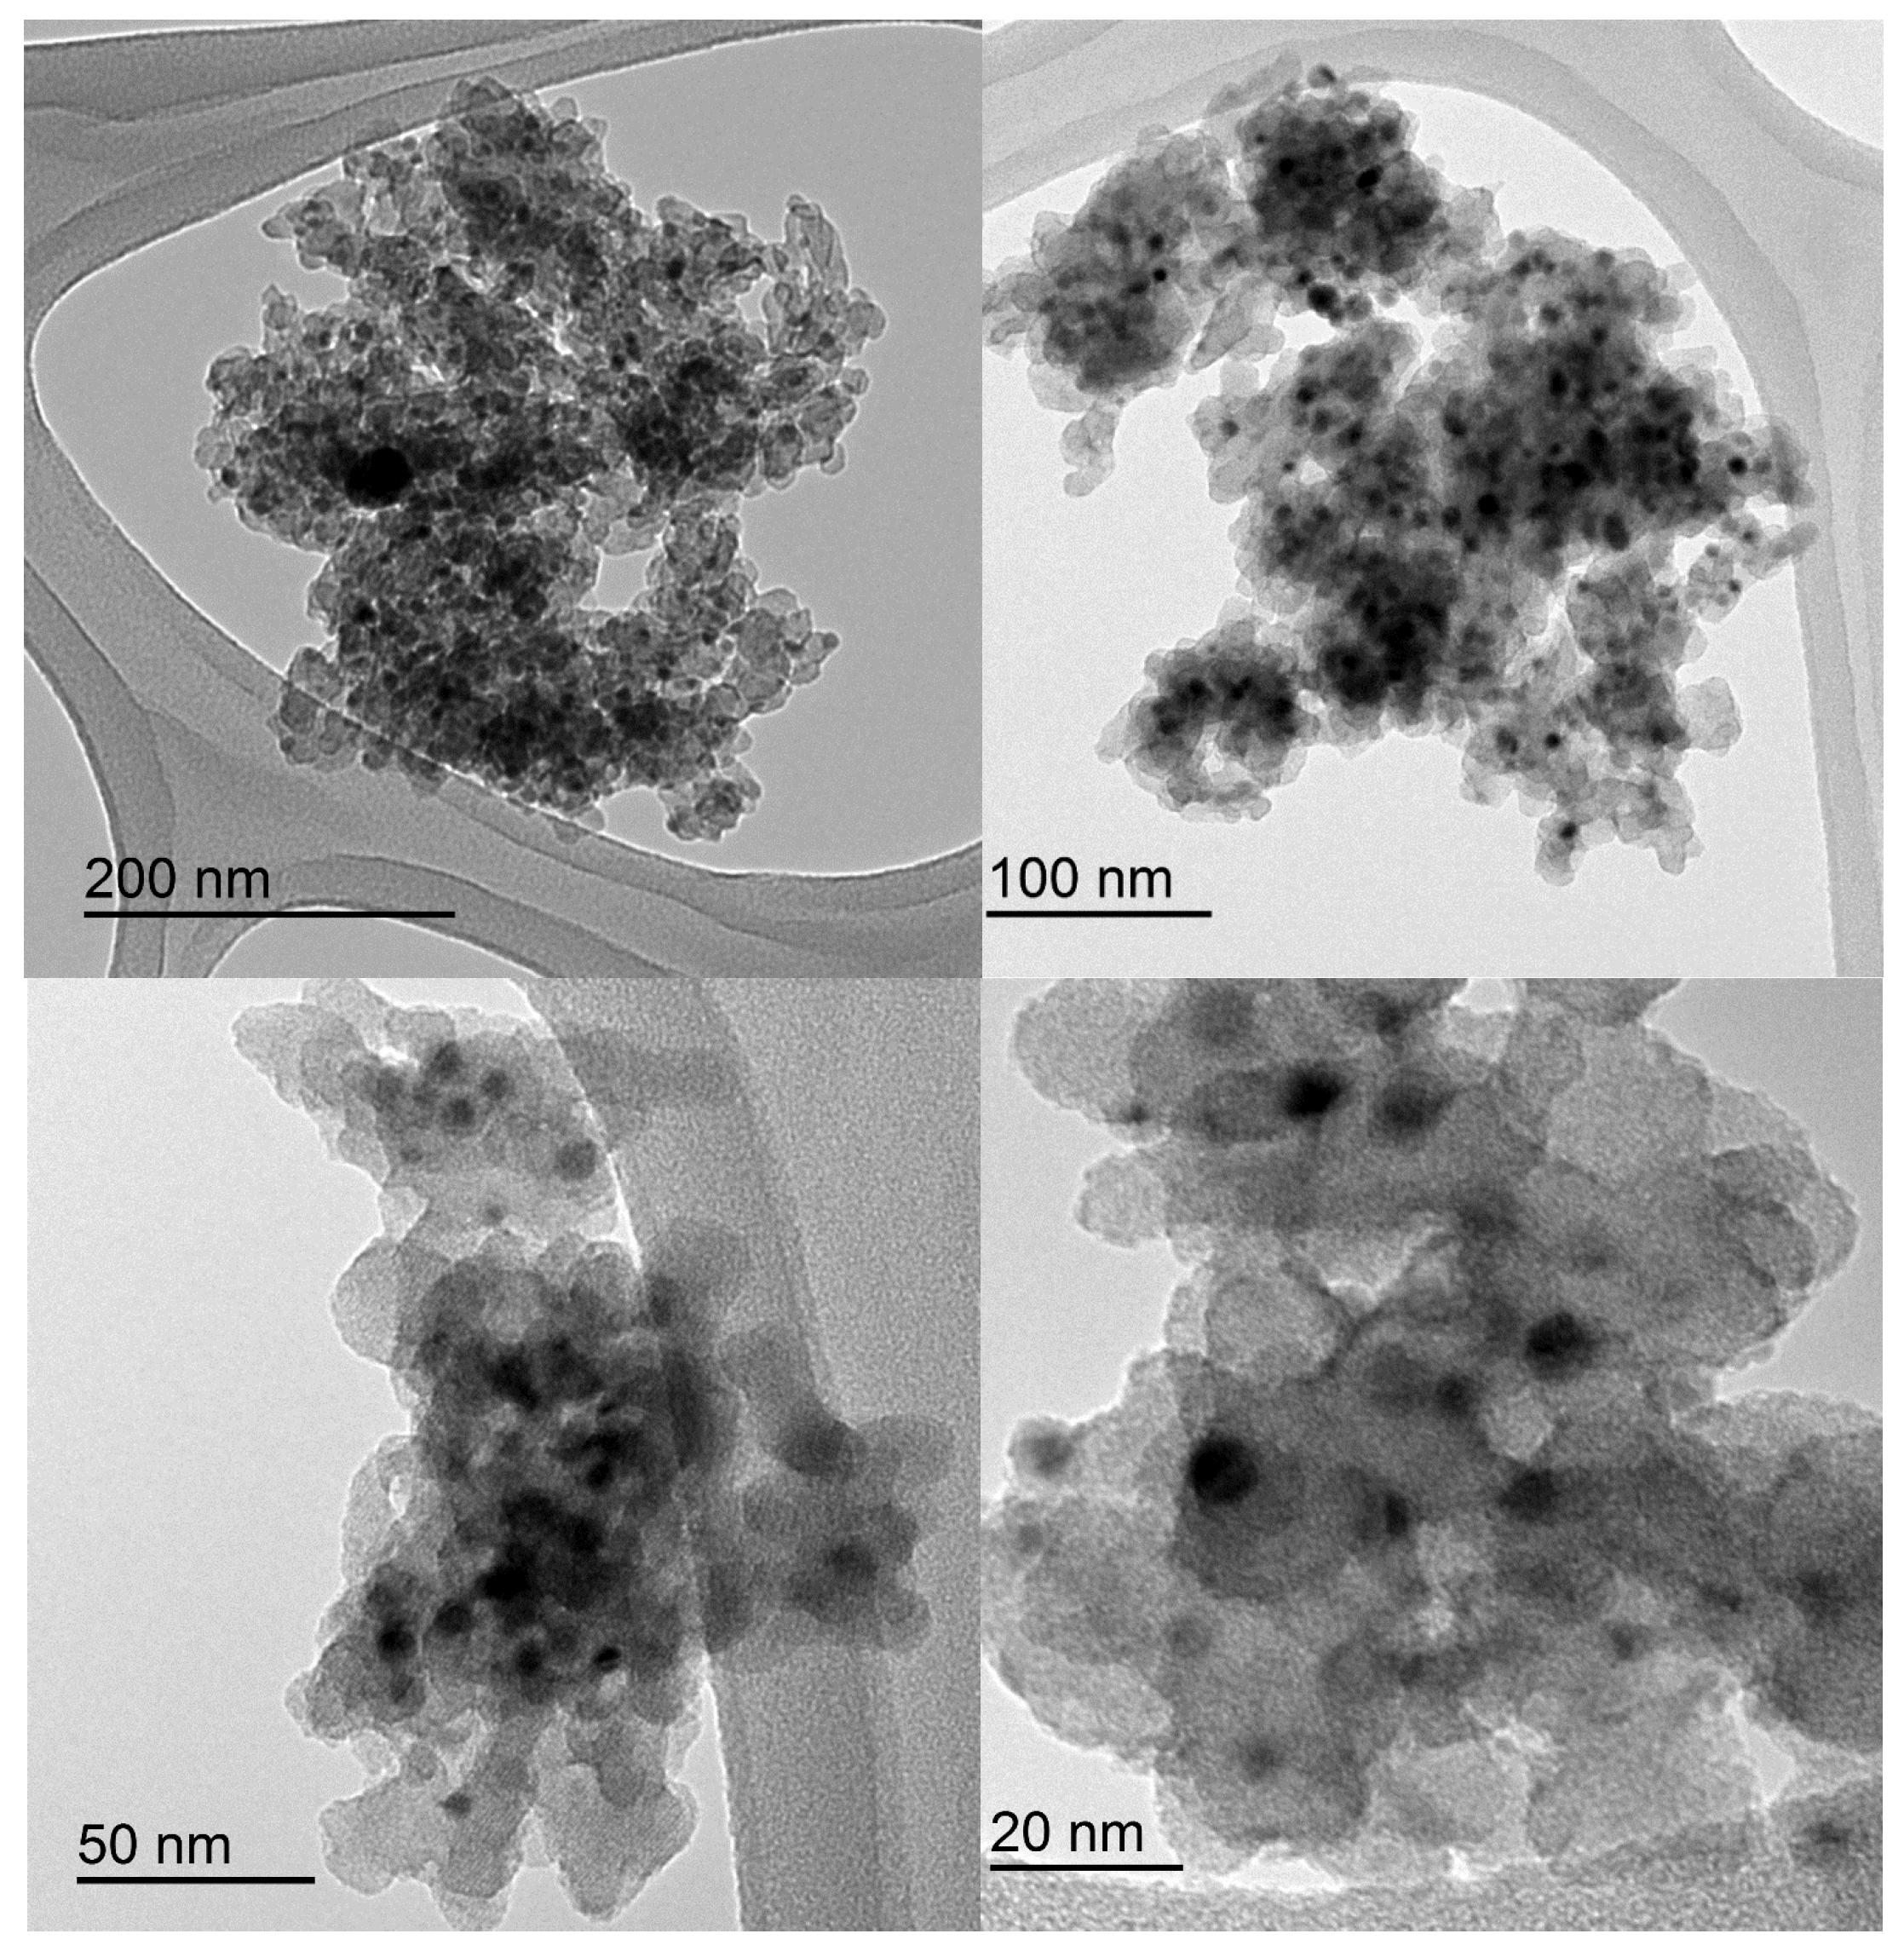
Considering the above results, Ni10LaB8D and Ni10LaB8D-C6 were analysed by transmission electron microscopy, whose photographs are shown in Figure 5 and Figure 6 respectively.
In the context of supported catalyst characterization, a qualitative visual assessment of conventional TEM micrographs provides general insights into the morphology of the active metal phase. A preliminary inspection of the figures suggests that the two samples exhibit a broadly similar distribution of nickel nanoparticle sizes. However, a closer qualitative examination indicates that the Ni10LaB8D catalyst appears to contain nanoparticles of slightly smaller observable size, whereas Ni10LaB8D-C6 displays a visually higher density of reduced Ni nanoparticles. Given that both materials originate from the same precursor and contain the same nominal Ni loading, we tentatively hypothesize that the fewer easily observable nanoparticles in Ni10LaB8D might reflect a higher degree of metal dispersion. In this scenario, a fraction of the Ni species could be small enough to fall below the resolution and detection limits of the conventional TEM equipment used in this study. While advanced quantitative techniques would be required to definitively confirm the exact statistical distribution, these qualitative observations align well with the macroscopic catalytic behavior observed. This behavior is consistent with the highly dispersed atomic Ni observed in silicate molecular sieves [57].

3.2. Catalytic Activity and Stability

In this section, the catalytic activity and stability of the synthesized Ni-La2O3/B catalysts will be assessed for the dry reforming of methane. The evaluation will focus on determining the influence of key synthesis parameters, namely nickel loading (wt.%), the conditions of the calcination and reduction pretreatments, the reaction temperature, and gas composition on the reaction efficiency and catalyst deactivation.

3.2.1. Effect of Nickel Loading on the Dry Methane Reforming

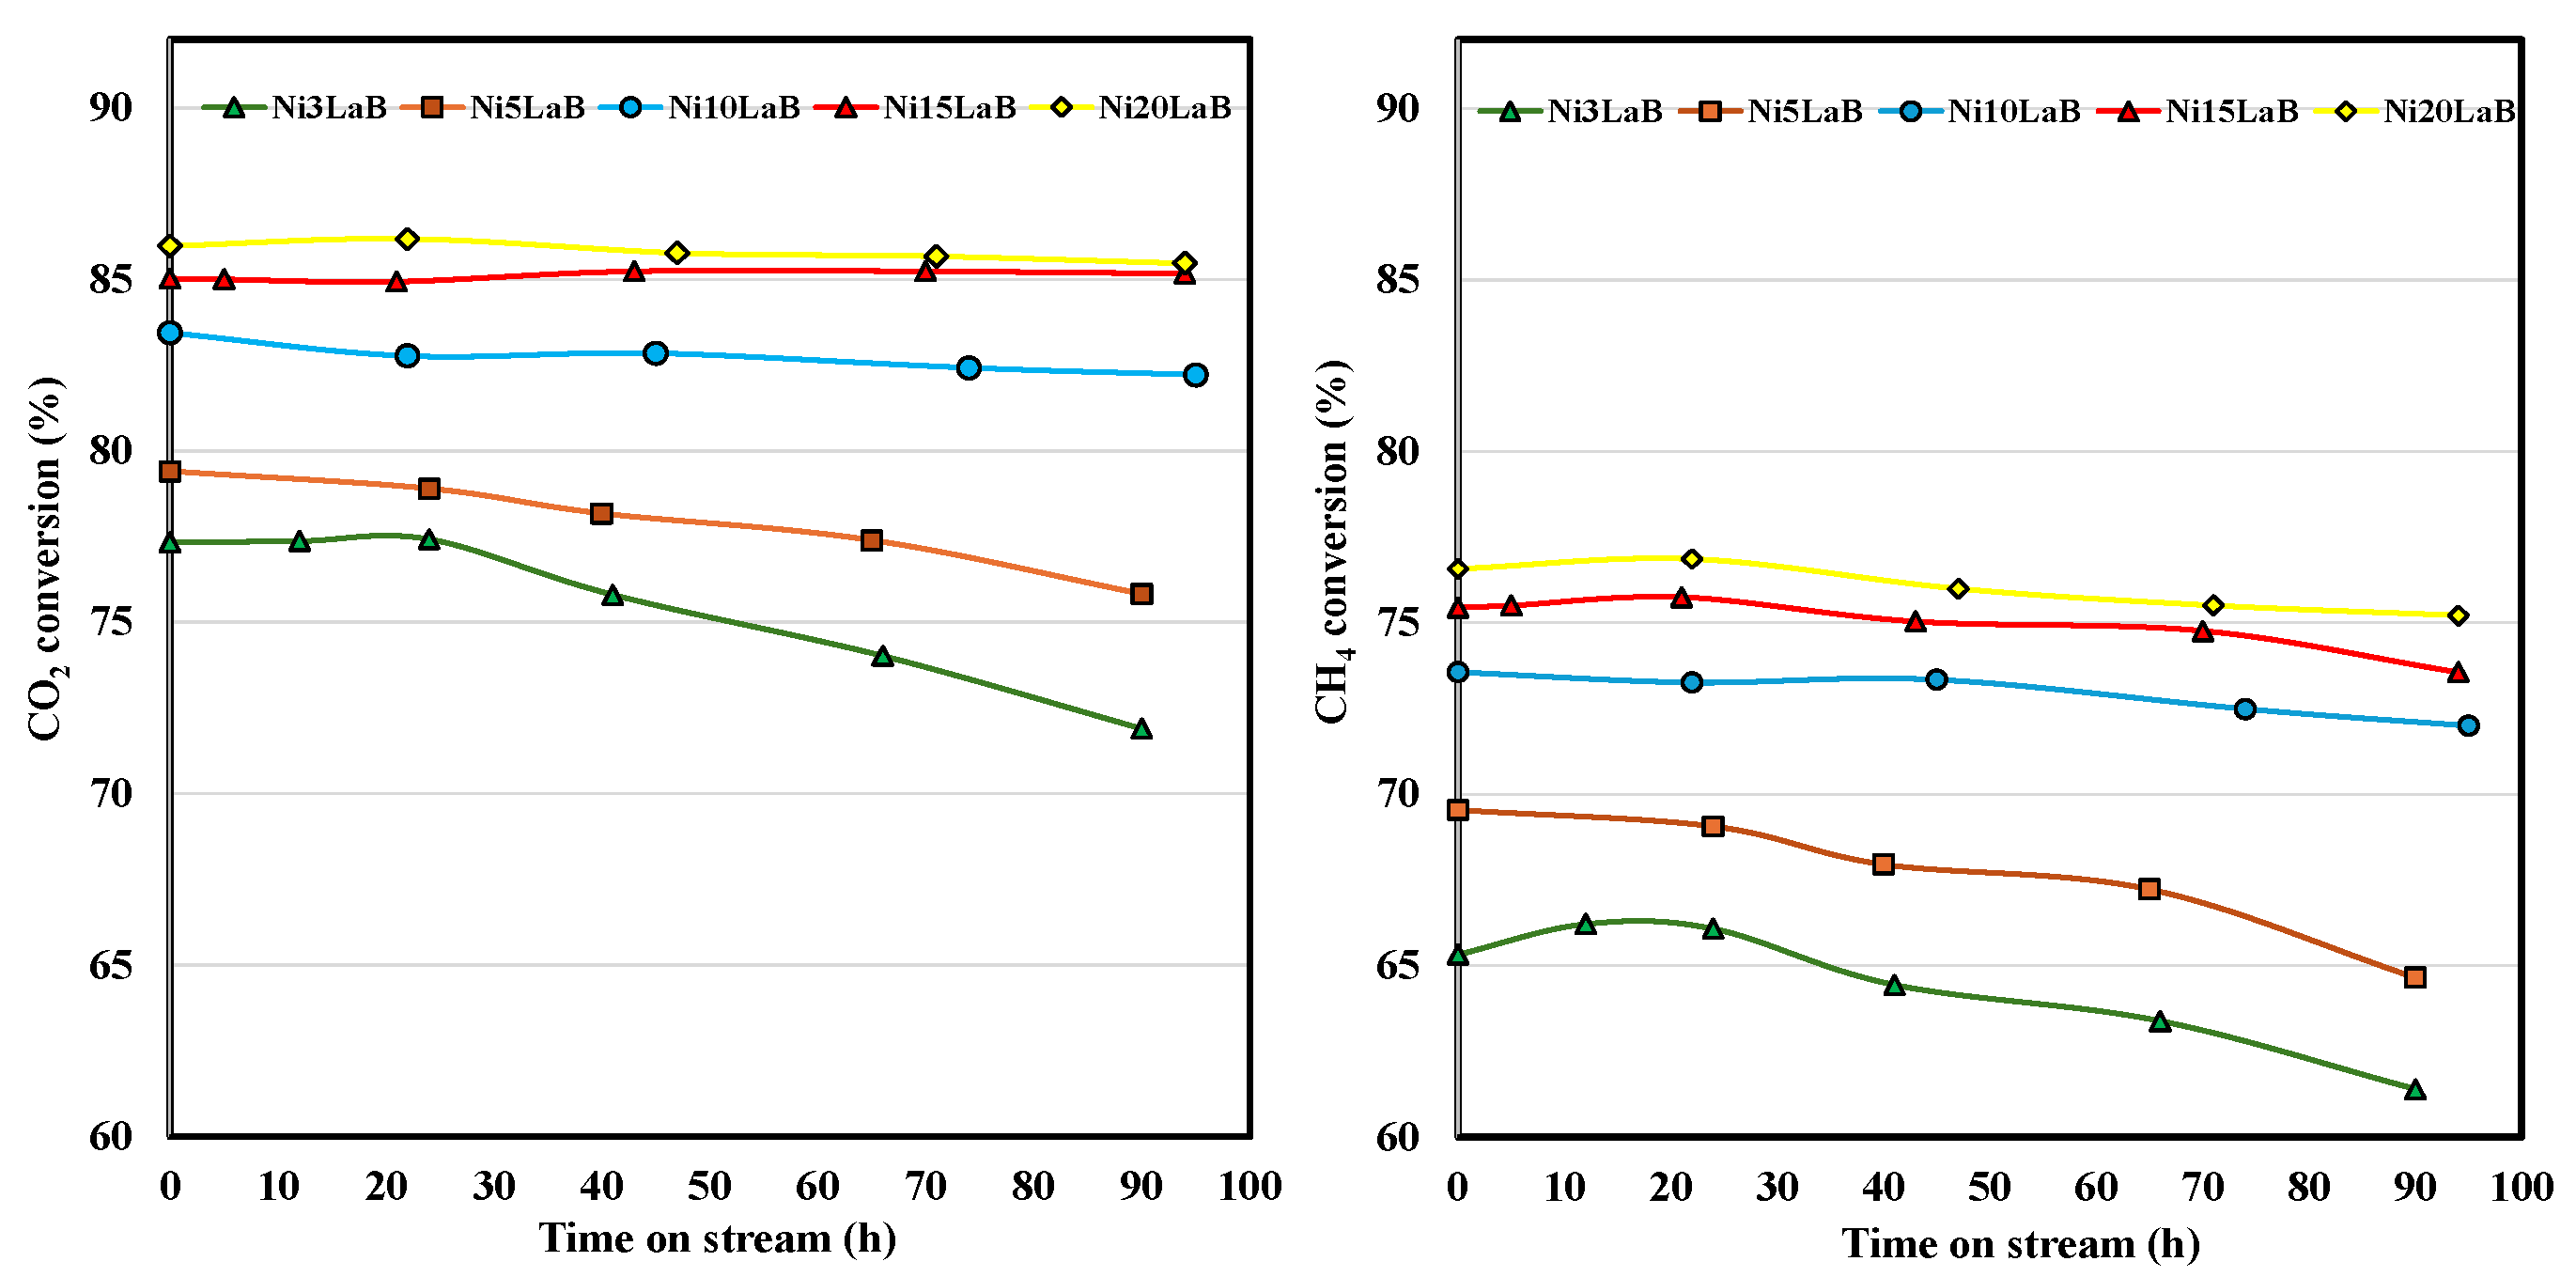
Figure 7 shows the CO2 and CH4 conversion profiles over time for the NixLaB8D-C6 catalyst series, which features nominal nickel loadings ranging from 3 to 20 wt.%. All catalysts were pretreated under identical conditions: calcination at 600 °C followed by direct reduction at 800 °C with a 1-h holding time.
As anticipated, higher Ni loadings result in increased conversion, a trend attributed to a greater density of active sites. Maximum conversion is achieved at approximately 15 wt.% Ni. However, the marginal gain in conversion from 10 wt.% to 15 wt.% is only about 2%. In contrast, catalysts with lower loadings exhibit a more rapid loss of stability over time. This reduced stability is likely due to sintering or carbon deposition [28] being more detrimental when fewer active sites are present. Consequently, a loading of 10 wt.% is proposed as the optimal compromise between catalytic activity, stability, and economic viability. Notably, the high conversion achieved with only 3 wt.% Ni loading is remarkable, which can be attributed to the higher dispersion of the supported Ni species [57]. This finding is consistent with previously discussed H2-TPR results, which indicate that the initial deposition of Ni occurs on the H+ sites of the zeolite.

3.2.2. Influence of the Calcination and Reduction Protocol on the Dry Methane Reforming

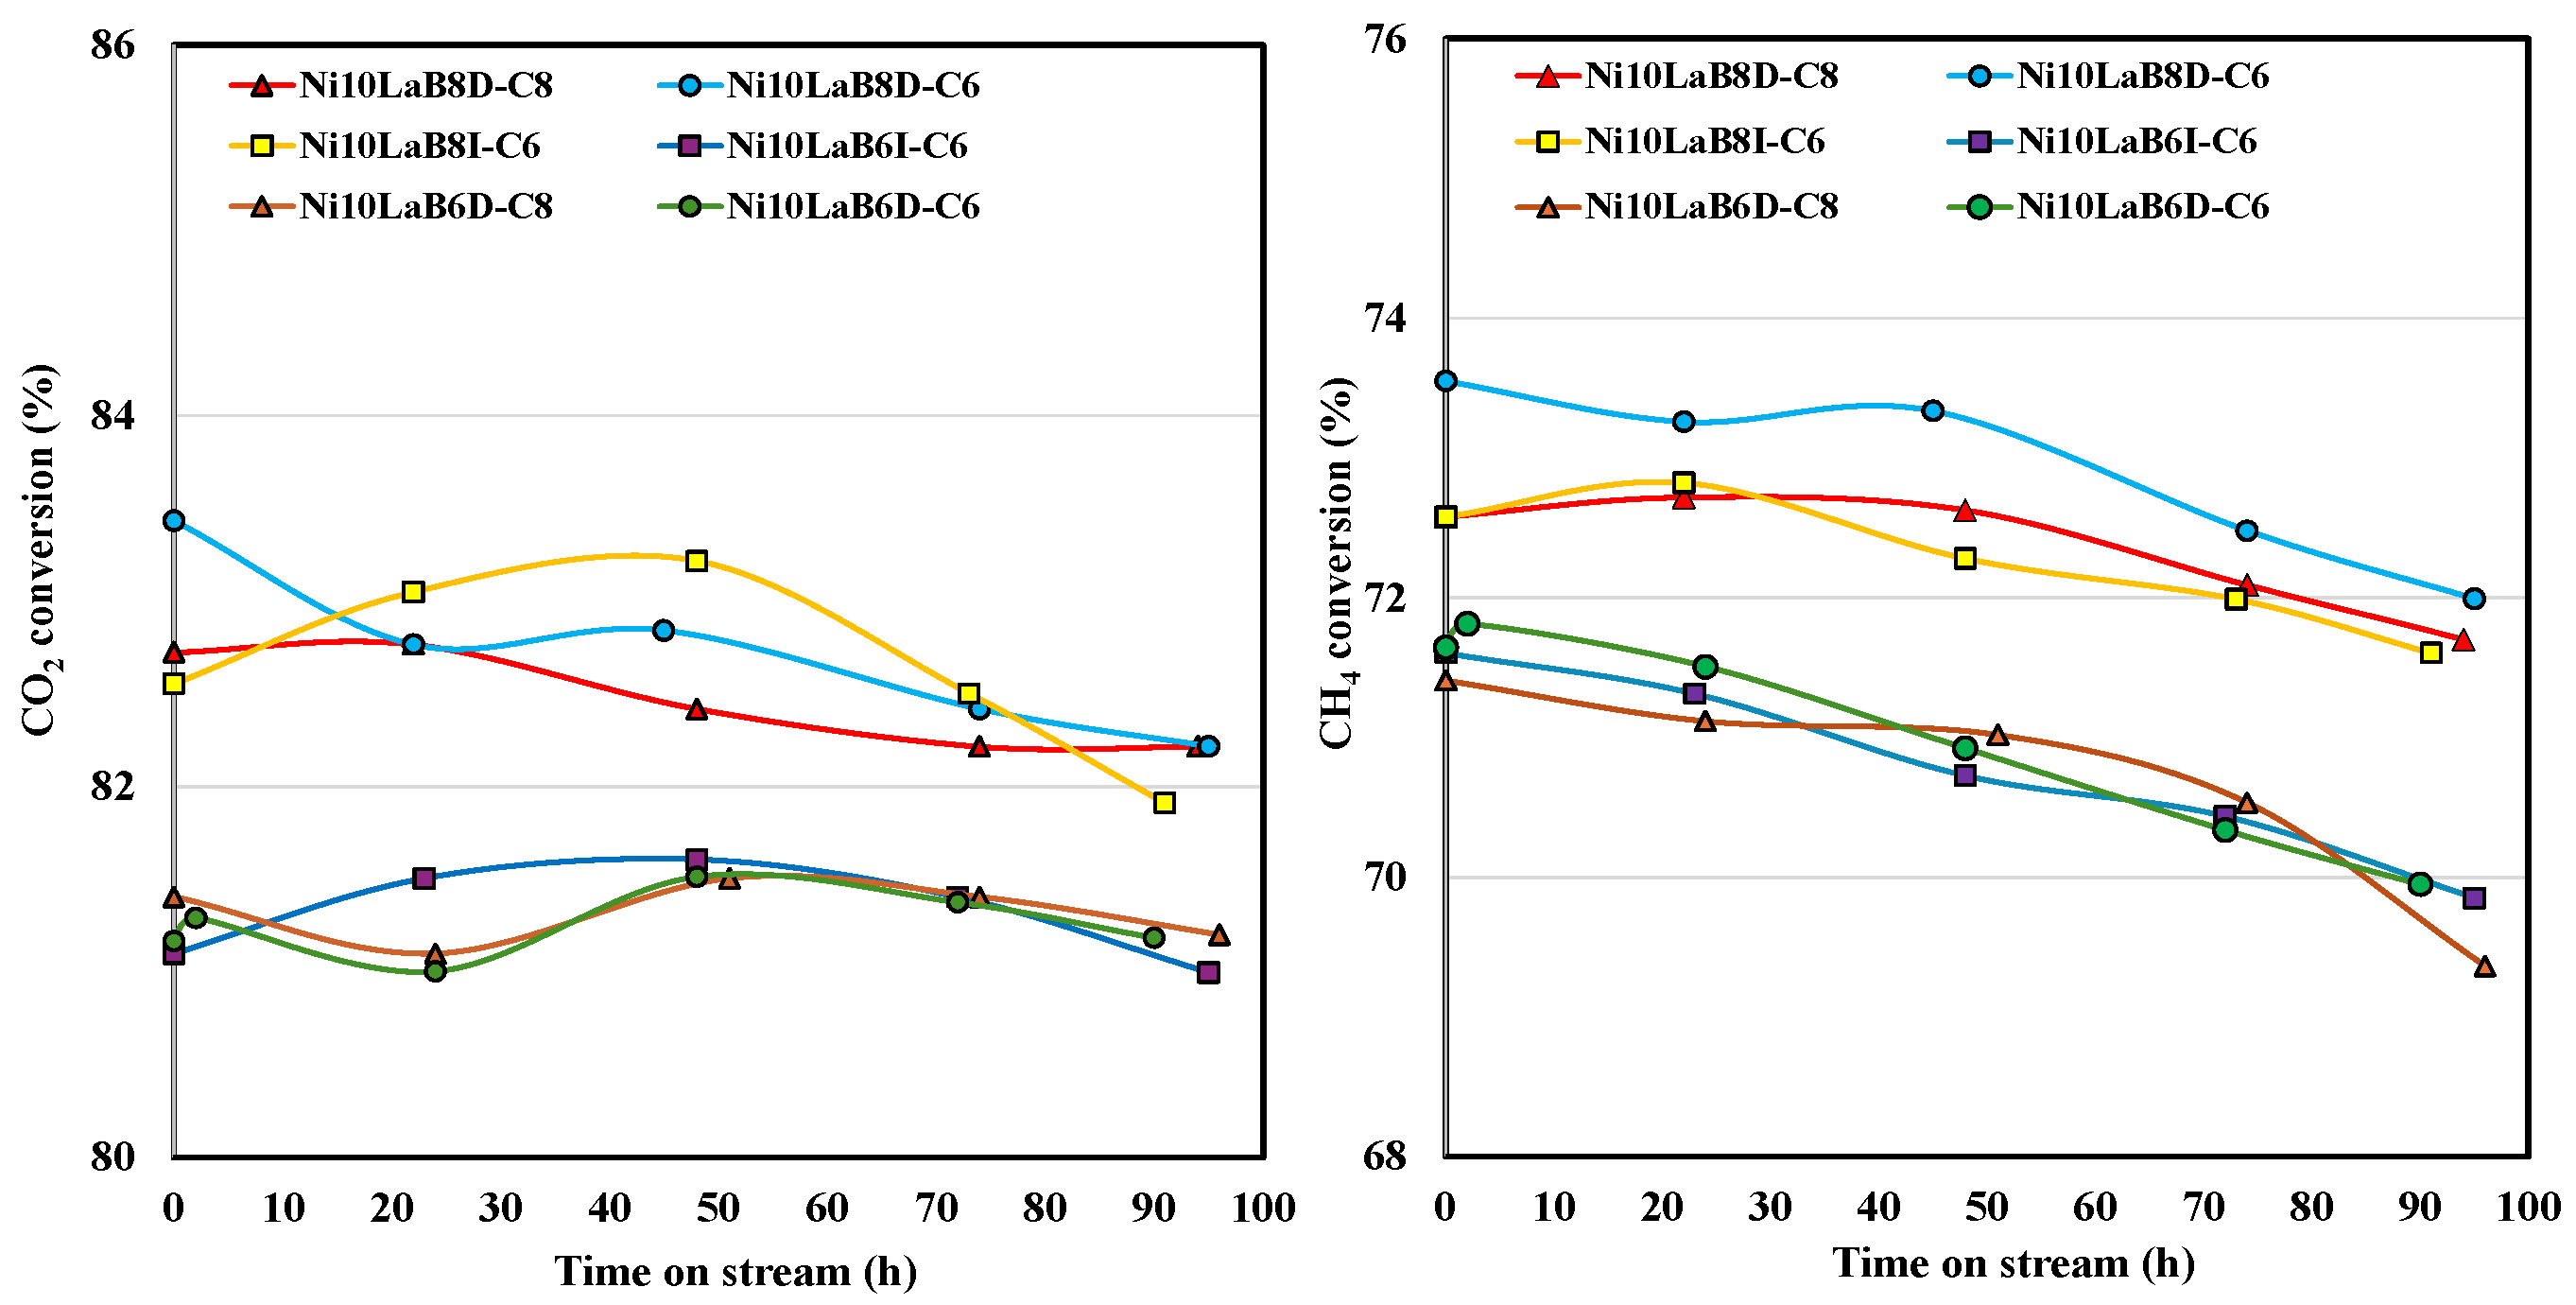
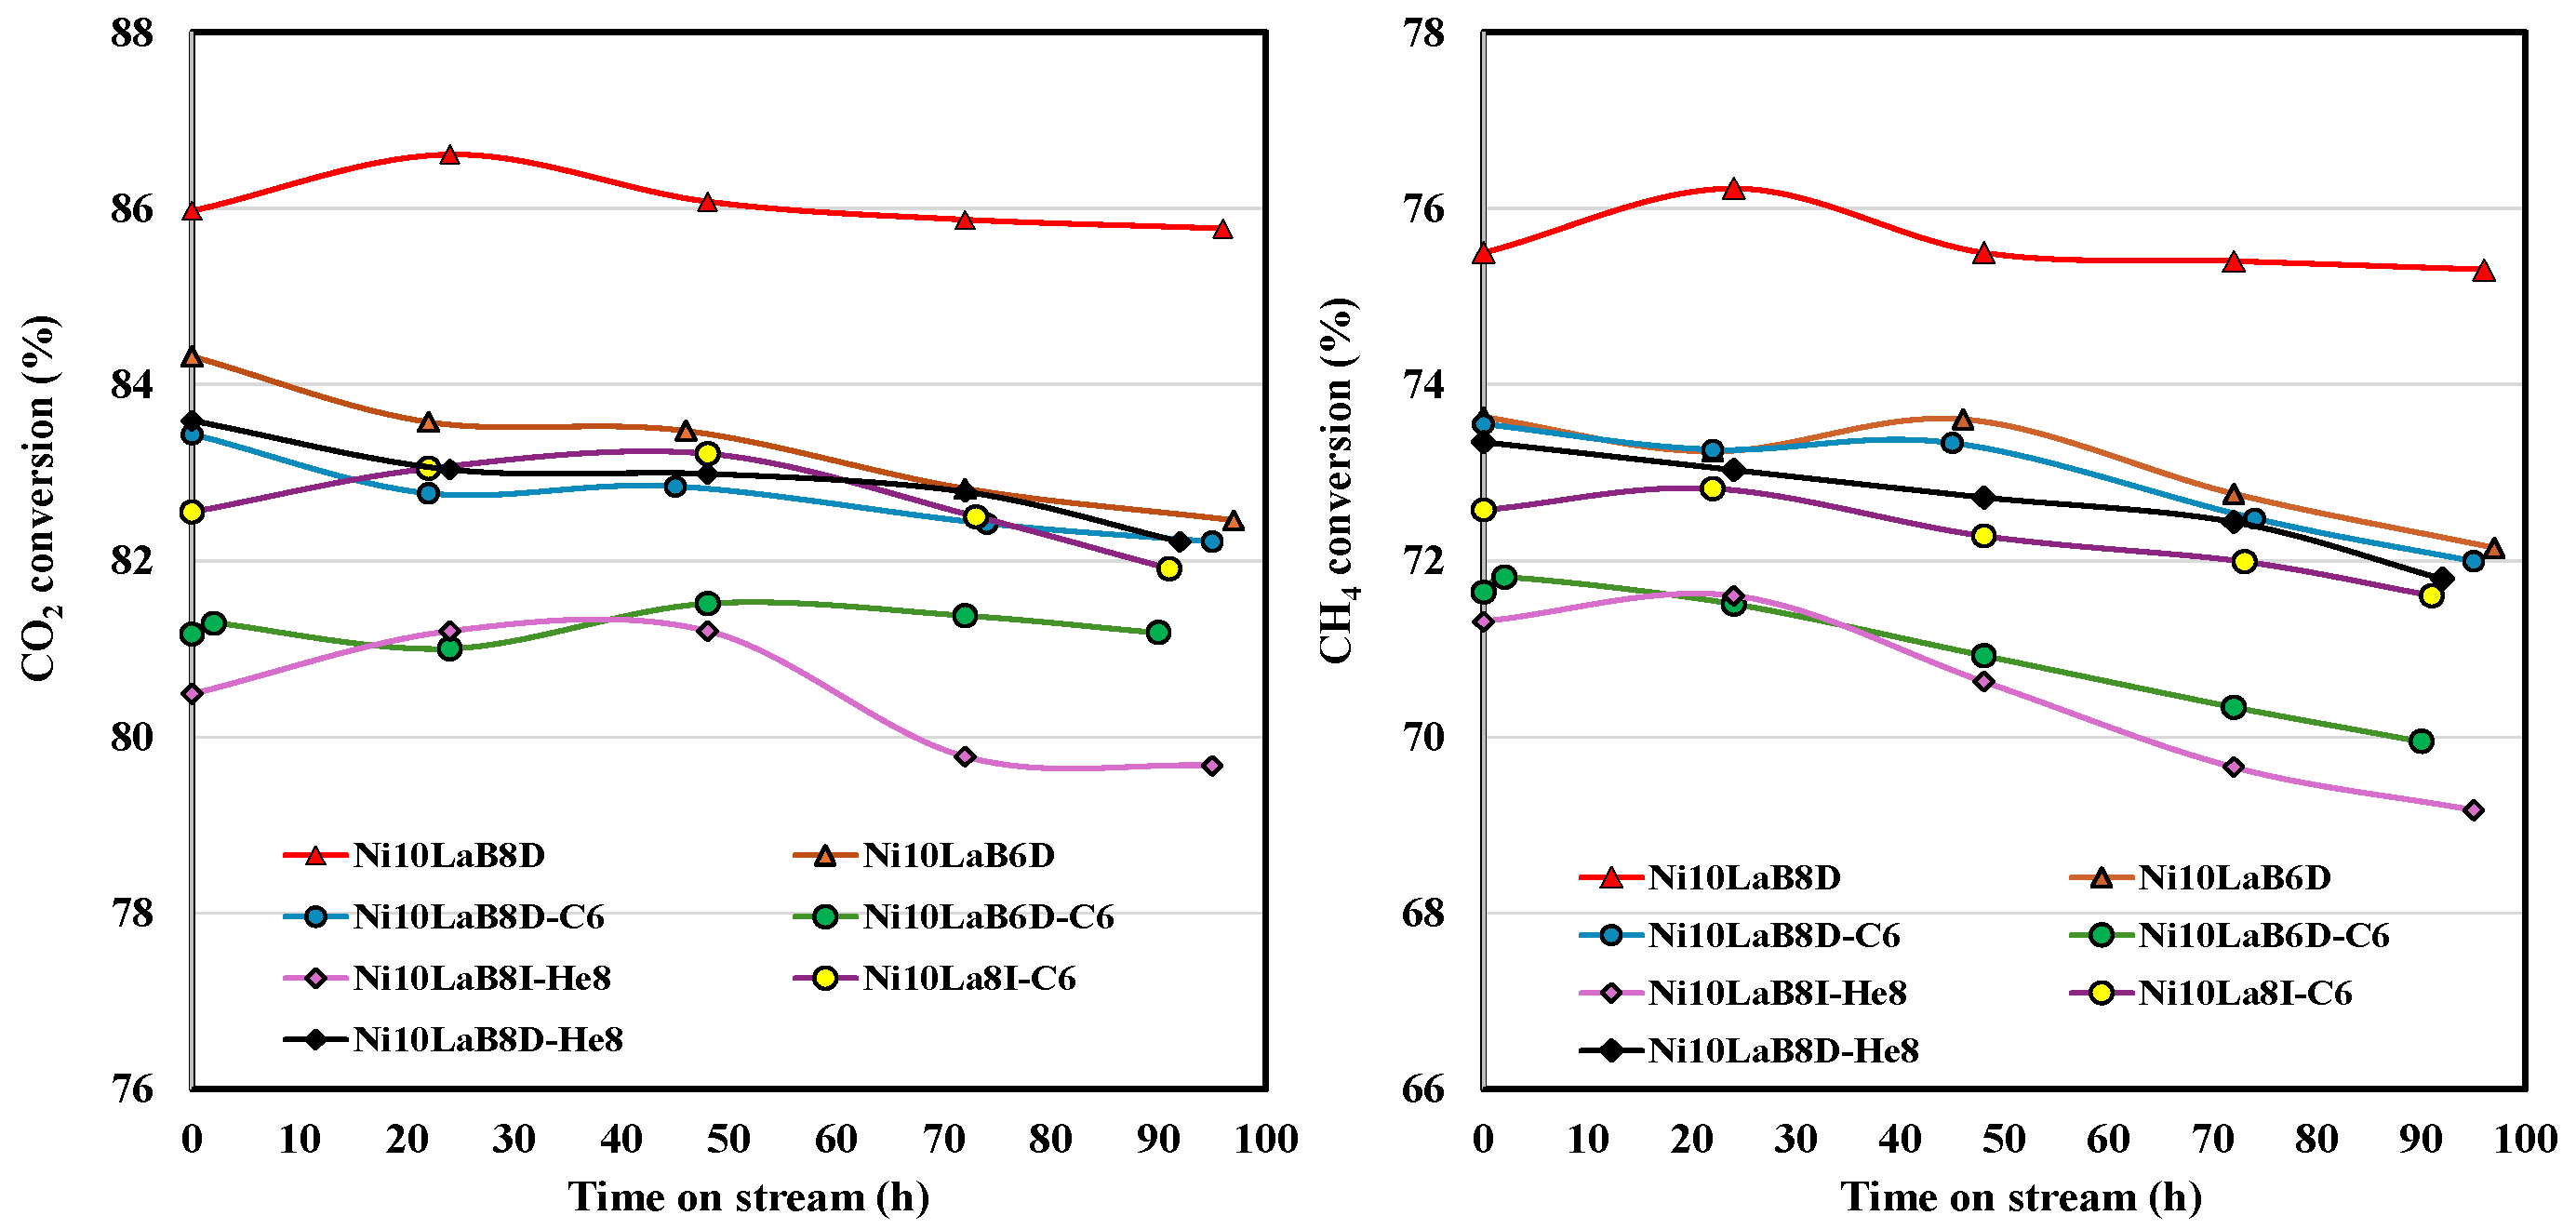
CO2 and CH4 conversions as a function of reaction time are shown for a series of calcined catalysts in Figure 8 to illustrate the effect of the reduction procedure on the calcined samples.
The conversion data highlights the influence of three pretreatment parameters: (i) The calcination temperature (600 vs. 800 °C) has no significant effect on catalytic performance, as evidenced by the similar conversion values of Ni10LaB8D-C6 and Ni10LaB8D-C8, for instance. (ii) The reduction procedure (direct vs. isothermal) also shows no measurable impact, with Ni10LaB8D-C6 and Ni10LaB8I-C6 exhibiting comparable activity. (iii) The reduction temperature has a positive effect on catalytic performance; higher reduction temperatures lead to higher conversion values, as observed when comparing the catalysts Ni10LaB8D-C6 and Ni10LaB6D-C6 (particularly regarding CH4 conversion). H2-TPR and TG analyses (Figure 3 and Figure 4a) indicate that the reduction of all supported NiO species is completed at approximately 750 °C. Therefore, a catalyst reduced at 600 °C must possess a lower density of active catalytic sites (metallic Ni), resulting in lower activity compared to a catalyst fully reduced at 800 °C. Nevertheless, the improvement in the conversion values is only about 2%.
Figure 9 shows CO2 and CH4 conversion as a function of time, comparing the calcined Ni10LaB-C6 catalyst to its non-calcined counterpart (Ni10LaB), after reduction at 600 or 800 °C. The performance of Ni10LaB-C6 after isothermal reduction at 800 °C is also compared to the non-calcined sample after a helium pretreatment at 800 °C.
The conversion data underscore the significant influence of a direct reduction pretreatment on non-calcined samples. In contrast to the previously analyzed calcined samples (Figure 8), the direct reduction of non-calcined samples at both 600 and 800 °C yields materials with higher catalytic activity than their calcined counterparts reduced at the same temperatures (e.g., Ni10LaB8D vs. Ni10LaB8D-C6). Moreover, the non-calcined samples subjected to direct reduction exhibited superior long-term catalytic stability compared to the calcined samples. For the isothermal reduction at 800 °C, the non-calcined sample was pretreated in an inert He atmosphere until reaching the reaction temperature. Under these conditions, sample Ni10LaB8I-He8 exhibited lower conversion than the calcined sample (Ni10LaB8I-C6). The comparable conversion of the direct reduction sample heated in He (Ni10LaB8D-He8) to that of the calcined sample Ni10LaB8I-C6 indicates that the enhancement from direct reduction is likely linked to the decomposition of the nitrate precursor in an H2 atmosphere. The conversion achieved with the Ni10LaB8D catalyst is remarkable, reaching 86%. This represents a significant improvement over previous benchmarks; for instance, studies conducted under comparable conditions (700 °C, 7.3% Ni loading) have reported conversions of approximately 78% [30]. This enhancement can likely be attributed to the synergistic effect between the Ni active sites and the La-modified support.
As previously noted, TG-DTA-MS analysis of the reduction process (Figure 4) shows that direct reduction results in an exothermic decomposition of the nitrate, followed by rapid reduction of the nascent NiOx species to metallic Ni. This specific pathway is not observed for either calcined or He-pretreated samples. This key difference likely explains the increased catalytic activity, presumably due to the formation of a more highly dispersed Ni phase.

3.2.3. Effect of Reaction Temperature on the Dry Methane Reforming

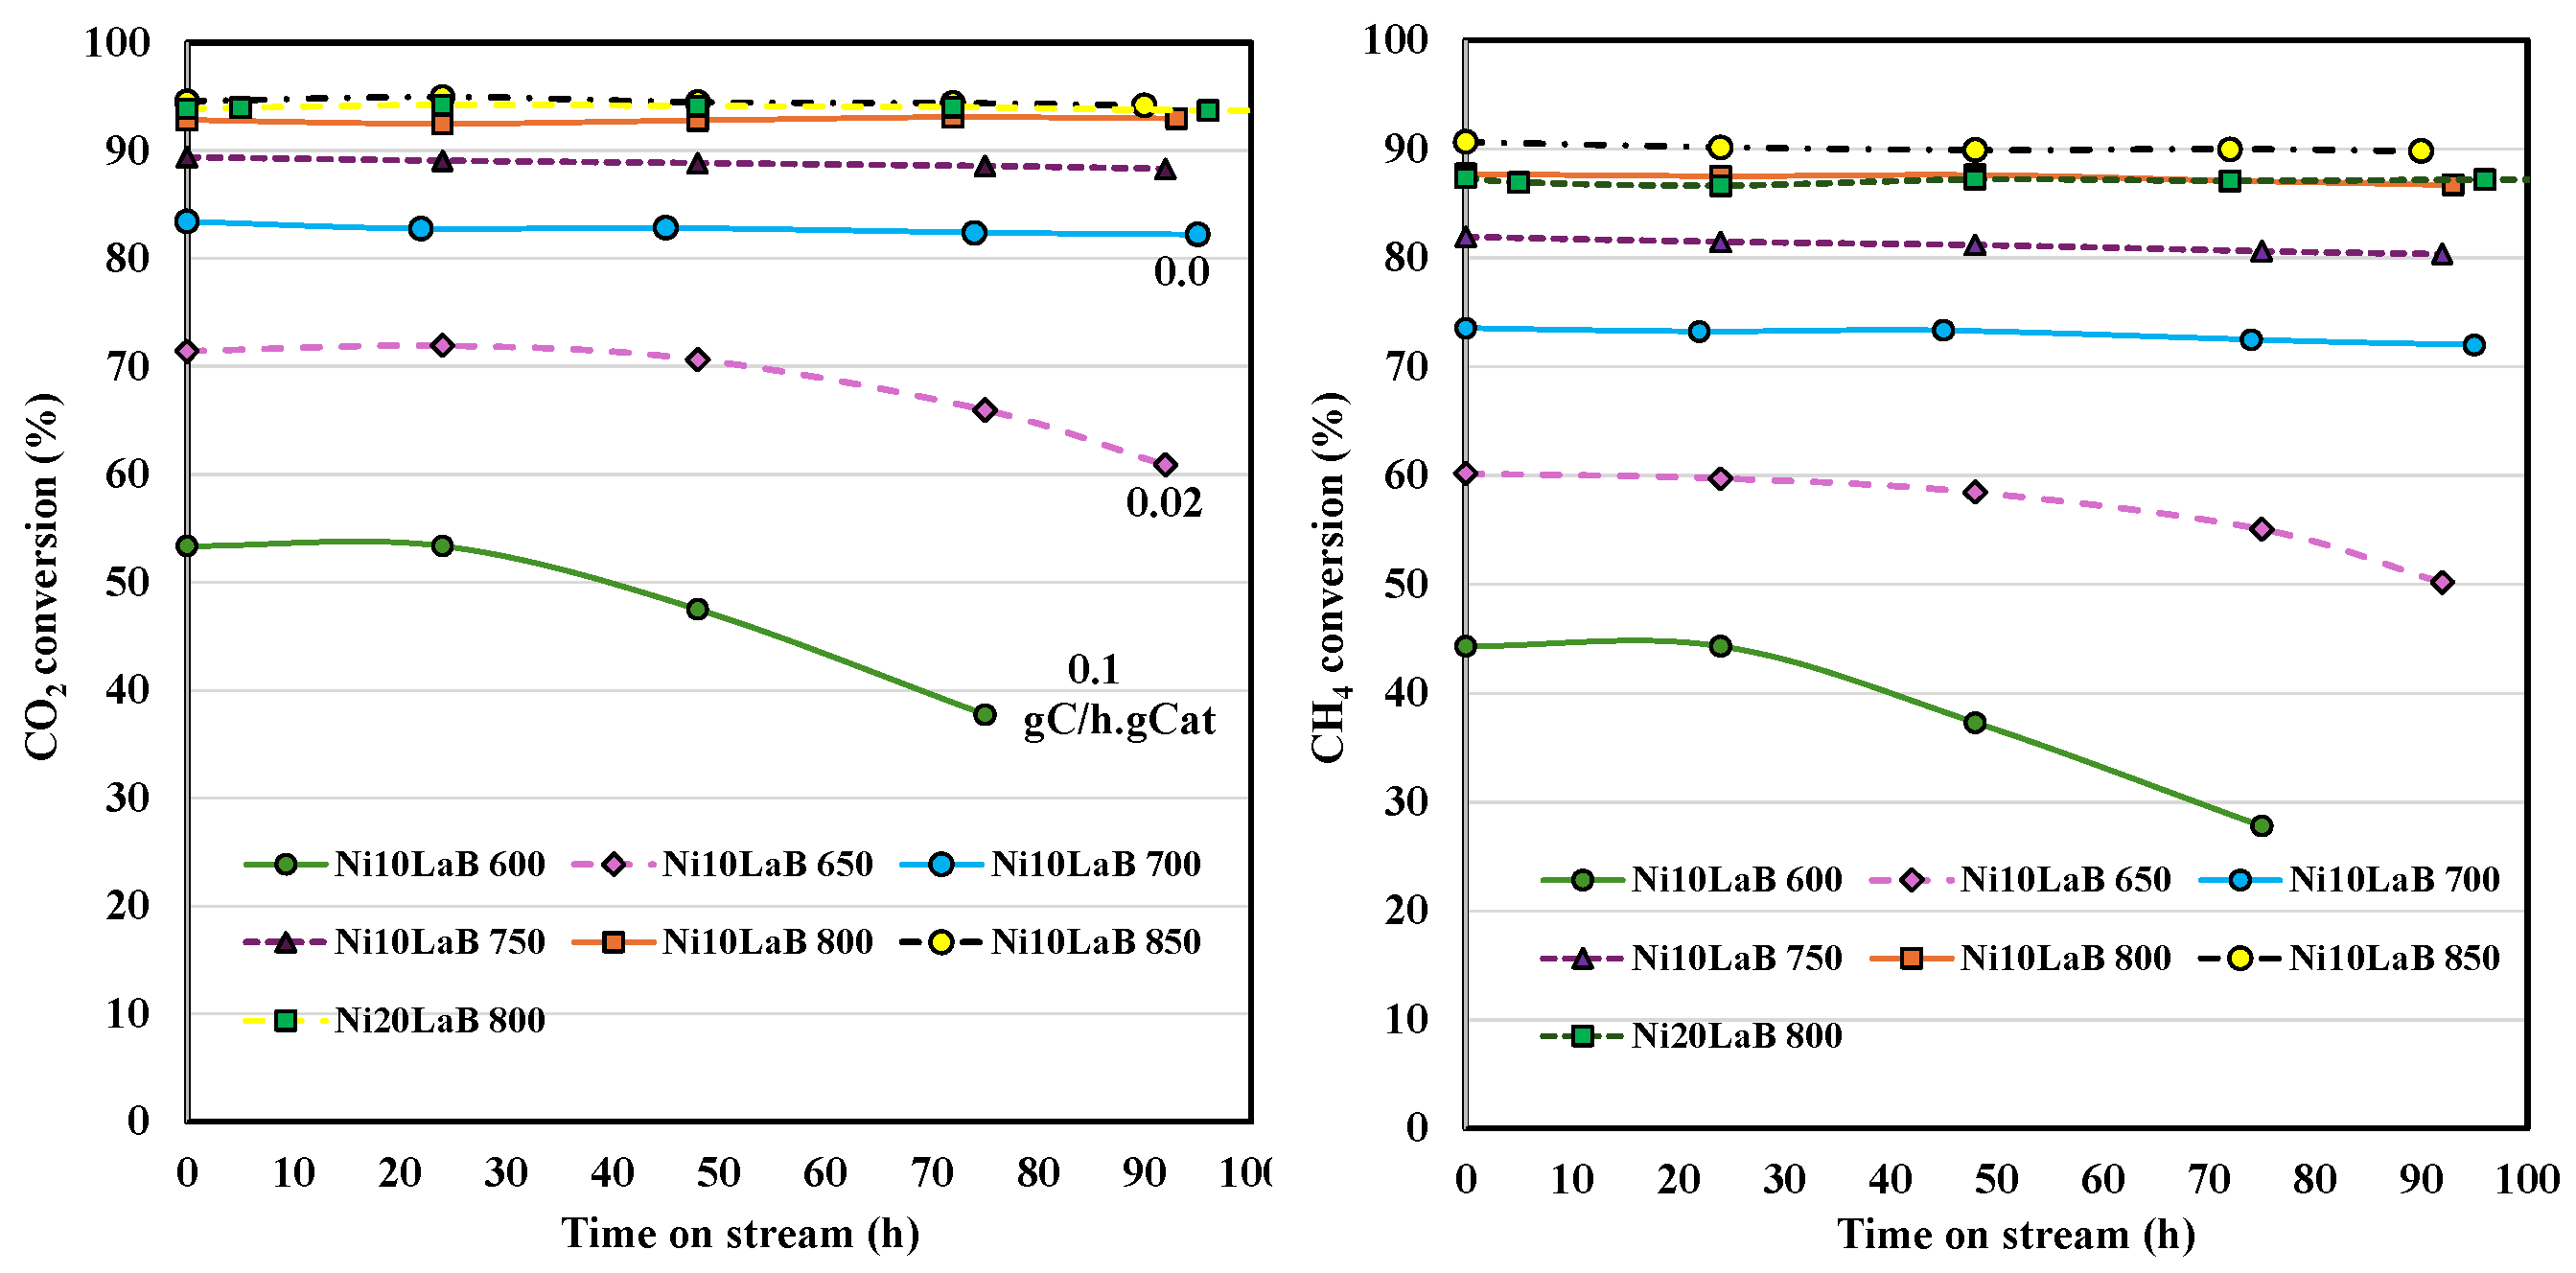
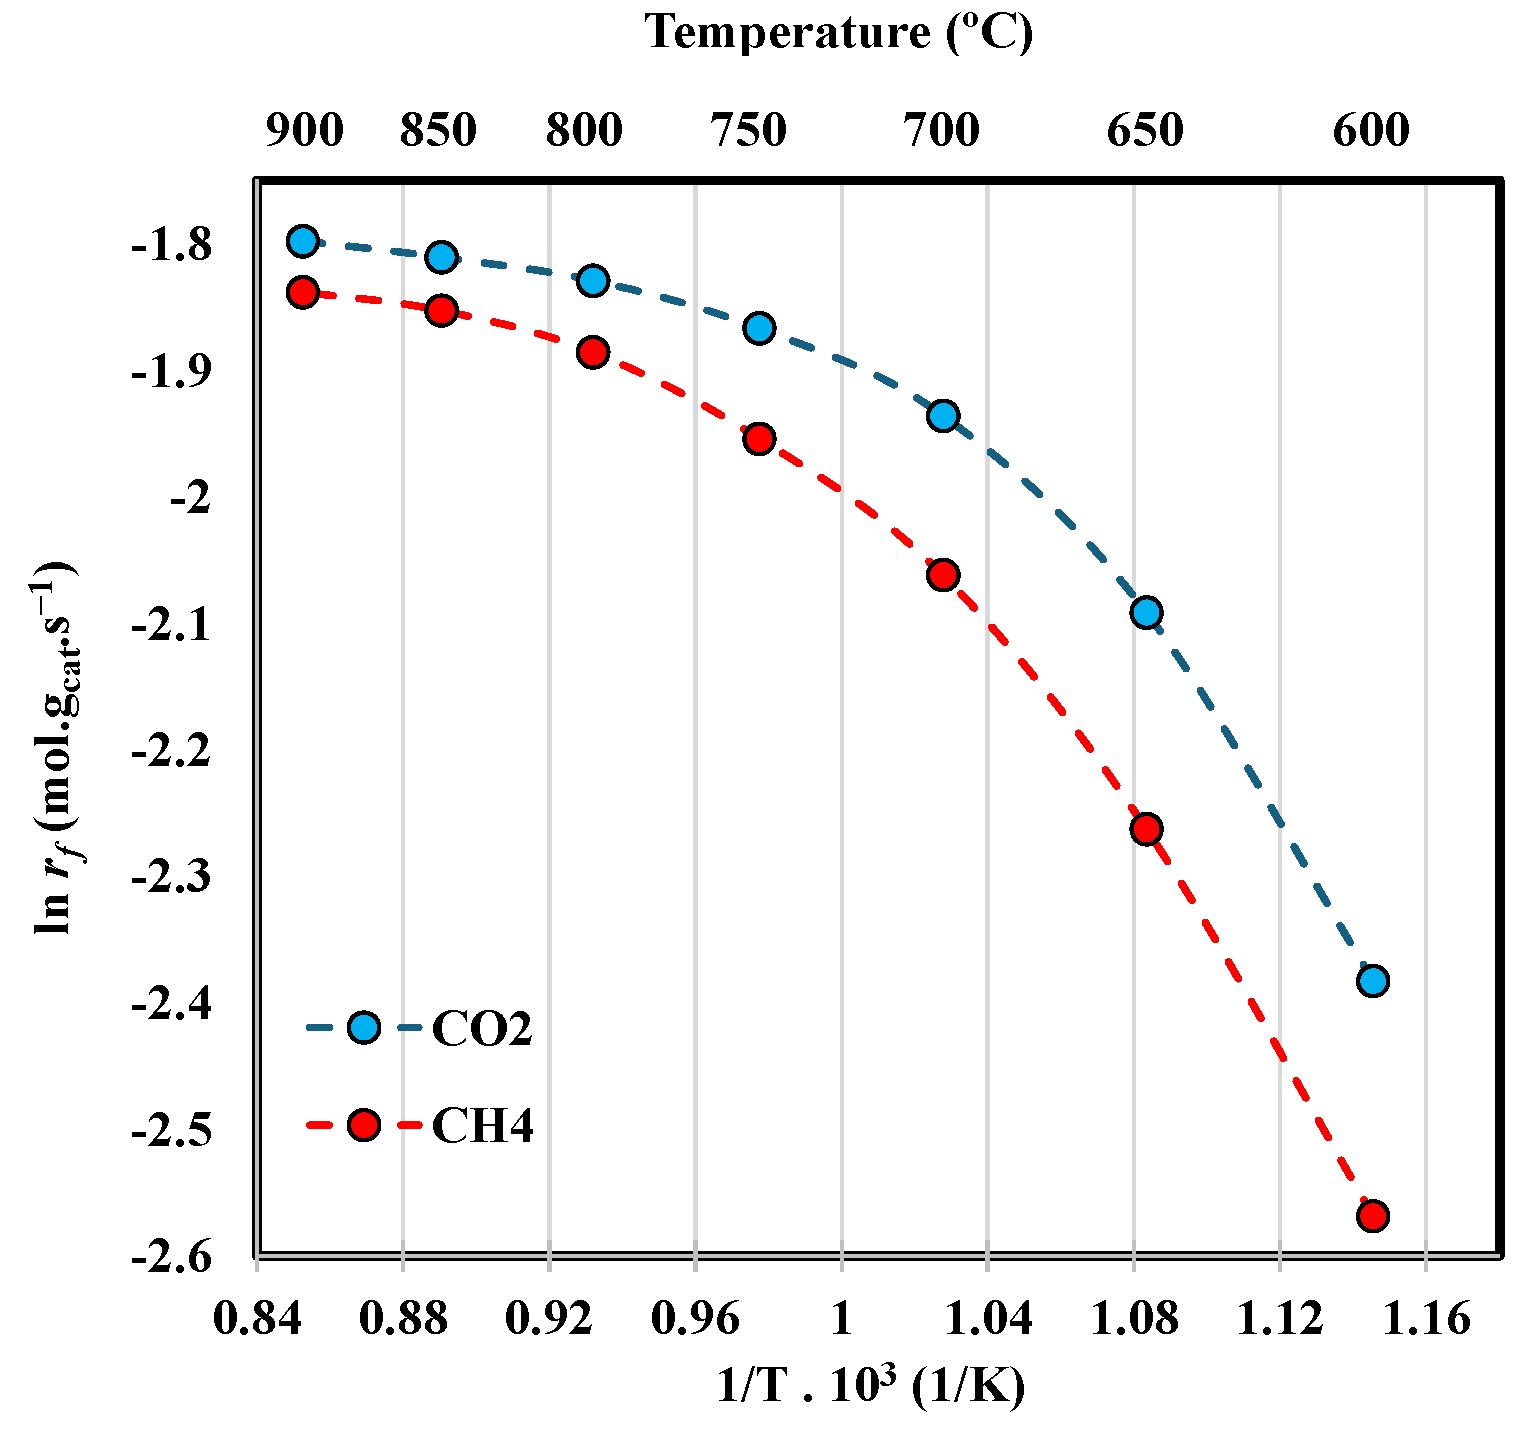
Figure 10 presents the CO2 and CH4 conversions achieved across a reaction temperature range of 600–850 °C for the Ni10LaB8D catalyst, alongside the corresponding carbon deposition rate. For comparative analysis, data obtained with the Ni20LaB8D catalyst at 800 °C are also included, allowing for a joint assessment of the effects of both reaction temperature and nickel loading. It is widely established that reaction temperature is a decisive operational variable in DRM, exerting primary control over process thermodynamics, kinetic rates, syngas selectivity, and catalyst deactivation behavior [8,51]. The conversions results shown in Figure 10 exemplify the aforementioned trends, as it can be seen that increasing the reaction temperature leads to a notable increase in the conversion values. Nevertheless, this parameter is less relevant at temperatures above 700 °C, in part because conversion values are already very high at this point. To examine this trend more clearly, Figure 11 presents an Arrhenius plot of the conversion data. For this representation, the forward rates (rf) for the DRM reaction were calculated based on reactant conversion using the following equation: r f = X C H 4 V C H 4 22400 , where X C H 4 is the CH4 conversion and V CH 4 is the CH4 volumetric flow rate per gram of catalyst (used here as an example for rf of CH4).
As shown in the figure, two distinct temperature intervals exhibit a linear relationship between ln rf and 1/T [58]. The lower temperature interval (600–700 °C) corresponds to the reaction-controlled regime, where the overall reaction rate is limited by the surface chemical reactions, while the higher temperature interval (750–900 °C) indicates the transition of DRM to the kinetically controlled regime, where the rate becomes limited by mass transfer or diffusion of reactants to the catalyst surface.
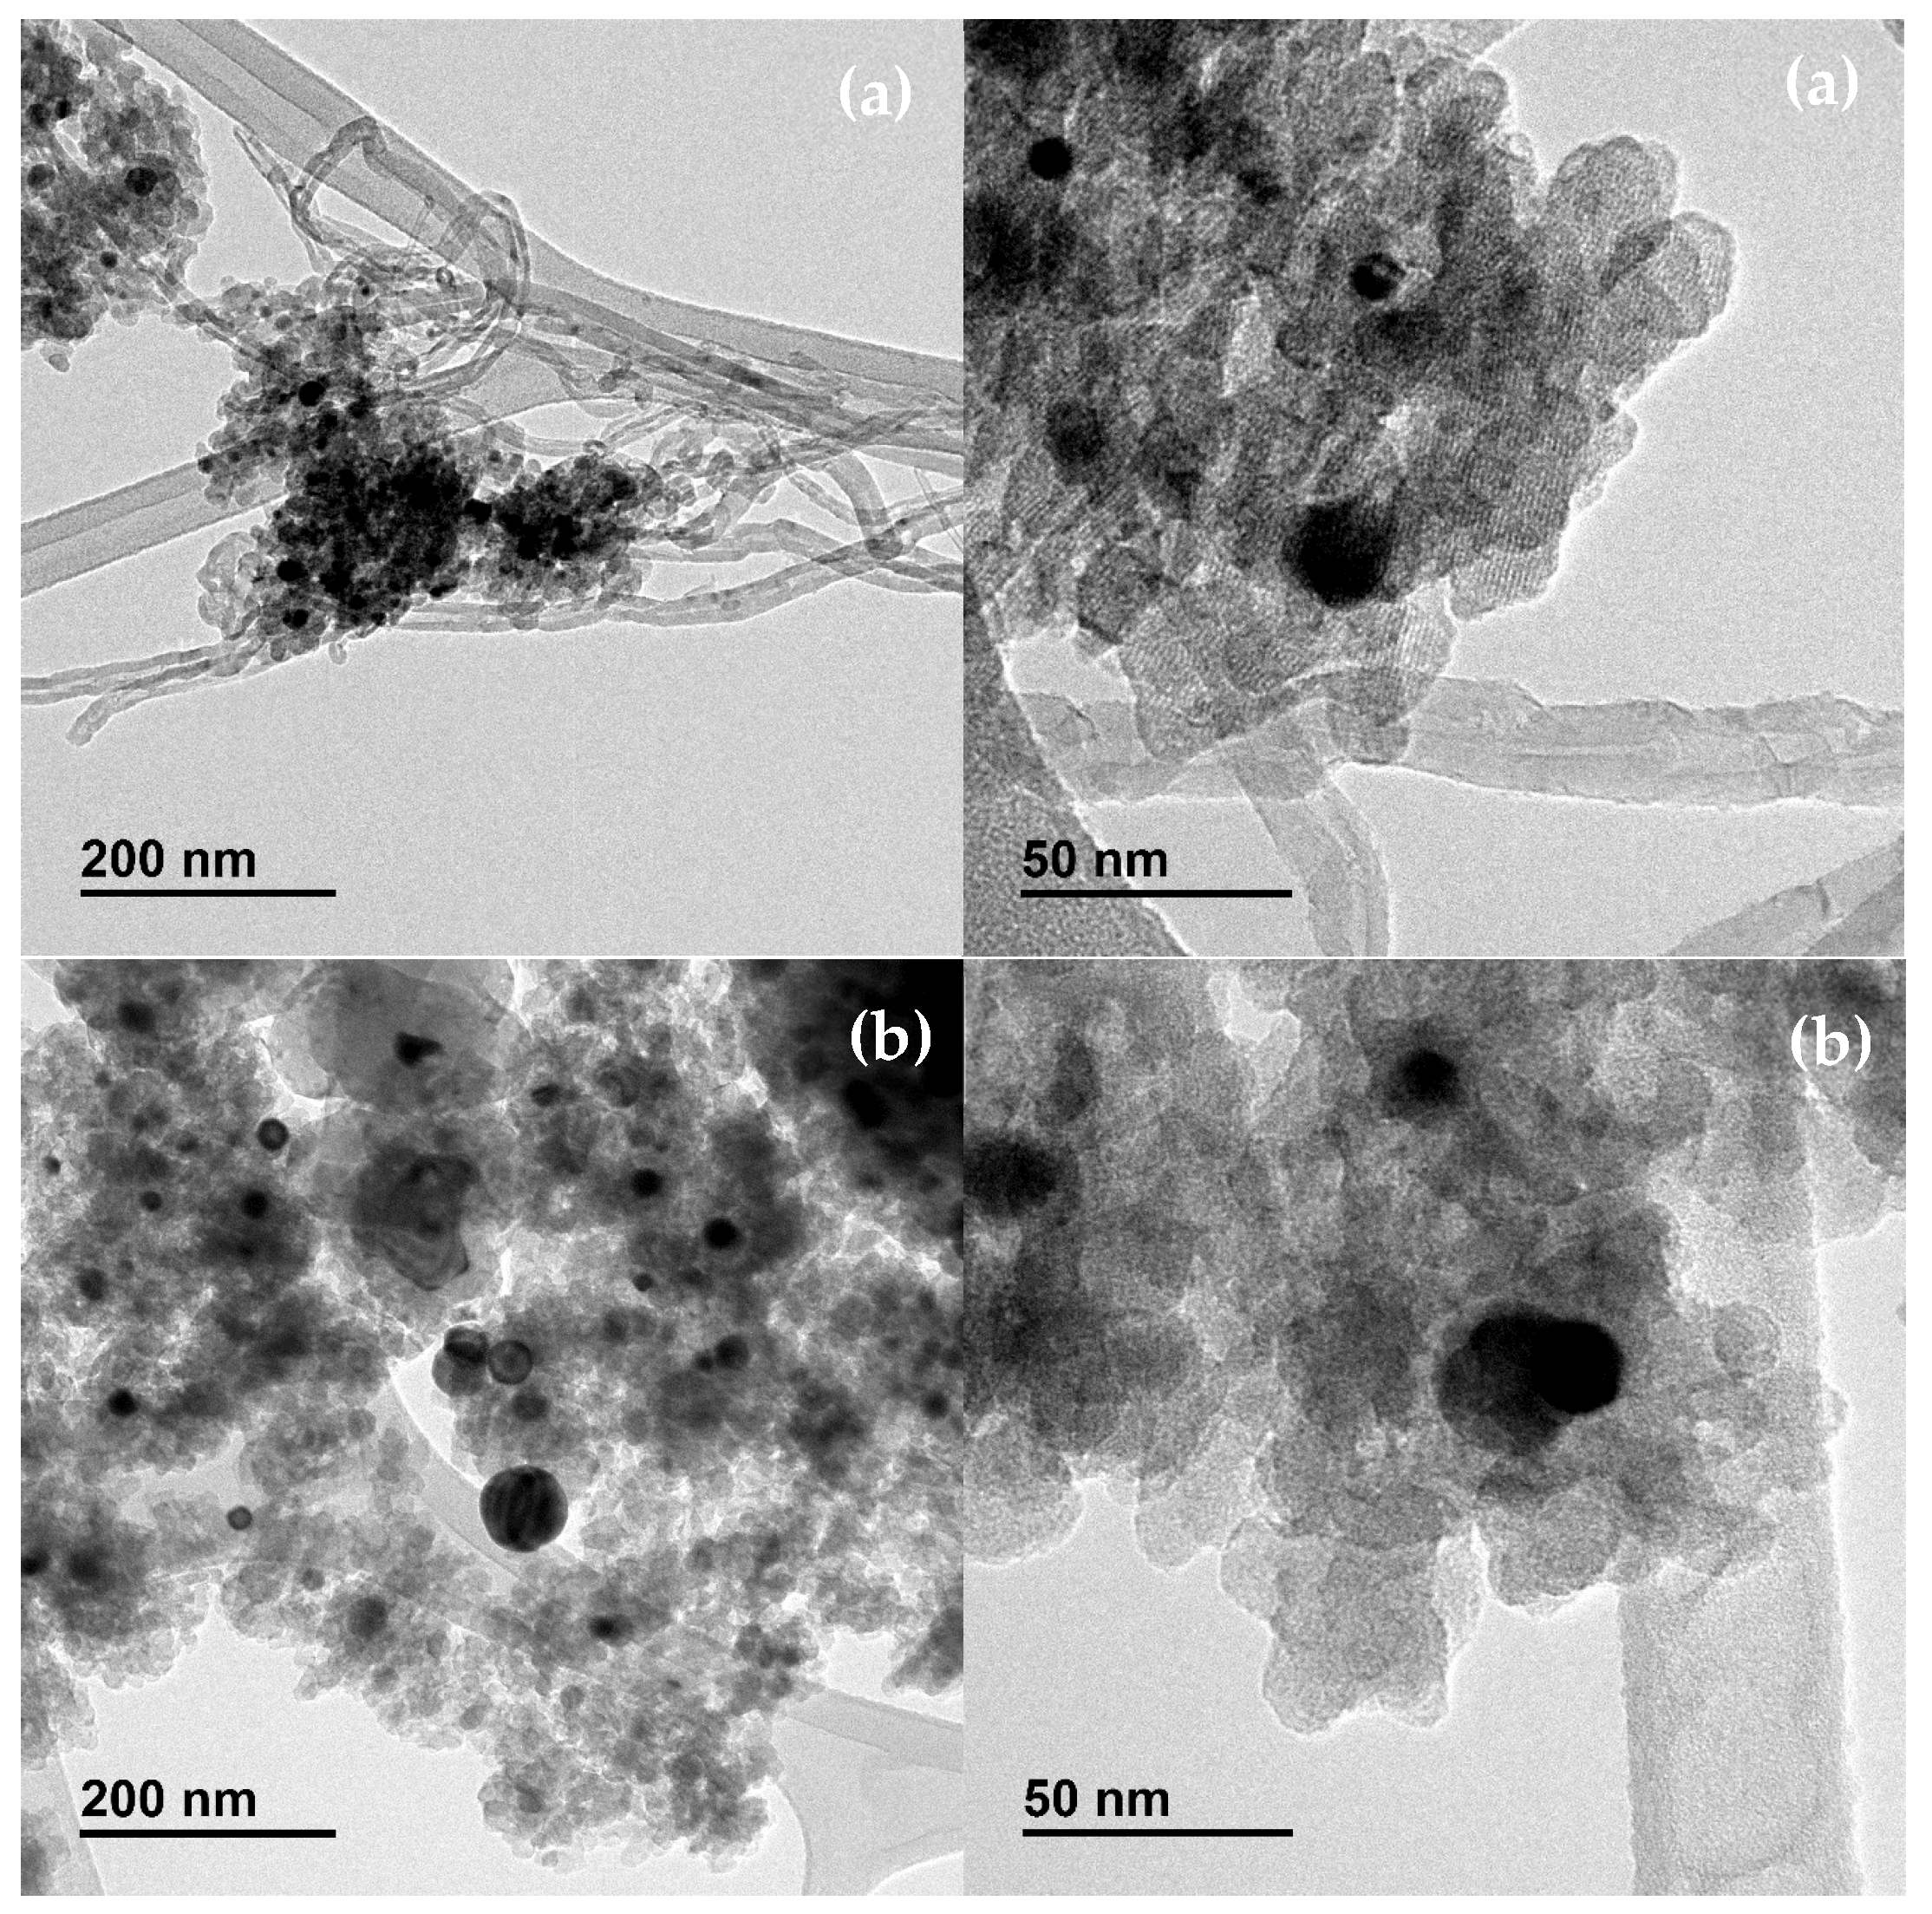
Of greater relevance is the catalyst’s stability under DRM conditions. At the lowest temperature studied (600 °C), the catalyst exhibited significant and progressive deactivation after approximately 20 h on stream. In contrast, an increase in the reaction temperature to 650 °C yielded improved conversion and enhanced stability. However, even at this temperature, a gradual decline in catalytic activity was observed after 70 h. This deactivation is principally attributed to carbon deposition via the Boudouard reaction (2CO ⇌ C + CO2), which is most prevalent within the 400–700 °C range [5,8]. The measured carbon deposits support this mechanism. The spent catalysts were thoroughly characterized to assess carbon deposition. While no deposits were detected at 700 °C by visual inspection or weight changes, TEM analysis (Figure 12a) revealed the presence of only sparse carbon nanotubes (CNTs). This microscopic observation is consistent with other Ni-based perovskite catalysts [59,60]. At 800 °C (Figure 12b), no CNTs are present, due to the more favorable carbon gasification conditions at this temperature.
To assess the morphological changes and the evolution of the active phase, the nickel particle size was evaluated using TEM before and after the reaction. As shown in the micrograph of the fresh Ni10LaB8D-C6 catalyst (Figure 6), the Ni nanoparticles are highly dispersed across the support, displaying a uniform size distribution with estimated diameters ranging between 10 and 20 nm. In contrast, the TEM image of the spent catalyst (Figure 12b) reveals a significant morphological change due to thermal sintering. Although a fraction of small particles remains visible, the formation of much larger spherical Ni aggregates is evident, with particle sizes increasing to approximately 40–80 nm. This agglomeration suggests that the reaction conditions promote the migration and coalescence of the nickel nanoparticles, which is a common phenomenon in supported metal catalysts operating at these temperatures.
Considering all performance metrics—conversion, stability, and deactivation resistance—from a techno-economic perspective, a reaction temperature of 700 °C emerges as the optimal operating condition. It provides high conversion, only 10% lower than that achieved at 850 °C, while maintaining superior long-term stability.
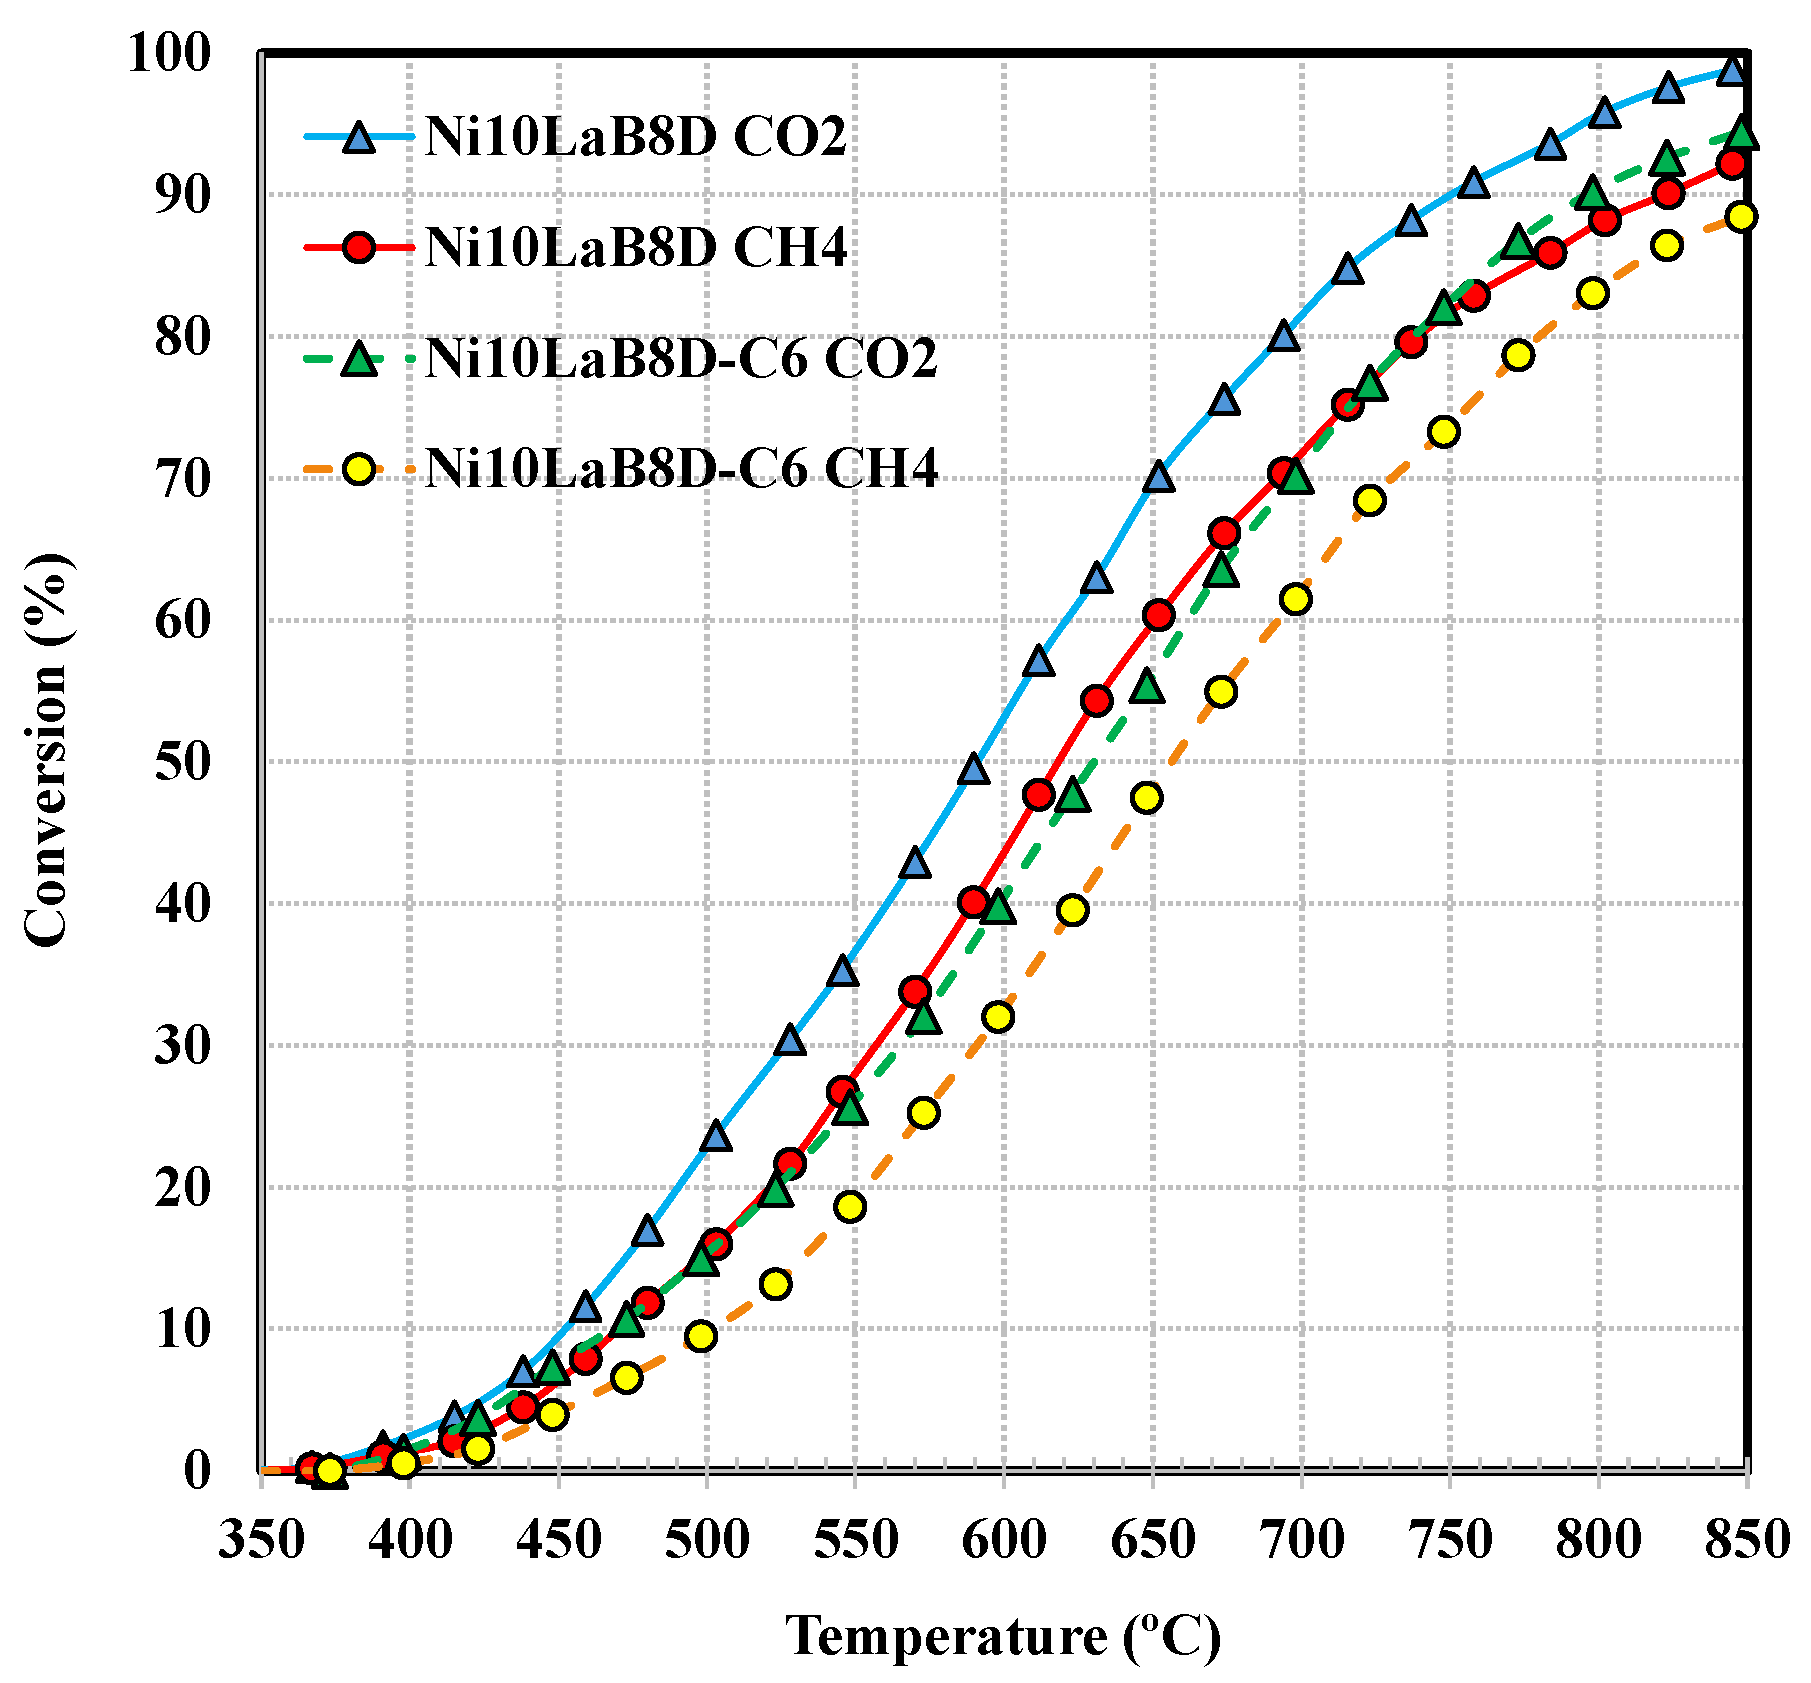
The effect of reaction temperature on conversion was initially studied under isothermal conditions. To complement this, we also performed an analysis under dynamic conditions; the results for the Ni10LaB8D-C6 and Ni10LaB8D catalysts are shown in Figure 13.
As the figure illustrates, measurable conversion begins at approximately 350 °C, with both catalysts exhibiting similar performance at this onset. This is significant given their shared origin from the same impregnated precursor and identical reduction procedure—the sole difference being a prior calcination step for Ni10LaB8D-C6. This comparable low-temperature activity indicates that both catalysts initially possess nickel sites of similar reactivity. However, this trend diverges in the 450–550 °C range, where the non-calcined Ni10LaB8D catalyst becomes more active. At higher temperatures (550–750 °C), the performance difference remains stable, with Ni10LaB8D maintaining a conversion advantage of approximately 10–15%. These results agree with the isothermal experiments (Figure 9), supporting the hypothesis that direct reduction without calcination yields better-dispersed newly formed nickel species. Finally, at the highest temperatures, where mass-transfer limitations dominate, the activity of the calcined catalyst (Ni10LaB8D-C6) approaches that of its non-calcined counterpart.

3.2.4. Effect of Space Velocity on the Dry Methane Reforming

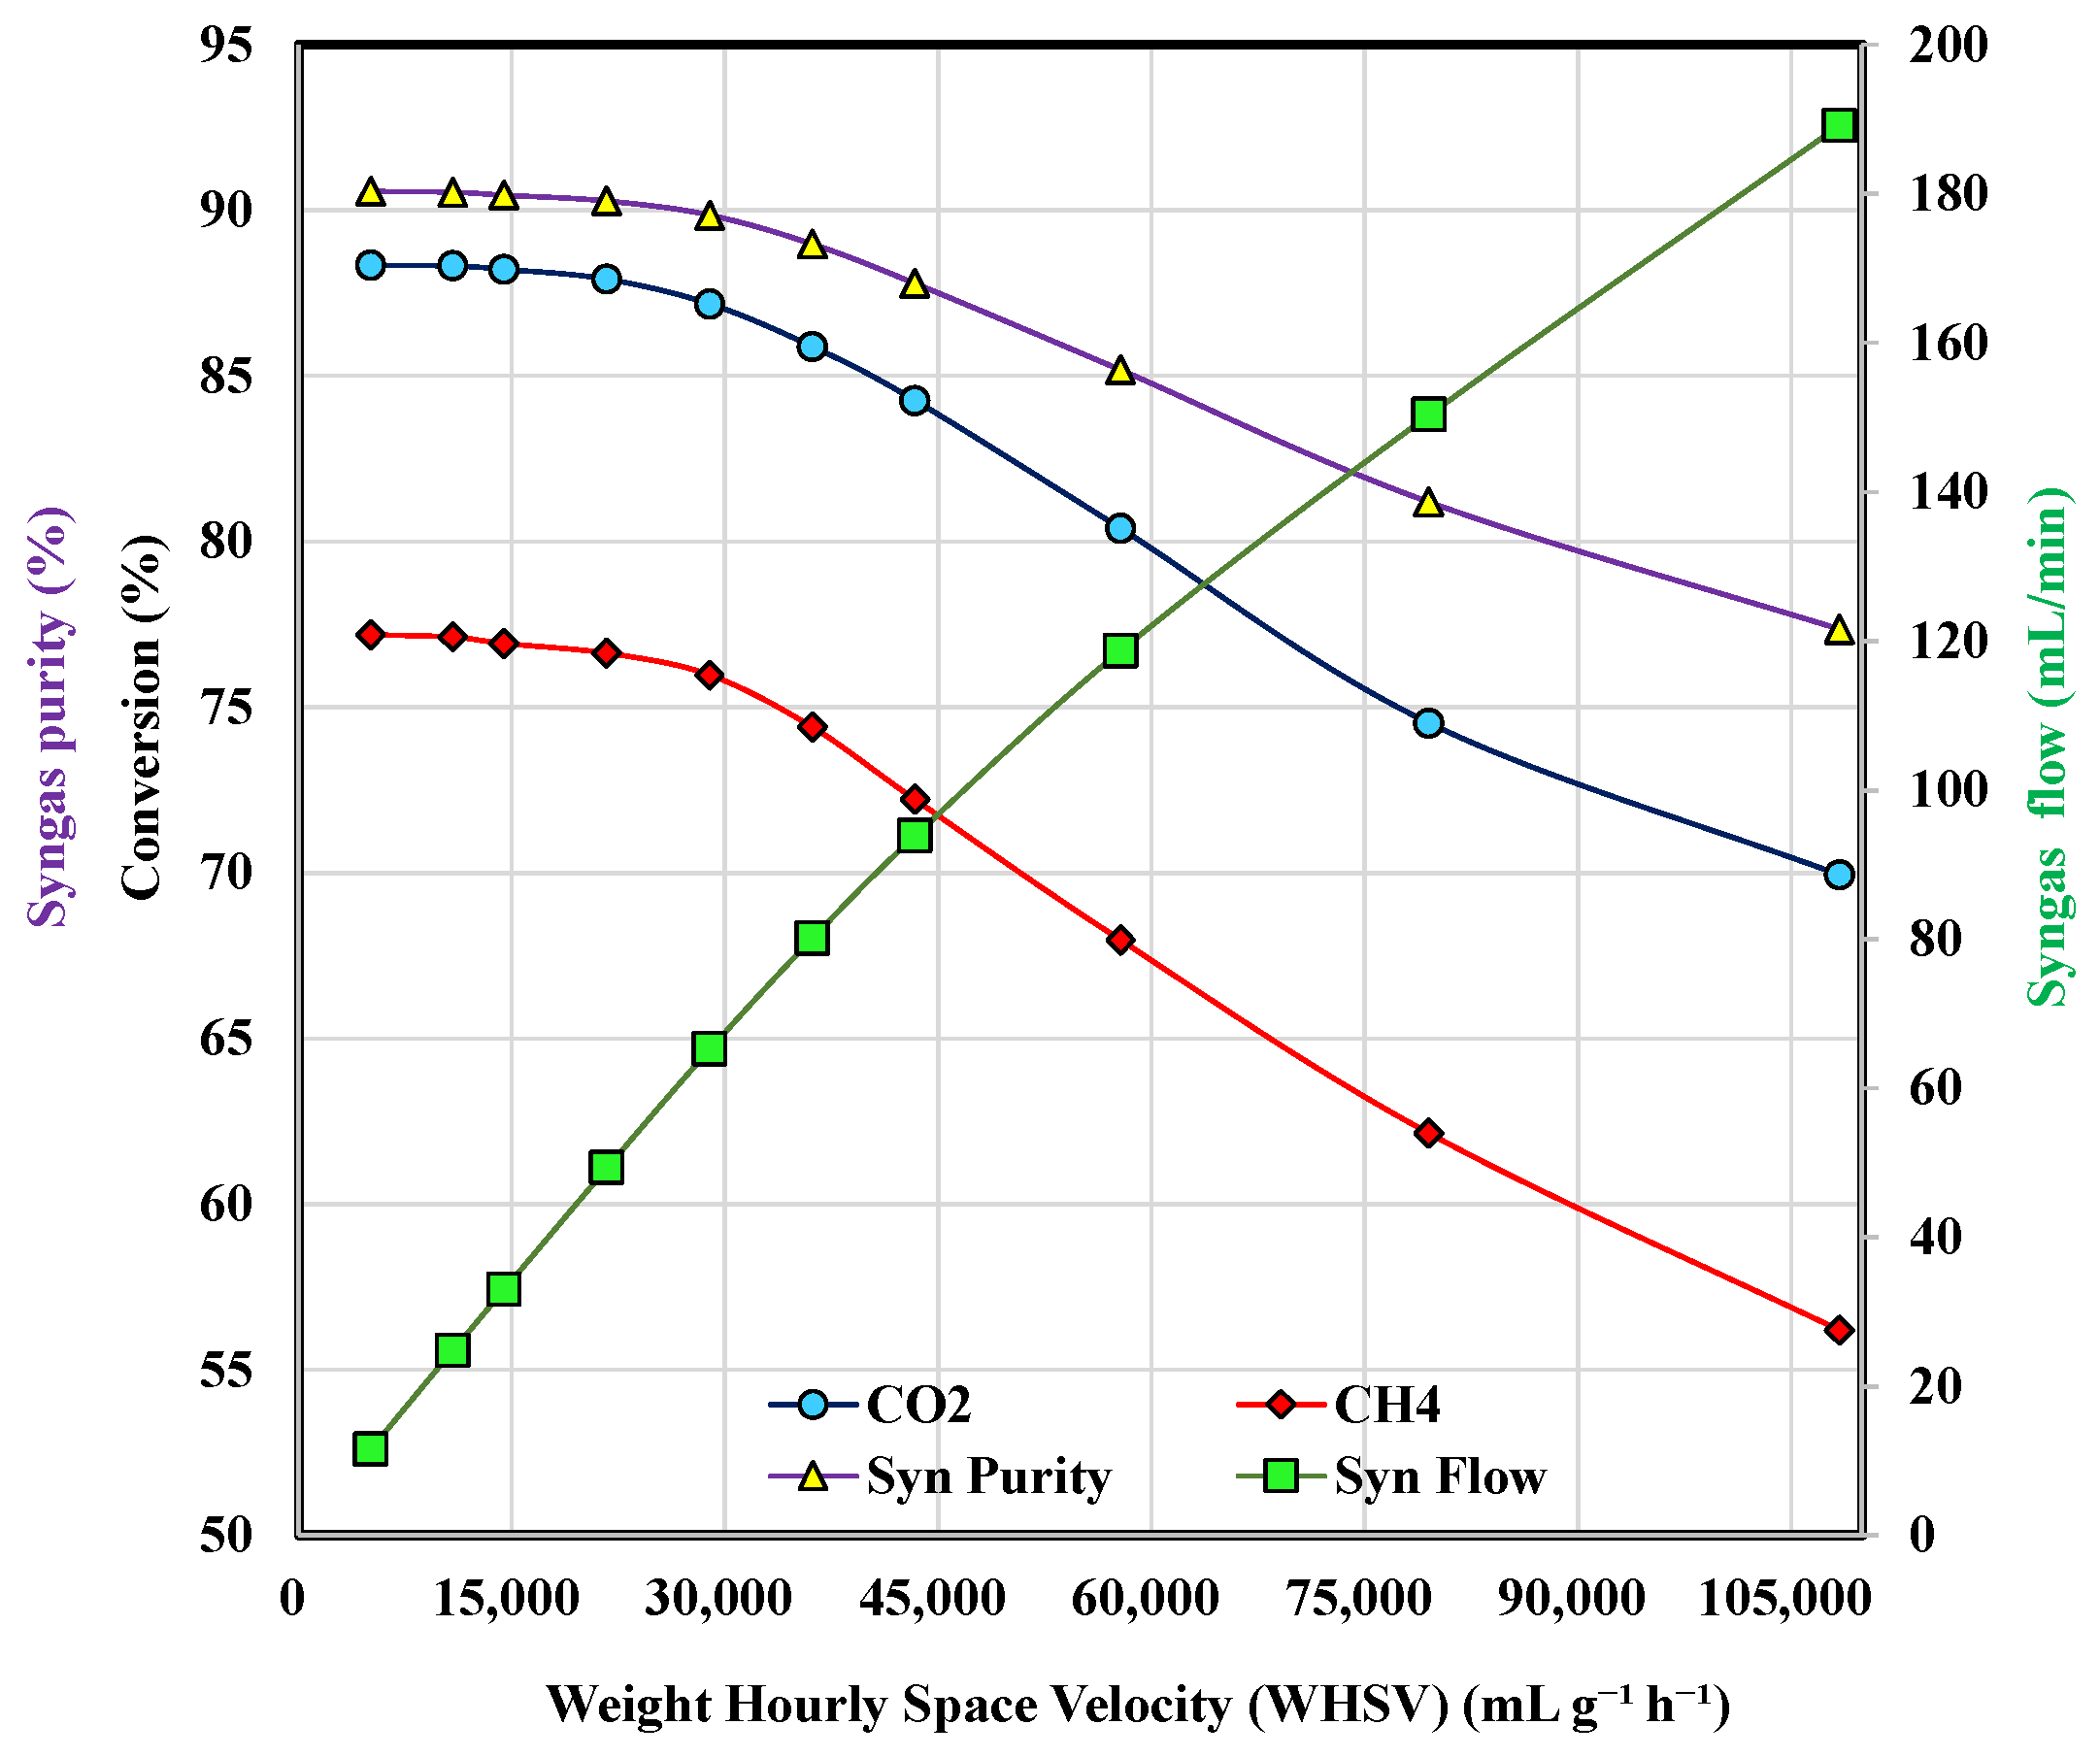
Space velocity (as weight hourly space velocity, WHSV) is a key operational parameter in gas–solid heterogeneous catalysis, as it governs reactant residence time and thereby affects conversion, kinetics, and overall process performance [58]. In the dry reforming of methane, changes in space velocity markedly influence CH4 and CO2 conversions by modifying surface reaction extents and deactivation tendencies [61]. Accordingly, the effect of space velocity on the performance of the Ni10LaB8D-C6 catalyst was assessed, with the results shown in Figure 14.
As observed, the conversion values remain essentially constant up to approximately 20,000 WHSV (30 mL/min under our experimental conditions), where the highest conversions are achieved. This behavior reflects the comparatively longer residence time and the higher ratio of catalytic active sites to reactive molecules characteristic of this initial WHSV interval. Beyond this point, increasing WHSV leads to a gradual decrease in conversion, with reductions of 21% and 26% in CO2 and CH4 conversion, respectively, at 108,000
WHSV relative to 20,000 WHSV. This decline is attributed to the shorter residence time at higher WHSV and the larger proportion of feed gases per catalytic center, which allows a portion of the feed to pass through the catalyst bed unreacted. A similar decrease in conversion at higher space velocities has been widely observed in catalytic packed- bed reactors, where increases in the WHSV or gas flow rate reduce residence time and thus conversion levels for a fixed catalyst mass [61,62]. Hence, from a conversion standpoint, 20,000 WHSV appears to be the most appropriate operating condition.
However, the most practically relevant factor is the production rate of the desired products, CO and H2. Figure 14 shows the syngas flow, calculated as the sum of the CO and H2 flows at the reactor outlet. The syngas flow increases with increasing WHSV. Although conversion decreases at higher WHSV, the higher volumetric feed flow compensates for this, resulting in a higher production rate per unit time [63]. However, the lower conversion also leads to an increase in unreacted gases, reducing the purity of the product effluent. This is represented in Figure 14 as syngas purity, defined as the ratio of the syngas volume flow to the total reactor outlet flow (expressed as a percentage on a dry basis). Syngas purity follows a trend similar to conversion: it is highest at low WHSV and remains stable while conversion is stable. As the WHSV increases, both conversion and syngas purity decrease, although the reduction in syngas purity is smaller. For instance, at 108,000 WHSV compared to 20,000 WHSV, syngas purity decreases by approximately 14%, while average conversion drops by about 23%. To enhance the efficiency of the dry reforming of methane process, unreacted gases must be separated from the product stream using pressure swing adsorption (PSA) [64], membrane technologies [65], or a combination of both [66] as an integral part of the process design. These results suggest the existence of an optimal WHSV window, balancing higher syngas production with purification costs. This optimal operating point depends on several factors, including the cost of the DRM reactor and the associated gas purification systems. In any case, as an approximation, in this work a WHSV of 58,000 mL/g·h was selected, considering that the purity of the syngas stream decreased by only about 5% relative to the maximum value, while its production increased by approximately 100%.

3.2.5. Effect of Effluent Composition on the Dry Methane Reforming

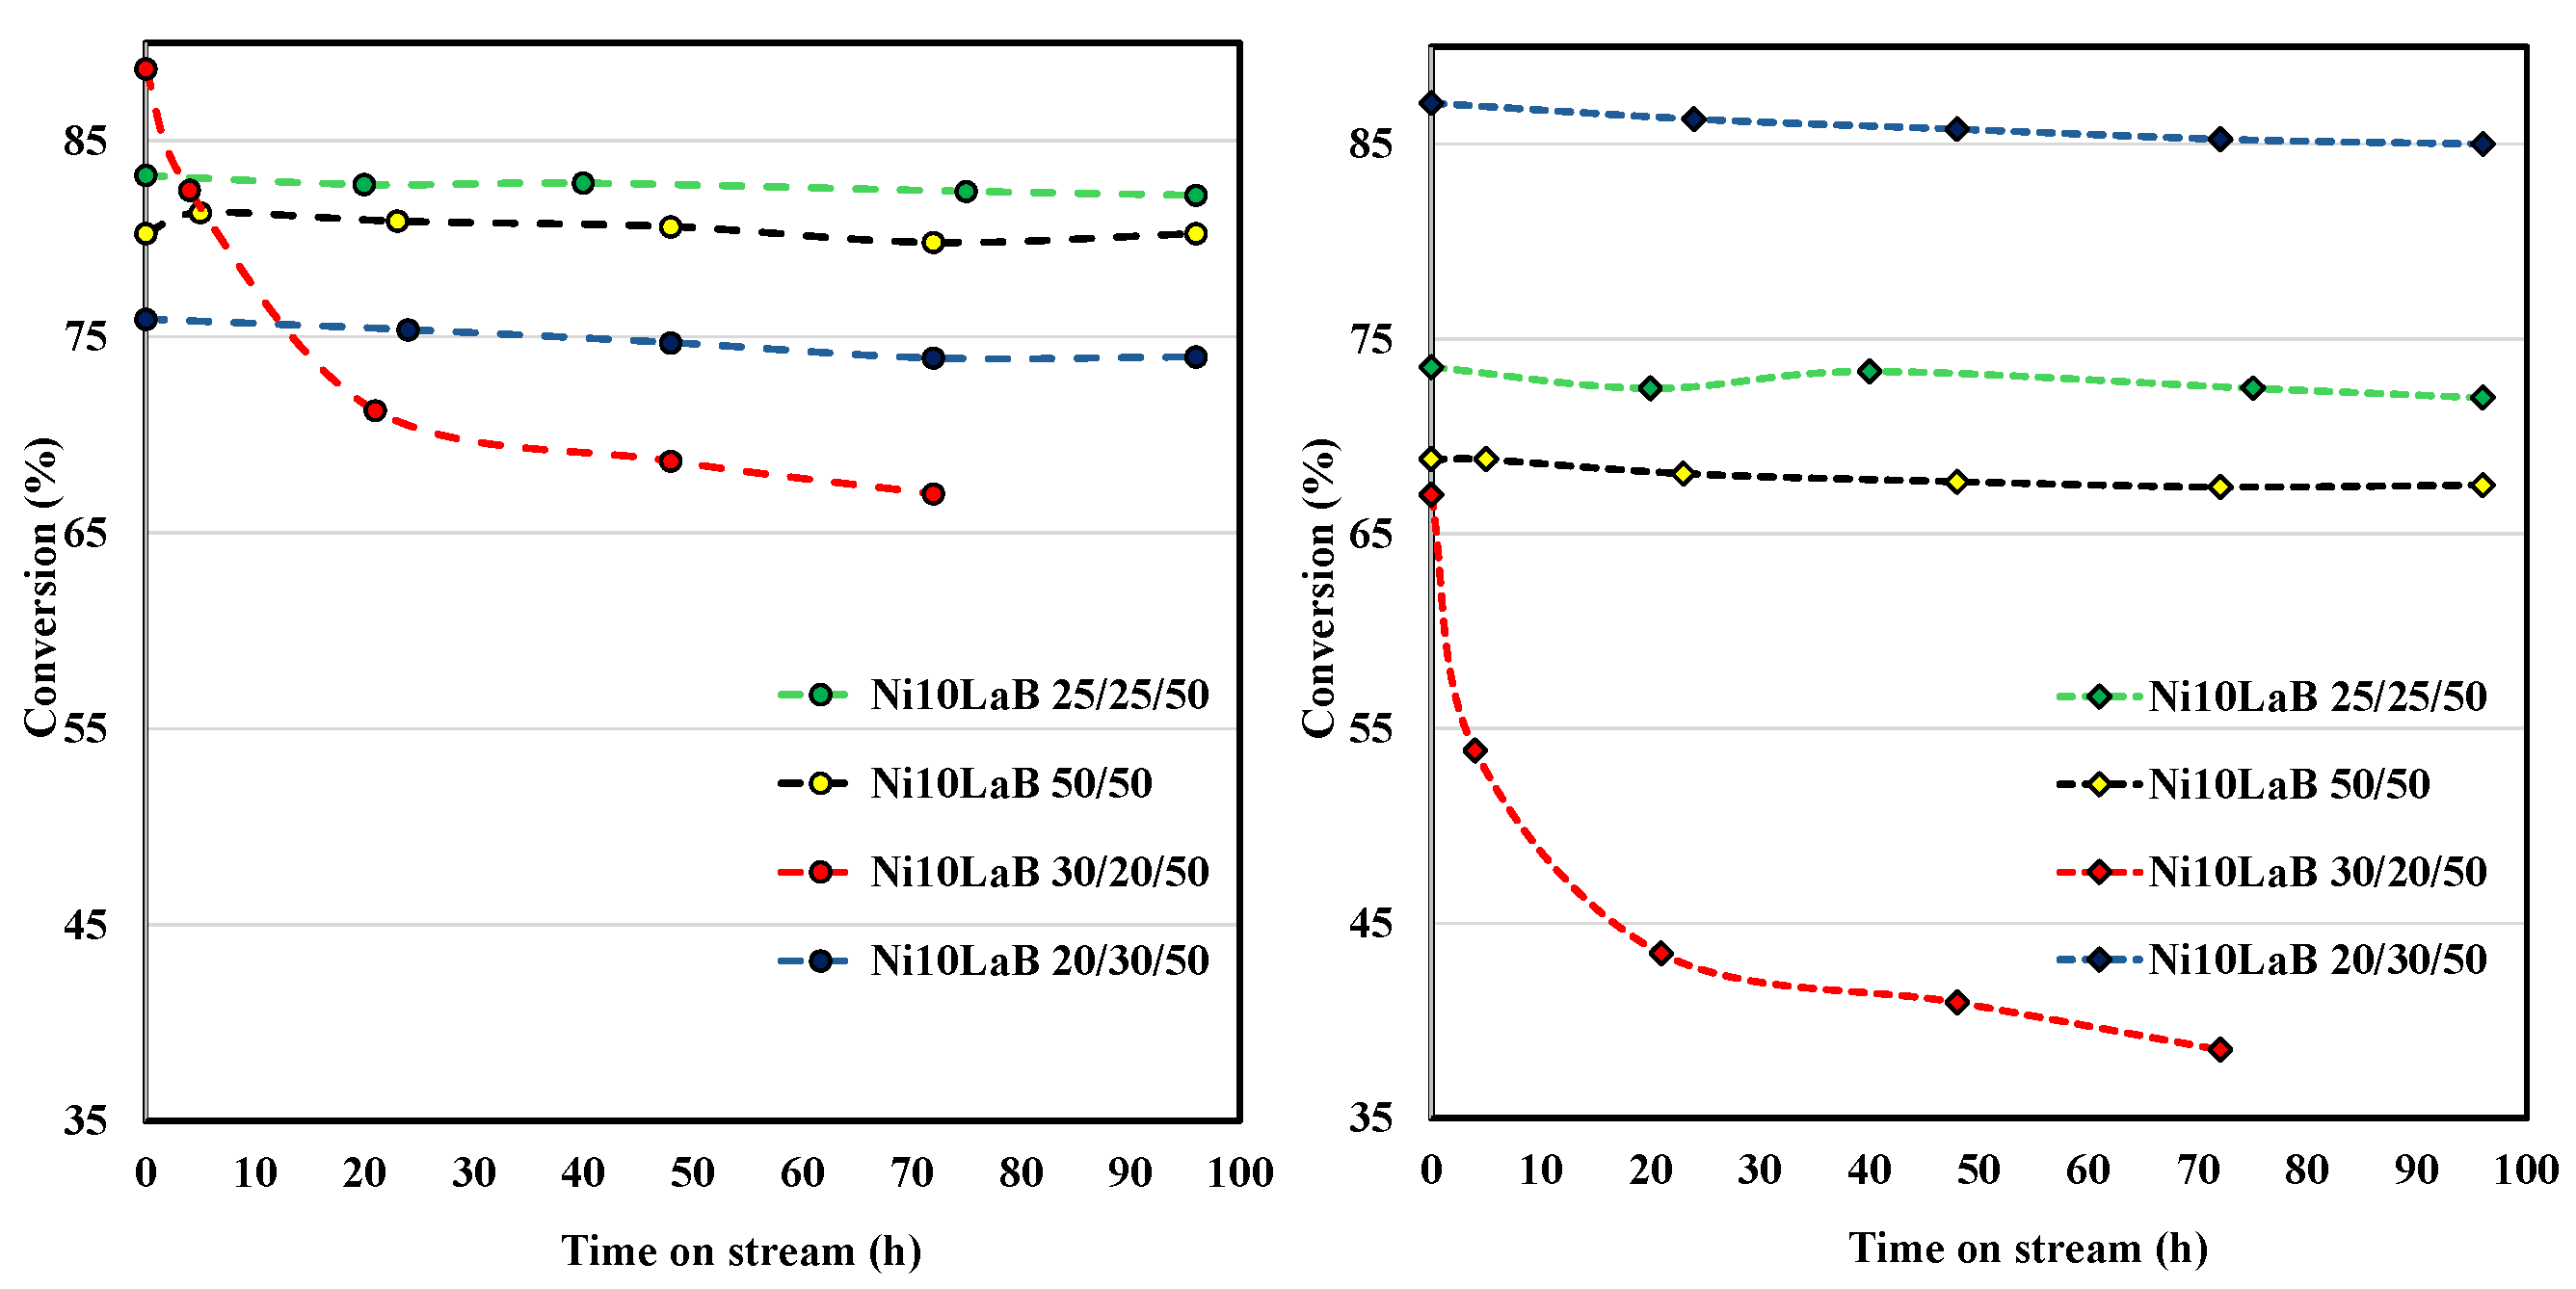
The influence of feed composition (CH4/CO2 ratio and dilution) on catalytic activity was assessed at 700 °C on the Ni10LaB8D-C6 catalyst. To this end, four distinct gas mixtures (CH4/CO2/He, vol%) were investigated: 25/25/50, 30/20/50, 20/30/50, and a stoichiometric, undiluted 50/50/0 mixture. The corresponding conversions of CO2 and CH4 as a function of time on stream are presented in Figure 15. In fundamental research on dry methane reforming, reactive gases are typically diluted with He to enable precise kinetic measurements, minimize temperature and concentration gradients, and ensure reliable gas-phase analysis [8]. For this reason, in this work, all catalytic tests described above were performed with a 50% He dilution, using a stoichiometric CH4/CO2 feed. Moreover, the lower methane partial pressure in such diluted mixtures helps suppress carbon deposition and thereby reduces catalyst deactivation by coke formation—an effect that, although useful for obtaining clean kinetic data in fundamental research, does not reflect the coking behaviour likely to occur under industrial conditions, where the reactants are not diluted. To analyze this, a catalytic test was carried out on the Ni10LaB8D-C6 catalyst using a stoichiometric CH4/CO2 feed without He dilution (Ni10LaB 50/50). As shown, even though the concentration of reactant gases in this test is twice that of the diluted experiment, the catalyst exhibits comparable catalytic activity and stability. More importantly, after 96 h of DRM under these undiluted conditions, no carbon deposition is observed on the catalyst, indicating that the catalyst maintains its performance even under conditions closer to those expected in industrial operation.
Biogas, with a typical composition of approximately 60% methane and 40% carbon dioxide, is a promising renewable feedstock for dry methane reforming [4]. Accordingly, we evaluated the catalyst under a simulated biogas composition (Ni10LaB 30/20/50). As expected, the initial conversions of CO2 and CH4 differ significantly, in line with Le Chatelier’s principle: CO2, being present in substoichiometric proportions, exhibits higher conversion (compared to Ni10LaB 25/25/50), whereas CH4, in excess, shows lower conversion. More interestingly, the catalyst undergoes rapid deactivation during the first 20 h of reaction, after which its activity stabilizes, showing only moderate deactivation over longer reaction times. This behaviour can be attributed to initially rapid carbon deposition: the excess of CH4 relative to CO2 leads to carbon formation from CH4 cracking that cannot be fully removed by gasification with CO2 [4,67]. However, carbon deposition was not detected on the spent catalyst, neither by the reactor’s weight difference nor by TEM, where no carbon nanotubes were observed. According to Wang et al. [68], these results can be explained by the formation of a two-dimensional carbon layer on the Ni nanoparticles, which partially covers and deactivates the active sites, accumulating significantly only in CO2-deficient conditions, as in this case. Initially, higher CH4 decomposition on the catalyst leads to carbon layer formation, much of which cannot be removed, reducing the number of available catalytic sites. After 20 h, CH4 and CO2 conversions approximately balance, reaching a dynamic equilibrium between carbon formation and gasification, preventing further rapid loss of catalytic activity.
Building on the previously identified interplay between CO2 and CH4 in carbon deposition phenomena, the subsequent stage of this study involves a detailed assessment of the catalytic activity and stability under CO2-rich conditions. Thermodynamic analyses indicate that at a CO2/CH4 molar ratio of 1.5, carbon deposition is significantly suppressed at 700 °C [67]. The time-on-stream conversion profiles obtained under CO2-excess conditions for Ni10LaB (20/30/50) corroborate these predictions, showing stable conversion levels throughout 96 h of continuous operation.
The conversion behaviour observed under these conditions is particularly noteworthy. As previously documented for CH4-excess operation with Ni10LaB (30/20/50), CH4 consistently exhibits the highest conversion across all evaluated conditions, a trend that can be explained by Le Chatelier’s principle. Under CO2-rich conditions, CH4 conversion reaches 87%, representing an increase of 19% relative to the stoichiometric feed. Comparable findings have been reported by Sophiana et al., who demonstrated that a CO2:CH4 feed ratio of 70:30 leads to higher CH4 conversion compared to a 50:50 ratio (97.10% vs. 79.01%) [62].
Additionally, despite the higher CO2 content in the feed, its conversion remains substantial—approximately 75%—which is significant considering its higher inlet fraction (30 vs. 25). Consequently, the overall conversion (CH4 + CO2) attains 79.2% for the CO2-rich feed, compared with 77.7% for the stoichiometric case. This difference is reflected in the reactor effluent composition, which contains 11.6 vol.% of unreacted CO2 and CH4 under CO2-excess conditions, in contrast to 12.5 vol.% for the stoichiometric feed. This reduction implies a slightly lower separation requirement downstream. In fact, in dry reforming processes the outlet gas stream typically contains unreacted reactants that must be separated and recycled or purified in subsequent unit operations to obtain the desired syngas composition and product purity, introducing additional process steps and associated costs [69]. Taken together, these results indicate that operating with a CO2-rich feed is beneficial for the overall performance of the process, as it improves conversion levels, helps suppress carbon deposition, and slightly reduces the concentration of unreacted gases in the effluent.

3.3. Process Design and Scale-Up for DRM

The industrial potential of DRM has stimulated extensive research on catalyst optimization and the scale-up of laboratory findings to commercially relevant systems [69,70,71]. Numerous semi-pilot and pilot-scale studies have been conducted to assess the process’s technical robustness and economic viability.
Concurrently, the utilization of waste-derived feeds such as biogas has attracted growing attention due to its contribution to process sustainability [70,71,72,73]. This strategy aligns with Spain’s ecological transition objectives, which aim to establish the country as a leading producer and user of hydrogen within the European Hydrogen Strategy framework. In this context, biogas-derived hydrogen (or syngas) constitutes a viable alternative for sectors where water electrolysis remains economically constrained.
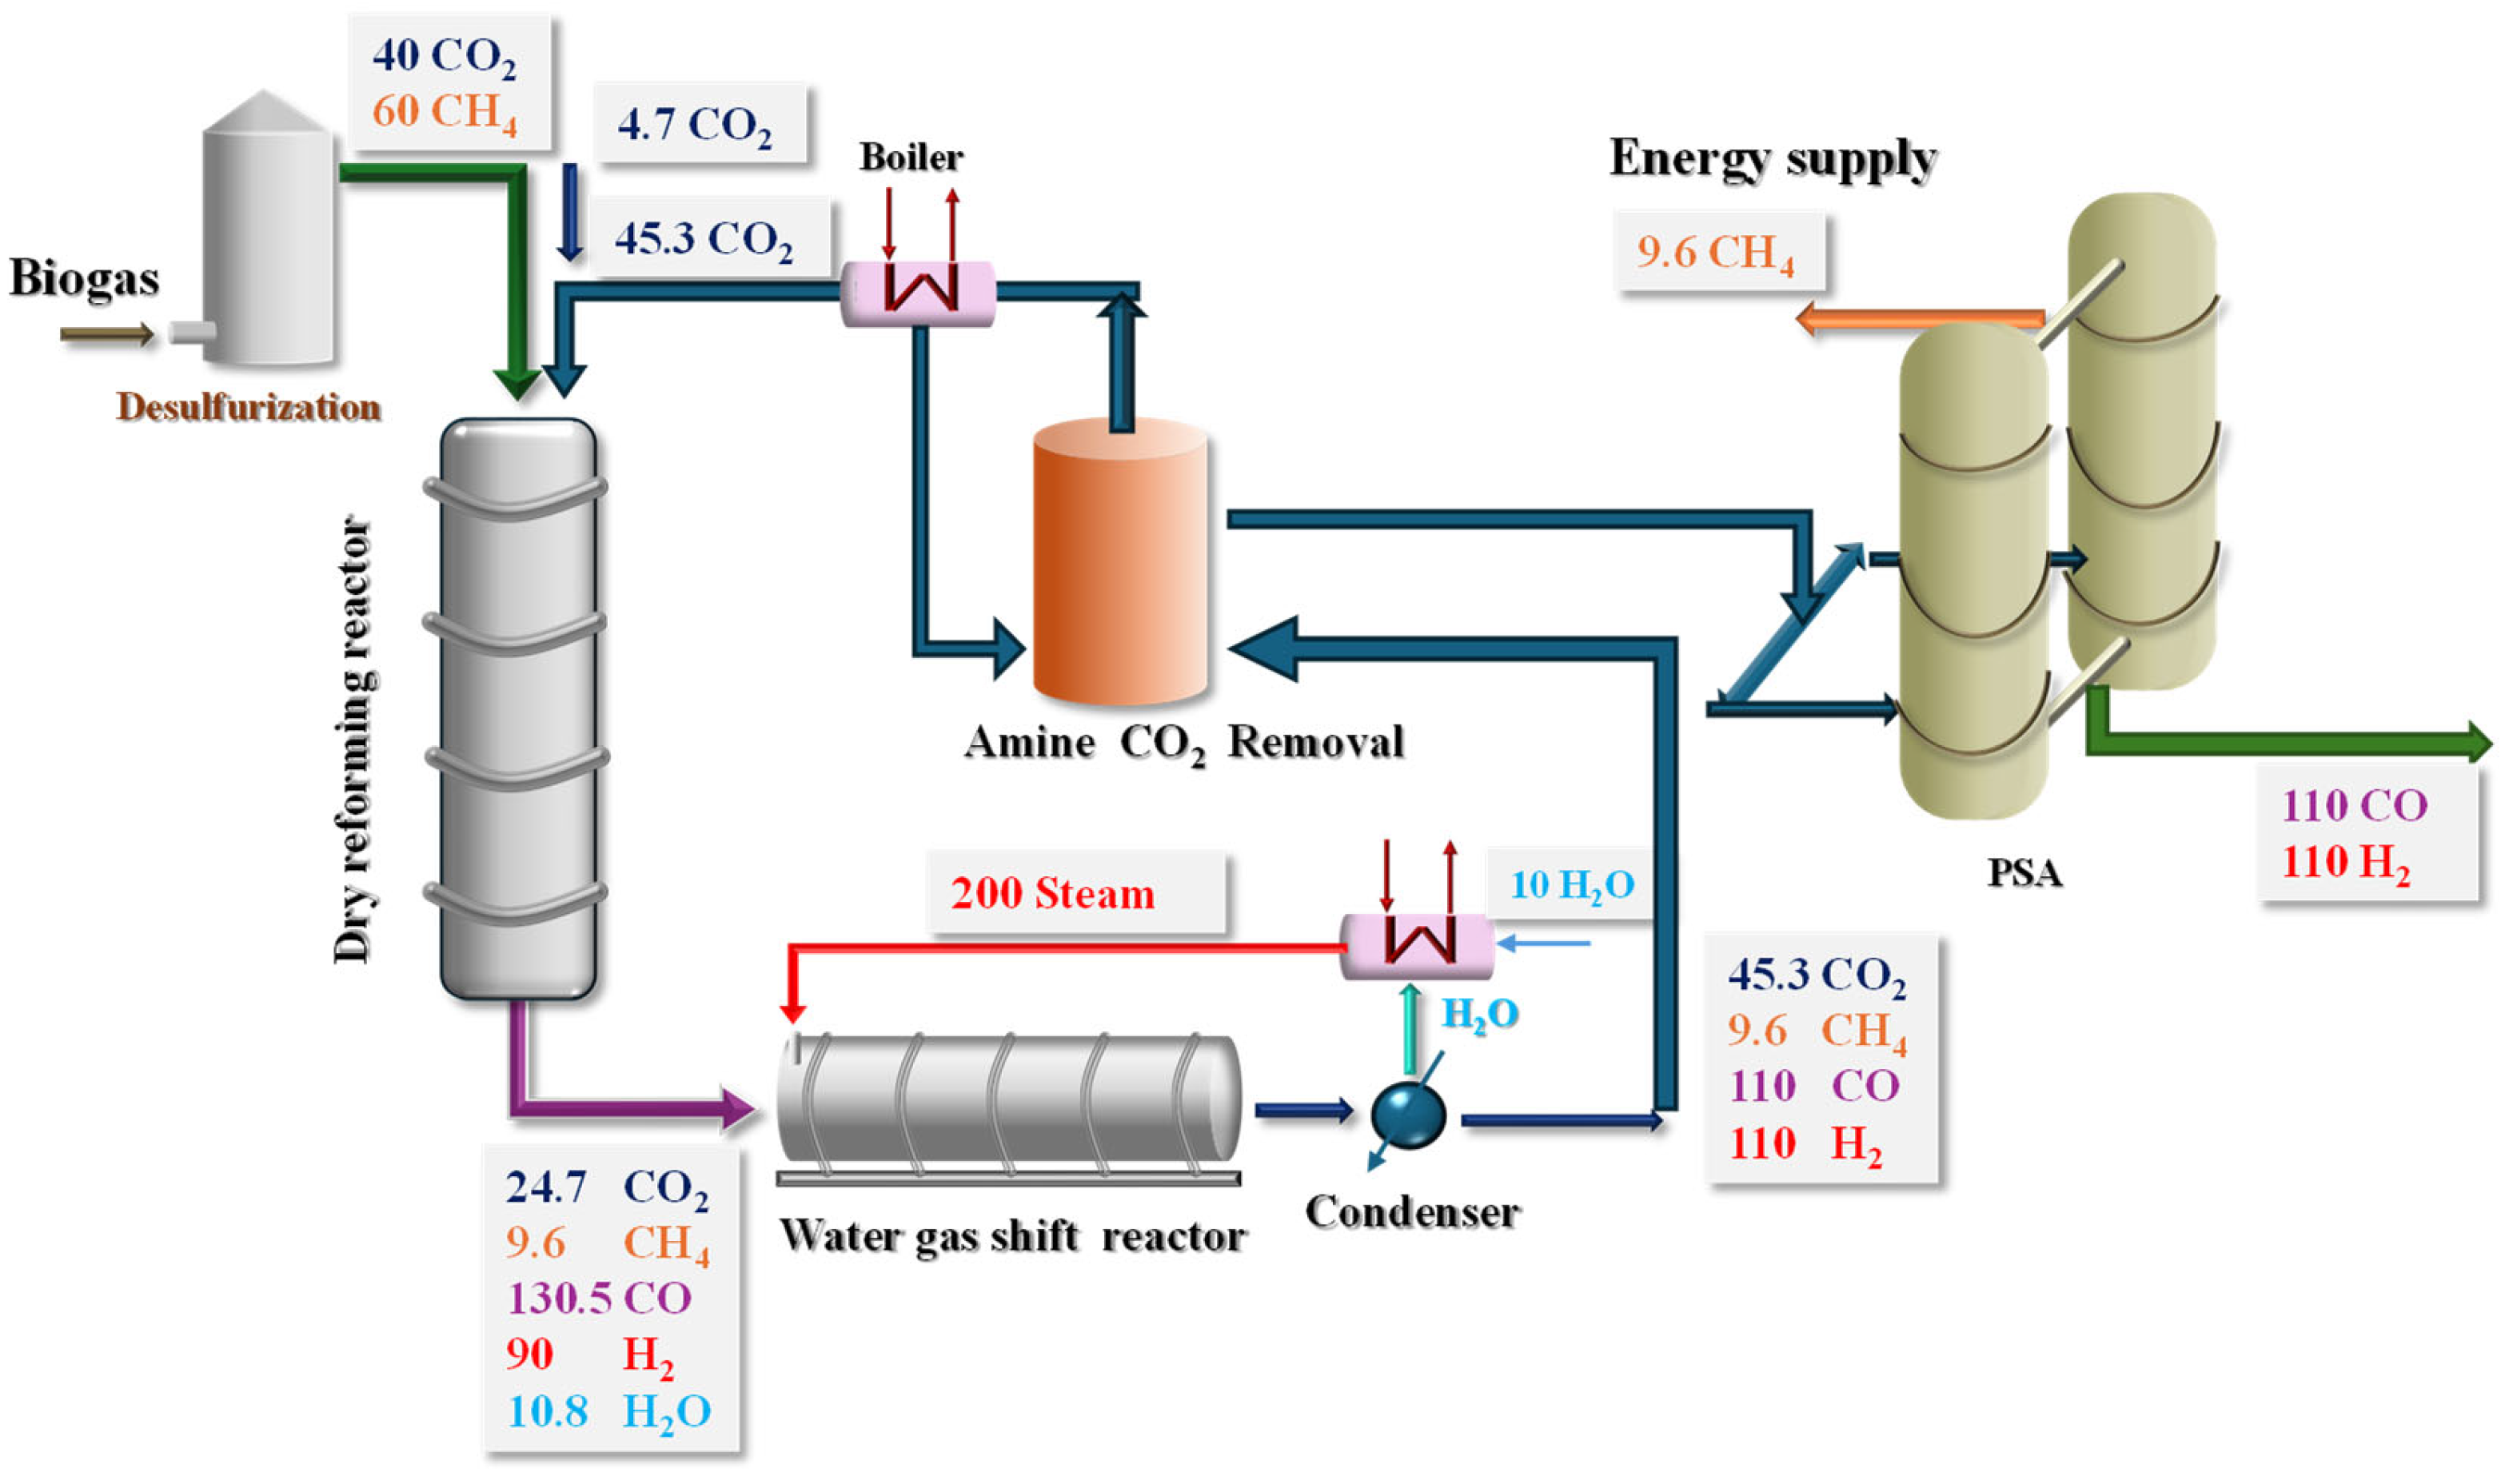
Based on the findings of this work, Figure 16 presents a conceptual Process Flow Diagram (PFD) for an industrial-scale dry methane reforming unit operating under the optimal conditions identified: Ni10LaB8D catalyst, a CH4/CO2 feed ratio of 40/60 vol%, WHSV of 58,000 mL·g−1·h−1, and a reaction temperature of 700 °C. In addition to the primary DMR reactor, the PFD incorporates a water–gas shift (WGS) unit—routinely implemented in reforming schemes to adjust the H2/CO ratio to a value of unity—along with amine-based CO2 capture systems and pressure swing adsorption (PSA) modules [69,70,71,72]. These downstream operations enable effective CO2 removal and the production of high-purity syngas suitable for subsequent conversion or utilization pathways.
As discussed in Section 3.2.5, direct reforming of biogas with a CH4/CO2 ratio of 60/40 vol% is inherently limited, resulting in incomplete methane conversion and rapid catalyst deactivation. To overcome these limitations, the biogas feed was enriched with CO2 by adding 50 additional volumes to the original mixture (60 volumes CH4 + 40 volumes CO2), achieving an overall CO2/CH4 ratio of 1.5.
The DRM reactor effluent, characterized by a low H2/CO ratio, was subsequently treated in a water-gas shift (WGS) reactor under a substantial H2O excess (200 volumes), effectively adjusting the H2/CO ratio to unity. The resulting syngas was then dried, with the majority of H2O recycled to the system, producing a high-purity stream (~80%). CO2 was removed and recycled to the DRM reactor in quantities closely matching the initial enrichment; remarkably, once the system reaches steady-state operation, only a minor supplementation of 4.7 volumes of CO2 is required to sustain optimal performance.
To bridge the gap between the experimental core of this study and the conceptual PFD, the mass balance depicted in Figure 16 was developed based on the following key assumptions:
  • Basis Flow: The scheme assumes an arbitrary basis of 100 volumetric units of raw biogas feed (consisting of 60 volumes CH4 and 40 volumes CO2).
  • Reactor Conversions: The conversions in the DRM reactor directly reflect the steady-state experimental results obtained with the optimal catalyst: ~84% conversion for CH4 and ~72.5% for CO2.
  • WGS Performance: The WGS reactor assumes the conversion of ~20.5 volumetric units of CO into H2, successfully tuning the final H2/CO molar ratio to 1.0.
  • Separation Efficiencies: For the sake of this conceptual scheme, ideal separation efficiencies (~100% recovery) are assumed for the downstream units. The amine unit perfectly recovers the 45.3 volumes of unreacted/produced CO2 for the recycle loop, while the PSA unit effectively isolates the 9.6 volumes of unreacted CH4 (routed for energy supply) from the final high-purity syngas stream (110 volumes CO + 110 volumes H2).
The results underscore a significant departure from conventional steam methane reforming, which typically generates substantial CO2 emissions. In contrast, the present approach achieves a net CO2 consumption across the entire process, highlighting its potential as a more sustainable and efficient route for syngas production.

4. Conclusions

Ni-Beta catalysts perform efficiently in dry reforming of methane (DRM), exhibiting competitive conversions and good stability. The optimal Ni loading is 10 wt.%, balancing activity, stability, and economic feasibility. H2-TPR analysis shows that Ni incorporates gradually into the Β-zeolite, initially occupying high-interaction SMSI sites (likely exchangeable H+), and then depositing on external surfaces and within pores as loading increases, explaining the dependence of performance on Ni content.
Pretreatment significantly influences catalytic behavior. TG/DTA analyses of the directly reduced Ni10LaB8D sample indicate that the latter stage of nitrate decomposition (320–370 °C) occurs concurrently with H2 consumption, reflecting the formation of Ni2O3 and its simultaneous reduction to NiO and metallic Ni, completed by ~570 °C. Calcined or heat-treated samples show lower weight loss and broader NiO reduction, consistent with multiple Ni species with varying reducibility. Proper activation—either via calcination or direct reduction—enhances Ni dispersion, active site accessibility, and consequently, catalytic activity and selectivity.
Reaction temperature, feed composition, and space velocity (WHSV) are critical variables in dry reforming of methane. Operating at 700 °C provides a balance between high conversion (~90% of that at 850 °C) and long-term stability with minimal carbon deposition. A CO2-rich feed (CH4/CO2 = 1:1.5) enhances conversion, reduces unreacted feed, and improves catalyst stability, while CH4-rich feeds cause initial deactivation that stabilizes at equilibrium. WHSV must be optimized to balance syngas production and purity: lower WHSV favors purity, higher WHSV increases production but reduces purity. Selecting an optimal WHSV window is thus essential for maximizing syngas output while ensuring downstream separation and purification.
These findings provide clear guidelines for optimizing Ni-Beta catalysts and defining operating parameters in DRM, highlighting the importance of pretreatment control, feed ratio management, and balancing activity, stability, and downstream separation requirements.

Supplementary Materials

The following supporting information can be downloaded at: https://www.mdpi.com/article/10.3390/chemengineering10040046/s1, Figure S1: Thermogravimetric curve of the spent Ni10LaB8D-C6 catalyst following 96 h of DRM at 700 °C. The sample was heated to 800 °C under a He flow and subsequently held at this temperature in air; Figure S2: H2 isotherms at 40 °C on reduced Ni10LaB8D-C6 and Ni10LaB8D catalyst; Table S1: Elemental composition (wt.%) by ICP-AES; Table S2: Theoretical exchange capacity and experimental loading of Ni.

Author Contributions

Conceptualization, G.G.-M. and J.A.-M.; methodology, G.G.-M. and J.A.-M.; investigation, G.G.-M.; writing—original draft preparation, G.G.-M.; writing—review and editing, J.A.-M. All authors have read and agreed to the published version of the manuscript.

Funding

The authors would like to thank the financial support from the European Union (FEDER Funds) and Generalitat Valenciana (grant No. PROMETEO CIPROM/2021/70).

Data Availability Statement

Data are contained within the article.

Conflicts of Interest

The authors declare no conflicts of interest.

Abbreviations

The following abbreviations are used in this manuscript:
CNTsCarbon nanotubes
DRMDry reforming of methane
DTADifferential thermal analysis
PFDProcess Flow Diagram
PSApressure swing adsorption
PXRDPowder X-ray diffraction
SMSIStrong metal-support interaction
TGThermogravimetric
TEMTransmission Electron Microscopy
TPRTemperature-programmed reduction
WHSVWeight hourly space velocity
WGSWater-gas shift

References

  1. Usman, M.; Wan Daud, W.M.A.; Abbas, H.F. Dry reforming of methane: Influence of process parameters—A review. Renew. Sustain. Energy Rev. 2015, 45, 710–744. [Google Scholar] [CrossRef]
  2. Abdulrasheed, A.; Jalil, A.A.; Gambo, Y.; Ibrahim, M.; Hambali, H.U.; Hamid, M.Y.S. A review on catalyst development for dry reforming of methane to syngas: Recent advances. Renew. Sustain. Energy Rev. 2019, 108, 175–193. [Google Scholar] [CrossRef]
  3. Hossain, S.K.S.; Ayodele, B.V. Towards a sustainable hydrogen-rich syngas production by methane dry reforming: Advances in catalyst synthesis and optimization strategies. Fuel 2026, 403, 136132. [Google Scholar] [CrossRef]
  4. Osazuwa, O.U.; Vo, D.V.N.; Ng, K.H. Hydrogen energy from biogas (CO2 and CH4) via dry reforming of methane: A review on confined Ni-catalysts. Process Saf. Environ. Prot. 2025, 198, 107045. [Google Scholar] [CrossRef]
  5. Rostrup-Nielsen, J.R.; Hansen, J.H.B. CO2-Reforming of Methane over Transition Metals. J. Catal. 1993, 144, 38–49. [Google Scholar] [CrossRef]
  6. Zhu, H.; Chen, H.; Zhang, M.; Liang, C.; Duan, L. Recent advances in promoting dry reforming of methane using nickel-based catalysts. Catal. Sci. Technol. 2024, 14, 1712–1729. [Google Scholar] [CrossRef]
  7. Consentino, L.; Deganello, F.; Guil-Lopez, R.; La Parola, V.; Liotta, L.F.; Pantaleo, G. Hydrogen production from chemical looping reforming of methane: A screening of Ni-based oxygen carriers. Appl. Catal. B Environ. Energy 2026, 381, 125819. [Google Scholar] [CrossRef]
  8. Aramouni, N.A.K.; Touma, J.G.; Tarboush, B.A.; Zeaiter, J.; Ahmad, M.N. Catalyst design for dry reforming of methane: Analysis review. Renew. Sustain. Energy Rev. 2018, 82, 2570–2585. [Google Scholar] [CrossRef]
  9. Juan-Juan, J.; Román-Martínez, M.C.; Illán-Gómez, M.J. Effect of potassium content in the activity of K-promoted Ni/Al2O3 catalysts for the dry reforming of methane. Appl. Catal. A Gen. 2006, 301, 9–15. [Google Scholar] [CrossRef]
  10. Lou, Y.; Steib, M.; Zhang, Q.; Tiefenbacher, K.; Horváth, A.; Jentys, A.; Liu, Y.; Lercher, J.A. Design of stable Ni/ZrO2 catalysts for dry reforming of methane. J. Catal. 2017, 356, 147–156. [Google Scholar] [CrossRef]
  11. Wang, C.; Sun, N.; Kang, M.; Wen, X.; Zhao, N.; Xiao, F.; Wei, W.; Zhao, T.; Sun, Y. The bi-functional mechanism of CH4 dry reforming over a Ni–CaO–ZrO2 catalyst: Further evidence via the identification of the active sites and kinetic studies. Catal. Sci. Technol. 2013, 3, 2435–2443. [Google Scholar] [CrossRef]
  12. Razali, S.M.; Asikin-Mijan, N.; Sivasangar, S.; Taufiq-Yap, Y.H. Enhanced dry reforming toward hydrogen production over Ni/CeO2-SiO2 via different catalyst synthesis routes. Int. J. Hydrogen Energy 2019, 44, 20738–20750. [Google Scholar]
  13. Jiang, S.; Lu, Y.; Wang, S.; Zhao, Y.; Ma, X. Insight into the reaction mechanism of CO2 activation for CH4 reforming over NiO-MgO: A combination of DRIFTS and DFT study. Appl. Surf. Sci. 2017, 416, 59–68. [Google Scholar] [CrossRef]
  14. Li, X.; Li, D.; Tian, H.; Zeng, L.; Zhao, Z.-J.; Gong, J. Dry reforming of methane over Ni/La2O3 nanorod catalysts with stabilized Ni nanoparticles. Appl. Catal. B Environ. 2017, 202, 683–694. [Google Scholar] [CrossRef]
  15. Ay, H.; Üner, D. Dry reforming of methane over CeO2 supported Ni, Co and Ni–Co catalysts. Appl. Catal. B Environ. 2015, 179, 128–138. [Google Scholar] [CrossRef]
  16. Chang, J.S.; Park, S.E.; Chon, H. Catalytic activity and coke resistance in the carbon dioxide reforming of methane to synthesis gas over zeolite-supported Ni catalysts. Appl. Catal. A Gen. 1996, 145, 111–124. [Google Scholar] [CrossRef]
  17. Muraza, O.; Galadima, A. A review on coke management during dry reforming of methane. Int. J. Energy Res. 2015, 39, 1196–1216. [Google Scholar] [CrossRef]
  18. Hambali, H.U.; Jalil, A.A.; Abdulrasheed, A.A.; Siang, T.J.; Gambo, Y.; Umar, A.A. Zeolite and clay based catalysts for CO2 reforming of methane to syngas: A review. Int. J. Hydrogen Energy 2022, 47, 30759–30787. [Google Scholar] [CrossRef]
  19. Bacariza, C.; Karam, L.; El Hassan, N.; Lopes, J.M.; Henriques, C. Carbon Dioxide Reforming of Methane over Nickel-Supported Zeolites: A Screening Study. Processes 2022, 10, 1331. [Google Scholar] [CrossRef]
  20. Tanimu, A.; Yusuf, B.O.; Lateef, S.; Tanimu, G.; Alhassan, A.M.; Azeez, M.O.; Alhooshani, K.; Ganiyu, S.A. Dry reforming of methane: Advances in coke mitigation strategies via siliceous catalyst formulations. J. Environ. Chem. Eng. 2024, 12, 113873. [Google Scholar] [CrossRef]
  21. Fakeeha, A.H.; Khan, W.U.; Al-fatesh, A.S.; Abasaeed, A.E. Stabilities of Zeolite-Supported Ni Catalysts for Dry Reforming of Methane. Chin. J. Catal. 2013, 34, 764–768. [Google Scholar] [CrossRef]
  22. Luengnaruemitchai, A.; Kaengsilalai, A. Activity of different zeolite-supported Ni catalysts for methane reforming with carbon dioxide. Chem. Eng. J. 2008, 144, 96–102. [Google Scholar] [CrossRef]
  23. Jeong, H.; Kim, K.I.; Kim, D.; Song, I.K. Effect of promoters in the methane reforming with carbon dioxide to synthesis gas over Ni/HY catalysts. J. Mol. Catal. A Chem. 2006, 246, 43–48. [Google Scholar] [CrossRef]
  24. Frontera, P.; Aloise, A.; MacArio, A.; Antonucci, P.L.; Crea, F.; Giordano, G.; Nagy, J.B. Bimetallic zeolite catalyst for CO2 reforming of methane. Top. Catal. 2010, 53, 265–272. [Google Scholar] [CrossRef]
  25. Chaudhary, K.J.; Al-Fatesh, A.S.; Ibrahim, A.A.; Osman, A.I.; Fakeeha, A.H.; Alhoshan, M.; Alarifi, N.; Al-Muhtaseb, A.H.; Kumar, R. Enhanced hydrogen production through methane dry reforming: Evaluating the effects of promoter-induced variations in reducibility, basicity, and crystallinity on Ni/ZSM-5 catalyst performance. Energy Convers. Manag. X 2024, 23, 100631. [Google Scholar] [CrossRef]
  26. Drobná, H.; Kout, M.; Sołtysek, A.; González-Delacruz, V.M.; Caballero, A.; Čapek, L. Analysis of Ni species formed on zeolites, mesoporous silica and alumina supports and their catalytic behavior in the dry reforming of methane. React. Kinet. Mech. Catal. 2017, 121, 255–274. [Google Scholar] [CrossRef]
  27. Coelho, L.R.F.; Silva, A.A.A.; Xing, Y.; Rabelo-Neto, R.C.; Noronha, F.B.; Mattos, L.V. Ni supported on desilicated HZSM-5 as catalyst for biogas reforming. Fuel 2024, 363, 130914. [Google Scholar] [CrossRef]
  28. Bartholomew, C.H. Mechanisms of catalyst deactivation. Appl. Catal. A Gen. 2001, 212, 17–60. [Google Scholar] [CrossRef]
  29. Xie, X.; Liang, D.; Chen, M.; Wang, Y.; Li, W.; Wang, J.; Yuan, L. Dry reforming of methane over silica zeolite-encapsulated Ni-based catalysts: Effect of preparation method, support structure and Ni content on catalytic performance. Int. J. Hydrogen Energy 2023, 48, 7319–7336. [Google Scholar] [CrossRef]
  30. Kweon, S.; Bae, J.; Cho, Y.; Lee, S.; Kim, J.; Jo, D.; Shin, C.H.; Park, M.B.; Min, H.-K. Defect-stabilized nickel on beta zeolite as a promising catalyst for dry reforming of methane. Catal. Sci. Technol. 2022, 12, 3106–3115. [Google Scholar] [CrossRef]
  31. Cheng, Q.; Yao, X.; Ou, L.; Hu, Z.; Zheng, L.; Li, G.; Morlanes, N.; Cerrillo, J.L.; Castaño, P.; Li, X.; et al. Highly Efficient and Stable Methane Dry Reforming Enabled by a Single-Site Cationic Ni Catalyst. J. Am. Chem. Soc. 2023, 145, 25109–25119. [Google Scholar] [CrossRef]
  32. Shittu, T.D.; Ayodele, O.B. Experimental and computational investigation of CO2–CH4 reforming to syngas over zeolite A supported oxalate ligands functionalized Ni catalysts. Results Eng. 2022, 16, 100630. [Google Scholar] [CrossRef]
  33. Hambali, H.U.; Jalil, A.A.; Abdulrasheed, A.A.; Siang, T.J.; Nyakuma, B.B.; Nabgan, W.; Abdullah, T.A.T. Effect of Ni-Ta ratio on the catalytic selectivity of fibrous Ni-Ta/ZSM-5 for dry reforming of methane. Chem. Eng. Sci. 2020, 227, 115952. [Google Scholar] [CrossRef]
  34. Romay, M.; Serrano, D.P.; Escola, J.M.; Pizarro, P. Dry reforming of methane over Ni/MFI catalysts: Role of the zeolite support acidity. Catal. Today 2025, 460, 115481. [Google Scholar] [CrossRef]
  35. Zhang, J.; Li, Y.; Song, H.; Zhang, L.; Wu, Y.; He, Y.; Ma, L.; Hong, J.; Tayal, A.; Marinkovic, N.; et al. Tuning metal-support interactions in nickel–zeolite catalysts leads to enhanced stability during dry reforming of methane. Nat. Commun. 2024, 15, 8566. [Google Scholar] [CrossRef]
  36. Juan-Juan, J.; Román-Martínez, M.C.; Illán-Gómez, M.J. Nickel catalyst activation in the carbon dioxide reforming of methane: Effect of pretreatments. Appl. Catal. A Gen. 2009, 355, 27–32. [Google Scholar] [CrossRef]
  37. Frontera, P.; Macario, A.; Aloise, A.; Antonucci, P.L.; Giordano, G.; Nagy, J.B. Effect of Support Surface on Methane Dry-Reforming Catalyst Preparation. Catal. Today 2013, 218–219, 18–29. [Google Scholar] [CrossRef]
  38. Gil-Muñoz, G.; Alcañiz-Monge, J. Exploring the role of zeolites as nickel supports in dry methane reforming. Extended abstract. In Proceedings of the Europacat 2025, Trondheim, Norway, 31 August–5 September 2025. [Google Scholar]
  39. Cazorla-Amorós, D.; Alcañiz-Monge, J.; Linares-Solano, A. Characterization of Activated Carbon Fibers by CO2 Adsorption. Langmuir 1996, 12, 2820–2824. [Google Scholar] [CrossRef]
  40. Dubinin, M.M. Porous structure and adsorption properties of active carbons. In Chemistry and Physics of Carbon; Walker, P.L., Jr., Ed.; Marcel Dekker: New York, NY, USA, 1966; Volume 2, pp. 51–120. [Google Scholar]
  41. Barrett, E.P.; Joyner, L.G.; Halenda, P.P. The Determination of Pore Volume and Area Distributions in Porous Substances. I. Computations from Nitrogen Isotherms. J. Am. Chem. Soc. 1951, 73, 373–380. [Google Scholar] [CrossRef]
  42. Brunauer, S.; Emmett, P.H.; Teller, E. Adsorption of Gases in Multimolecular Layers. J. Am. Chem. Soc. 1938, 60, 309–319. [Google Scholar] [CrossRef]
  43. Gil, A. Classical and new insights into the methodology for characterizing adsorbents and metal catalysts by chemical adsorption. Catal. Today 2023, 423, 114016. [Google Scholar] [CrossRef]
  44. Bergeret, G.; Gallezot, P. 3. Characterization of Solid Catalysts: 3.1.2. Particle Size and Dispersion Measurements. In Handbook of Heterogenous Catalysis, 2nd ed.; Ertl, G., Knozinger, H., Weitkamp, J., Eds.; Wiley-VCH Verlag GmbH & Co. KGaA: Weinheim, Germany, 2008; Volume 3, pp. 738–765. [Google Scholar]
  45. Camblor, M.A.; Corma, A.; Valencia, S. Characterization of Nanocrystalline Zeolite Beta. Microporous Mesoporous Mater. 1998, 25, 59–74. [Google Scholar] [CrossRef]
  46. Pereñíguez, R.; González-De la Cruz, V.M.; Holgado, J.P.; Caballero, A. Synthesis and characterization of a LaNiO3 perovskite as precursor for methane reforming reactions catalysts. Appl. Catal. B Environ. 2010, 93, 346–353. [Google Scholar] [CrossRef]
  47. Tang, M.; Xu, L.; Fan, M. Effect of Ce on 5 wt.% Ni/ZSM-5 catalysts in the CO2 reforming of CH4 reaction. Int. J. Hydrogen Energy 2014, 39, 15482–15496. [Google Scholar] [CrossRef]
  48. Hou, Z.; Yokota, O.; Tanaka, T.; Yashima, T. Characterization of Ca-Promoted Ni/γ-Al2O3 Catalyst for CH4 Reforming with CO2. Appl. Catal. A Gen. 2003, 253, 381–387. [Google Scholar] [CrossRef]
  49. Zhang, J.; Xin, Z.; Meng, X.; Tao, M. Synthesis, Characterization and Properties of Anti-Sintering Nickel Incorporated MCM-41 Methanation Catalysts. Fuel 2013, 109, 693–701. [Google Scholar] [CrossRef]
  50. Soghrati, E.; Ong, T.K.C.; Poh, C.K.; Kawi, S.; Borgna, A. Zeolite–supported nickel phyllosilicate catalyst for C–O hydrogenolysis of cyclic ethers and polyols. Appl. Catal. B Environ. 2018, 235, 130–142. [Google Scholar] [CrossRef]
  51. Wang, C.; Wang, Y.; Chen, M.; Liang, D.; Yang, Z.; Cheng, W.; Tang, Z.; Wang, J.; Zhang, H. Recent advances during CH4 dry reforming for syngas production: A mini review. Int. J. Hydrogen Energy 2021, 46, 5852–5874. [Google Scholar] [CrossRef]
  52. van Donk, S.; Janssen, A.H.; Bitter, J.H.; de Jong, K.P. Dealumination of Zeolite Beta via the Reverse Hydrothermal Process. Chem. Rev. 2003, 103, 3613–3630. [Google Scholar]
  53. Ríos, L.A.; Williams, C.D.; Castellanos, J.M. Thermal behavior of natural and synthetic zeolites. J. Therm. Anal. Calorim. 2007, 89, 677–680. [Google Scholar]
  54. Fisher, J.C., II; Mathias, P.M.; Mendiratta, S. Thermal desorption behavior of CO2 in amine-functionalized zeolite Beta studied by TPD-MS. Energy Fuels 2021, 35, 13073–13083. [Google Scholar]
  55. Mekhemer, G.A.H.; Balboul, B.A.A. Thermal Genesis Course and Characterization of Lanthanum Oxide. Colloids Surf. A Physicochem. Eng. Asp. 2001, 181, 19–29. [Google Scholar] [CrossRef]
  56. Bröckner, W.; Ehrhardt, C.; Gjikaj, M. Thermal Decomposition of Nickel Nitrate Hexahydrate, Ni(NO3)2·6H2O, in comparison to Co(NO3)2·6H2O and Ca(NO3)2·4H2O. Thermochim. Acta 2007, 456, 64–68. [Google Scholar] [CrossRef]
  57. Min, H.-K.; Kweon, S.; Kim, Y.W.; An, H.; Jo, D.; Park, E.D.; Shin, C.H.; Park, M.B. Atomically dispersed nickel species in a two-dimensional molecular sieve: Origin of high activity and stability in dry reforming of methane. Appl. Catal. B Environ. 2021, 298, 120627. [Google Scholar] [CrossRef]
  58. Weisz, P.; Prater, C. Interpretation of measurements in experimental catalysis. Adv. Catal. 1954, 6, 143–196. [Google Scholar]
  59. Gil-Muñoz, G.; Alcañiz-Monge, J. Examining the effect of zirconium doping in lanthanum nickelate perovskites on their performance as catalysts for dry methane reforming. J. Environ. Chem. Eng. 2025, 13, 115387. [Google Scholar] [CrossRef]
  60. Gil-Muñoz, G.; Alcañiz-Monge, J. Unusual redox dynamics of Nb in the perovskite LaNbxNi1-XO3 and its impact on the dry catalytic reforming of methane. Fuel 2025, 390, 134720. [Google Scholar] [CrossRef]
  61. Yoo, E.; Choi, D.-S.; Kim, J.; Kim, Y.-H.; Kim, N.-Y.; Joo, J.B. Effects of Operating Parameters and Feed Gas Compositions on the Dry Reforming of Methane over the Ni/Al2O3 Catalyst. Catalysts 2023, 13, 602. [Google Scholar] [CrossRef]
  62. Sophiana, I.C.; Steven, S.; Revieri, A.; Permatasari, A.; Andika, R.; Nishiyama, N.; Susanto, B.H. Simultaneous utilization of CO2 and CH4 through dry reforming of methane with Ni–Ce@SiO2 catalyst: Parametric and simulation studies. Case Stud. Chem. Environ. Eng. 2025, 11, 101078. [Google Scholar] [CrossRef]
  63. Lavoie, J.M. Review on dry reforming of methane, a potentially more environmentally-friendly approach to the increasing natural gas exploitation. Front. Chem. 2014, 2, 81. [Google Scholar] [CrossRef]
  64. Delgado-Dobladez, J.A.; Águeda-Maté, V.I.; Álvarez-Torrellas, S.; Larriba, M.; Brea, P. Efficient recovery of syngas from dry methane reforming product by a dual pressure swing adsorption process. Int. J. Hydrogen Energy 2021, 46, 17522–17533. [Google Scholar] [CrossRef]
  65. Zito, P.F.; Prenesti, G.; Caravella, A. H2 and CO purification by CO2 removal from syngas coupling membrane module and water-absorption unit: An economic analysis. Int. J. Hydrogen Energy 2024, 95, 1274–1283. [Google Scholar] [CrossRef]
  66. Li, B.; He, G.; Jiang, X.; Dai, Y.; Ruan, X. Pressure swing adsorption/membrane hybrid processes for hydrogen purification with a high recovery. Front. Chem. Sci. Eng. 2016, 10, 255–264. [Google Scholar] [CrossRef]
  67. Cao, P.; Adegbite, S.; Wu, T. Thermodynamic equilibrium analysis of CO2 reforming of methane: Elimination of carbon deposition and adjustment of H2/CO ratio. Energy Procedia 2017, 105, 1864–1869. [Google Scholar] [CrossRef]
  68. Wang, D.; Littlewood, P.; Marks, T.J.; Stair, P.C.; Weitz, E. Coking Can Enhance Product Yields in the Dry Reforming of Methane. ACS Catal. 2022, 12, 8352–8362. [Google Scholar] [CrossRef]
  69. de Medeiros, F.G.M.; Lopes, F.W.B.; Rego de Vasconcelos, B. Prospects and Technical Challenges in Hydrogen Production through Dry Reforming of Methane. Catalysts 2022, 12, 363. [Google Scholar] [CrossRef]
  70. Singh, D.; Sirini, P.; Lombardi, L. Green Hydrogen Production from Biogas or Landfill Gas by Steam Reforming or Dry Reforming: Specific Production and Energy Requirements. Energies 2025, 18, 2631. [Google Scholar] [CrossRef]
  71. Zhao, X.; Joseph, B.; Kuhn, J.; Ozcan, S. Biogas Reforming to Syngas: A Review. iScience 2020, 23, 101082. [Google Scholar] [CrossRef]
  72. Lachén, J.; Durán, P.; Menéndez, M.; Peña, J.A.; Herguido, J. Biogas to high purity hydrogen by methane dry reforming in TZFBR+MB and exhaustion by Steam-Iron Process. Techno–economic assessment. Int. J. Hydrogen Energy 2018, 43, 11663–11675. [Google Scholar] [CrossRef]
  73. Kumar, R.; Kumar, A. Recent advances of biogas reforming for hydrogen production: Methods, purification, utility and techno-economics analysis. Int. J. Hydrogen Energy 2024, 76, 108–140. [Google Scholar] [CrossRef]
Figure 1. N2 adsorption–desorption isotherms at −196 °C in β-support and their samples Ni10LaB and Ni5LaB calcined at 800 °C, directly reduced at 800 °C and after DRM reaction at 700 °C by 96 h.
Chemengineering 10 00046 g001
Figure 2. PXRD patterns of NiLaB catalysts with different Ni loadings (5, 10, 20 wt.%; 20 wt.% La2O3) after calcination or direct reduction at 800 °C, including post-reaction Ni10LaB.
Chemengineering 10 00046 g002
Figure 3. H2-TPR profiles of the calcined 800 °C NiLaB catalysts with different Ni loadings (3, 5, 7.5, 10, 15, 20 wt.%; 20 wt.% La2O3). (10% H2/Ar).
Chemengineering 10 00046 g003
Figure 4. TGA (a), DTA (b), and MS profiles (c) of the H2 reduction pretreatment (10 vol% in Ar) for various catalysts. Calcined (dotted) and non-calcined (solid) Ni10LaB profiles are compared to non-calcined NiB, LaB, B (air-treated), and Ni10LaB (He-treated). MS signals in (c) correspond to H2 and NO consumption/release during Ni10LaB reduction.
Chemengineering 10 00046 g004
Figure 5. 120 kV TEM images of Ni10LaB8D after 1 h reduction in H2 at 800 °C.
Chemengineering 10 00046 g005
Figure 6. 120 kV TEM images of Ni10LaB8D-C6 after 1 h reduction in H2 at 800 °C.
Chemengineering 10 00046 g006
Figure 7. CO2 and CH4 conversion as a function of reaction time over NxLaB8D-C6 catalysts serie. Conditions: 700 °C, WHSV 58,000 mL/(g·h) reduced catalyst mass: 80 mg/cat. CH4/CO2/He ratio 1/1/2.
Chemengineering 10 00046 g007
Figure 8. CO2 and CH4 conversion as a function of reaction time over calcined Ni10LaB-C6 and Ni10LaB-C8 catalysts, following reduction at 600 or 800 °C under either isothermal or direct heating procedures. Conditions: 700 °C, WHSV 58,000 mL/(g·h) reduced catalyst mass: 80 mg cat. CH4/CO2/He ratio 1/1/2.
Chemengineering 10 00046 g008
Figure 9. CO2 and CH4 conversion as a function of reaction time for calcined Ni10LaB-C6 versus non-calcined Ni10LaB catalysts reduced at 600 or 800 °C under direct heating, and for a Ni10LaB-C6 sample after isothermal reduction at 800 °C versus after helium pretreatment. Conditions: 700 °C, WHSV 58,000 mL/(g·h) Reduced catalyst mass: 80 mg cat. CH4/CO2/He ratio 1/1/2.
Chemengineering 10 00046 g009
Figure 10. Conversion of CO2 and CH4 as a function of time over the Ni10LaB8D-C6 catalyst at various reaction temperatures. Conditions: Temperature = 600–850 °C, WHSV = 58,000 mL/(gcat·h), reduced catalyst mass = 80 mg, feed gas composition (CH4/CO2/He) = 1/1/2. The inset displays the carbon deposition rate, normalized per gram of catalyst (gC·h−1·gcat−1).
Chemengineering 10 00046 g010
Figure 11. Arrhenius plot for the DRM reaction over the Ni10LaB8D-C6 catalyst.
Chemengineering 10 00046 g011
Figure 12. TEM images at 120 kV of the spent Ni10LaB8D-C6 catalyst following 96 h of DRM at (a) 700 °C and (b) 800 °C.
Chemengineering 10 00046 g012
Figure 13. Conversion of CO2 and CH4 as a function of temperature over the Ni10LaB8D calcined and non-calcined catalyst. Conditions: WHSV = 58,000 mL/(gcat·h), reduced catalyst mass = 80 mg, feed gas composition (CH4/CO2/He) = 1/1/2.
Chemengineering 10 00046 g013
Figure 14. Effect of space velocity on CO2 and CH4 conversion and purity (left y-axis), and syngas flow (right y-axis), during DRM over the Ni10LaB8D-C6 catalyst. Reaction conditions: T = 700 °C, reduced catalyst mass = 83 mg, feed composition: CH4/CO2 = 1/1 (vol%).
Chemengineering 10 00046 g014
Figure 15. CO2 and CH4 conversion versus time on stream over the Ni10LaB8D-C6 catalyst under different feed gas compositions. Reaction conditions: T = 700 °C, WHSV = 58,000 mL/gcat−1 h−1, reduced catalyst mass = 80 mg. Feed composition (CH4/CO2/He, vol%): (i) 25/25/50, (ii) 30/20/50, (iii) 20/30/50, (iv) 50/50/0 (stoichiometric, undiluted).
Chemengineering 10 00046 g015
Figure 16. Simplified PFD for Industrial-Scale Biogas-Based Dry Methane Reforming.
Chemengineering 10 00046 g016
Table 1. Nomenclature of catalyst obtained after different pretreatments protocols.
ProtocolNomenclatureCalcination aInert Preheat b Reduction Step c
INixLaB6I-C6600 °C, 3 h25→600 °CIsothermal (600 °C)
NixLaB6I-C8800 °C, 1 h25→600 °CIsothermal (600 °C)
NixLaB8I-C8800 °C, 1 h25→800 °CIsothermal (800 °C)
IINixLaB6D-C6600 °C, 3 hNoDirect TPR (25→600 °C)
NixLaB6D-C8800 °C, 1 hNoDirect TPR (25→600 °C)
NixLaB8D-C8800 °C, 1 hNoDirect TPR (25→800 °C)
IIINixLaB6I-He6No25→600 °CIsothermal (600 °C)
NixLaB8I-He8No25→800 °CIsothermal (800 °C)
IVNixLaB6DNoNoDirect TPR (25→600 °C)
NixLaB8DNoNoDirect TPR (25→800 °C)
All gas flow rates were 80 mL min−1. a Air; b He at 20 °C/min; c 10% H2/Ar at 20 °C/min, 1 h hold.
Table 2. Porous texture of β-Zeolite and catalyst (Ni 10 wt.% or 5 wt.% and La2O3 20 wt.%) calcined 800 °C, direct H2 reduction at 800 °C (uncalcinated), and DRM reaction 700 °C.
ZeoliteSBET (m2/g)VN2 1 (cm3/g)VCO2 2 (cm3/g)Vmeso (cm3/g)Vtotal 3 (cm3/g)
B5900.260.250.390.99
Ni10LaB-C8380 (413)0.17 (0.18)0.20 (0.18)0.31 (0.27)0.67 (0.69)
Ni10LaB8D2950.160.160.270.57
Ni10LaB8D DRM2930.150.130.370.74
Ni5LaB-C83950.180.180.310.67
Ni5LaB8D3390.150.140.300.66
Ni5LaB8D DRM3190.150.130.300.59
1 Specific total micropore volume; 2 Specific narrow micropore volume (<0.7 nm); 3 Specific total pore volume.
Table 3. H2-TPR analysis of the calcined 800 °C NiLaB catalysts with different Ni loadings.
Area (a.u.)Ni3Ni5Ni7.5Ni10Ni15Ni20
Total1669295743115739816410822
Peak (350–630 °C) *57020013170477169779467
Peak (630–800 °C) *1100956114196811871355
* The temperature interval oscillated depending on each sample.
Disclaimer/Publisher’s Note: The statements, opinions and data contained in all publications are solely those of the individual author(s) and contributor(s) and not of MDPI and/or the editor(s). MDPI and/or the editor(s) disclaim responsibility for any injury to people or property resulting from any ideas, methods, instructions or products referred to in the content.