1. Introduction
Solid oxide electrolyzer (SOE) is considered a new potential technology for the production of hydrogen. Such a device achieves very high efficiencies in keeping power density higher than low-temperature electrolyzers. A promising application for SOE is in the energy storage field, where a high-efficient hydrogen production offers a viable path for the use of hydrogen as a storage medium. A well-known problem for the exploitation of renewable energy sources is the unpredictability of electrical production with a consequent unbalancing of the electrical grid. To restore equilibrium between generation and consumption requires the significant integration of an energy storage system (ESS) into the energy system. Today, installed energy storage capacity is very limited in the European scenario, mainly due to technological and economic issues. Innovative solutions with enhanced features with respect to conventional technologies have to be developed. High temperature electrolyzers, such as SOE, offer a very interesting path for high-efficiency and low-cost hydrogen production. The cost of the technology is an open issue. Important results where recently achieved at the industrial level, taking advantage of the improvements of solid oxide fuel cell technology that share many aspects of design, materials, and system integration with SOE. SOE technology, due to recent development, lacks system study regarding energy balance and the impact of operative parameter on performances. Open challenges are the management of the hydrogen cooling and compression and the optimization of air flow in the system. This study performs a preliminary study on the latter aspect, specifically focusing on the role played by air flow with impacts at the system level.
The electrolysis reaction is the following (1):
In electrolysis, efficiency is calculated as follow Equation (2):
where
Pout and
Pin are system power output and input, respectively,
is molar flow rate of hydrogen,
is low heating value of hydrogen, and
V and
I are voltage and current of electrolyzer, respectively. Hydrogen and current are related by Equation (3):
where
F is Faraday constant. Thus, efficiency can be expressed by Equation (4):
An additional efficiency,
ηs, can be defined at system level (5), considering the heat absorbed by H
2O, from room temperature to SOE operation temperature, as further energy input.
where
Qw is the heat necessary for heating and water vaporization to guarantee steam at 650 °C at the hotbox inlet.
Efficiency therefore is only dependent on voltage. Considering that LHV is the enthalpy variation, Δ
H, of electrolysis reaction in Equation (1), it is possible to define thermoneutral voltage
Eth as the voltage equivalent to 100% efficiency as follows (6):
Once the system operates at a thermoneutral voltage, efficiency is 100%, and the electrolyzer is in equilibrium. Depending on the relation between voltage and current density, which is called the polarization curve, it is possible to find the thermoneutral current density,
Jth.
Figure 1 reports polarization curves and thermoneutral values of different electrolyzer technologies. Compared to a low-temperature electrolyzer, SOE allows higher thermoneutral current densities and relative power densities to be achieved. Real systems usually operate above thermoneutral due to thermal losses, and operative current densities are higher than thermoneutral one.
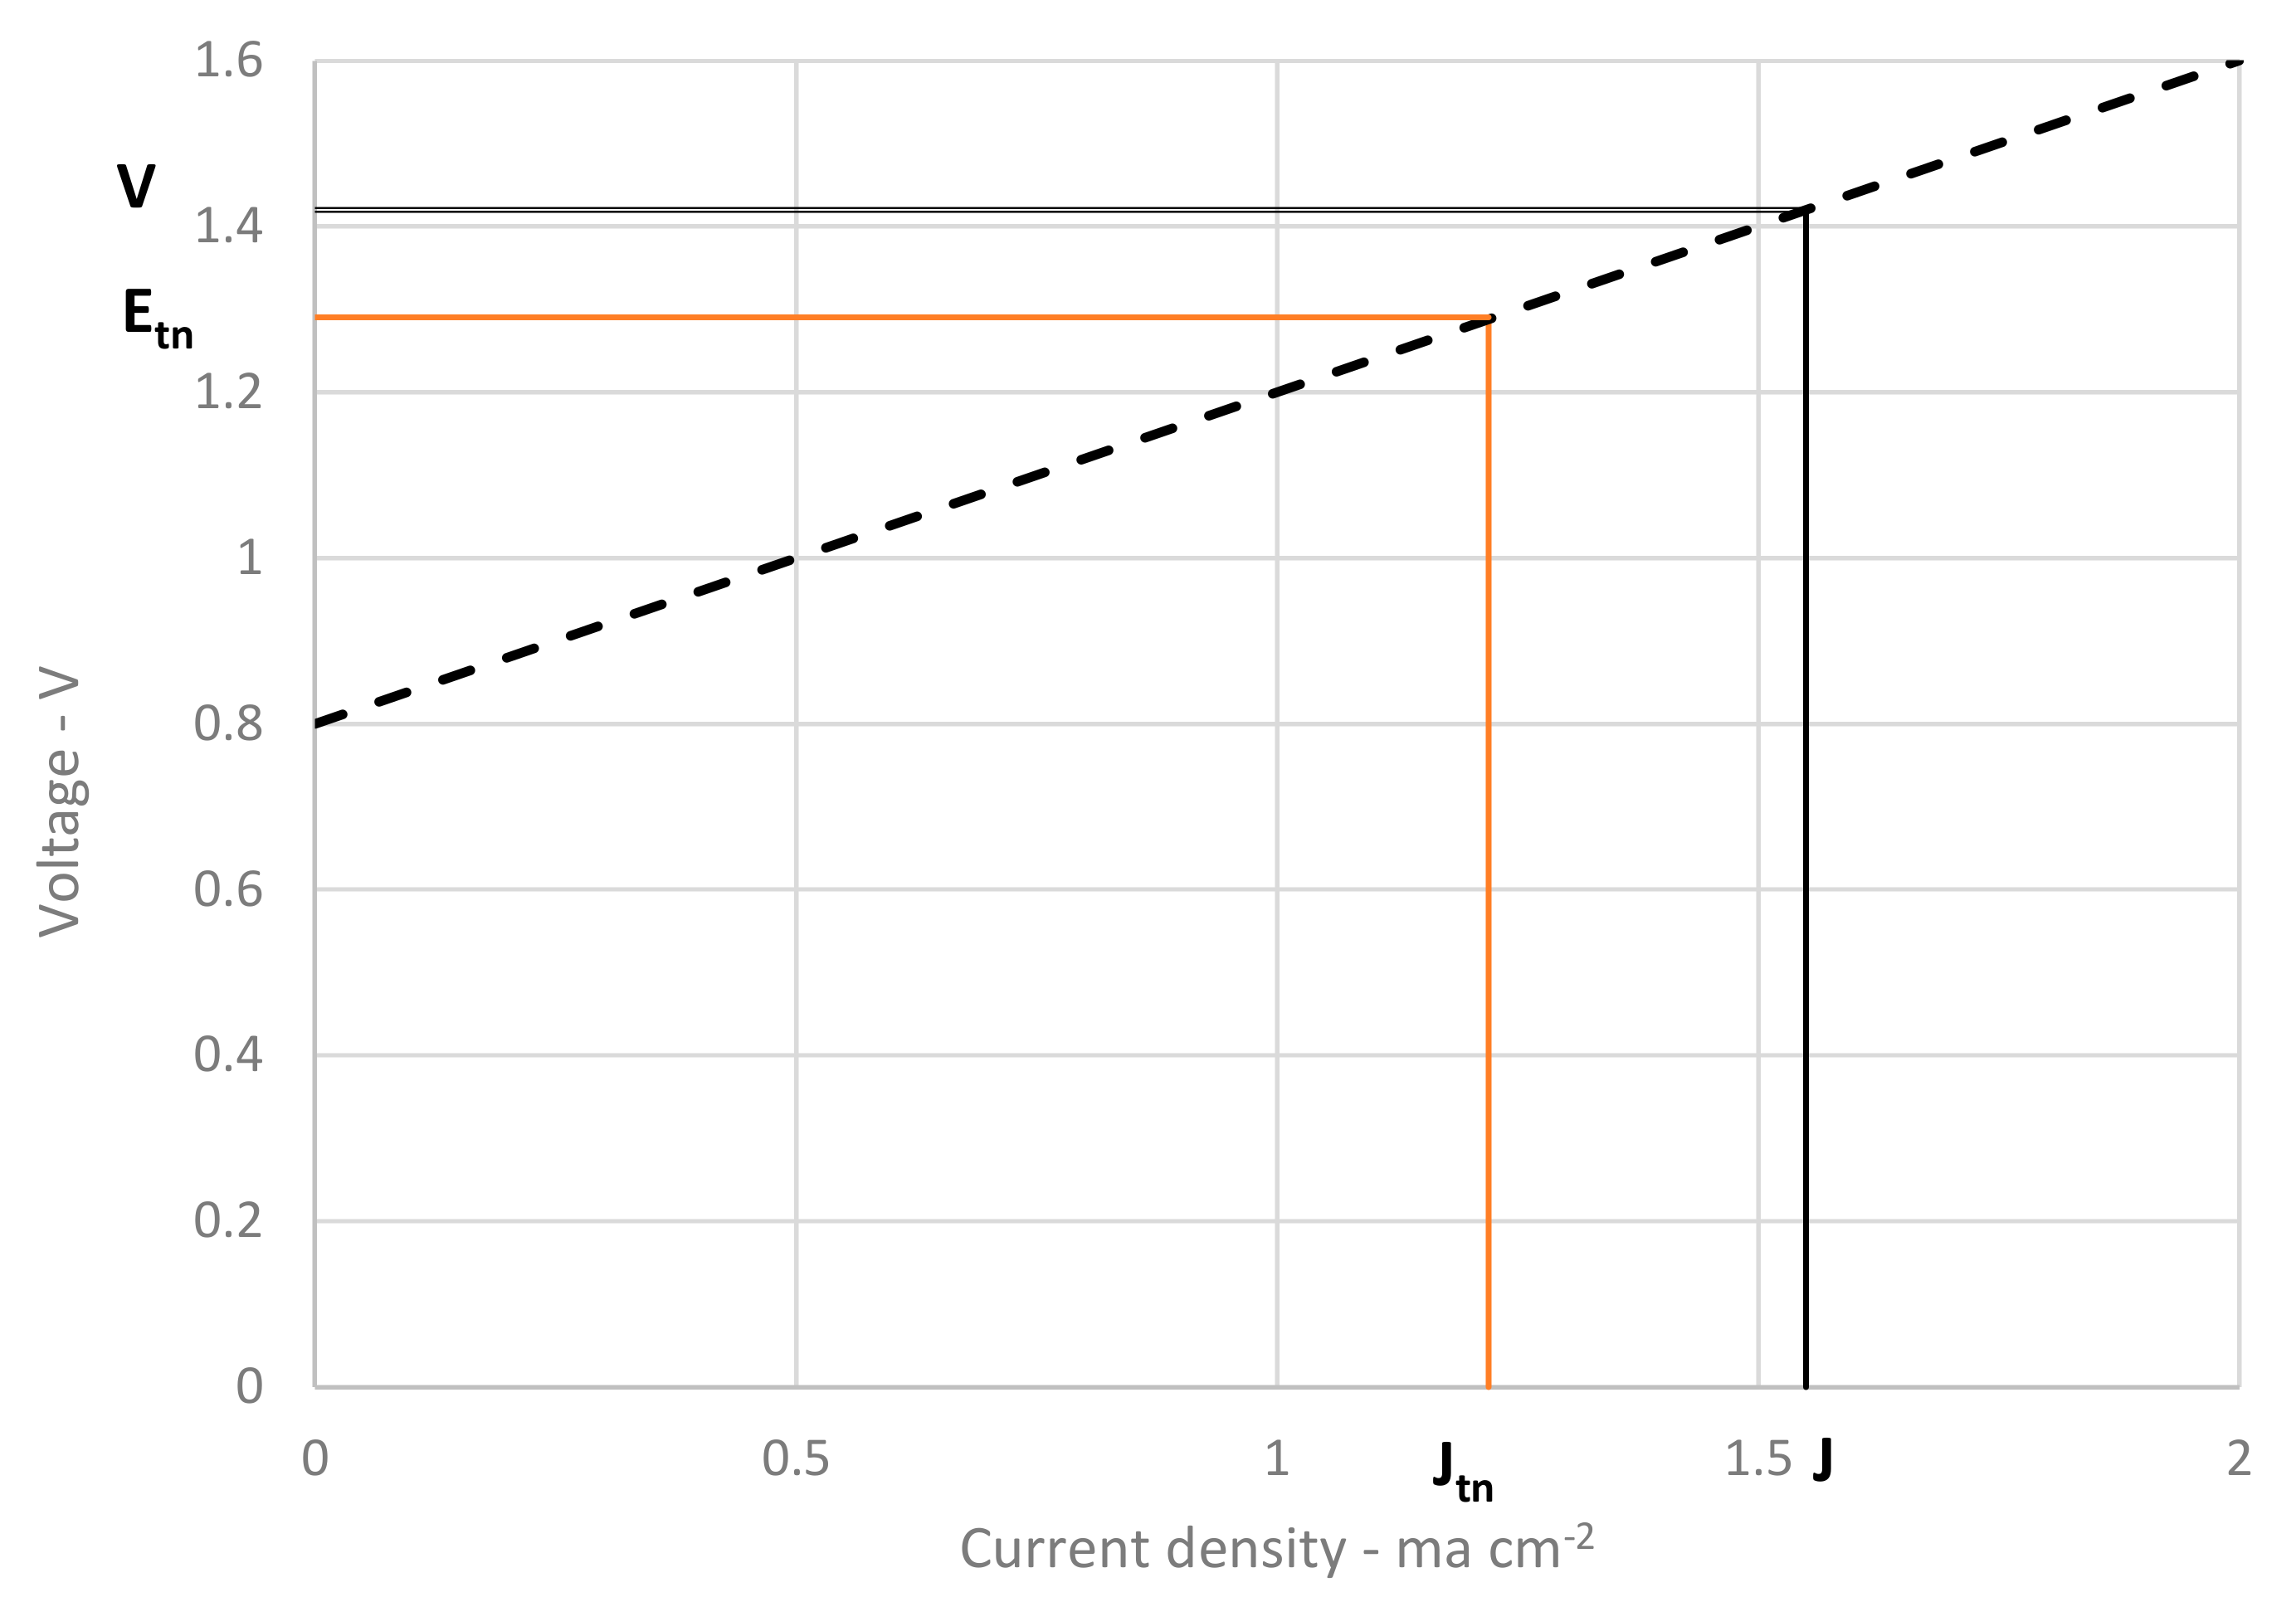
Considering a general polarization curve, like
V(
j) reported in
Figure 2, real operating conditions,
V and
J in the figure, are higher than thermoneutral due to system losses.
Operative voltage,
V, can be related to the energy balance of the stack by following relation:
where Δ
HS is the total enthalpy requirement of the stack that is the sum of reaction enthalpy Δ
H and thermal losses
Q.
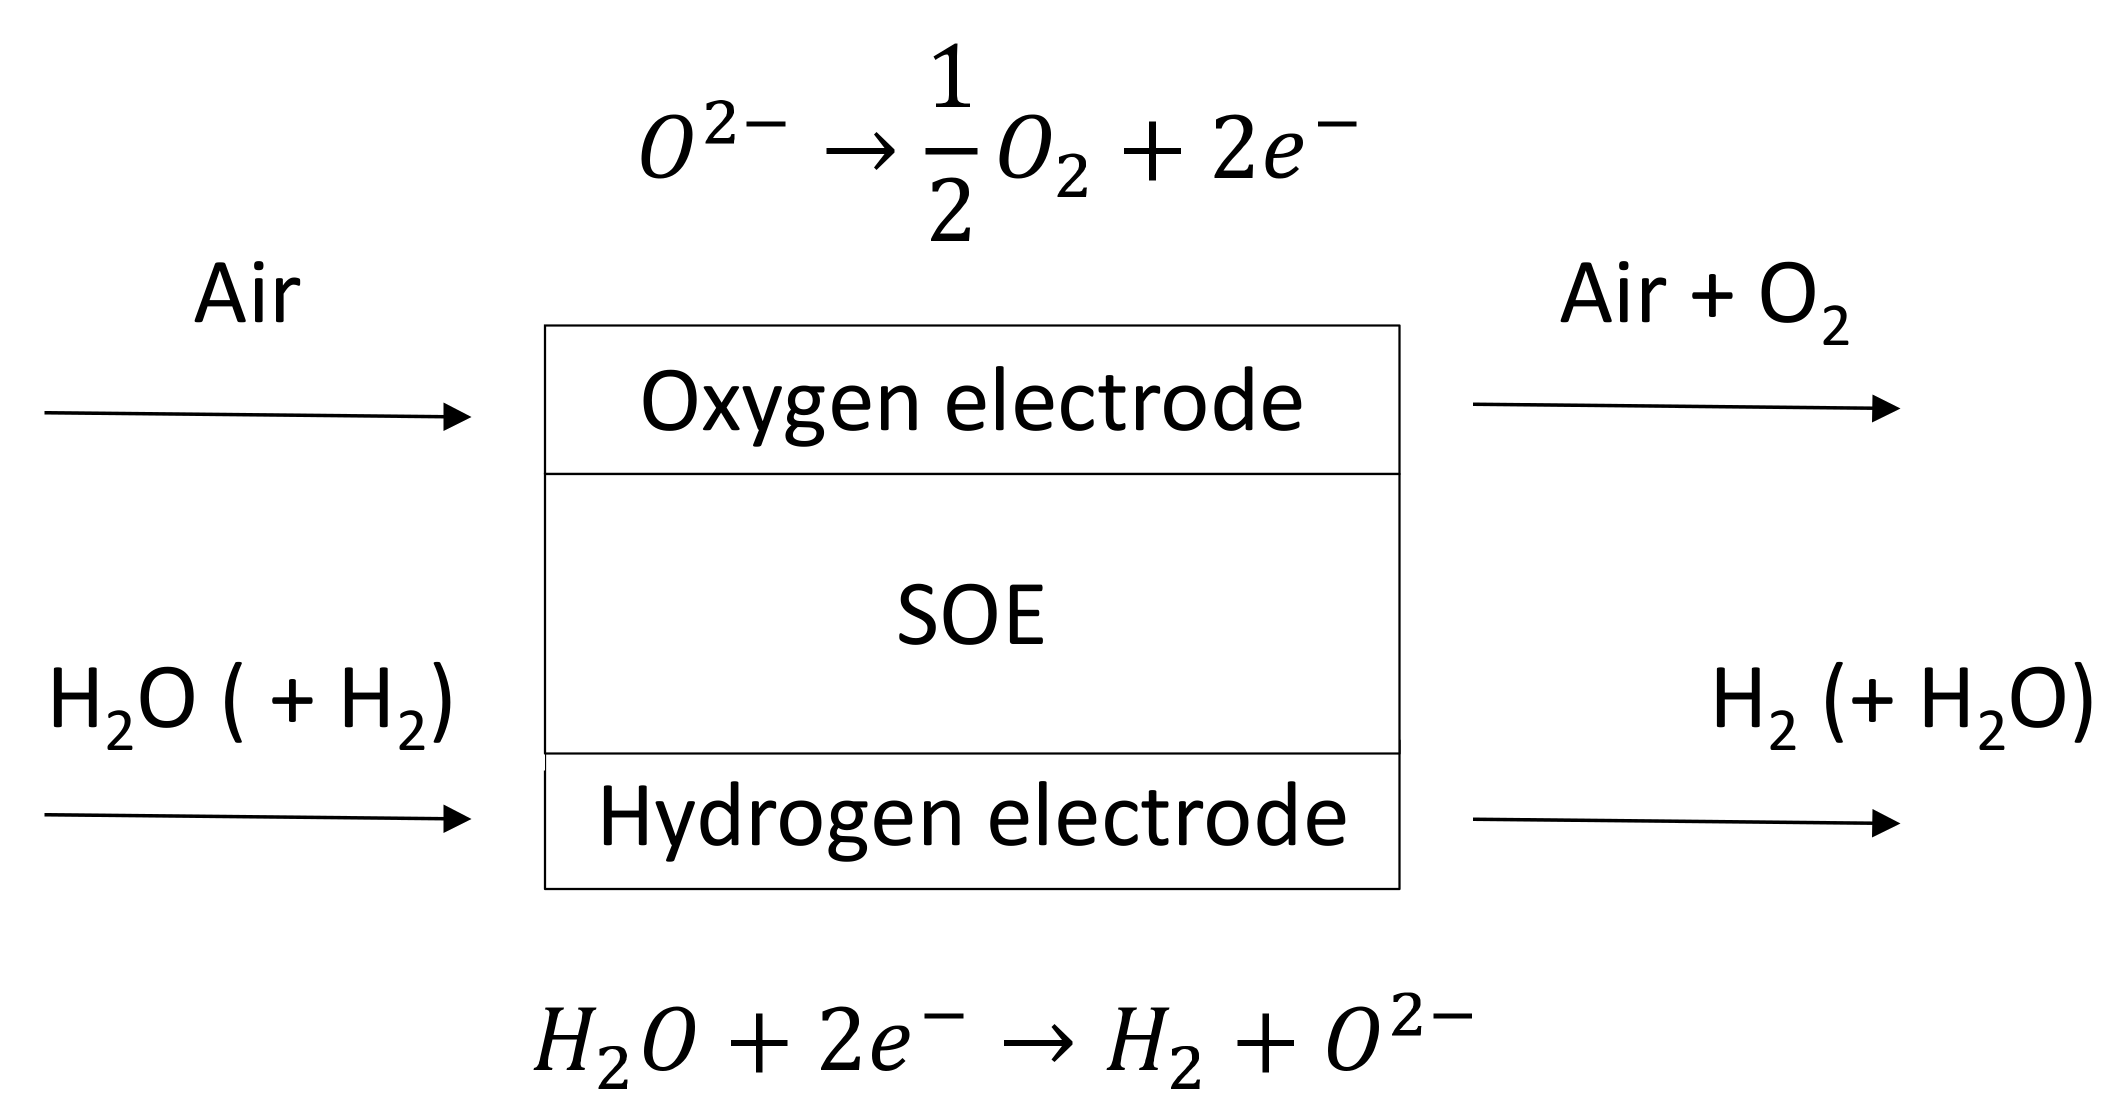
The scheme of an SOE stack is reported in
Figure 3. In the hydrogen electrode, steam is supplied mixed with hydrogen. Hydrogen is added due to material restrictions that require a reductive atmosphere to protect the reaction catalyst from oxidation. During operation, the steam reacts and produces hydrogen and oxide ions. Hydrogen electrode output is a mixture of hydrogen and unreacted steam. The reactant utilization parameter (RU) is introduced to calculate the amount of steam that reacts in the cell and has a direct impact on the steam hydrogen mixture. Reactant utilization is defined as follows:
where
is the mole of steam reacting and
is the total steam molar inlet flow.
Regarding the oxygen electrode side, pure oxygen is produced by the electrochemical reaction, and air is usually fed as a sweep gas for obvious reasons of low cost and availability. This study focuses on the air feeding and on the effect of air flow rate on stack equilibrium and performance.
Studies on SOE are mainly focused on the material development [
2,
3] and on the operation potentialities in specific applications such as CO-electrolysis [
4] and reversible RE-SOFC [
5]. SOE integration in complete systems is also addressed in the literature [
6]. Air flow is an important parameter at the system level because it has to be managed in the unit. In detail, air needs to be heated up to stack temperature and has to be cooled down when mixed with produced oxygen. Such an operation can be realized with a heat exchanger (regenerator) using a similar solution to the SOFC system. The main difference with SOFC is that in SOE air flow is not necessary for the operation of the stack and must be optimized only for the sweeping of oxygen. Compared to SOFC, the stack does not have to be cooled; on the contrary, as previously explained, any thermal loss causes a decrease in performances. It is impossible to obtain an operative air-air heat exchanger to supply all the required heat to heat air flow rate up to the stack operating temperature. The consequence is that part of the heat must be obtained directly from the stack and becomes an energy request that has to be subtracted from the heat available for the chemical reactions. No studies in the literature address air flow management and optimization.
Within this study, a zero-dimensional model of a stack and heat exchanger was developed, and the effect of air flow rate reduction on the performances was investigated. The model is supported by an experimental test giving the main parameters of SOE operation in the designed condition.
2. Materials and Methods
A zero-dimensional thermodynamic model, including an SOE stack and an air-air heat exchanger, was developed. Thermodynamic properties were obtained by the FluidProp library supplied by Asimptote and based on JANAF tables [
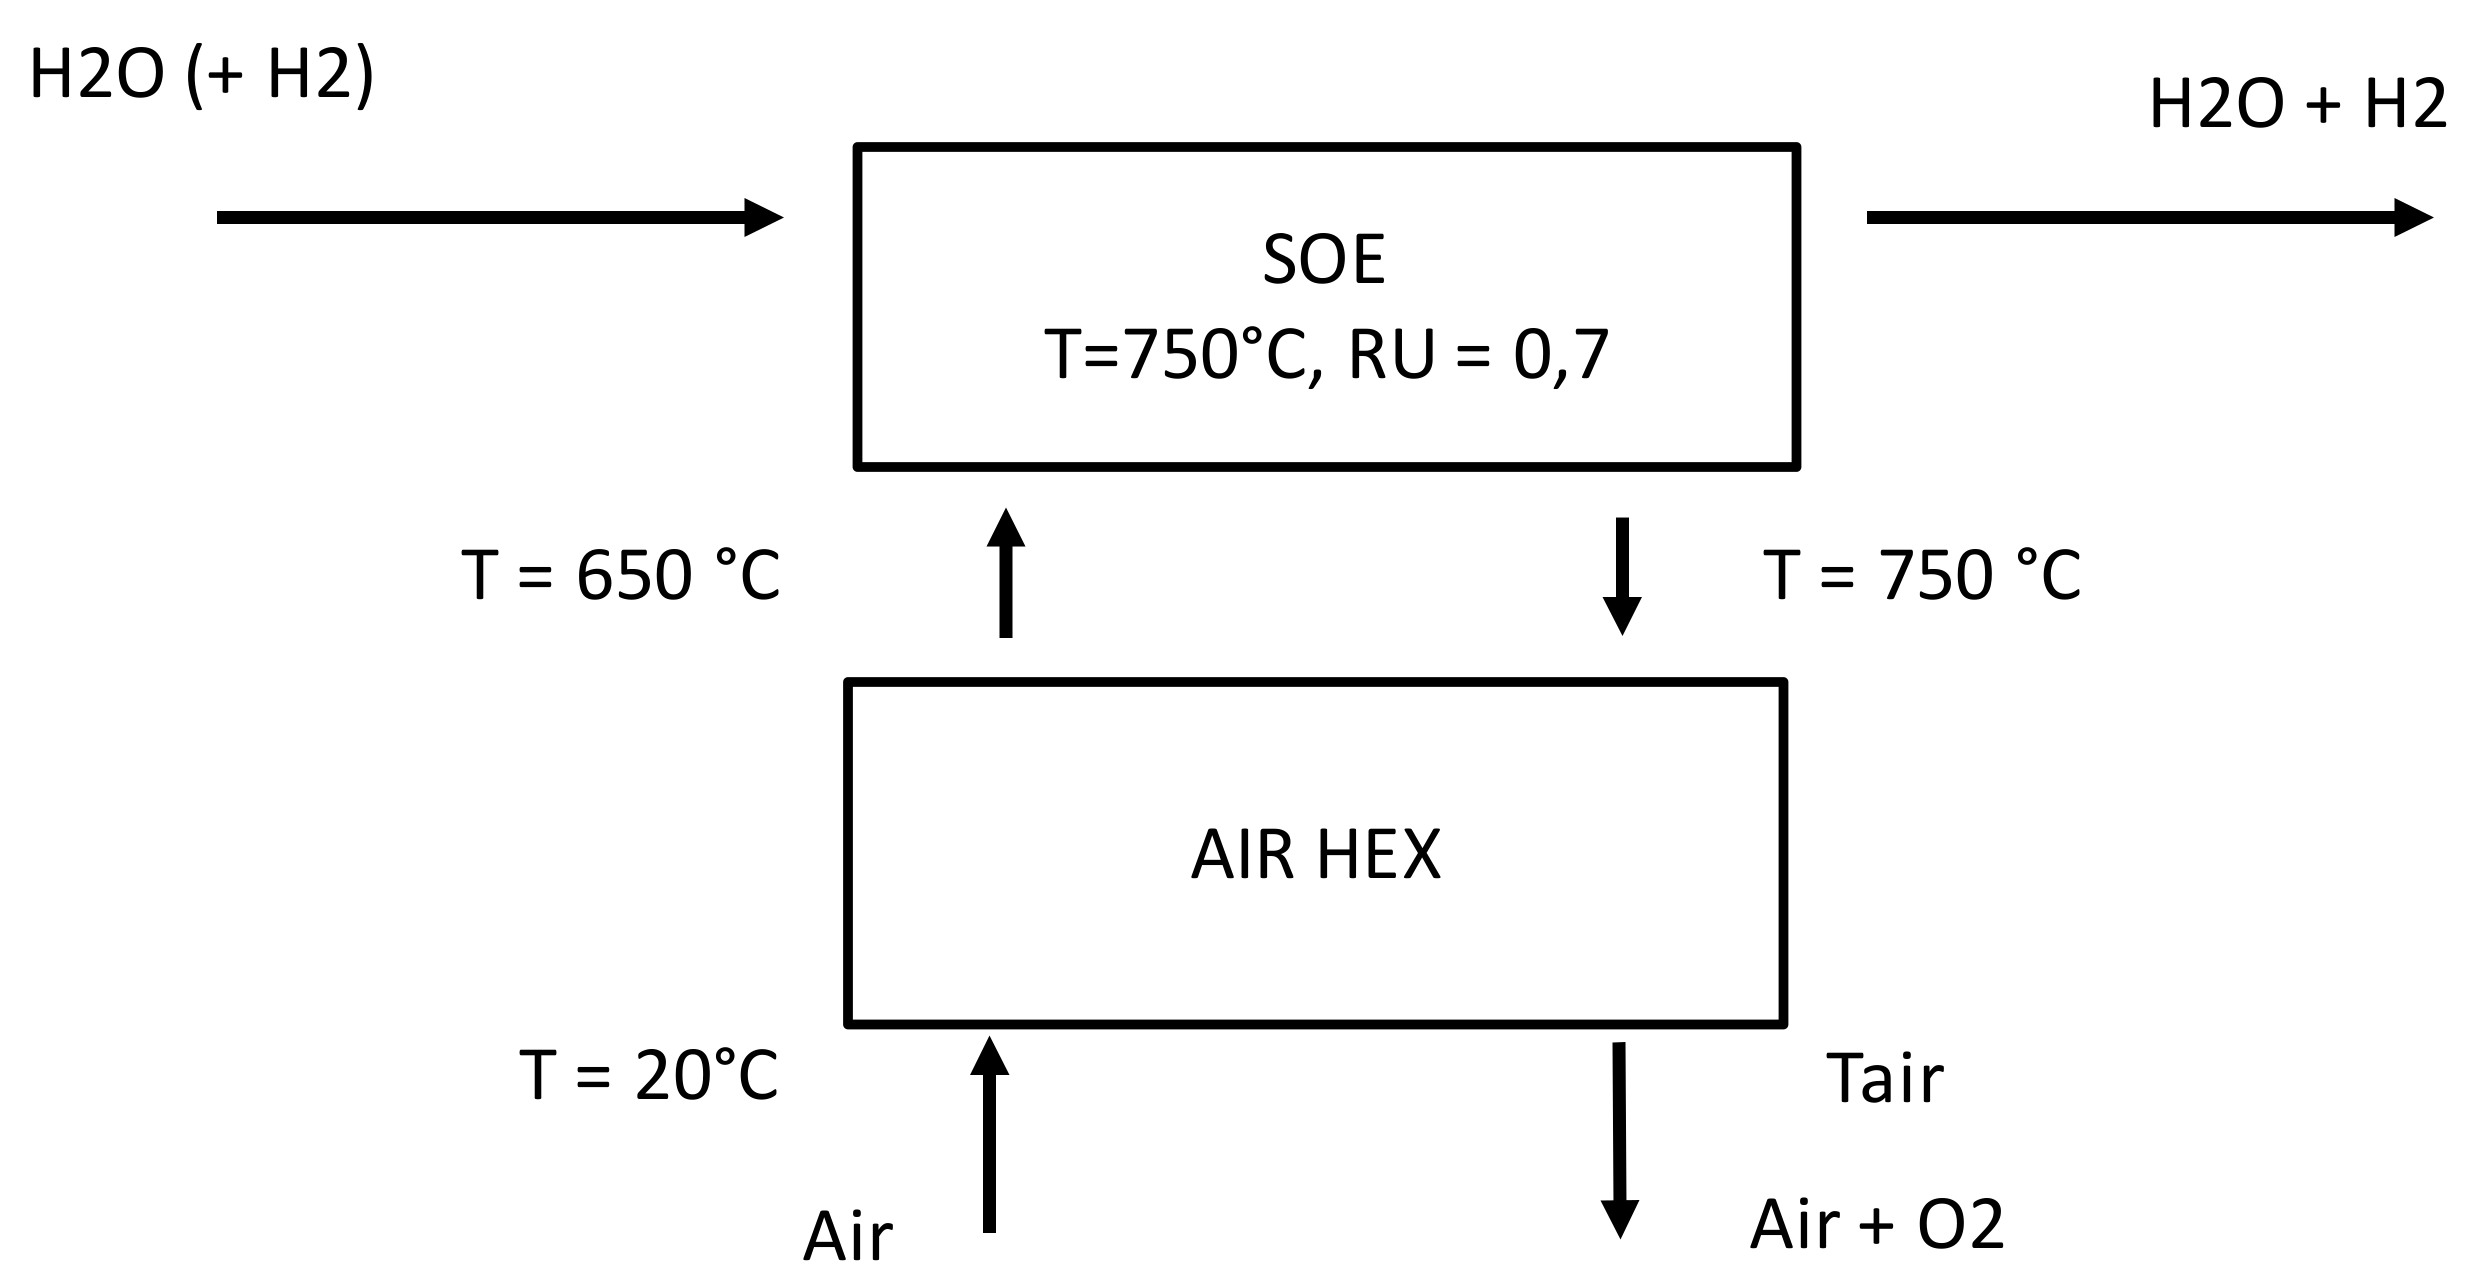
7]. A scheme of the developed model is reported in
Figure 4. The SOE stack was operated at 750 °C with an RU of 0.7. Operative temperature is derived from SOFC state of technology, while the RU is a trade-off between reduction of steam production and higher availability of steam in the electrode to feed the reaction. Based on literature data, H
2O:H
2 composition was kept as 90:10 [
8]. In this case, the aim is to keep hydrogen concentration as low as possible. Air flow enters the system at ambient conditions and is heated in the heat exchanger (AIR HEX) up to 650 °C. This temperature was derived from typical SOFC stack operation where, with the aim of reducing thermal shocks to the stack materials, 100 K are considered as maximum temperature difference [
9]. A hydrogen electrode mixture, H
2 and H
2O, is fed to the stack at 650 °C.
The mixture of air and oxygen exits the stack at the operating temperature and enters the heat exchanger. Note that this design guarantees a temperature difference of 100 K for the high temperature side of the heat exchanger. Moreover, the mass flow of the cooling flow (right side in the figure) is higher of the heating one because oxygen produced by the reaction is added to the same mass flow. This means that there is no risk of insufficient heat to bring the air flow rate up to 650 °C.
The model was calculated to have thermal equilibrium in the stack. Once stack the physical parameters—the number of cell and cell active area—are defined, the model calculates the operative voltage based on air flow, RU, and polarizations parameters, specifically ASR and OCV. ASR is the area specific resistance, and OCV is the open circuit voltage. ASR and OCV are derived from the experimental part of the study. A commercial SOFC short stack was operated in SOE conditions at 750 °C. The short stack is based on six SOFC planar cells with a Ni/8YSZ anode, an LSCF cathode, a GDC barrier layer, and an 8YSZ electrolyzer. The test was performed in a test rig designed to perform stack start-up and experimental testing. The test rig was adapted in the furnace connected to the hydrogen and air piping. Hydrogen piping was fed with a mixture of hydrogen and steam. Water was evaporated in a controlled evaporator mixer, and the H
2-H
2O mixture was kept at an acceptable temperature with a cable heating system to avoid recondensation of water. Both air flow and steam were preheated in specific piping inside the furnace that increases gas temperature up to stack temperature. Mica sealing was used to connect the piping to the stack to avoid gas leakage inside the furnace. Off gasses were kept at high temperature using isolated piping to avoid water condensation in the test rig, which could introduce pressure variation and pipe plugging. Further details of the test rig are reported in [
10].
No heat losses are considered in the model, and further heat requirements (Q) are needed to bring the hydrogen electrode and oxygen electrode gasses from 650 °C to the operative temperature of 750 °C. The stack is considered to operate under adiabatic conditions; thus, heat losses due to overpotentials are calculated in the stack equilibrium and participate to supply heat to the reactions.
All input parameters of the model and relative values are reported in
Table 1.
The model is developed so that main design parameter is the number of cells. This value was fixed to 12 in order to have a reference power up to 1 kW. Air flow in the system was initially fixed to be twice the molar flow of the hydrogen electrode side. The study was designed to analyze the effect of air variation and air flow rate is the parameter changed during the study. The flow values were calculated introducing, as a parameter, the ration between the oxygen electrode and the hydrogen electrode molar flow rate (Oe/He). In detail, starting from the initial value of 2, the Oe/He was lowered to 0.5 at steps of 0.25. Input Oe/He values and relative air flow rates are reported in
Table 2. To improve the readability of the values, air flow is reported in Nl h
−1.
3. Results
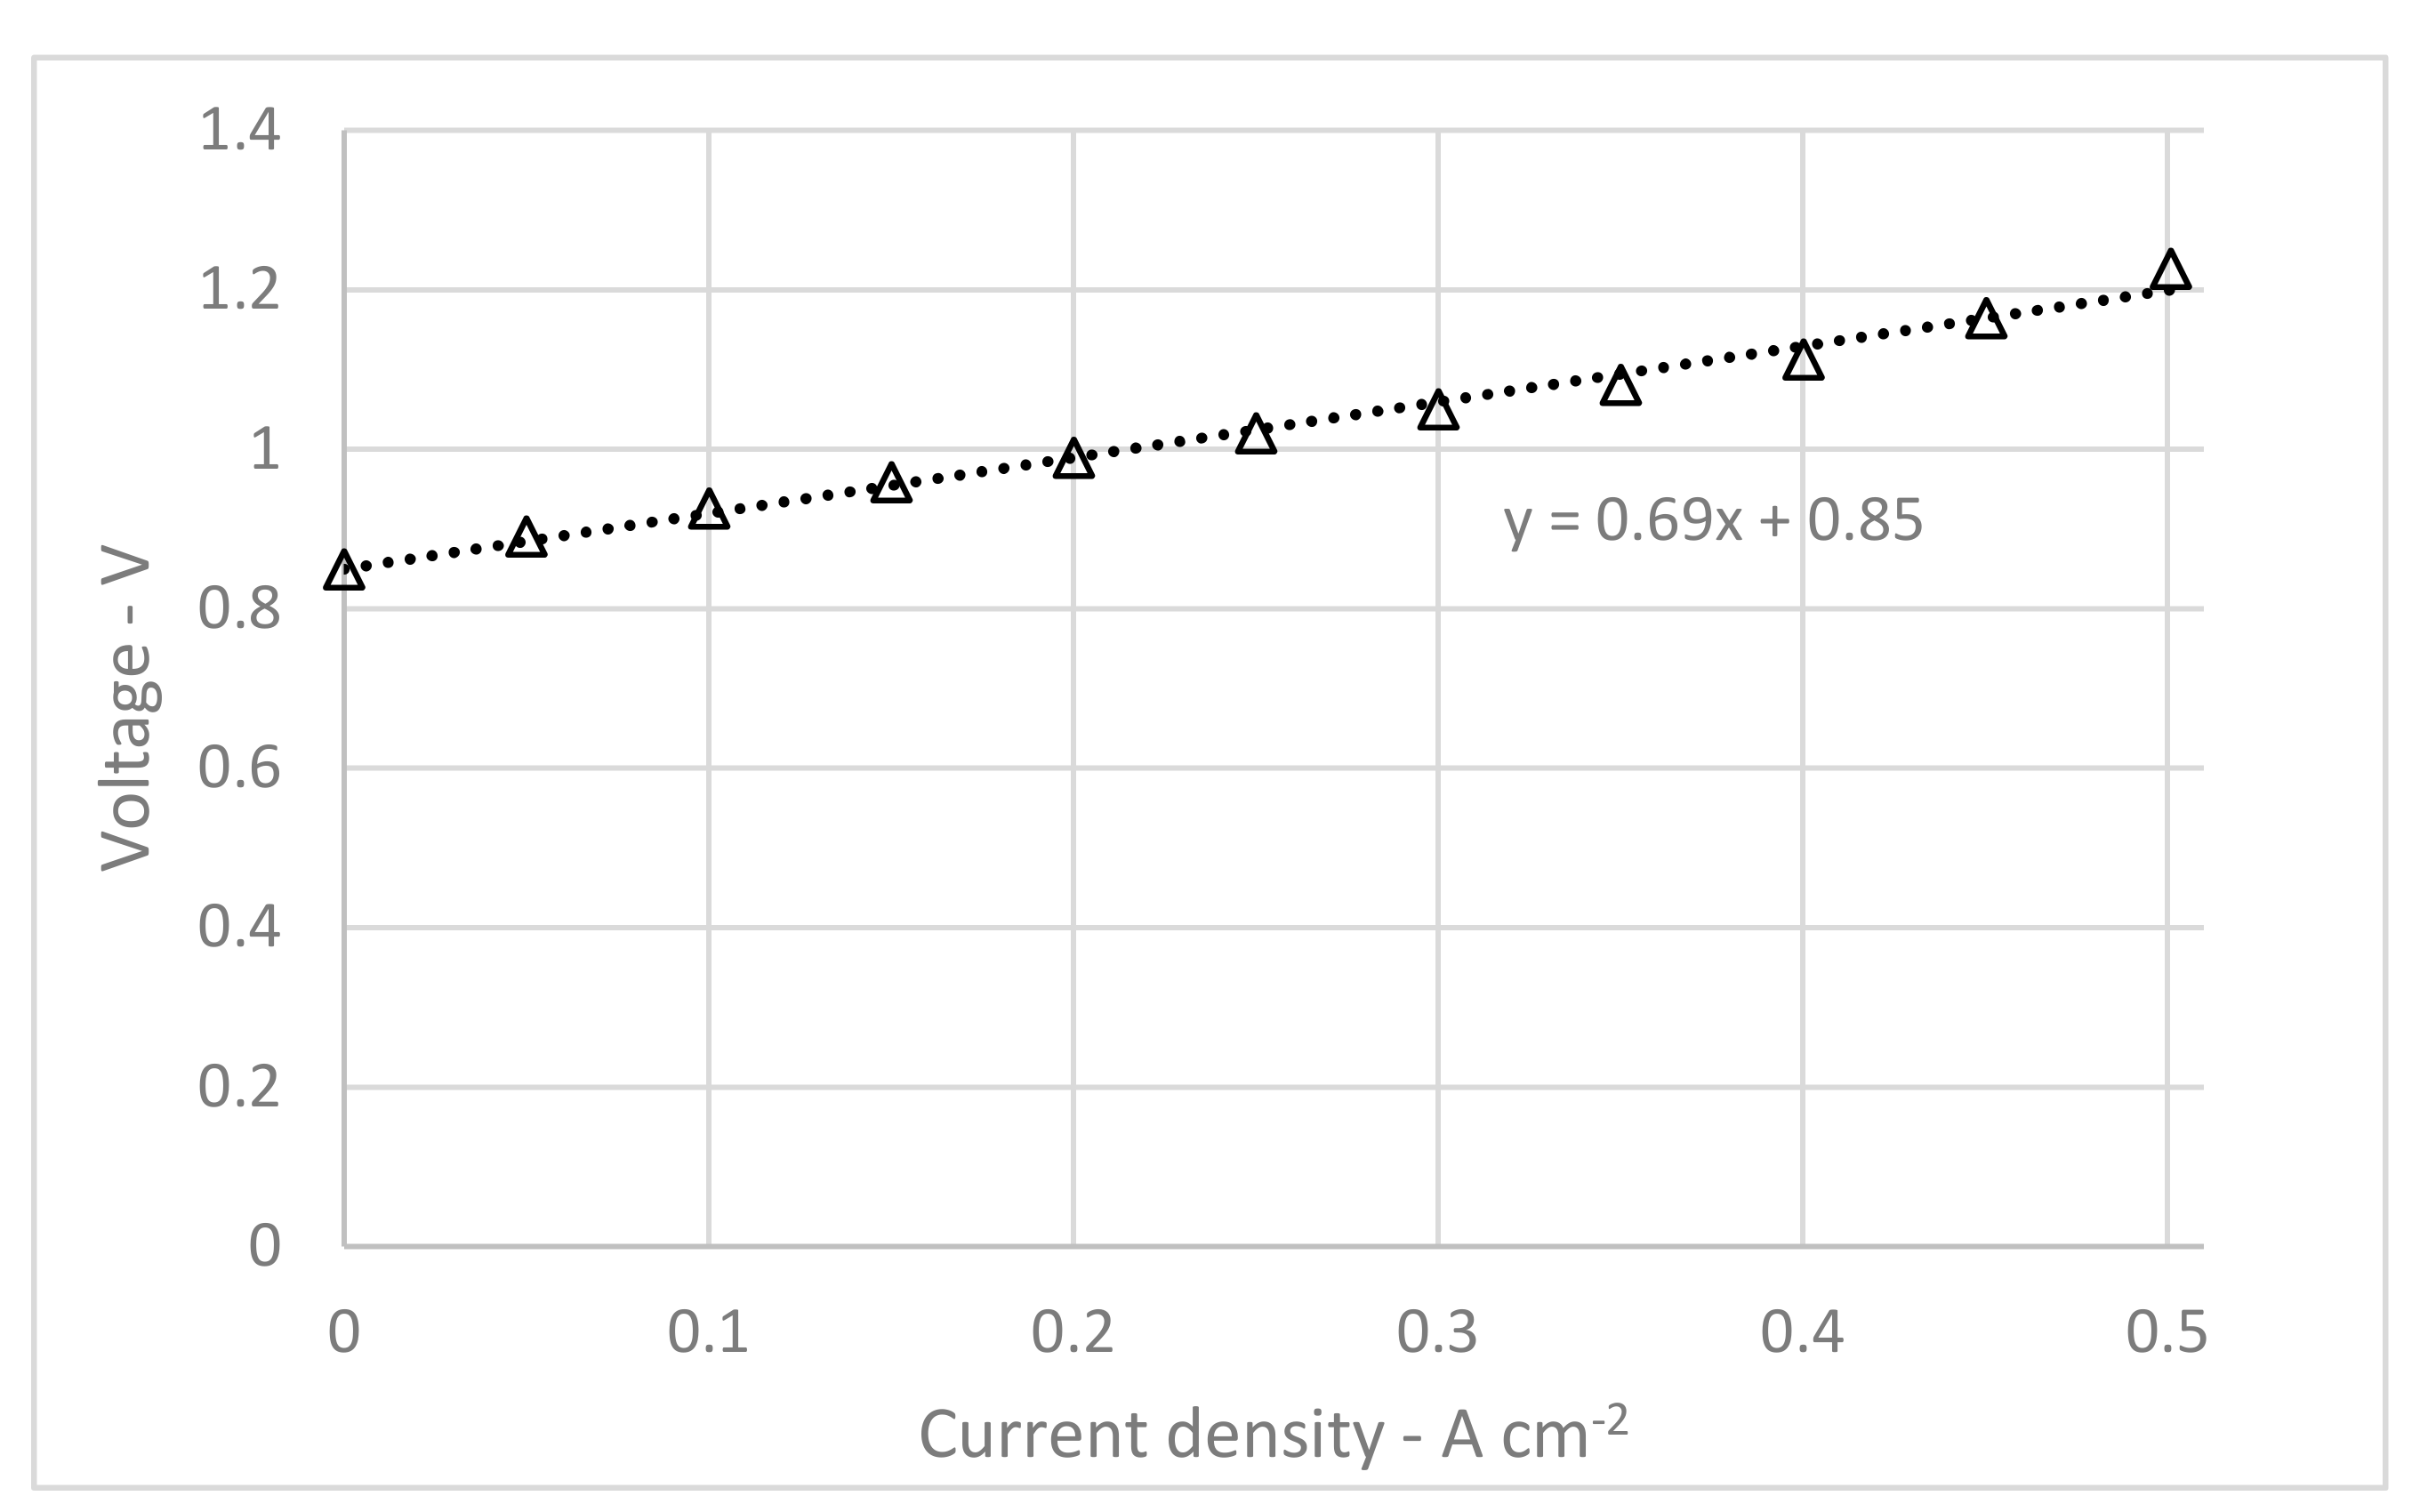
To supply input parameters (ASR and OCV) to the electrochemical part of the model, a polarization test was performed at 750 °C operating temperature. The hydrogen electrode was fed with a mixture H
2O:H
2 90:10 with an input flow rate chosen to reach a reactant utilization of 0.7 at final current of 500 mA cm
2. Oe/He condition was set to 1, in the middle of the range used in the model. Test inputs are reported in
Table 3. The experimental result is reported in
Figure 5. The graph also reports the regression curve and relative linear equation.
Based on the experimental results, ASR was fixed to 0.69 Ω cm
2 and OCV to 0.85 V. Both values are used to linearize cell voltage as a function of current density as follows Equation (9):
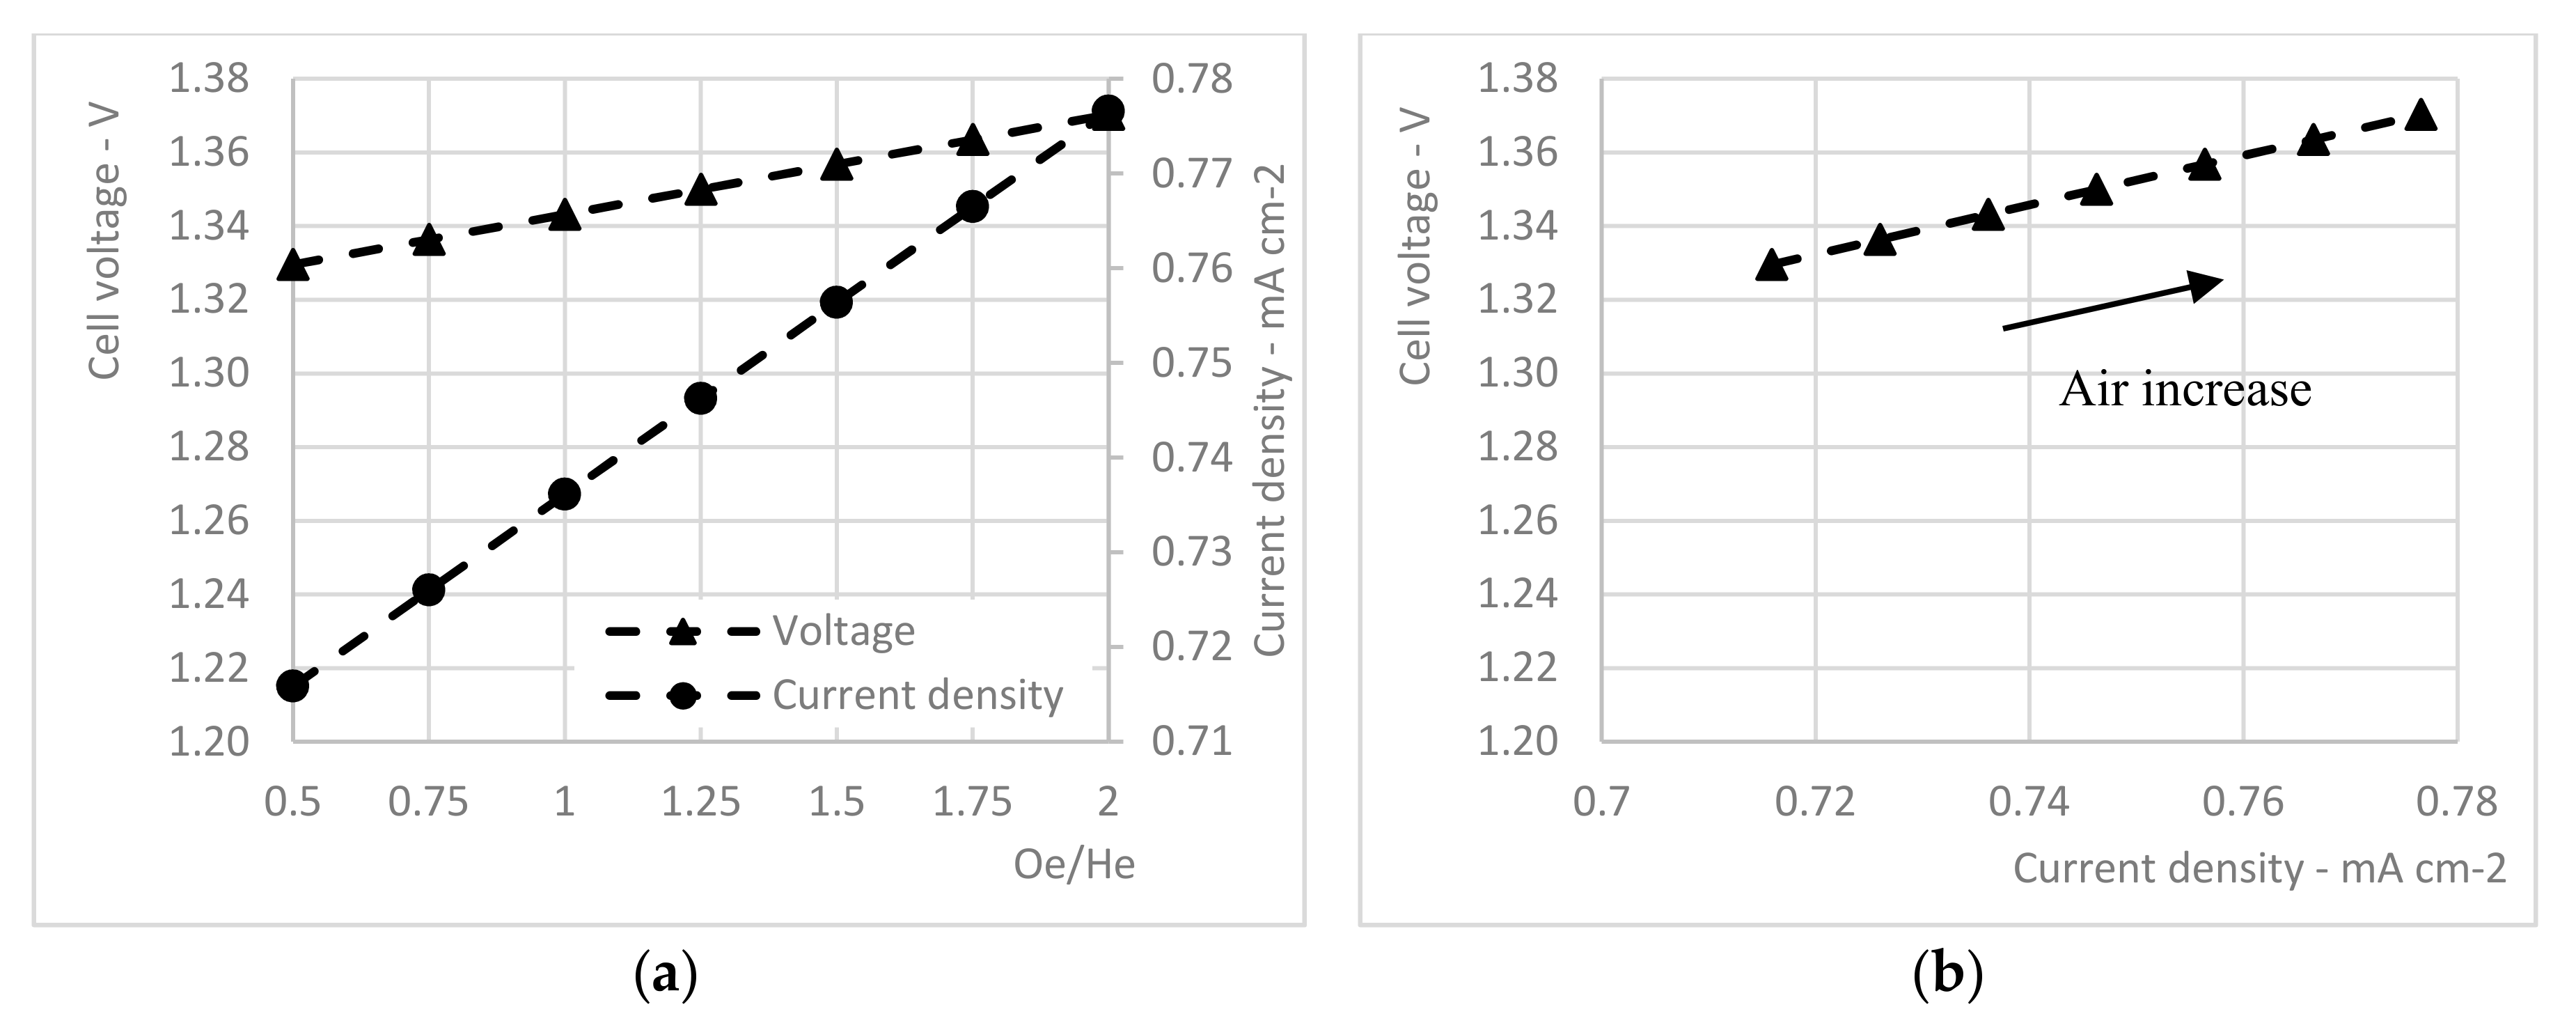
The main electrochemical results of the model are reported in
Figure 6. In detail, the two graphs report cell voltage and current density as a function of Oe/He and as a function of each other. When air flow decreases—i.e., Oe/He decreases—both voltage and current density drop. The equilibrium of the stack moves to lower values of voltage and current. If we consider the second graph in the figure—graph b—we can find the behavior predicted when describing
Figure 2. Higher values of air flow increase the heat demand to the stack, moving the operative point to the right.
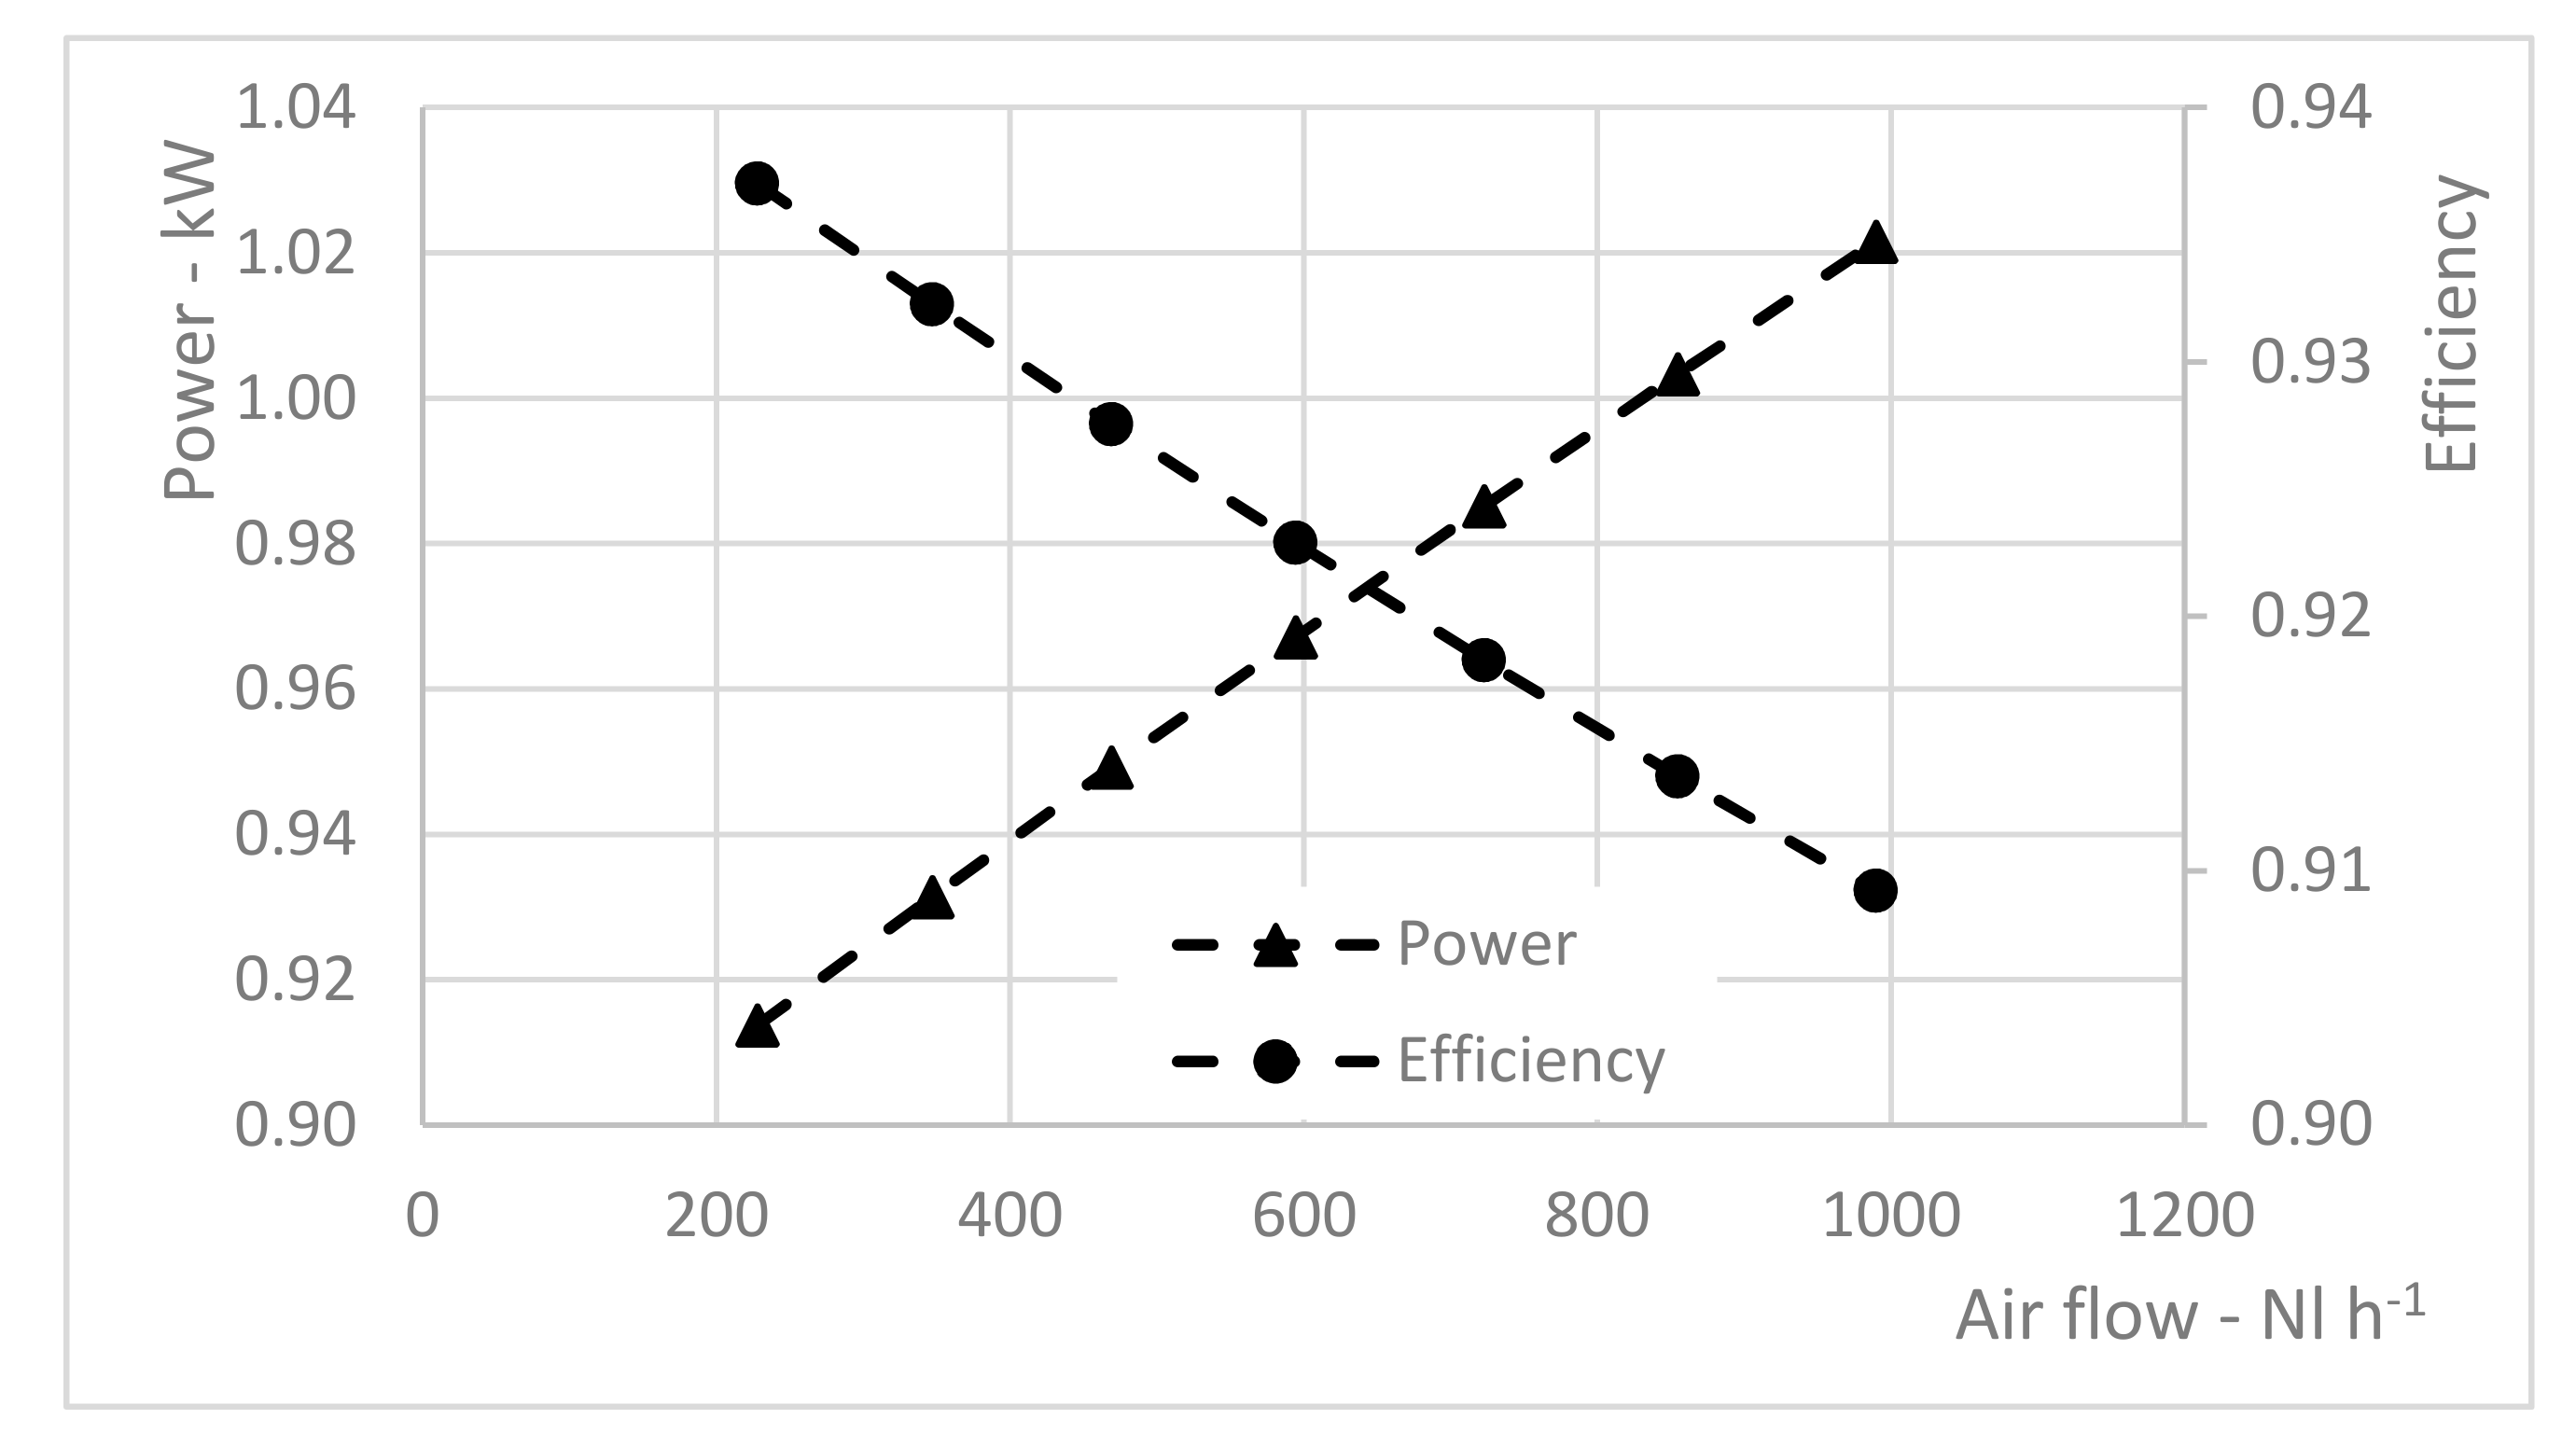
In
Figure 7, electrical power and efficiency are reported as a function of air flow rate. For a higher value of air flow the electrical power absorbed by the system increases due to the increase of both voltage and current density. Concerning efficiency, the heat adsorbed by the airflow, subtracted to the reaction, causes a decrease in chemical energy produced, which has a negative effect on efficiency. Therefore, it is possible to reduce air flow rate with benefits in terms of efficiency. Specifically, reducing the air flow rate from 989.64 (Oe/He = 2) to 228.07 Nl h
−1 (Oe/He = 0.5), the power increases by 10.8% with respect to nominal conditions (Oe/He = 2), while efficiency increases by 2.8 percentage points.
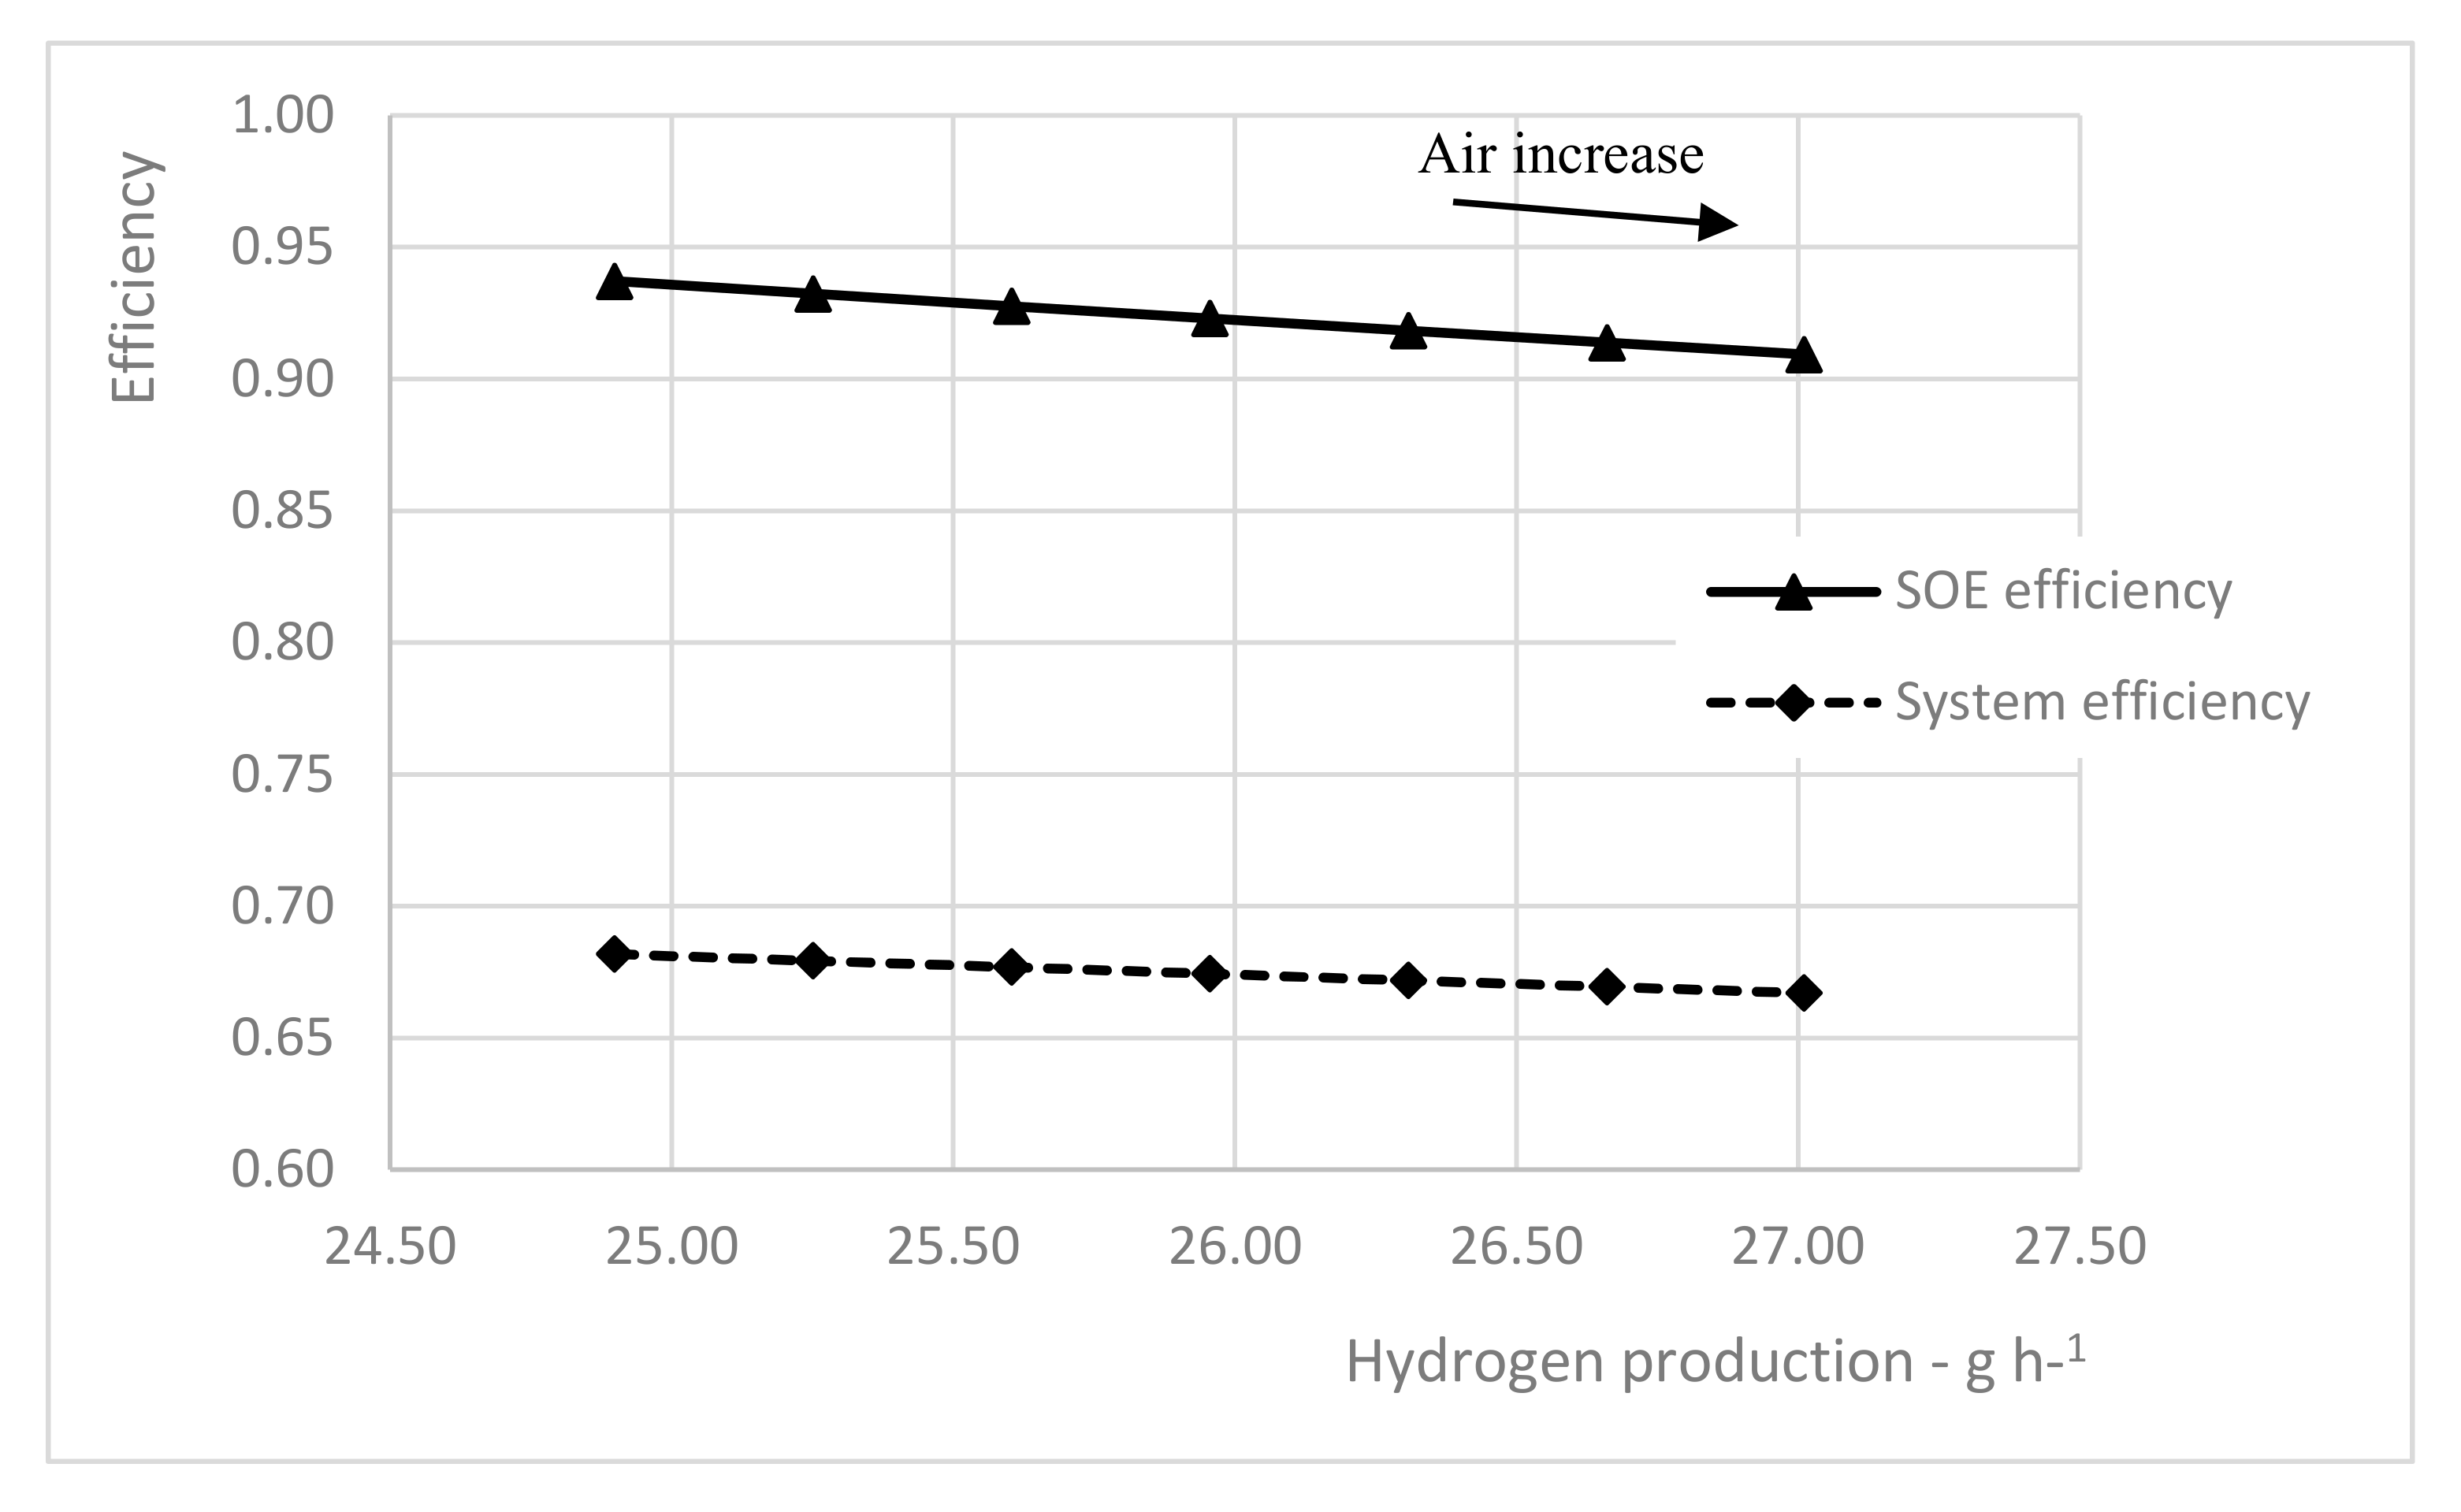
Figure 8 reports the efficiency vs. hydrogen production trend that can be considered as the characteristic curve of the electrolyzer. The graph clearly shows that varying air flow can increase or reduce hydrogen production. The system suffers of the well-known tradeoff between hydrogen production and efficiency, already commented in
Figure 1, with high efficiency for lower hydrogen production and, consequently, higher system costs to produce the same amount of hydrogen. Note that system efficiency has smaller variation due to the contribution of water evaporation combined with the variation of water flow. Such efficiency is not a complete description of the system because the optimization of the hydrogen electrode flows, e.g., heat exchanger, is not implemented in the model and is not in the aim of this study.
Figure 8 perfectly describes how the air variation can be used to rate hydrogen production of the system keeping constant operating temperature.
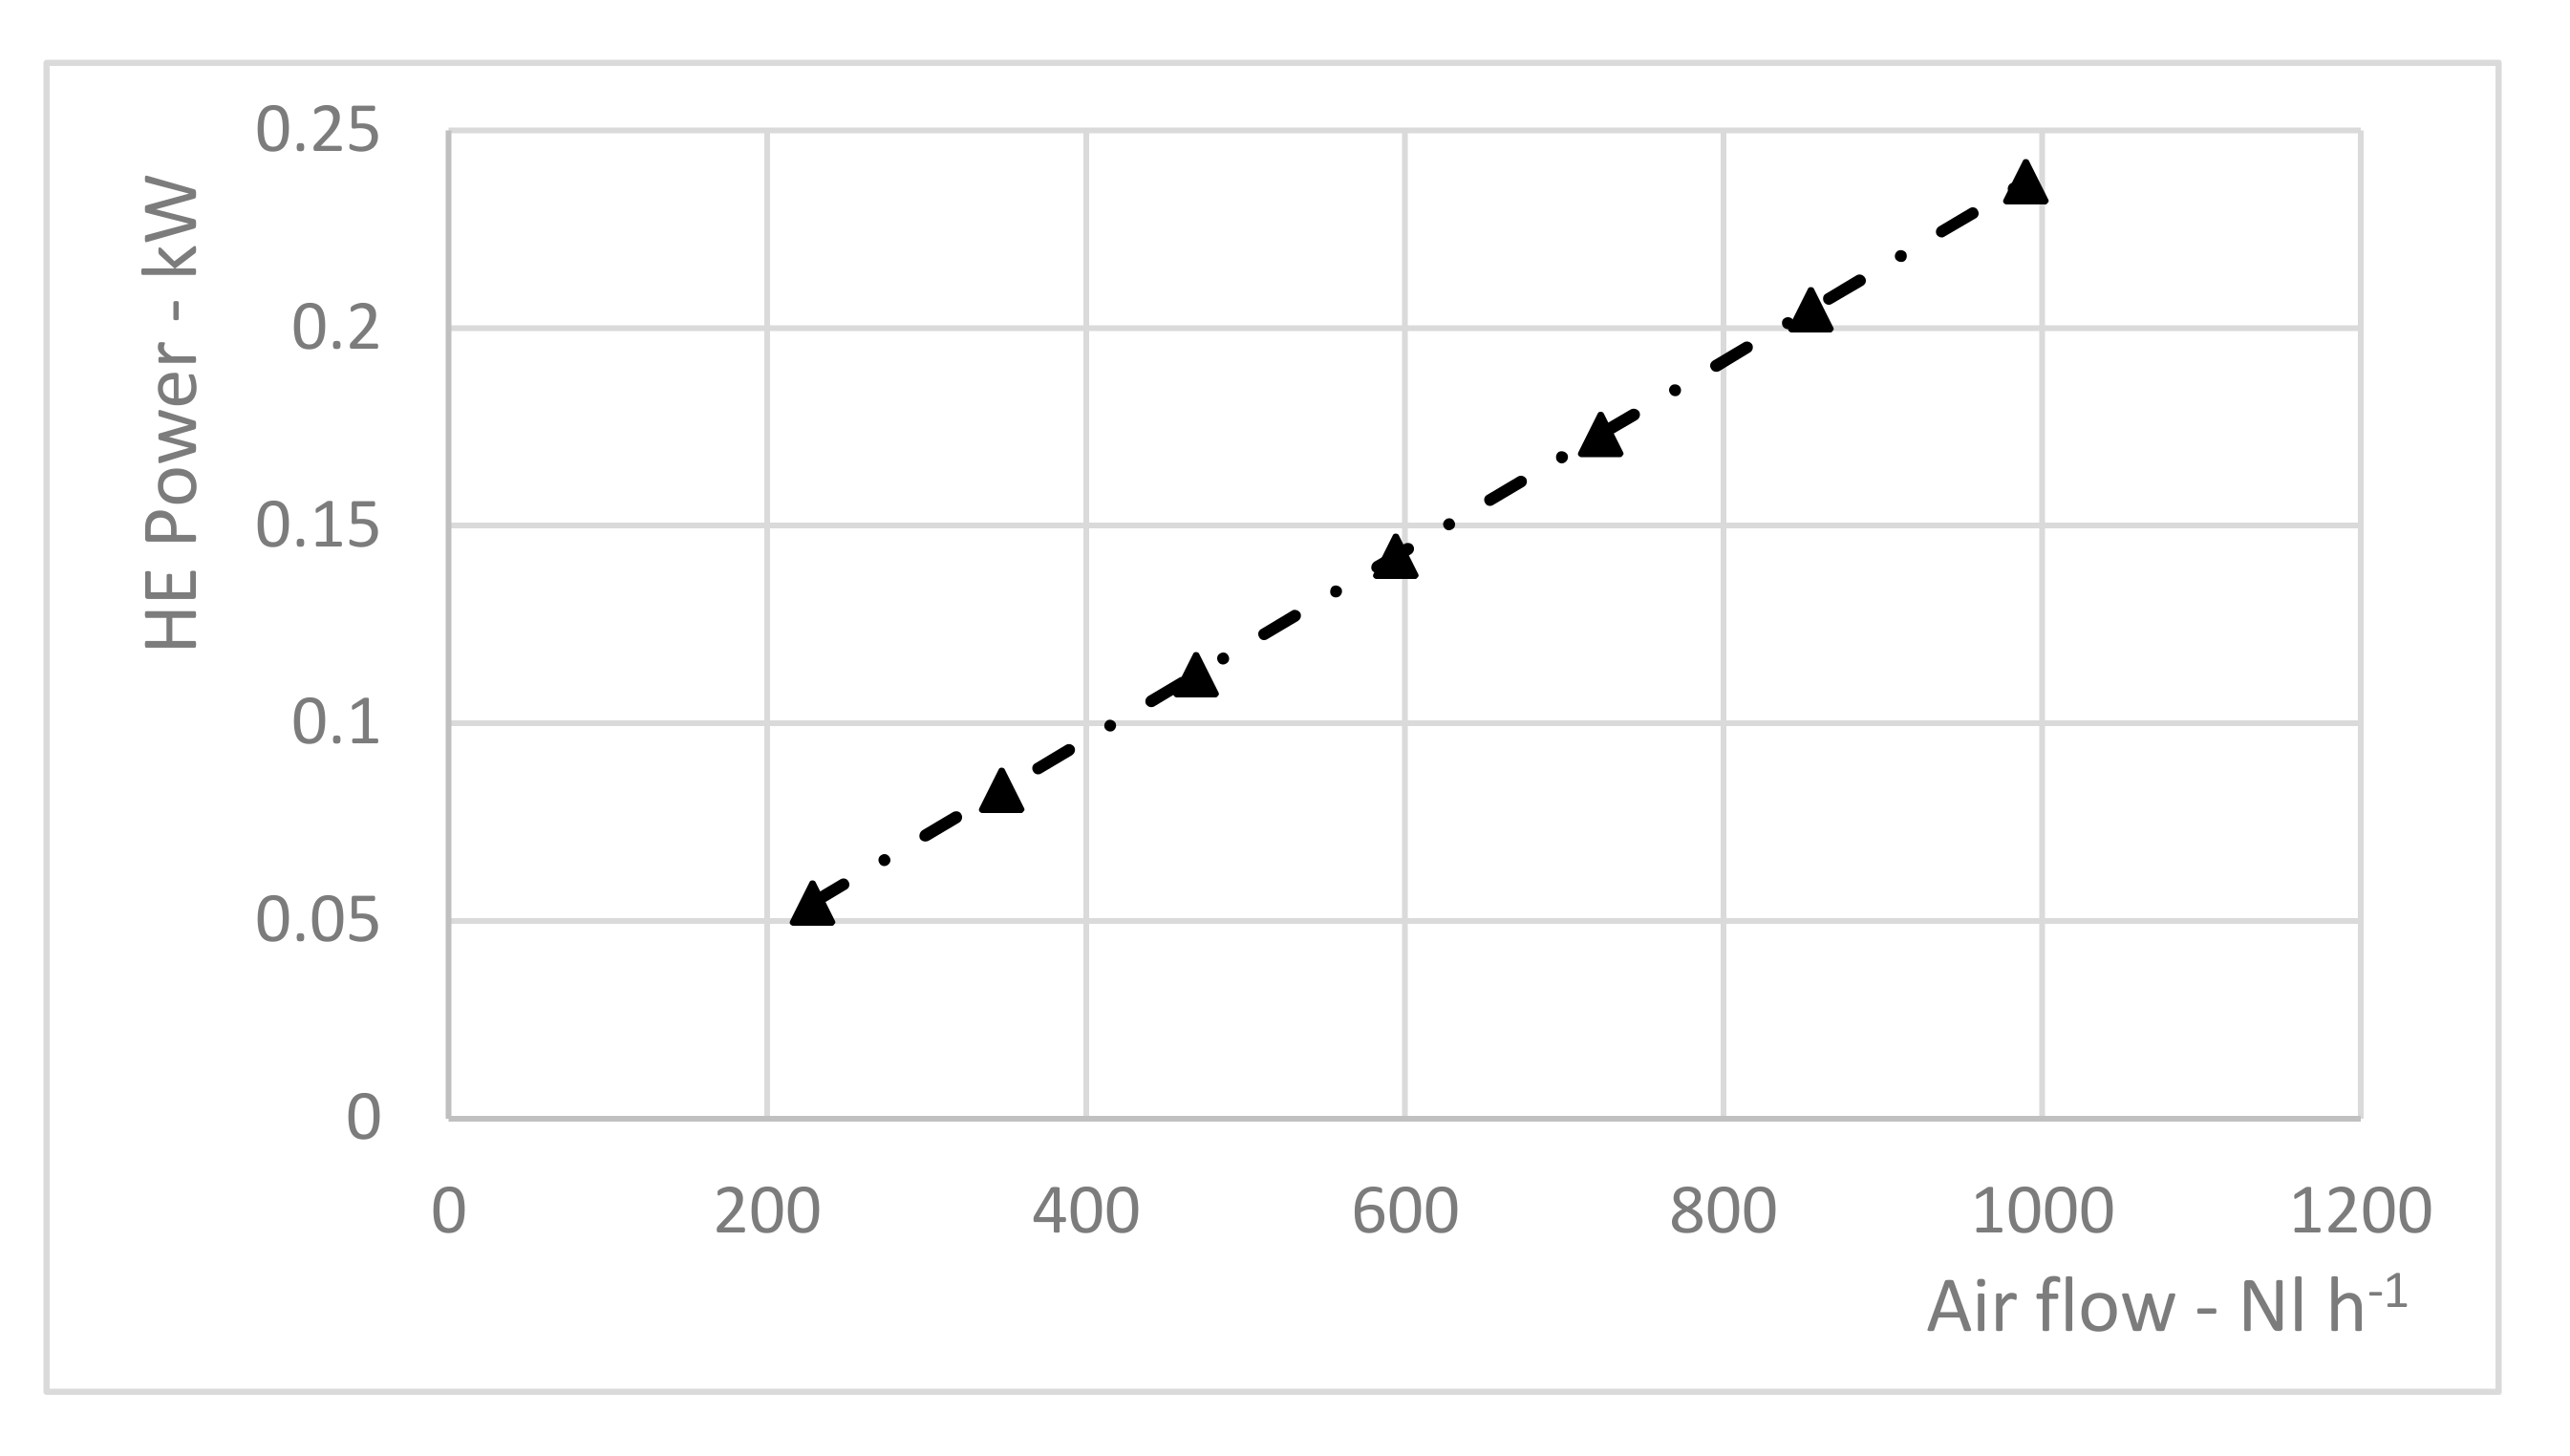
Looking to the heat exchanger, in
Figure 9. It is reported the variation of the thermal power exchanged in the device as function of air flow. As expected, such value increases with the increase of air flow. This parameter is necessary to design the heat exchanger once best operative condition is selected.
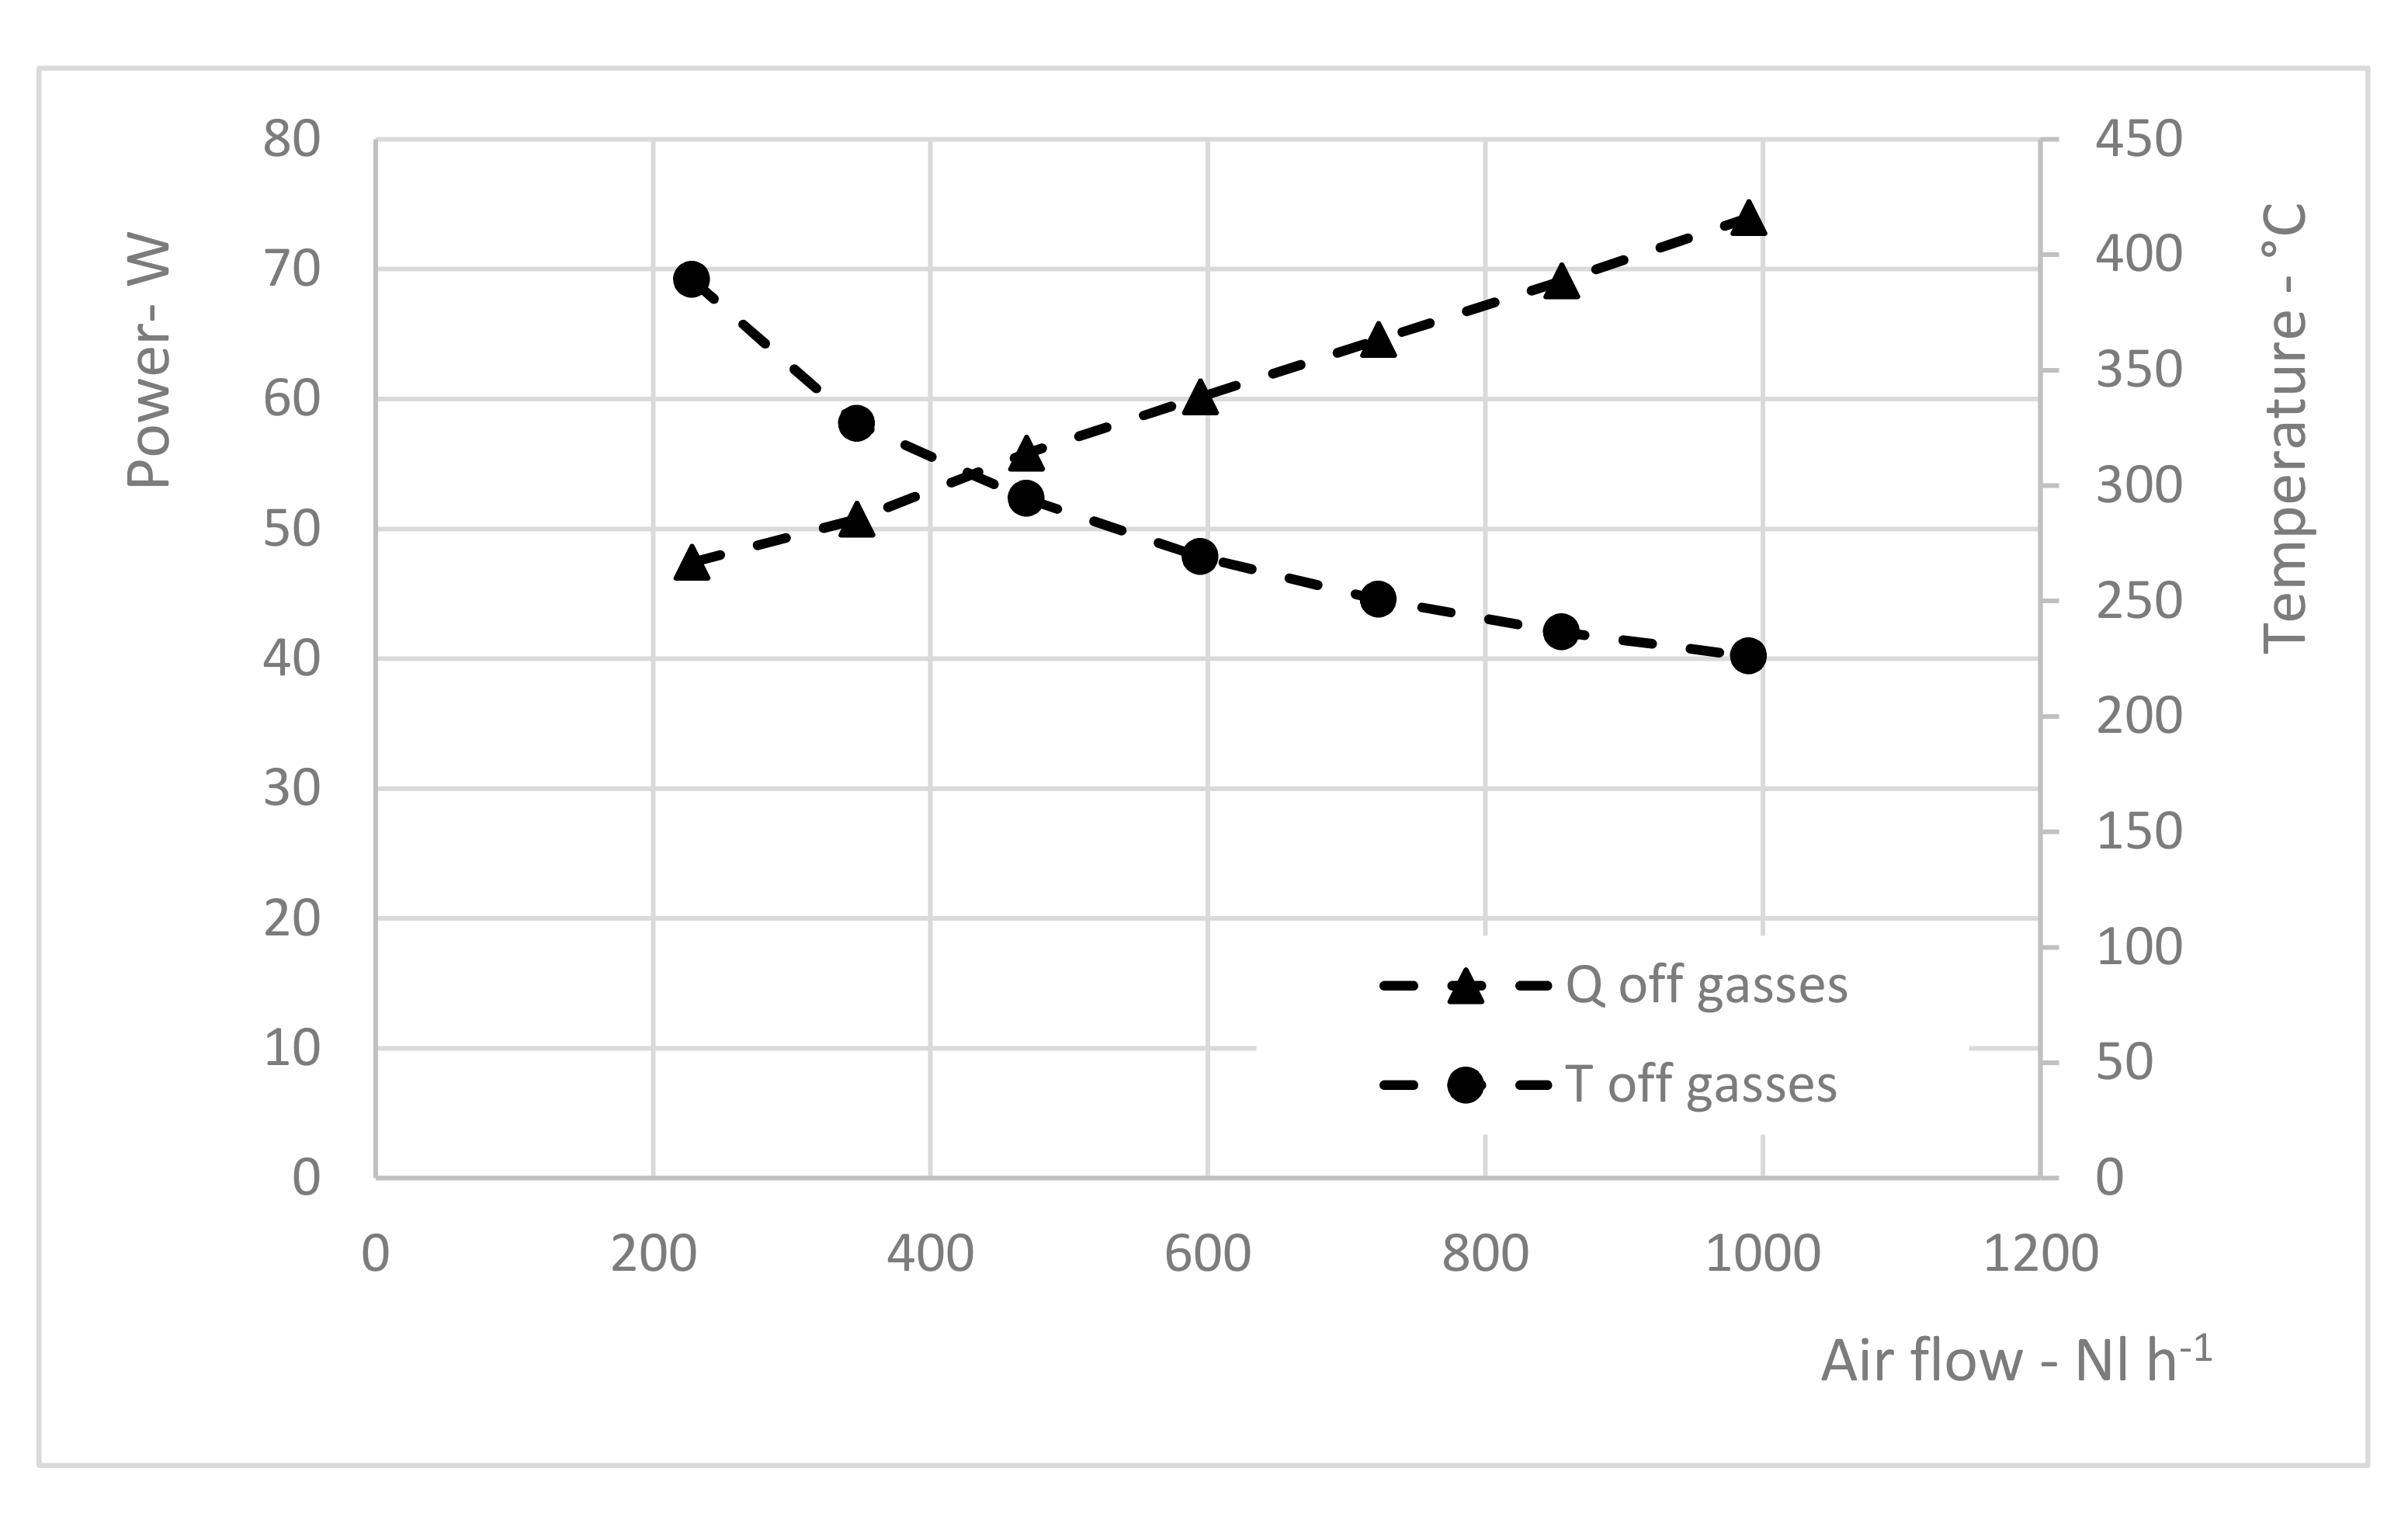
Finally,
Figure 10 reports the outlet temperature of the system and the heat available in case a cogeneration is possible, decreasing the off gasses temperature down to 50 °C. Even if the temperature is still acceptable for any cogeneration purpose, the total amount of heat available is very small—the values reported are in W.


