
Effects of Phthalate Esters (PAEs) on Cell Viability and Nrf2 of HepG2 and 3D-QSAR Studies


Abstract
1. Introduction
2. Materials and Methods
2.1. Cell Culture
2.2. Cell Viability
2.3. Western Blot Analysis
2.4. D-QSAR
2.4.1. CoMFA and CoMSIA for LD50 of PAEs
2.4.2. CoMFA and CoMSIA for IC50 of PAEs
2.4.3. CoMSIA for Nrf2 of PAEs
2.5. Applicability Domain
2.6. Statistical Validation
2.7. Statistical Analysis
3. Results and Discussion
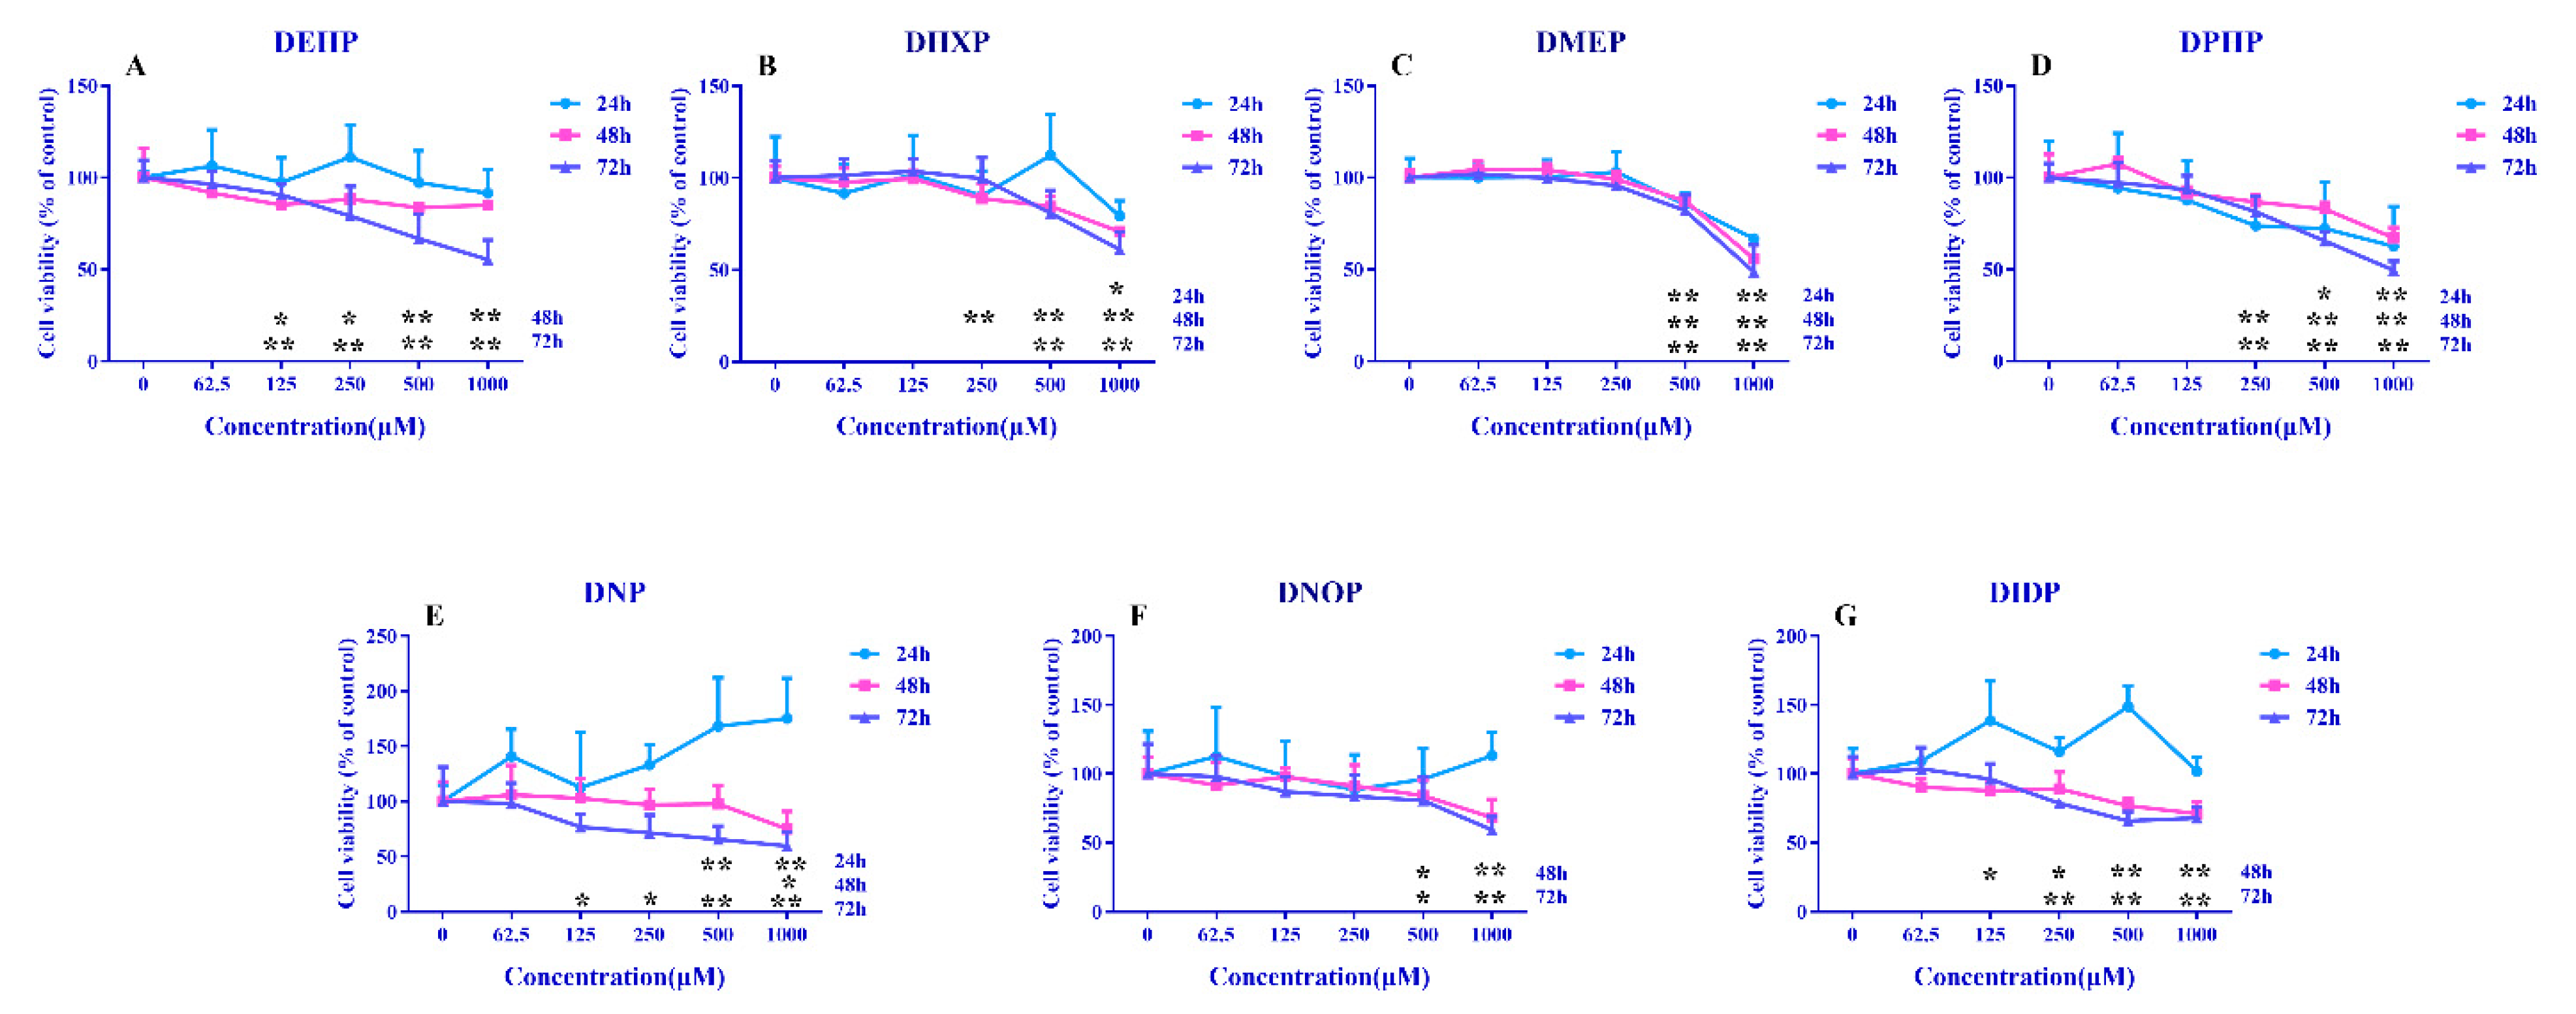
3.1. Cell Viability
3.2. Nrf2 Protein Content
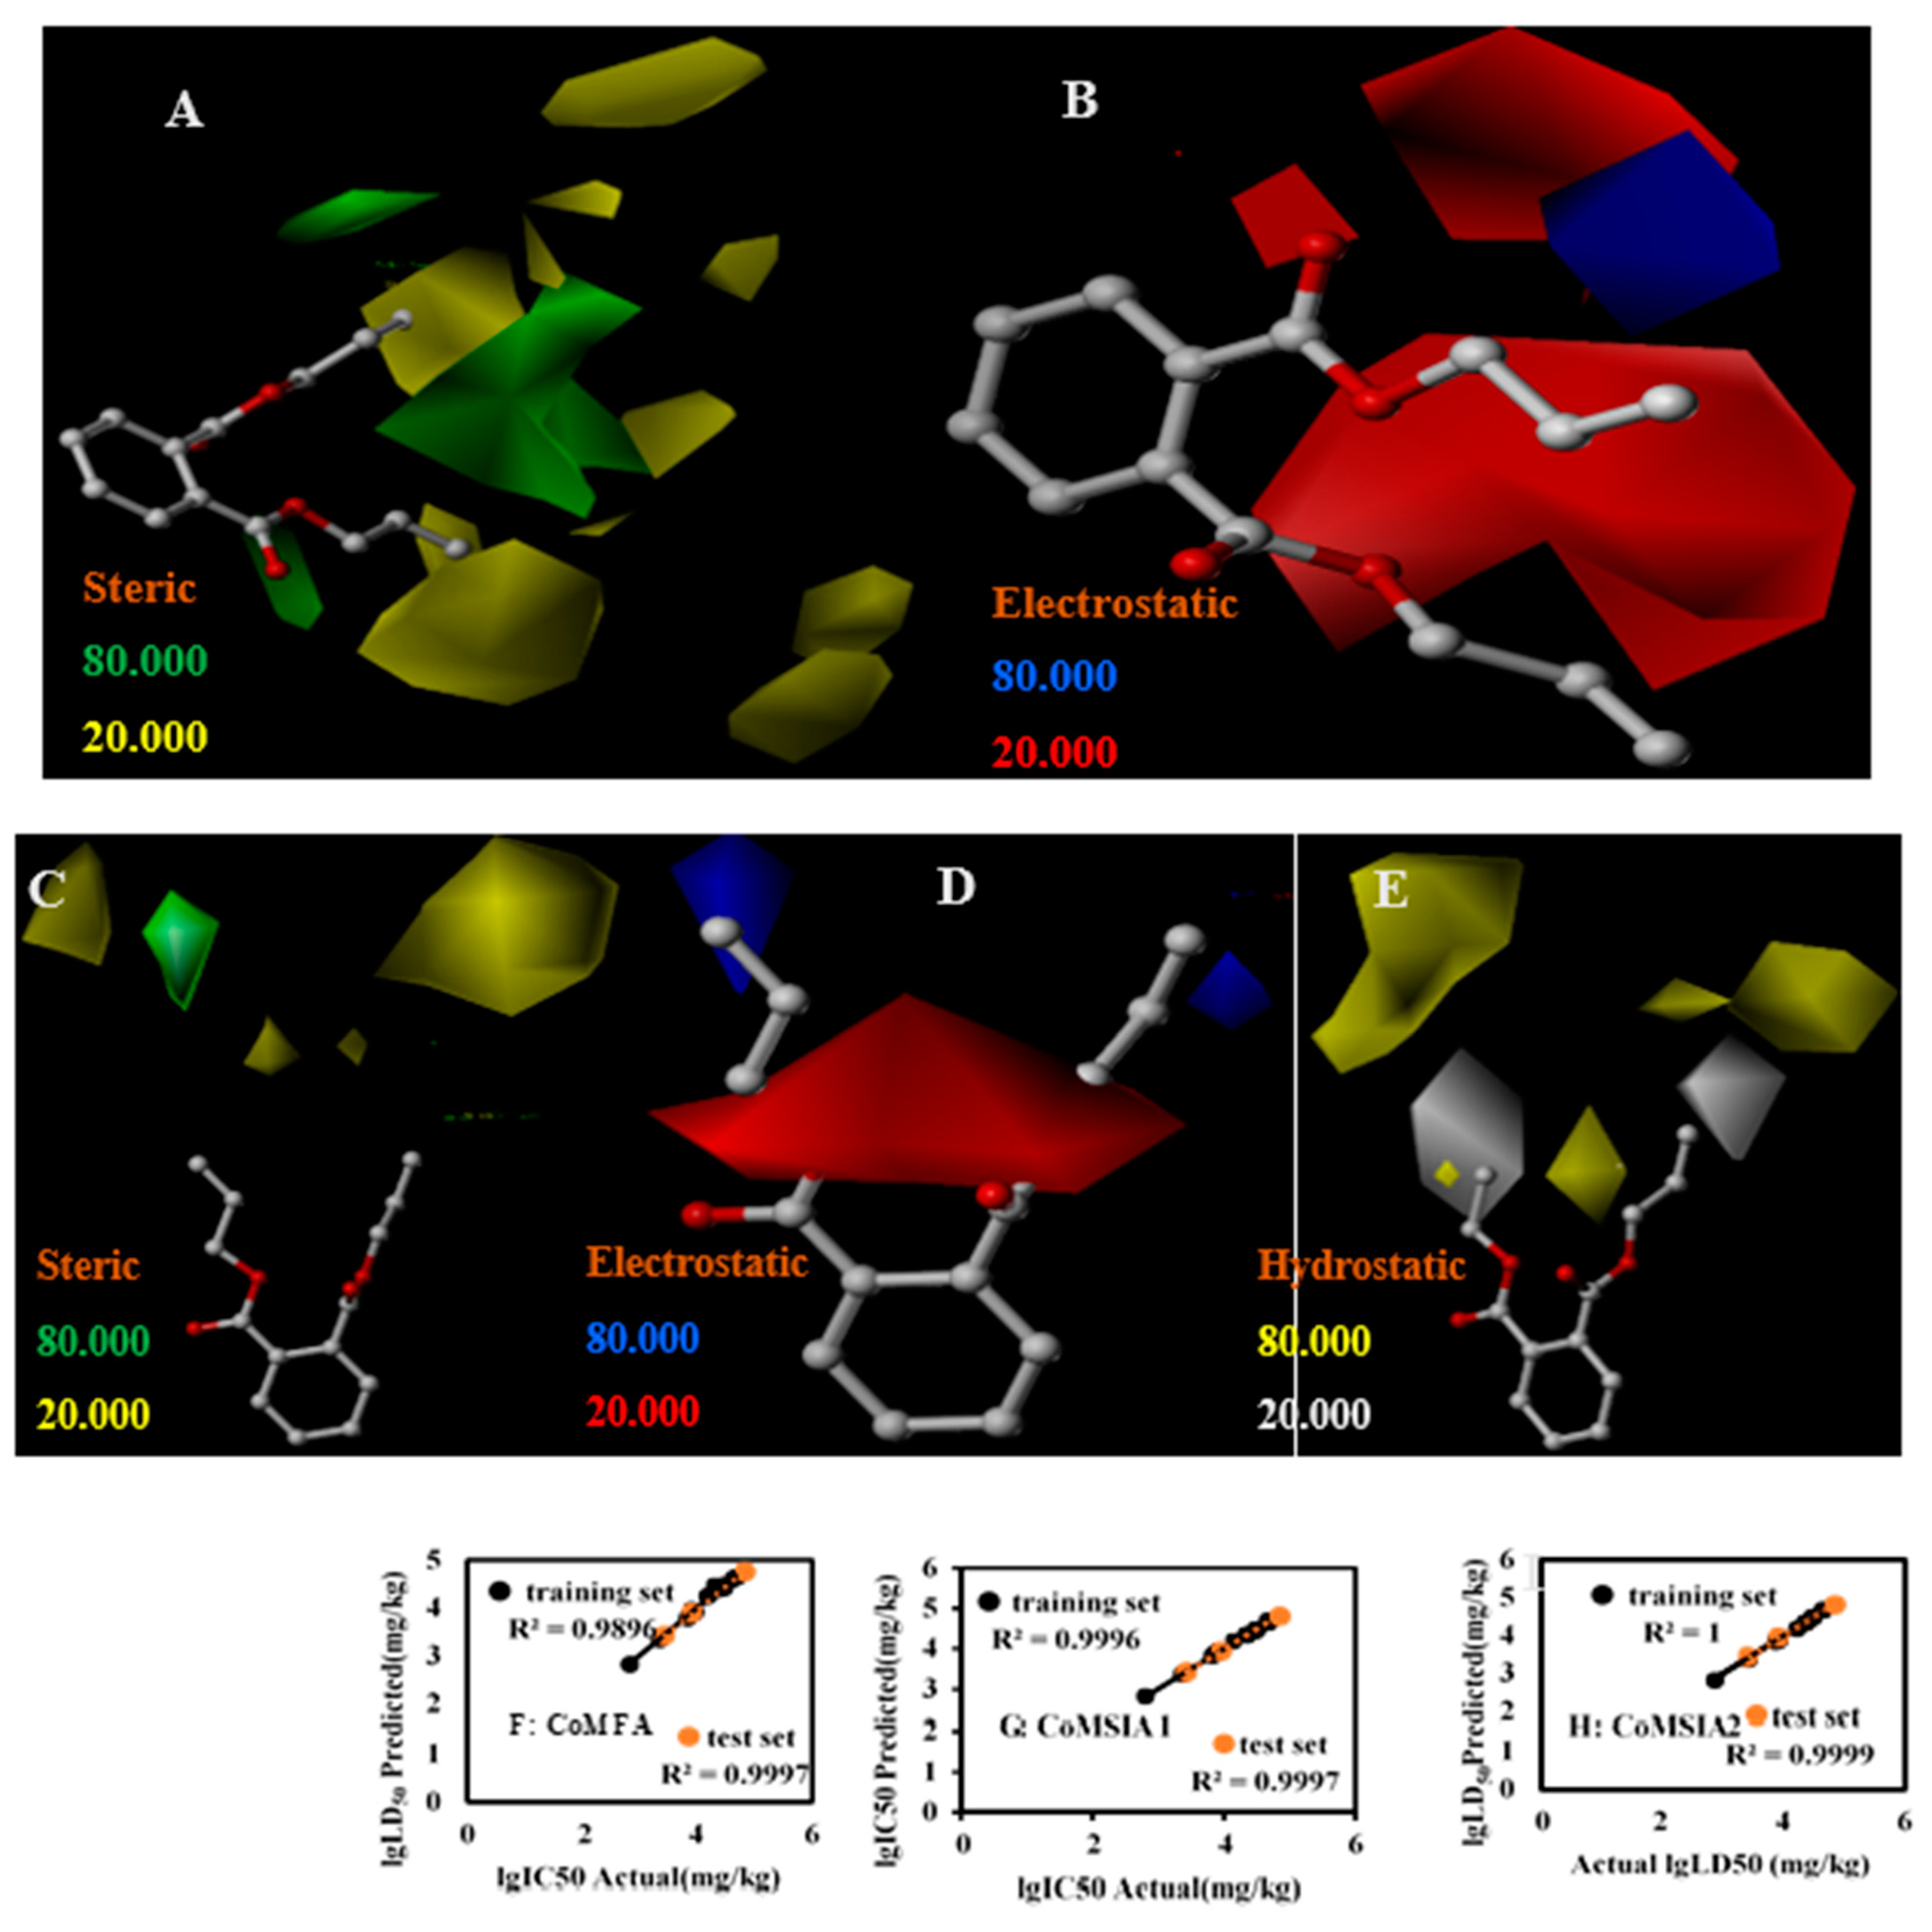
3.3. LD50 3D-QSAR
3.4. IC50 3D-QSAR
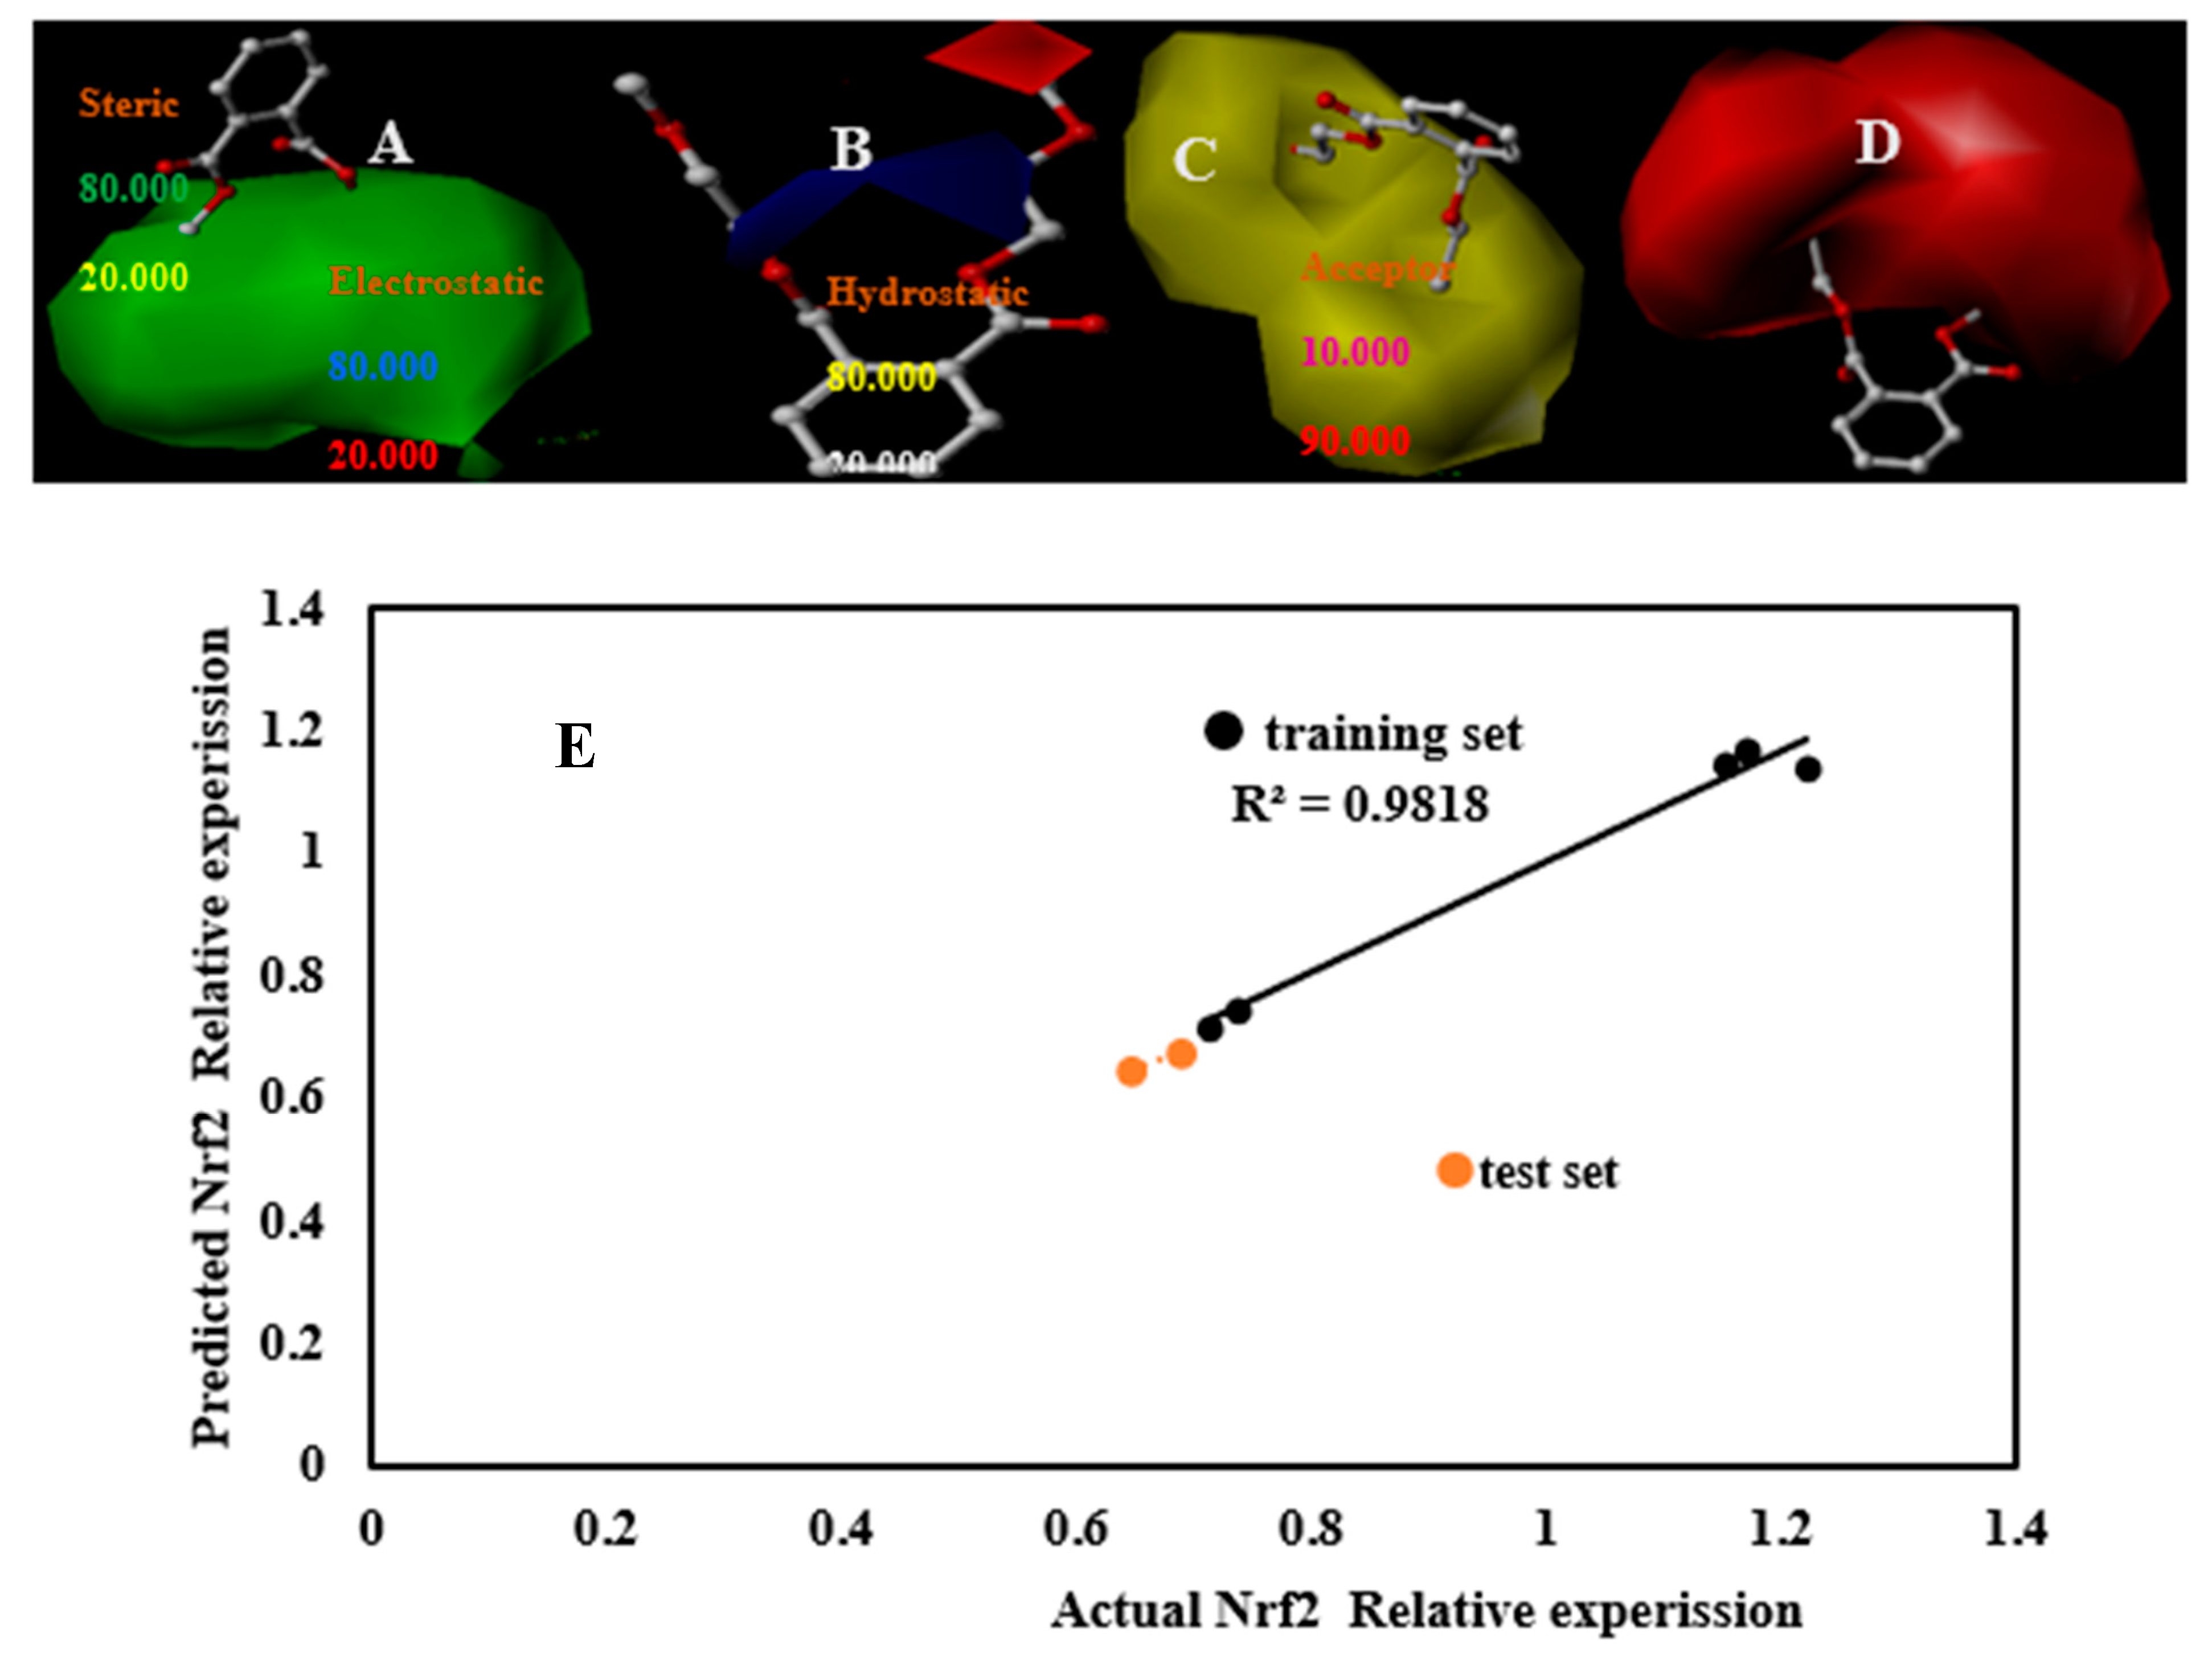
3.5. Nrf2 3D-QSAR
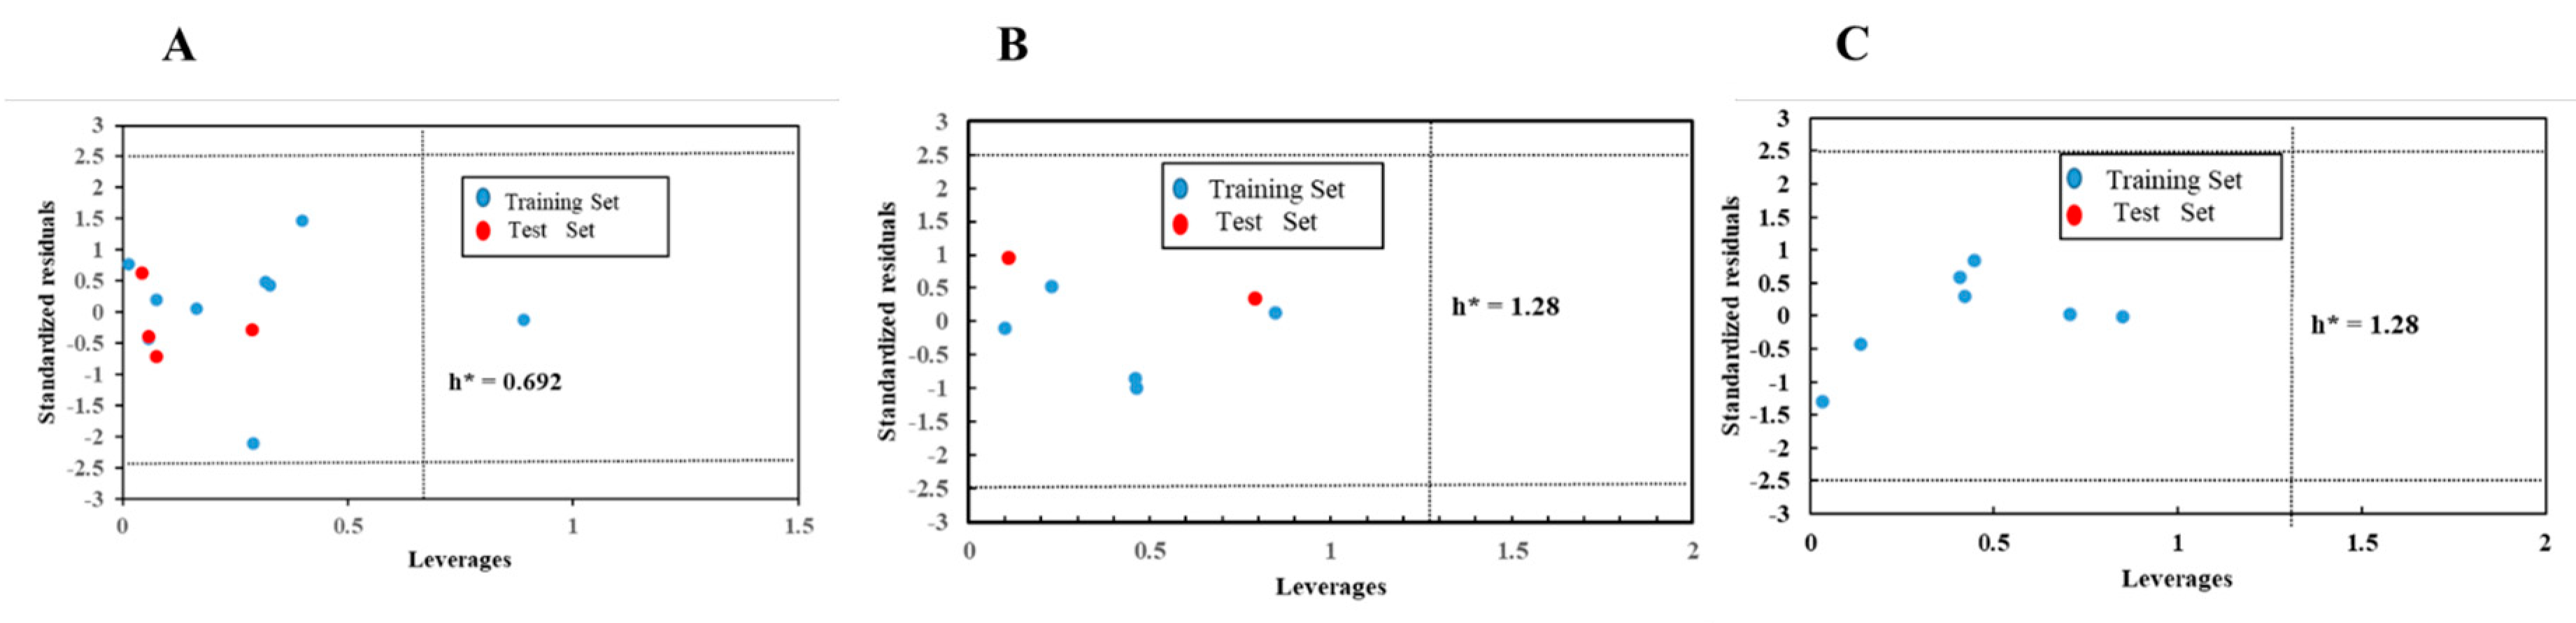
3.6. Applicability Domain
3.7. Statistical Validation
4. Conclusions
Author Contributions
Funding
Institutional Review Board Statement
Informed Consent Statement
Data Availability Statement
Conflicts of Interest
References
- Schecter, A.; Lorber, M.; Guo, Y.; Wu, Q.; Yun, S.H.; Kannan, K.; Hommel, M.; Imran, N.; Hynan, L.S.; Cheng, D.; et al. Phthalate concentrations and dietary exposure from food purchased in New York State. Environ. Health Perspect. 2013, 121, 473–494. [Google Scholar] [CrossRef] [PubMed]
- Ventrice, P.; Ventrice, D.; Russo, E.; de Sarro, G. Phthalates: European regulation, chemistry, pharmacokinetic and related toxicity. Environ. Toxicol. Pharmacol. 2013, 36, 88–96. [Google Scholar] [CrossRef] [PubMed]
- Cirillo, T.; Fasano, E.; Castaldi, E.; Montuori, P.; Amodio Cocchieri, R. Children’s exposure to di (2-ethylhexyl) phthalate and dibutylphthalate plasticizers from school meals. J. Agric. Food. Chem. 2011, 59, 10532–10538. [Google Scholar] [CrossRef] [PubMed]
- Niu, L.; Xu, Y.; Xu, C.; Yun, L.; Liu, W. Status of phthalate esters contamination in agricultural soils across China and associated health risks. Environ. Pollut. 2014, 195, 16–23. [Google Scholar] [CrossRef] [PubMed]
- Wittassek, M.; Koch, H.M.; Angerer, J.; Brüning, T. Assessing exposure to phthalates—The human biomonitoring approach. Mol. Nutr. Food Res. 2011, 55, 7–31. [Google Scholar] [CrossRef]
- Buckley, J.P.; Palmieri, R.T.; Matuszewski, J.M.; Herring, A.H.; Baird, D.D.; Hartmann, K.E.; Hoppin, J.A. Consumer product exposures associated with urinary phthalate levels in pregnant women. J. Expo. Sci. Environ. Epidemiol. 2012, 22, 468–475. [Google Scholar] [CrossRef]
- Schecter, A. Dioxins and Health: Including Other Persistent Organic Pollutants and Endocrine Disruptors; John Wiley & Sons: Hoboken, NJ, USA, 2012. [Google Scholar]
- Fromme, H.; Kuchler, T.; Otto, T.; Pilz, K.; Muller, J.; Wenzel, A. Occurrence of phthalates and bisphenol A and F in the environment. Water Res. 2002, 36, 1429–1438. [Google Scholar] [CrossRef]
- Wang, J.; Luo, Y.; Teng, Y.; Ma, W.; Christie, P.; Li, Z. Soil contamination by phthalate esters in Chinese intensive vegetable production systems with different modes of use of plastic film. Environ. Pollut. 2013, 180, 265–273. [Google Scholar] [CrossRef] [PubMed]
- Meng, X.Z.; Wang, Y.; Xiang, N.; Chen, L.; Liu, Z.; Wu, B.; Dai, X.; Zhang, Y.H.; Xie, Z.; Ebinghaus, R. Flow of sewage sludge-borne phthalate esters (PAEs) from human release to human intake: Implication for risk assessment of sludge applied to soil. Sci. Total Environ. 2014, 476–477, 242–249. [Google Scholar] [CrossRef] [PubMed]
- Pan, G.; Hanaoka, T.; Yoshimura, M.; Zhang, S.; Wang, P.; Tsukino, H.; Inoue, K.; Nakazawa, H.; Tsugane, S.; Takahashi, K. Decreased serum free testosterone in workers exposed to high levels of di-n-butyl phthalate (DBP) and di-2-ethylhexyl phthalate (DEHP): A cross-sectional study in China. Environ. Health Perspect. 2006, 114, 1643–1648. [Google Scholar] [CrossRef]
- Swan, S.H.; Main, K.M.; Liu, F.; Stewart, S.L.; Kruse, R.L.; Calafat, A.M.; Mao, C.S.; Redmon, J.B.; Ternand, C.L.; Sullivan, S. Decrease in anogenital distance among male infants with prenatal phthalate exposure. Environ. Health Perspect. 2005, 113, 1056–1061. [Google Scholar] [CrossRef] [PubMed]
- Ward, J.M.; Peters, J.M.; Perella, C.M.; Gonzalez, F.J. Receptor and nonreceptor-mediated organ-specific toxicity of di (2-ethylhexyl) phthalate (DEHP) in peroxisome proliferator-activated receptorα-null mice. Toxicol. Pathol. 1998, 26, 240–246. [Google Scholar] [CrossRef]
- Ye, H.; Ha, M.; Yang, M.; Yue, P.; Xie, Z.; Liu, C. Di2-ethylhexyl phthalate disrupts thyroid hormone homeostasis through activating the Ras/Akt/TRHr pathway and inducing hepatic enzymes. Sci. Rep. 2017, 7, 1–12. [Google Scholar] [CrossRef] [PubMed]
- Chen, H.; Zhang, W.; Rui, B.B.; Yang, S.M.; Xu, W.P.; Wei, W. Di(2-ethylhexyl) phthalate exacerbates non-alcoholic fatty liver in rats and its potential mechanisms. Environ. Toxicol. Pharmacol. 2016, 42, 38–44. [Google Scholar] [CrossRef]
- Osburn, W.O.; Kensler, T.W. Nrf2 signaling: An adaptive response pathway for protection against environmental toxic insults. Mutat. Res. 2008, 659, 31–39. [Google Scholar] [CrossRef]
- Gray, L.E., Jr.; Ostby, J.; Furr, J.; Price, M.; Veeramachaneni, D.R.; Parks, L. Perinatal exposure to the phthalates DEHP, BBP, and DINP, but not DEP, DMP, or DOTP, alters sexual differentiation of the male rat. Toxicol. Sci. 2000, 58, 350–365. [Google Scholar] [CrossRef]
- Dearden, J.C. The history and development of quantitative structure-activity relationships (QSARs). In Oncology: Breakthroughs in Research and Practice; IGI Global: Hershey, PA, USA, 2017; pp. 1–55. [Google Scholar] [CrossRef]
- Desai, N.C.; Bhatt, N.B.; Joshi, S.B.; Jadeja, K.A.; Khedkar, V.M. Synthesis, antimicrobial activity and 3d-qsar study of hybrid oxazine clubbed pyridine scaffolds. ChemistrySelect 2019, 4, 7541–7550. [Google Scholar] [CrossRef]
- Afantitis, A.; Tsoumanis, A.; Melagraki, G. Enalos suite of tools: Enhancing cheminformatics and nanoinformatics through knime. Curr. Med. Chem. 2020, 6523–6535. [Google Scholar] [CrossRef] [PubMed]
- Chen, X.; Qin, Q.; Zhang, W.; Zhang, Y.; Zheng, H.; Liu, C.; Yang, Y.; Xiong, W.; Yuan, J. Activation of the PI3K–AKT–mTOR signaling pathway promotes DEHP-induced Hep3B cell proliferation. Food. Chem. Toxicol. 2013, 59, 325–333. [Google Scholar] [CrossRef]
- Cho, H.Y.; Kleeberger, S.R. Nrf2 protects against airway disorders. Toxicol. Appl. Pharmacol. 2010, 244, 43–56. [Google Scholar] [CrossRef] [PubMed]
- Naidu, S.D.; Kostov, R.V.; Dinkova-Kostova, A.T. Transcription factors Hsf1 and Nrf2 engage in crosstalk for cytoprotection. Trends. Pharmacol. Sci. 2015, 36, 6–14. [Google Scholar] [CrossRef]
- Gong, P.; Cederbaum, A.I. Nrf2 is increased by CYP2E1 in rodent liver and HepG2 cells and protects against oxidative stress caused by CYP2E1. J. Hepatol. 2006, 43, 144–153. [Google Scholar] [CrossRef] [PubMed]
- Luo, Y.; Li, X.N.; Zhao, Y.; Du, Z.H.; Li, J.L. DEHP triggers cerebral mitochondrial dysfunction and oxidative stress in quail (Coturnix japonica) via modulating mitochondrial dynamics and biogenesis and activating Nrf2-mediated defense response. Chemosphere 2019, 224, 626–633. [Google Scholar] [CrossRef] [PubMed]
- Sun, X.; Lin, Y.; Huang, Q.; Shi, J.; Qiu, L.; Kang, M.; Chen, Y.; Fang, C.; Ye, T.; Dong, S. Di (2-ethylhexyl) phthalate-induced apoptosis in rat INS-1 cells is dependent on activation of endoplasmic reticulum stress and suppression of antioxidant protection. J. Cell. Mol. Med. 2015, 19, 581–594. [Google Scholar] [CrossRef] [PubMed]
- Tang, X.; Wu, S.; Shen, L.; Wei, Y.; Cao, X.; Wang, Y.; Long, C.; Zhou, Y.; Li, D.; Huang, F. Di-(2-ethylhexyl) phthalate (DEHP)-induced testicular toxicity through Nrf2-mediated Notch1 signaling pathway in Sprague–Dawley rats. Environ. Toxicol. 2018, 33, 720–728. [Google Scholar] [CrossRef]
- Liu, X.; Zhu, Q.; Zhang, M.; Yin, T.; Xu, R.; Xiao, W.; Wu, J.; Deng, B.; Gao, X.; Gong, W.; et al. Isoliquiritigenin Ameliorates Acute Pancreatitis in Mice via Inhibition of Oxidative Stress and Modulation of the Nrf2/HO-1 Pathway. Oxid. Med. Cell. Longev. 2018, 2018, 1–12. [Google Scholar] [CrossRef]
- Golbraikh, A.; Tropsha, A. Beware of q2! J. Mol. Graph. Model. 2002, 20, 269–276. [Google Scholar] [CrossRef]
- Babu, S.; Sohn, H.; Madhavan, T. Computational Analysis of CRTh2 receptor antagonist: A Ligand-based CoMFA and CoMSIA approach. Comput Biol. Chem. 2015, 56, 109–121. [Google Scholar] [CrossRef]
- Liu, S.; Sun, S. Combined QSAR/QSPR, Molecular Docking, and Molecular Dynamics Study of Environmentally Friendly PBDEs with Improved Insulating Properties. Chem. Res. Chin. Univ. 2019, 35, 478–484. [Google Scholar] [CrossRef]
- Hennig, C.; Cooper, D. Brief communication: The relation between standard error of the estimate and sample size of histomorphometric aging methods. Am. J. Phys. Anthropol. 2011, 145, 658–664. [Google Scholar] [CrossRef]
- Zhang, H.; Zhao, C.; Na, H. A Modified 3D-QSAR Model Based on Ideal Point Method and Its Application in the Molecular Modification of Plasticizers with Flame Retardancy and Eco-Friendliness. Polymers 2020, 12, 1942. [Google Scholar] [CrossRef] [PubMed]
- Fan, D.; Liu, J.; Wang, L.; Yang, X.; Zhang, S.; Zhang, Y.; Shi, L. Development of quantitative structure–activity relationship models for predicting chronic toxicity of substituted benzenes to daphnia magna. Bull. Environ. Contam. Toxicol. 2016, 96, 664–670. [Google Scholar] [CrossRef]
- Salahinejad, M.; Ghasemi, J.B. 3D-QSAR studies on the toxicity of substituted benzenes to Tetrahymena pyriformis: CoMFA, CoMSIA and VolSurf approaches. Ecotoxicol. Environ. Saf. 2014, 105, 128–134. [Google Scholar] [CrossRef]
- Jaworska, J.S.; Schultz, T.W. Mechanism-based comparisons of acute toxicities elicited by industrial organic chemicals in procaryotic and eucaryotic systems. Ecotoxicol. Environ. Saf. 1994, 29, 200–213. [Google Scholar] [CrossRef]
- Jaworska, J.; Nikolova, N.; Aldenberg, T. QSAR applicabilty domain estimation by projection of the training set descriptor space: A review. Altern. Lab. Anim. 2005, 33, 445–459. [Google Scholar] [CrossRef] [PubMed]


| Names | Structures | LD50 (mg/kg) | Exp. (lgLD50) | CoMFA Pred. | CoMFA Res. | CoMSIA Pred. | CoMSIA Res. |
|---|---|---|---|---|---|---|---|
| DMP |  | 6800 | 3.8325 | 3.791 | 0.0415 | 3.829 | 0.0035 |
| DEP |  | 8600 | 3.9345 | 3.89 | 0.0445 | 3.942 | −0.0075 |
| DBP |  | 7499 | 3.875 | 3.955 | −0.08 | 3.896 | −0.021 |
| DIBP |  | 15,000 | 4.1761 | 4.241 | −0.0649 | 4.175 | 0.0011 |
| DHXP |  | 29,600 | 4.4713 | 4.417 | 0.0543 | 4.45 | 0.0213 |
| DNOP |  | 47,000 | 4.6721 | 4.647 | 0.0251 | 4.684 | −0.0119 |
| DIOP |  | 22,000 | 4.3424 | 4.374 | −0.0316 | 4.339 | 0.0034 |
| DEHP |  | 30,000 | 4.4771 | 4.475 | 0.0021 | 4.477 | 0.0001 |
| DNP |  | 21,500 | 4.3324 | 4.458 | −0.1256 | 4.332 | 0.0004 |
| DIDP |  | 64,000 | 4.8062 | 4.759 | 0.0472 | 4.804 | 0.0022 |
| nDNOP |  | 45,200 | 4.6551 | 4.604 | 0.0511 | 4.647 | 0.0081 |
| DAP |  | 656 | 2.8169 | 2.821 | −0.0041 | 2.815 | 0.0019 |
| DMEP |  | 2750 | 3.4393 | 3.436 | 0.0033 | 3.419 | 0.0203 |
| 3D-QSAR Model. | Styles | Q2 | R2 | F | SEE | S | E | H | D | A |
|---|---|---|---|---|---|---|---|---|---|---|
| LD50 | CoMFA | 0.522 | 0.991 | 0.067 | 192.025 | 58.4 | 41.6 | |||
| CoMSIA1 | 0.621 | 1 | 0.015 | 1528.55 | 18.8 | 26.6 | 50.8 | 3.8 | 0 | |
| CoMSIA2 | 0.631 | 1 | 0.015 | 1552.090 | 19.3 | 28.4 | 52.3 | |||
| IC50 | CoMFA | 0.69 | 0.98 | 0.021 | 48.513 | 79 | 21 | |||
| IC50 | CoMSIA1 | 0.687 | 0.926 | 0.036 | 24.907 | 20.5 | 22.3 | 36.1 | 0 | 21.2 |
| Nrf2 | CoMSIA1 | 0.512 | 0.966 | 0.075 | 42.754 | 23.2 | 11.8 | 51.9 | 0 | 13.1 |
| Names | Structures | 72 h-IC50 (μM) | Exp. (lgIC50) | CoMFA Pred. | CoMFA Res. | CoMSIA Pred. | CoMSIA Res. |
|---|---|---|---|---|---|---|---|
| DEHP |  | 1160 | 3.0645 | 3.053 | 0.0115 | 3.069 | −0.0045 |
| DNP |  | 1513 | 3.18 | 3.206 | −0.026 | 3.2 | 0.025 |
| DIDP |  | 1722 | 3.236 | 3.232 | 0.004 | 3.094 | −0.0052 |
| DMEP |  | 975.1 | 2.989 | 2.984 | 0.005 | 2.992 | −0.003 |
| DHXP |  | 1227 | 3.0888 | 3.091 | −0.0022 | 2.972 | 0.008 |
| DNOP |  | 1678 | 3.225 | 3.206 | 0.019 | 3.233 | 0.003 |
| DPHP |  | 954.9 | 2.98 | 2.992 | −0.012 | 3.203 | −0.023 |
| Names | Structures | Exp. (Nrf2) | CoMSIA Pred. | CoMSIA Res. |
|---|---|---|---|---|
| DEHP |  | 0.6449 | 0.646 | −0.0011 |
| DEP |  | 1.2220 | 1.140 | 0.082 |
| DMP |  | 1.1534 | 1.151 | 0.0024 |
| DMEP |  | 1.1691 | 1.170 | −0.0009 |
| DHXP |  | 0.6882 | 0.673 | 0.0152 |
| DNOP |  | 0.7129 | 0.720 | −0.0071 |
| DBP |  | 0.7363 | 0.746 | −0.0097 |
Publisher’s Note: MDPI stays neutral with regard to jurisdictional claims in published maps and institutional affiliations. |
© 2021 by the authors. Licensee MDPI, Basel, Switzerland. This article is an open access article distributed under the terms and conditions of the Creative Commons Attribution (CC BY) license (https://creativecommons.org/licenses/by/4.0/).
Share and Cite
Liu, H.; Huang, H.; Xiao, X.; Zhao, Z.; Liu, C. Effects of Phthalate Esters (PAEs) on Cell Viability and Nrf2 of HepG2 and 3D-QSAR Studies. Toxics 2021, 9, 134. https://doi.org/10.3390/toxics9060134
Liu H, Huang H, Xiao X, Zhao Z, Liu C. Effects of Phthalate Esters (PAEs) on Cell Viability and Nrf2 of HepG2 and 3D-QSAR Studies. Toxics. 2021; 9(6):134. https://doi.org/10.3390/toxics9060134
Chicago/Turabian StyleLiu, Huan, Huiying Huang, Xueman Xiao, Zilin Zhao, and Chunhong Liu. 2021. "Effects of Phthalate Esters (PAEs) on Cell Viability and Nrf2 of HepG2 and 3D-QSAR Studies" Toxics 9, no. 6: 134. https://doi.org/10.3390/toxics9060134
APA StyleLiu, H., Huang, H., Xiao, X., Zhao, Z., & Liu, C. (2021). Effects of Phthalate Esters (PAEs) on Cell Viability and Nrf2 of HepG2 and 3D-QSAR Studies. Toxics, 9(6), 134. https://doi.org/10.3390/toxics9060134