Article

Distribution, Source Apportionment, and Risk Assessment of Heavy Metals in Surface Waters from a Glacier Basin on the Southeastern Tibetan Plateau

1
College of Geography and Land Engineering, Yuxi Normal University, Yuxi 653100, China
2
Faculty of Geography, Yunnan Normal University, Kunming 650500, China
3
School of Earth Sciences, Yunnan University, Kunming 650504, China
4
College of Tourism, Geography, History and Culture, Hulunbuir University, Hailaer 021008, China
5
Meili Snow Mountains Cryosphere Changes Observation and Research Station of Yunnan Province, Deqin 674500, China
*
Author to whom correspondence should be addressed.
Toxics 2026, 14(8), 672; https://doi.org/10.3390/toxics14080672
Submission received: 23 June 2026 / Revised: 22 July 2026 / Accepted: 25 July 2026 / Published: 29 July 2026

Highlights

What are the main findings?
  • Spatial differentiation: Heavy metal concentrations decreased significantly from the glacier basin to downstream rivers, with marked differences among the six river basins.
  • Source apportionment: PCA identified three groups of heavy metal associations (Mn–Co–Ni–Cd, Cu–Zn, V–Cr), indicating mixed natural and anthropogenic sources; long range atmospheric transport is an important external input pathway.
  • Risk characteristics: Ecological risk is low; non carcinogenic risk is within safe limits, but children are more sensitive than adults, with arsenic (As) as the main contributor. Carcinogenic risk is acceptable, but the ingestion risks of arsenic and nickel are relatively higher for adults in the Yubeng River basin.
What is the implication of the main findings?
  • These findings provide a crucial baseline for pollution prevention, water resource management, and public health protection on the Tibetan Plateau, underscoring the need for source specific mitigation measures and strengthened monitoring.

Abstract

Heavy metals in surface waters pose significant risks to aquatic ecosystems and human health. In this study, a comprehensive analysis of multiple heavy metals (V, Cr, Mn, Co, Ni, Cu, Zn, As and Cd) was performed using extensive surface water samples from the Meili Snow Mountains glacier basin, southeastern Tibetan Plateau. Results showed that heavy metal concentrations were higher in glacier meltwater than in downstream rivers, with significant variability observed in both the glacier basin (0.00300–33.4 μg/L) and downstream rivers (0.00500–2.85 μg/L), attributable to local geological processes and regional atmospheric deposition of transported particulate pollutants. Elevated total heavy metal concentrations at Sinong River and Qunatong River were primarily driven by uneven distribution of specific metals, likely from both anthropogenic and natural sources. Principal component analysis extracted three components that grouped heavy metals into Mn–Co–Ni–Cd, Cu–Zn, and V–Cr associations, indicating mixed geogenic and anthropogenic sources, with long-range atmospheric transport from surrounding polluted regions being a notable contributor. Risk assessments indicated low ecological risks (ERI < 150) and safe non–carcinogenic risks (HI < 1), with children exhibiting higher susceptibility than adults and As being the primary contributor. Although the carcinogenic risks (TCR: 10−6–10−4) were acceptable, ingestion of As and Ni posed higher risks, especially in the Yubeng River basin for adults. These findings provide valuable insights for water resource management and health protection in the southeastern Tibetan Plateau.

1. Introduction

Globally distributed surface waters, though vital to humanity, are extensively polluted. Primary pollutants include organic compounds, heavy metals (HMs) and nutrients. Among these, HMs are of particular concern due to their intrinsic biological toxicity, environmental persistence, and bioaccumulation potential. Some HMs (e.g., Cd, Cr, As, Pb) are highly toxic even at trace levels [1], whereas others (e.g., Zn, Cu, Mn) are essential for metabolism within safe thresholds [2]. Although HMs originate partly from natural processes like geological weathering, anthropogenic activities such as mining, smelting, manufacturing, sewage sludge disposal, and agrochemical application constitute the dominant source [3]. In recent decades, rapid industrial and agricultural expansion has rendered HM pollution both ubiquitous and escalating, posing an increasingly severe threat to ecological integrity and human health [4]. Given that healthy aquatic ecosystems underpin socioeconomic development, HM pollution has become a focal point in environmental research. Consequently, risk assessment methods and models developed by the United States Environmental Protection Agency (US EPA) and the National Institutes of Health have been widely adopted in scientific research to evaluate ecological and human health risks.
Atmospheric HMs undergo long-range transport through atmospheric circulation and are ultimately deposited onto glaciers in remote high-altitude and polar regions through dry and wet deposition processes. Consequently, glaciers serve as important reservoirs of these pollutants. The Tibetan Plateau (TP), the highest and largest plateau in Central and East Asia, covers about 1.22 million km2 with an average elevation exceeding 4000 m. Recognized as the “Third Pole” and the “Roof of the World”, it also holds the largest glacial ice volume in the mid-latitude and is often referred to as “Water Tower of Asia” [5]. Serving as the headwater region for major rivers such as the Yarlung Tsangpo, Yellow River, and Yangtze River, the TP supports about 40% of the global population [5,6]. Furthermore, it plays a vital role in maintaining regional ecological security, preserving biodiversity, and safeguarding water resources. Thus, the health of its aquatic ecosystems is crucial for sustaining downstream industrial and agricultural activities [1,7]. Importantly, its ecological influence extends to China and Southeast Asia [8].
Despite historically low population density, and minimal direct anthropogenic influence, the TP now faces increasing environmental pressures from anthropogenic activities, threatening its sustainable development and long-term ecological security. Located between China and India, the TP receives airborne HMs from these neighboring regions. Simultaneously, glacier melt driven by global warming is altering local hydrology and degrading water quality [6], while rapid agricultural and industrial development across the plateau has introduced HMs of varying concentrations into aquatic ecosystems [8,9]. Additionally, demographic and socioeconomic changes are raising the demand for high-quality water throughout the region. These factors underscore the essential need for a comprehensive risk assessment of surface waters in the TP′s glacial basins.
Although extensive research has investigated HMs in aquatic ecosystems across the TP from major river basins to local waters [10,11,12,13], the anthropogenically influenced southeastern TP remains a critical gap in understanding regional-scale water quality. To address this, this study conducted extensive sampling of river water and glacier meltwater across six river basins in the Meili Snow Mountains region. It aimed to (1) investigate the regional-scale HM concentrations, (2) identify their potential sources, and (3) assess the associated ecological and human health risks. By doing so, this study not only addresses local drinking water safety concerns but also provides a scientific basis for regional water pollution prevention and management strategies.

2. Sampling and Methods

2.1. Sample Collection

The study region is located within the glacial basins of the Meili Snow Mountains in southeastern TP. Field sampling was conducted in July 2023, during which a total of 42 water samples were collected. These comprised 31 glacier meltwater samples from the glacial basin and 11 river water samples from the downstream reaches of proglacial rivers. Sampling locations were grouped into six basins: the Qunatong River (QNTR), Shequ River (SQR), Yubeng River (YBR), Mingyong River (MYR), Sinong River (SNR), and Pojun River (PJR) (Figure 1). For the purpose of enhanced data analysis, the total of 42 water samples were categorized into 21 groups based on their source glacier and water type. Specifically, 13 groups comprised glacier meltwater samples, while the remaining 8 groups consisted of river water samples (Table S1). To prevent pollution and ensure analytical accuracy, clean polypropylene suits and gloves were worn during sampling, and an acid-cleaned stainless steel shovel was used for collection. In the field, water samples were filtered using 0.45 μm glass-fiber filters (Whatman International Ltd., Maidstone, England), and stored in acid-washed low-density polyethylene bottles (Thermo Scientific, Waltham, MA, USA) for HM analysis. All samples were kept in the dark at 4 °C until further processing.

2.2. Laboratory Analysis

All water samples were transferred to acid-washed polyethylene tubes for laboratory analysis. Each sample was acidified with 200 μL ultrapure nitric acid and adjusted to a final volume of 10 mL, and then stored at 4 °C in the dark prior to analysis. HM concentrations were determined using inductively coupled plasma–mass spectrometry (ICP-MS) (PerkinElmer Inc., Waltham, MA, USA) at the Institute for Ecological Research and Pollution Control of Plateau Lakes, Yunnan University. A total of 9 HMs (V, Cr, Mn, Co, Ni, Cu, Zn, As and Cd) were measured for subsequent environmental assessment.
To ensure data reliability, standard reference materials, method blanks, duplicate samples, and matrix-spiked samples were incorporated throughout the analytical process. Each batch of 20 samples included 1 reagent blank, 1 duplicate, 2 reference standard samples, and 1 matrix-spiked sample, yielding 15 valid data points. Precision and accuracy were verified using national certified reference materials (GSB 04-1767-2004), with differences between certified and measured values within 10% and parallel sample deviations below 5.0%. All elemental recovery rates fell between 91.8% and 110.6%.

2.3. Ecological Risk Assessment

The ecological risk index (ERI) provides a comprehensive evaluation of the overall ecological risks from HMs in surface waters, integrating their concentrations, ecological effects, and toxicological characteristics [14,15]. It is calculated as follows:
E R I = R I = T i C i B i
where RI denotes the potential ecological risk factor for HM i, and Ti is its toxic response factor (Table S2 [16,17]); Ci is the measured concentration, and Bi is the corresponding background value (Table S2). The ERI is classified into four levels: low (ERI < 150), moderate (150 ≤ ERI < 300), considerable (300 ≤ ERI < 600), and high (ERI ≥ 600) [18].

2.4. Health Risk Assessment

Health risk assessment is a widely used method for evaluating the likelihood and severity of adverse health effects from exposure to HMs, primarily via water ingestion and dermal absorption [19,20]. In this study, we adopted the US EPA recommended health risk assessment framework [21]; accordingly, the average daily dose (ADD) from ingestion (ADDingestion) and dermal absorption (ADDdermal) is calculated using Equations (2) and (3), respectively.
A D D i n g e s t i o n = C i × I R × E F × E D B W × A T
A D D d e r m a l = C i × S A × E F × E D × E T × K p B W × A T × 10 3
In this study, both the non-carcinogenic risk (NCR) and carcinogenic risk (CR) were evaluated. The NCR was quantified using the hazard quotient (HQ). The hazard index (HI), defined as the sum of individual HQs, reflects the overall NCR posed by HM exposure. HQ and HI were calculated using Equations (4) and (5), respectively.
H Q = A D D R f D
H I = H Q i n g e s t i o n + H Q d e r m a l
where RfD is defined as the toxicity reference dose.
If the HQ or HI exceeds 1, adverse health effects are possible; conversely, values below 1 indicate no significant health risk.
The CR quantifies the lifetime cancer risk posed by carcinogenic HMs and is computed using Equation (6).
C R = A D D × C S F
Total carcinogenic risk (TCR) is the sum of the individual CR values, providing an integrated indicator of the potential carcinogenic impact of HM pollution.
T C R = ( C R i n g e s t i o n + C R d e r m a l )
Here, the CSF is the cancer slope factor (kg·d/mg). In this study, the CR of As, Ni, Cr and Cd via ingestion was evaluated using CSF values of 1.5, 1.7, 0.501 and 0.63 kg·d/mg, respectively [10]. For dermal exposure to As, CSF = 3.66 kg·d/mg was applied [19]. Other parameters in Equations (3)–(5) are summarized in Tables S3 and S4 [21,22,23,24,25,26,27,28]. CR or TCR values lying between 1 × 10⁻⁴ and 1 × 10⁻⁶ are generally considered acceptable, whereas values exceeding 1 × 10⁻⁴ indicate an unacceptable lifetime carcinogenic risk.

2.5. Monte Carlo Simulation

Monte Carlo simulation (MCS), a cornerstone of probabilistic risk assessment, overcomes the limitations of single-point evaluations by incorporating distribution-based inputs for HM concentrations and exposure factors [29,30,31]. To obtain realistic estimates of health risks, we employed the OnVeMCS v1.1 software to perform Monte Carlo simulations [32], evaluating both carcinogenic and non-carcinogenic probabilistic risks for adults and children. A preliminary sensitivity analysis was first conducted to identify the input parameters with the greatest influence on the risk outputs. These most sensitive variables were then assigned to the outer loop of a two-dimensional Monte Carlo simulation, while all other input parameters were placed in the inner loop. This two-stage procedure allowed us to rigorously propagate parameter importance and uncertainty, yielding more robust risk characterizations.

2.6. Statistical Analysis

Descriptive statistics (max, min, mean, standard deviation (SD), and coefficient of variation (CV)) for HMs were calculated using Excel 2022. The CV was used to quantitatively evaluate the spatial heterogeneity of each metal. Principal component analysis (PCA) was performed in SPSS 25. Correlations among HMs were assessed using Pearson′s method, with statistical significance set at p < 0.05 [14]. PCA was applied to identify potential sources of HMs in water samples [15,33], with eigenvalues serving as the criterion for extracting principal components (PCs).

2.7. Aerosol and Air Mass Backward Trajectories

To better identify potential sources of HMs, this study combined aerosol data with backward trajectory analysis. The aerosol data were obtained from the Visible Infrared Imaging Radiometer Suite (VIIRS) onboard the NOAA-20 satellite, using monthly Level-3 Deep Blue aerosol products, which provide global gridded Aerosol Optical Thickness (AOT) measurements over land and ocean. The Deep Blue algorithm builds on heritage methods developed for SeaWiFS and MODIS sensors [34,35]. Backward trajectories were generated with the NOAA HYSPLIT (Hybrid Single-Particle Lagrangian Integrated Trajectory) model. Five-day trajectories were computed for the one-year period prior to sampling (July 2022 to June 2023) at an arrival height of 1000 m, and cluster analysis was conducted at three-month intervals to assess the origins of air masses reaching the study area.

3. Results and Discussion

3.1. General Characteristics and Spatial Distribution

3.1.1. Concentration Levels

Detailed statistical data are presented in Table 1. The distribution patterns of HMs differed markedly between the two water types. In glacier meltwater, the mean concentration followed the order: Mn (1.96 μg/L) > Zn (1.32 μg/L) > Ni (0.333 μg/L) > Cu (0.241 μg/L) > As (0.228 μg/L) > Cr (0.0790 μg/L) > Co (0.0370 μg/L) > V (0.0220 μg/L) > Cd (0.0130 μg/L). In river water, the order was: Zn (0.923 μg/L) > As (0.289 μg/L) > Mn (0.178 μg/L) > Ni (0.175 μg/L) > Cu (0.161 μg/L) > Cr (0.0800 μg/L) > V (0.0390 μg/L) > Cd (0.0120 μg/L) > Co (0.00900 μg/L). Furthermore, the CV analysis revealed that within the glacial basin, all HMs except Cd (CV = 41%) exhibited significant spatial heterogeneity (CV > 50%). Meanwhile in downstream rivers, similarly high variation was confined to V (51%), Zn (78%), and As (86%). This pattern implies that the two environments are affected by different point and non-point pollution sources [36], with the glacial basin experiencing more pronounced anthropogenic impacts [37].

3.1.2. Comparative Abundance and Spatial Heterogeneity Between Glacial Meltwater and River Water

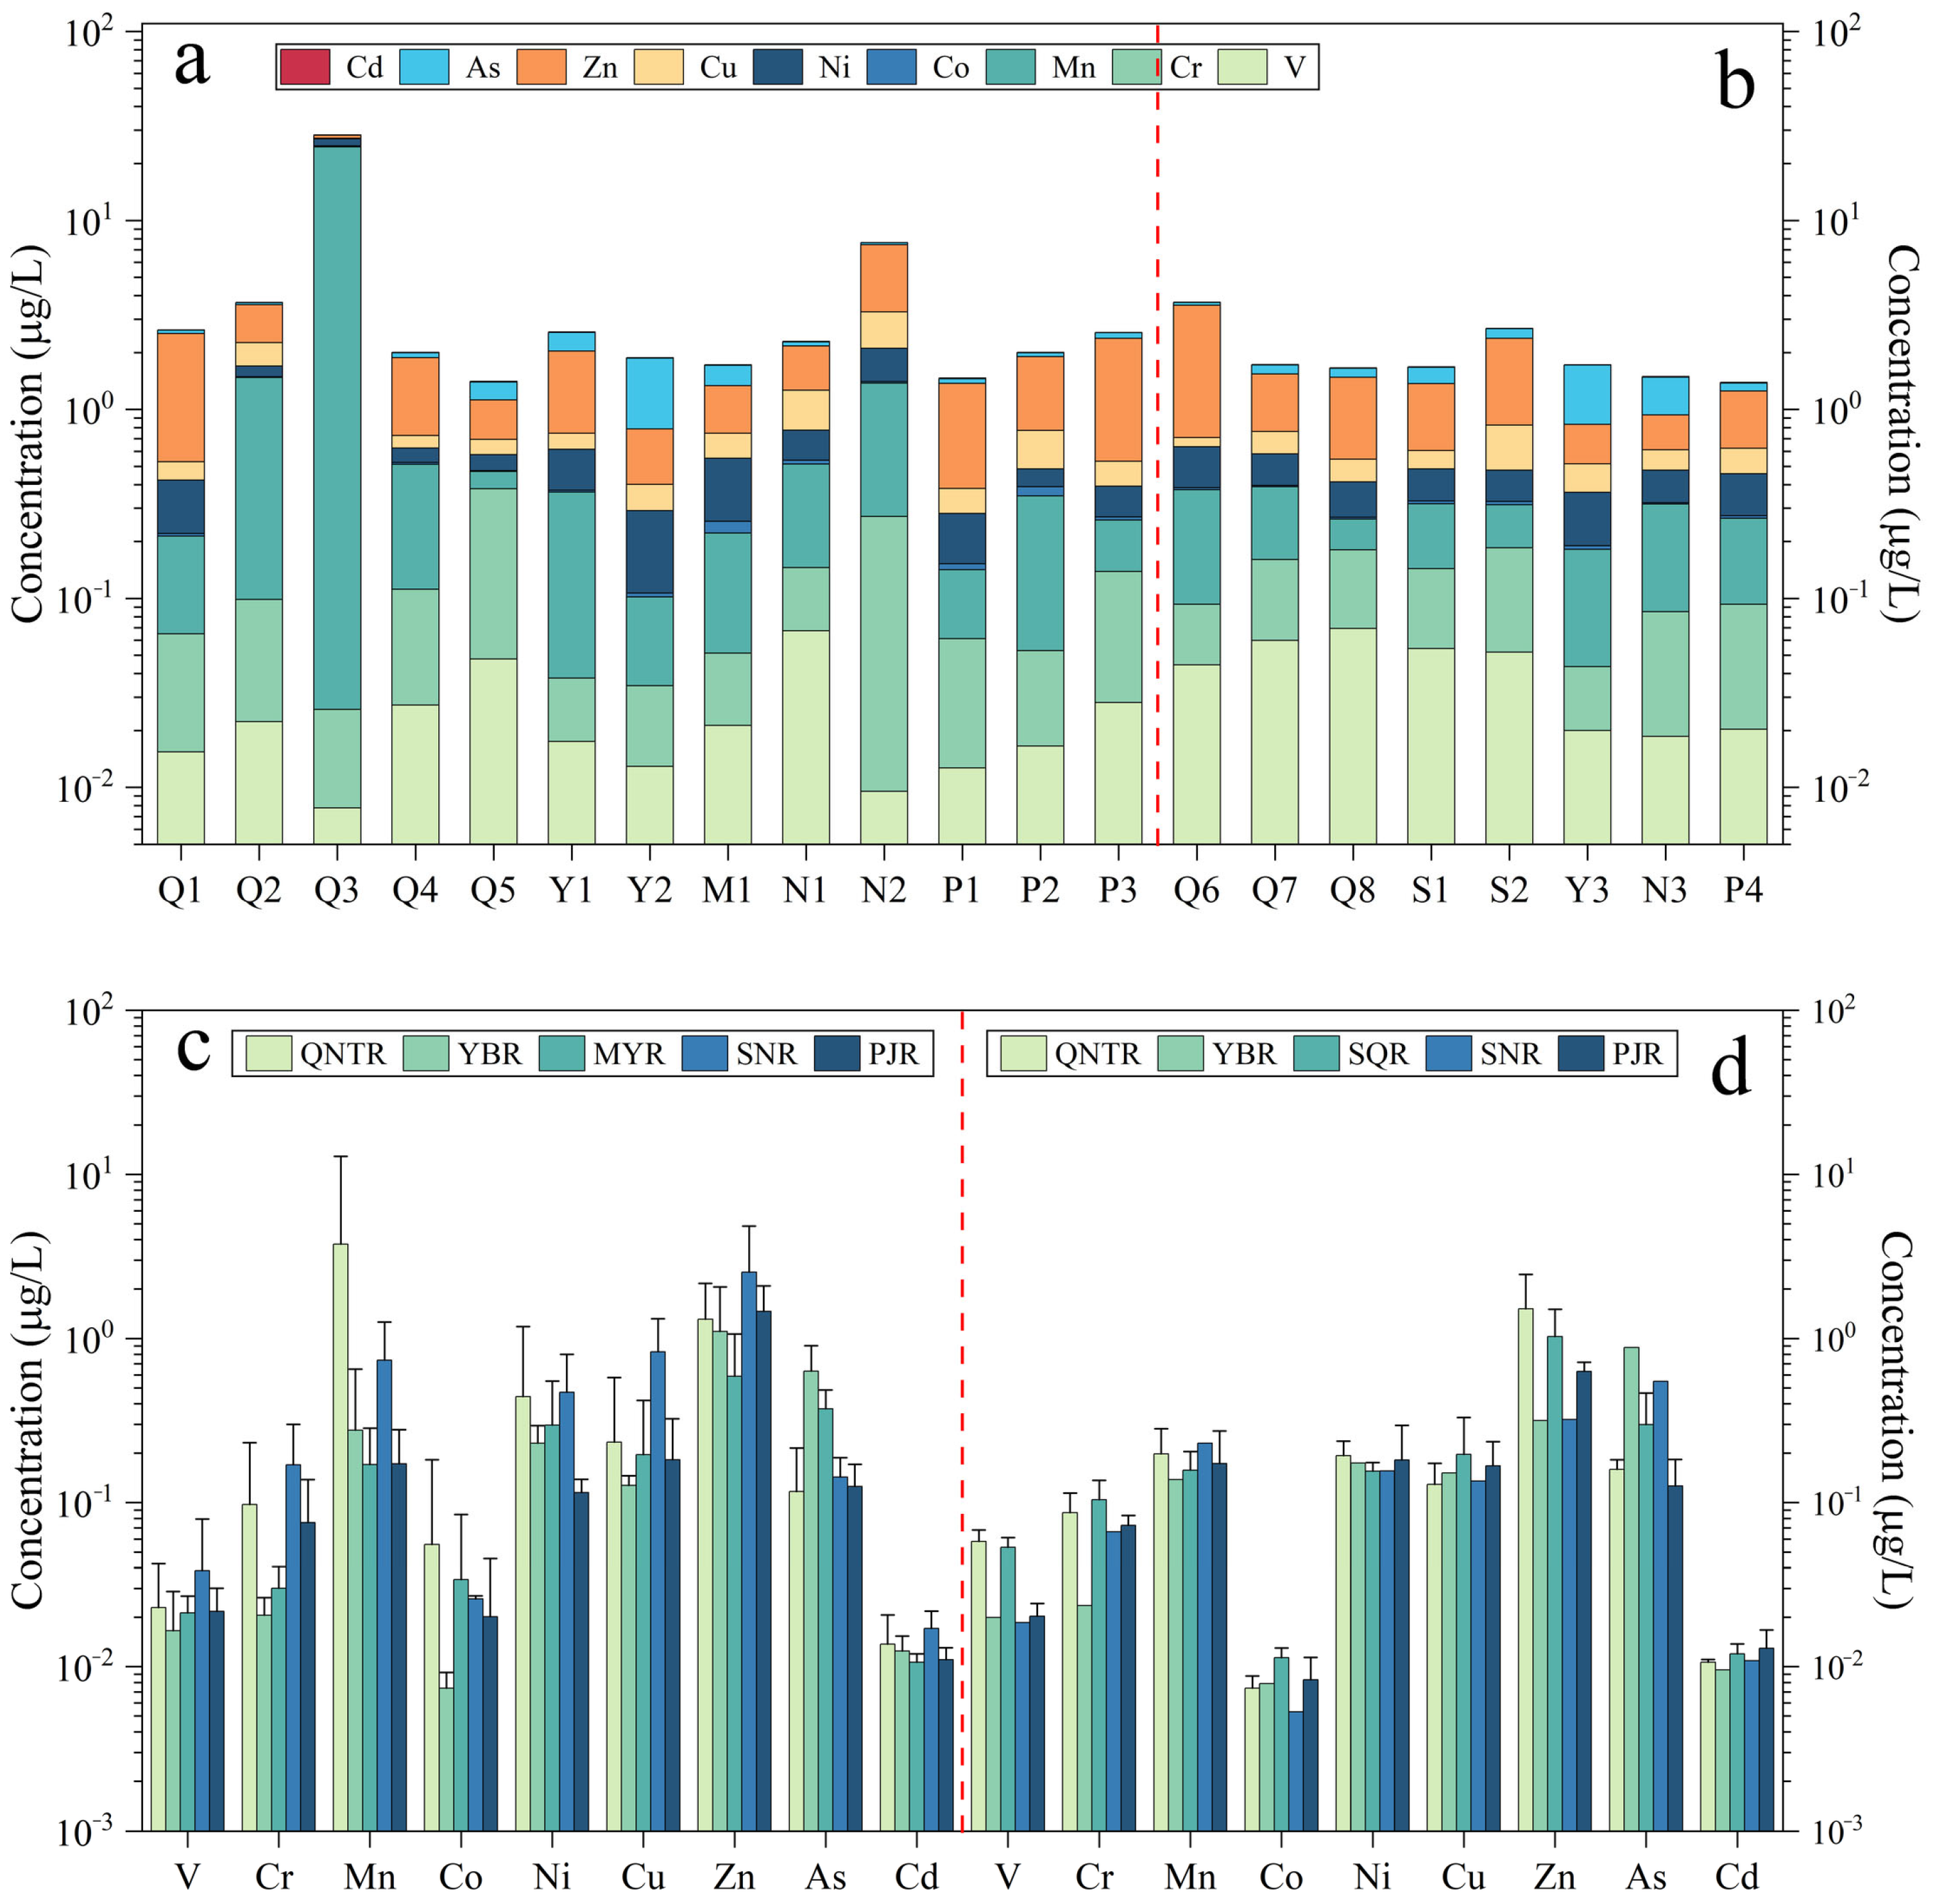
Significant differences were observed in the spatial distribution and concentration ranges of HMs between the two water types. The total concentration of all HMs (∑HMs) was generally lower in downstream rivers than in glacial basins (Figure 2a,b). This is typically attributed to HMs derived from local geology (e.g., bedrock and aeolian dust) and regional atmospheric deposition of transported particulate pollutants in remote glacial basins [38,39]. Across the investigated basins, the mean ΣHMs in glacier meltwater was higher than in river water for most basins (SNR: 4.96 vs. 1.49 μg/L; QNTR: 6.05 vs. 2.36 μg/L; PJR: 2.19 vs. 1.39 μg/L; YBR: 2.43 vs. 1.72 μg/L). This pattern likely results from distinct glacier characteristics (e.g., intensive cryogenic weathering-pedogenesis, aeolian dust input, and regional atmospheric deposition), and local environmental conditions [40,41]. The spatial distribution of ΣHMs further illustrates this variability: within the glacier basin, concentrations ranged from a high of 28.3 μg/L at Q3 to a low of 1.41 μg/L at Q5; in downstream rivers, they varied from 3.69 μg/L at Q6 to 1.39 μg/L at P4. Notably, the Sinong and Gongsen Glaciers are situated in relatively closer proximity to local settlements compared to the other sampling sites. This geographical setting may render them more susceptible to potential anthropogenic influences, as they could receive enhanced atmospheric deposition and surface dust inputs from adjacent inhabited areas. It is therefore plausible that, if these influxes carry elevated levels of trace elements, such pollutants may be retained and progressively concentrated within cryoconite holes, ultimately contributing to the higher HM concentrations observed in the meltwater from these two glaciers.
We acknowledge, however, that this interpretation remains a tentative hypothesis rather than a directly validated mechanism, as the present study does not include independent measurements of cryoconite composition, local dust geochemistry, settlement density, tourism activity, or local emission inventories. While the spatial pattern—higher HM levels at these two proximal sites—is consistent with an anthropogenic influence, direct confirmation would require targeted sampling of cryoconite material, surface dust, and local source apportionment analyses. We have therefore framed this discussion as a plausible explanation for the observed spatial heterogeneity, while recognizing that alternative natural factors (e.g., differences in bedrock mineralogy or glacial hydrological regimes) cannot be entirely excluded and warrant future investigation.
The spatial variability of individual HMs was more pronounced in glacier meltwater than in river water within the same basin (Figure 2c,d). Both water types in the QNTR basin exhibited considerable spatial heterogeneity, as indicated by higher standard deviations compared to other basins. Overall, most HMs showed significant spatial variation in glacier meltwater (except Cd), whereas in river water, only V, Cr, Zn, and As displayed notable variability. In glacier meltwater, elevated concentrations of Mn and Co were observed in QNTR, while SNR showed higher levels of V, Cr, Cu, Zn, and Cd. YBR was characterized by having the highest Zn concentration (1.11 μg/L) and the highest As concentration (0.632 μg/L) alongside the lowest levels of V, Cr, Co, and Cu. In river water, QNTR exhibited higher concentrations of V, Ni, and Zn, while SQR had elevated Cr, Co, and Cu. Mirroring the meltwater trend, YBR in river water recorded the highest As concentration (0.881 μg/L) and the lowest Cr, Mn, and Cd levels.

3.1.3. Dominant Contributions of Different HMs and Regional Characteristics

The elevated concentrations of Ni, Zn, Cu, and Cr across the investigated basins are likely influenced by anthropogenic emissions. Furthermore, the differing spatial peaks of these metals between water types suggest they may originate from distinct anthropogenic or natural sources. The elevated mean ΣHMs in surface waters are primarily driven by the uneven contribution of specific HMs, which may originate from different anthropogenic activities or natural sources [1,42]. For instance, in glacier meltwater, ∑HMs were largely driven by Mn in QNTR, and by Zn in the other four basins. In river water, however, As dominated in YBR and SNR, while Zn was the major contributor in the remaining three basins. The consistently high As concentrations in both glacier and river water from YBR suggest substantial occurrence of As in this basin. The observed downstream enrichment of As, despite recharge from glacier meltwater and precipitation during sampling, underscores the critical role of atmospheric wet deposition and glacier meltwater inputs. Overall, the atmospheric deposition of HM pollutants was generally higher in QNTR and SNR compared to the other basins.
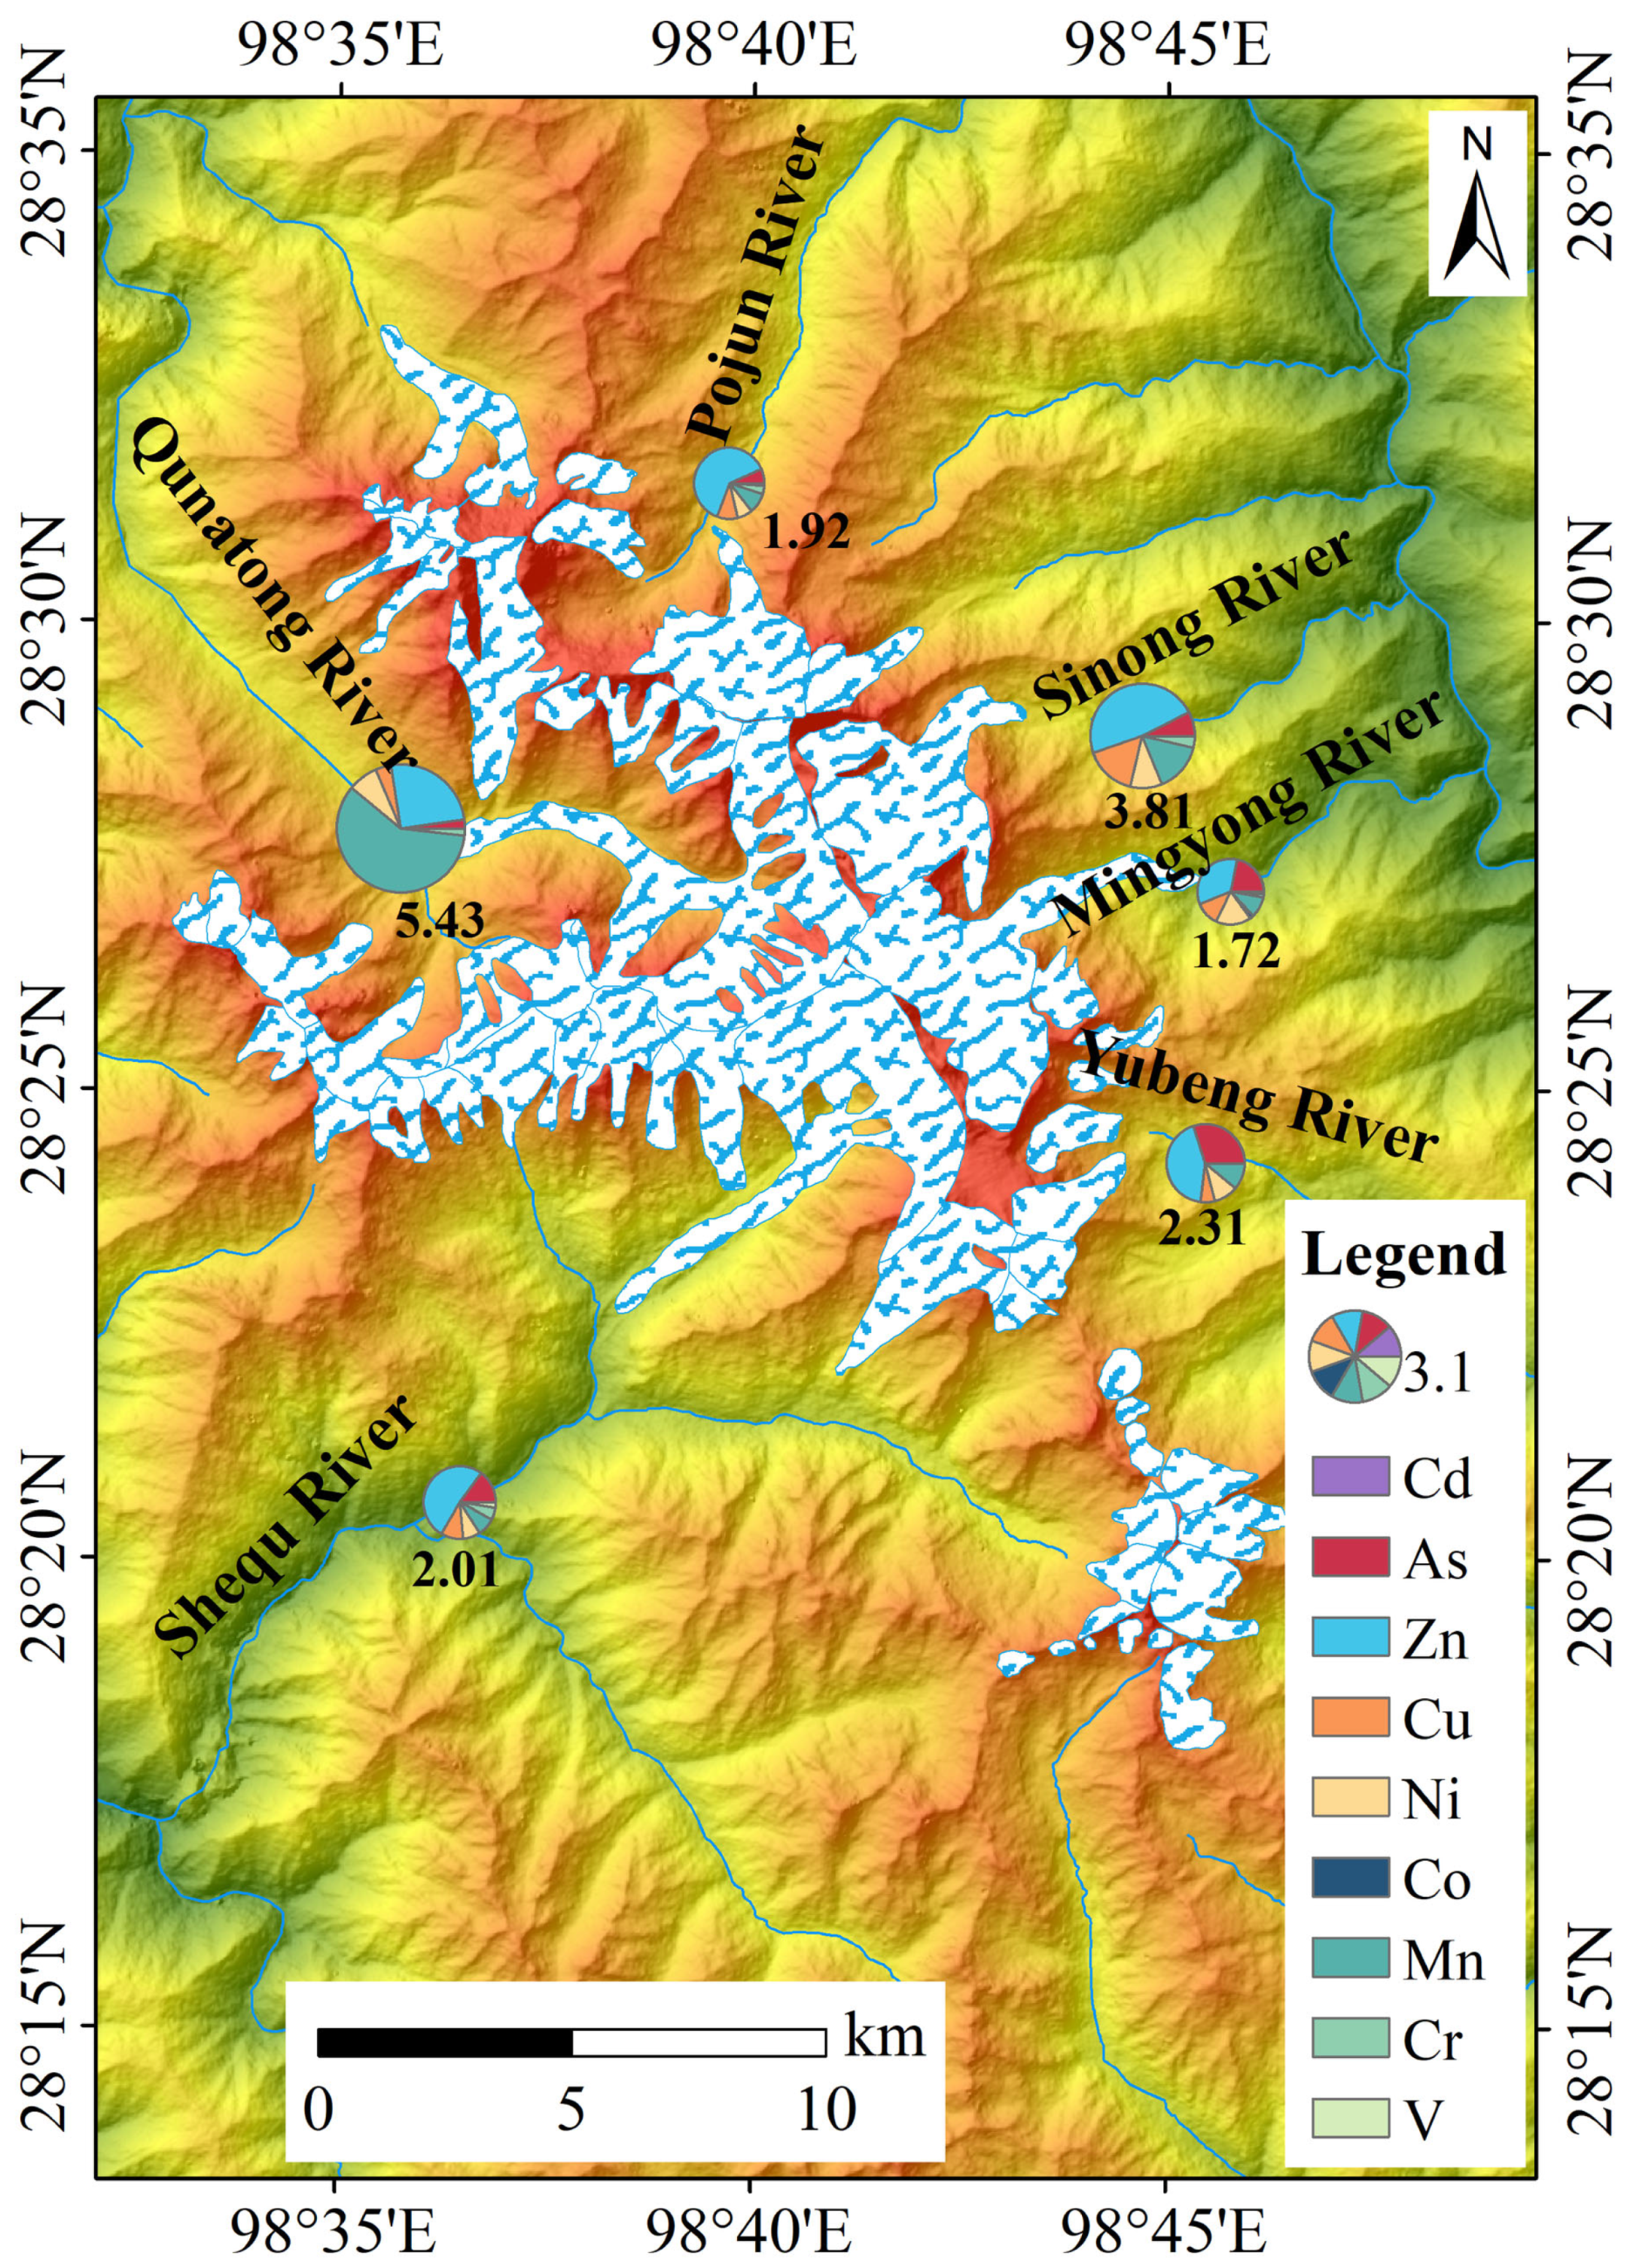
Among the river basins in the Meili Snow Mountain region (Figure 3), the Qunatong River Basin exhibits the highest total concentration of HMs in water (5.43 μg/L), while the Mingyong River Basin shows the lowest (1.72 μg/L). Except for the Qunatong River Basin, where Mn is predominant (3.16 μg/L), Zn is the dominant HM in all other basins, accounting for 34.2–61.7% of the total. Concentrations of Cd, Co, Cr, and V remain low across all basins.

3.1.4. Comparative Analysis with the TP and Surrounding Regions

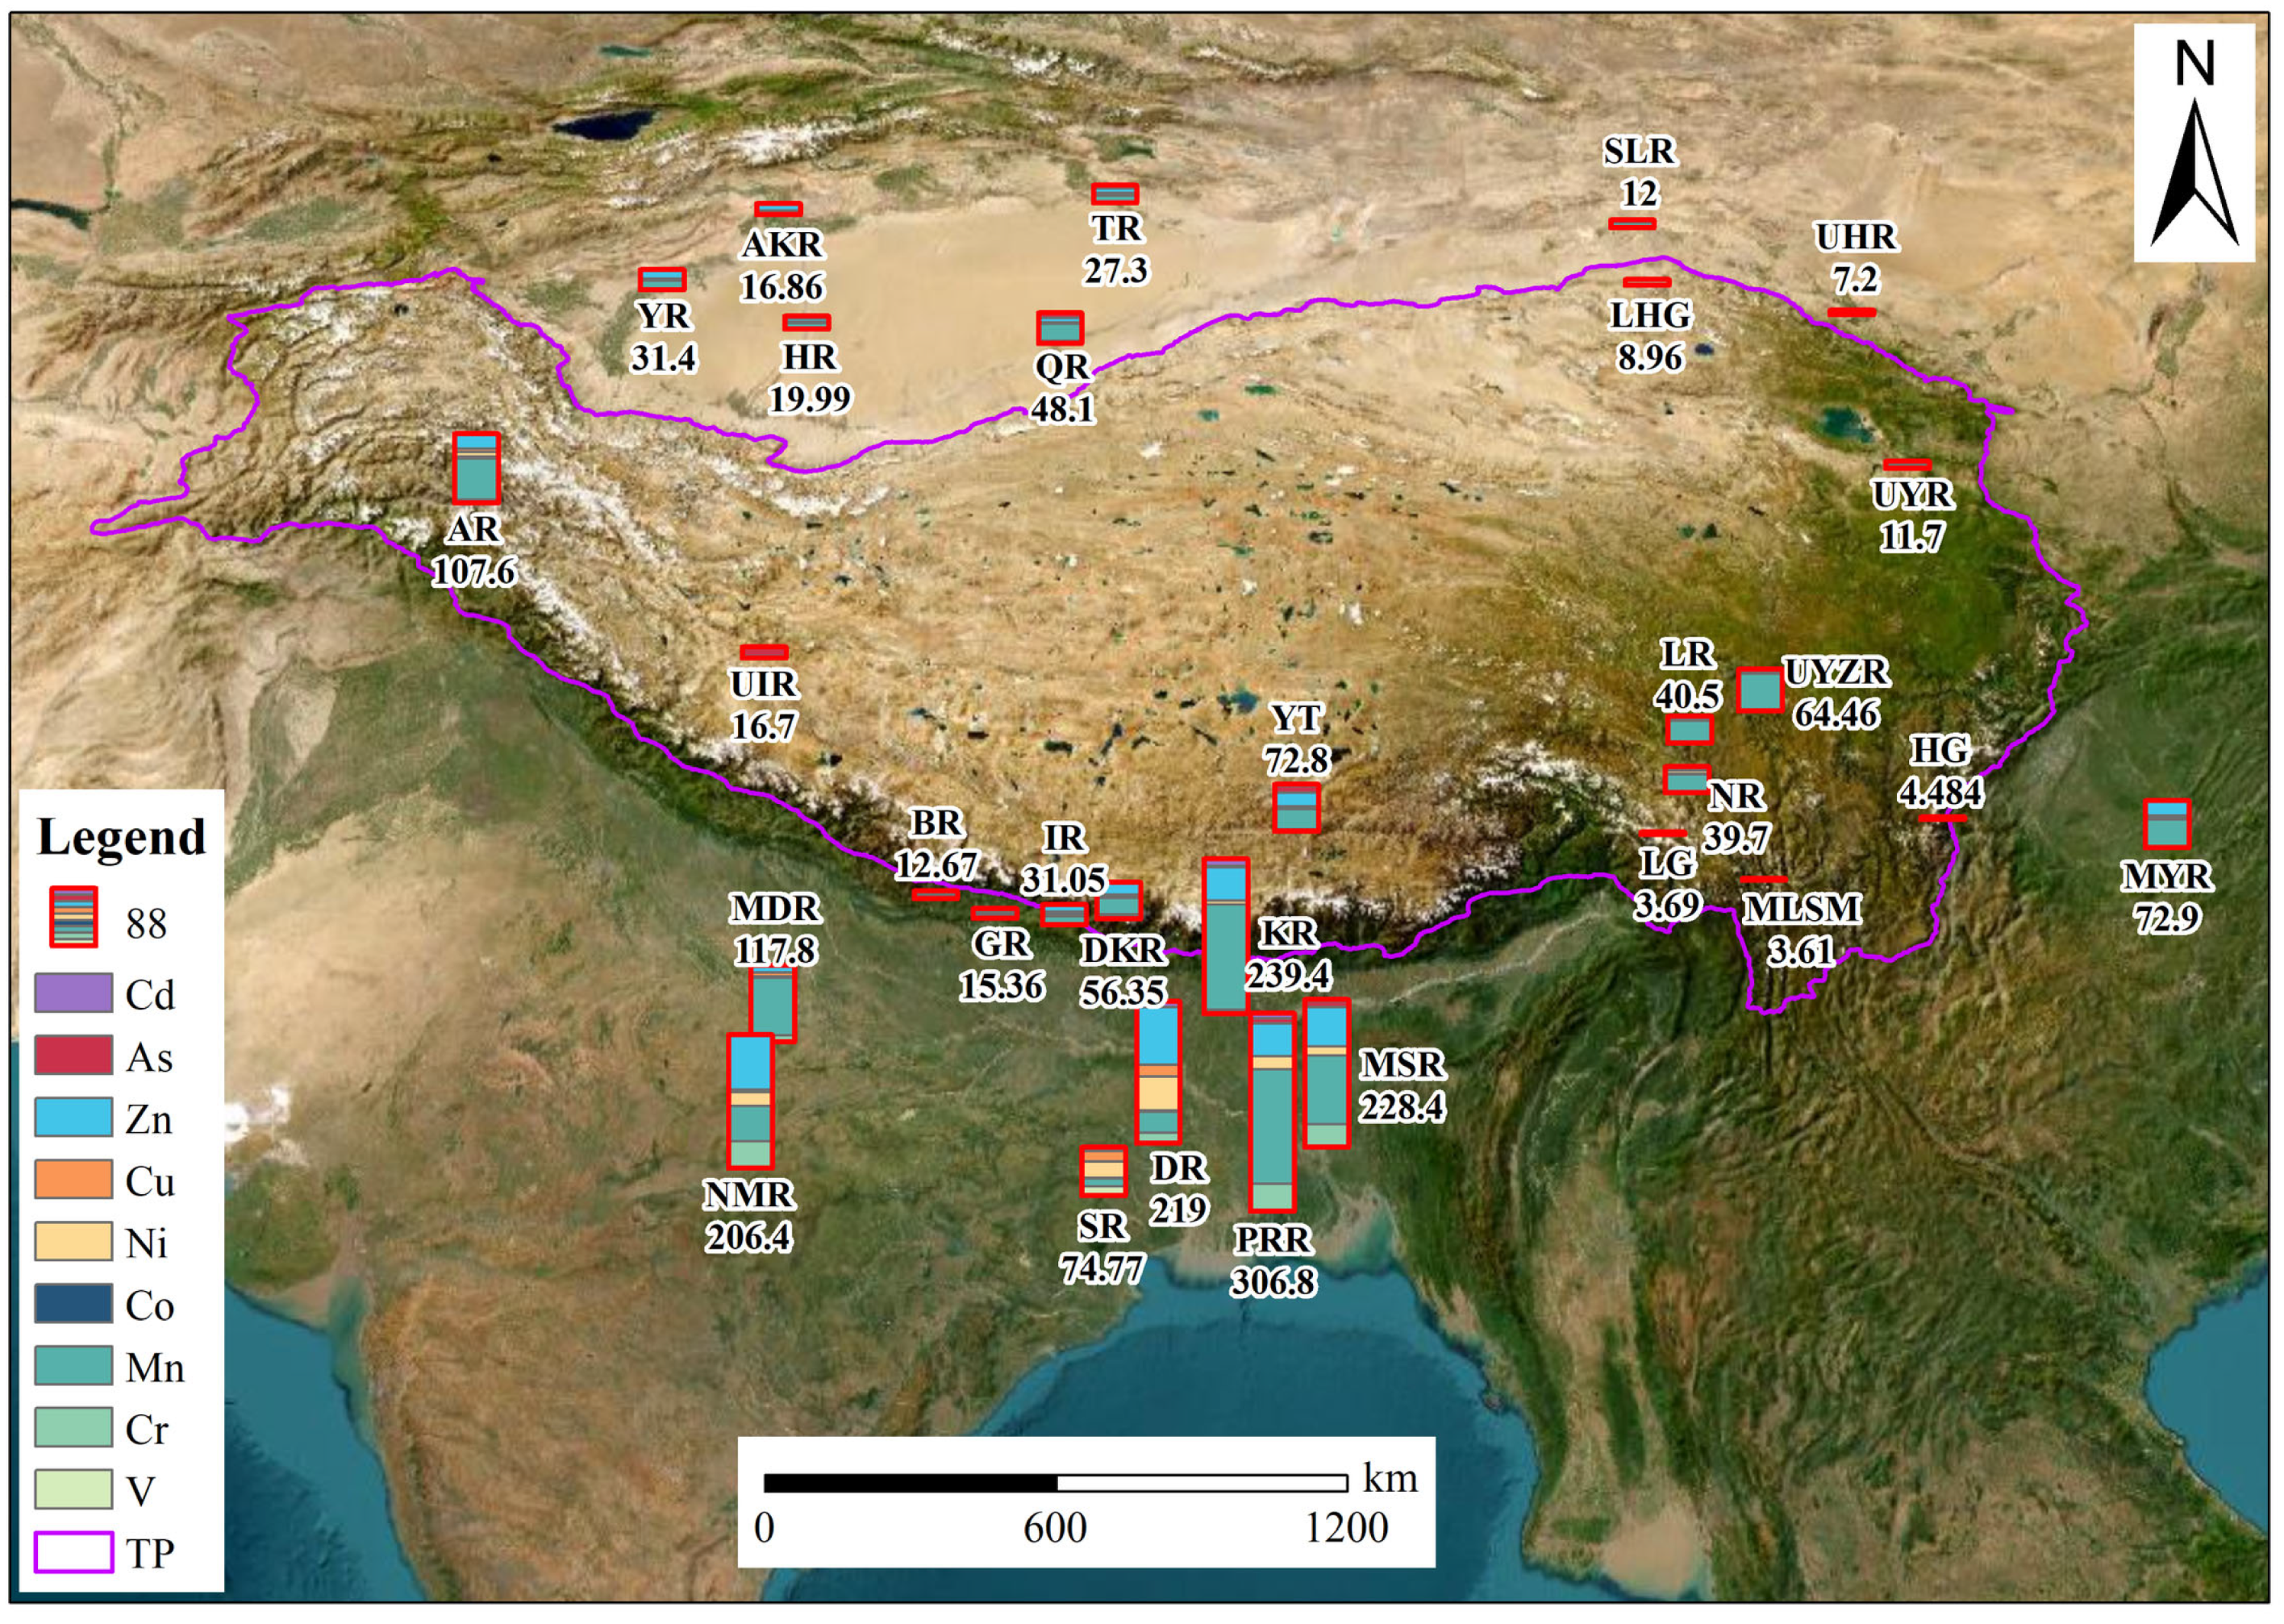
Spatial heterogeneity in the mean concentrations of HMs (including As, Cd, Co, Cr, Cu, Mn, Ni, V, and Zn) is evident across river and glacial waters within and surrounding the TP (Figure 4). Elevated concentrations are observed in rivers from India and Bangladesh. Specifically, in Bangladesh, the highest concentration reaches 306.8 μg/L (range: 228.4–306.8 μg/L) in the Pasur and Rupsha River (PRR) basin [19]; in India, the highest concentration is 219 μg/L (range: 74.77–219 μg/L) in the Damodar River (DR) basin [43,44,45,46]. Rivers originating from the Himalayas in Nepal show comparatively lower concentrations (12.67–56.35 μg/L), with the Dudh Koshi River (DKR) being the highest [47,48].
Among the major rivers sourcing from the eastern and central TP (Yangtze, Yellow, Lancang, and Nujiang), the Yangtze River exhibits relatively higher concentrations, increasing from 64.46 μg/L in its upper reaches to 72.9 μg/L in the middle reaches [6,49]. The upper Yellow River shows the lowest concentration (11.7 μg/L) [7], while the Nujiang and Lancang Rivers measure 39.7 μg/L and 40.5 μg/L, respectively [6]. Within the Indus River Basin in the western plateau, concentrations vary significantly, with the upper reaches of the Indus River (UIR) at 16.7 μg/L and the Astore River (AR) reaching 107.6 μg/L [7,50]. The Yarlung Tsangpo River, originating from the northern slopes of the Himalayas, presents a moderate concentration of 72.8 μg/L [51].
In the northern TP, the Tarim River and its major tributaries (e.g., Qarqan, Hotan, Yarkant, and Aksu Rivers) exhibit higher HM concentrations (16.86–48.1 μg/L) compared to the Shule River (12 μg/L) and Heihe River (7.2 μg/L) [7,52].
In contrast, glacier meltwater samples (e.g., from Laigu, Hailuogou, Laohugou, and the Meili Snow Mountains in this study) consistently demonstrate low HM concentrations, ranging from 3.61 to 8.96 μg/L [1,53]. Across the studied water bodies, Mn and Zn are identified as the predominant contributors to the total HM content.
Figure 4. Distribution of mean HMs (μg/L) in water samples from various basin areas surrounding TP. AR represents Astore River [50], NMR represents Narmada River [43], BR represents Badigad River [47], DKR represents Dudh Koshi River, IR represents Indrawati River, GR represents Gandaki River [48], MDR represents Mandakini River [44], KR represents Karatoya River, PRR represents Pasur and Rupsha River, MSR represents Meghna and Shitalakshya River [19], DR represents Damodar River [45], SR represents Subarnarekha River [46], NR represents Nu River, LR represents Lancang River, UYZR represents the upper reaches of the Yangtze River [6], MYR represents the middle reaches of the Yangtze River [49], UIR represents the upper reaches of the Indus River, UYR represents the upper reaches of the Yellow River, UHR represents the upper reaches of the Hei River, SLR represents Shule River [7], YT represents Yarlung Tsangpo [51], LHG represents Laohugou Glacier [53], TR represents Tarim River, QR represents Qarqan River, HR represents Hotan River, YR represents Yarkant River, AKR represents Aksu River [52], LG represents Laigu Glacier, HG represents Hailuogou Glacier [1], and MLSM represents Meili Snow Mountains (this study).
Toxics 14 00672 g004

3.2. Source Identification of HMs

3.2.1. Source Apportionment Based on Principal Component Analysis (PCA)

PCA was further employed as an exploratory tool to examine the grouping patterns of HMs and to gain preliminary insights into their potential sources. Notably, PCA was performed directly on the 42 individual samples to preserve statistical degrees of freedom. Prior to extraction, the Kaiser–Meyer–Olkin (KMO) measure of sampling adequacy was 0.694, and Bartlett’s test of sphericity was significant (p < 0.001), confirming that the dataset was acceptable for factor analysis. All data were standardized to z-scores to eliminate scale effects, and varimax rotation was applied to maximize the interpretability of component loadings.
Three principal components (PCs) with eigenvalues > 1 were retained, cumulatively explaining 76.6% of the total variance (Table 2). PC1, accounting for 42.57% of the variance, showed strong positive loadings for Mn, Co, Ni and Cd. PC2, explaining 18.77% of the variance, was heavily loaded with Cu and Zn. PC3, accounting for 15.26% of the variance, exhibited high loadings for V and Cr. Given the moderate sample-to-variable ratio (42 samples vs. 9 variables), these PCA results should be interpreted as exploratory indications of potential element associations rather than as a definitive quantitative source apportionment. The element groupings derived from the overall dataset are broadly consistent with known source signatures reported in the literature. For instance, Co, Mn, and Ni originate naturally from the weathering of parent materials and pedogenic processes, with additional anthropogenic inputs from industrial waste, coal combustion, and vehicle exhaust [28]. Cd, a highly toxic element, occurs naturally in regional soil parent material, but its anthropogenic inputs are primarily from heavy industrial activities, such as coal combustion, electroplating, battery manufacturing, non-ferrous metal smelting and mining [1,54]. Atmospheric Cr primarily derives from fossil fuel combustion, iron and steel plant emissions, waste incineration, and solid waste disposal [55]. V and Cr are often indicative of geogenic sources like bedrock weathering and mineral dust [56]. Cu and Zn are associated with industrial processes (e.g., metallurgy, petrochemical plants, and purification industries) [10,57], and are also common additives in livestock feed and organic fertilizers [58]. Notably, the Tibetan Plateau (TP) is rich in mineral resources, with Cu, Co, Ni, and Zn forming dominant deposits [59]. Elements like Ni, As and Cr are also frequently derived from fossil fuel combustion [40]. Therefore, while PCA suggests mixed origins with a predominant anthropogenic influence, quantitative source contributions cannot be conclusively determined from PCA alone. Future studies employing positive matrix factorization (PMF) combined with local emission inventory data are required to achieve a robust quantitative apportionment.
Previous studies confirm that HMs in the aquatic environment of the TP originate from multiple anthropogenic sources, including local industrial/agricultural activities, vehicle emissions, and long-range atmospheric transport [1,10,56,60,61]. The southeastern TP is surrounded by heavily polluted regions including India, Myanmar, and the Sichuan Basin; pollutants from these regions can be transported via long-range atmospheric circulation and subsequently deposited into various environmental media (soil, aerosols, snow, and ice) on the TP. Therefore, atmospheric aerosol deposition constitutes a non-negligible source of HMs in regional aquatic ecosystems.

3.2.2. Regional Transport Influences Revealed by Aerosol Optical Depth and Backward Trajectories

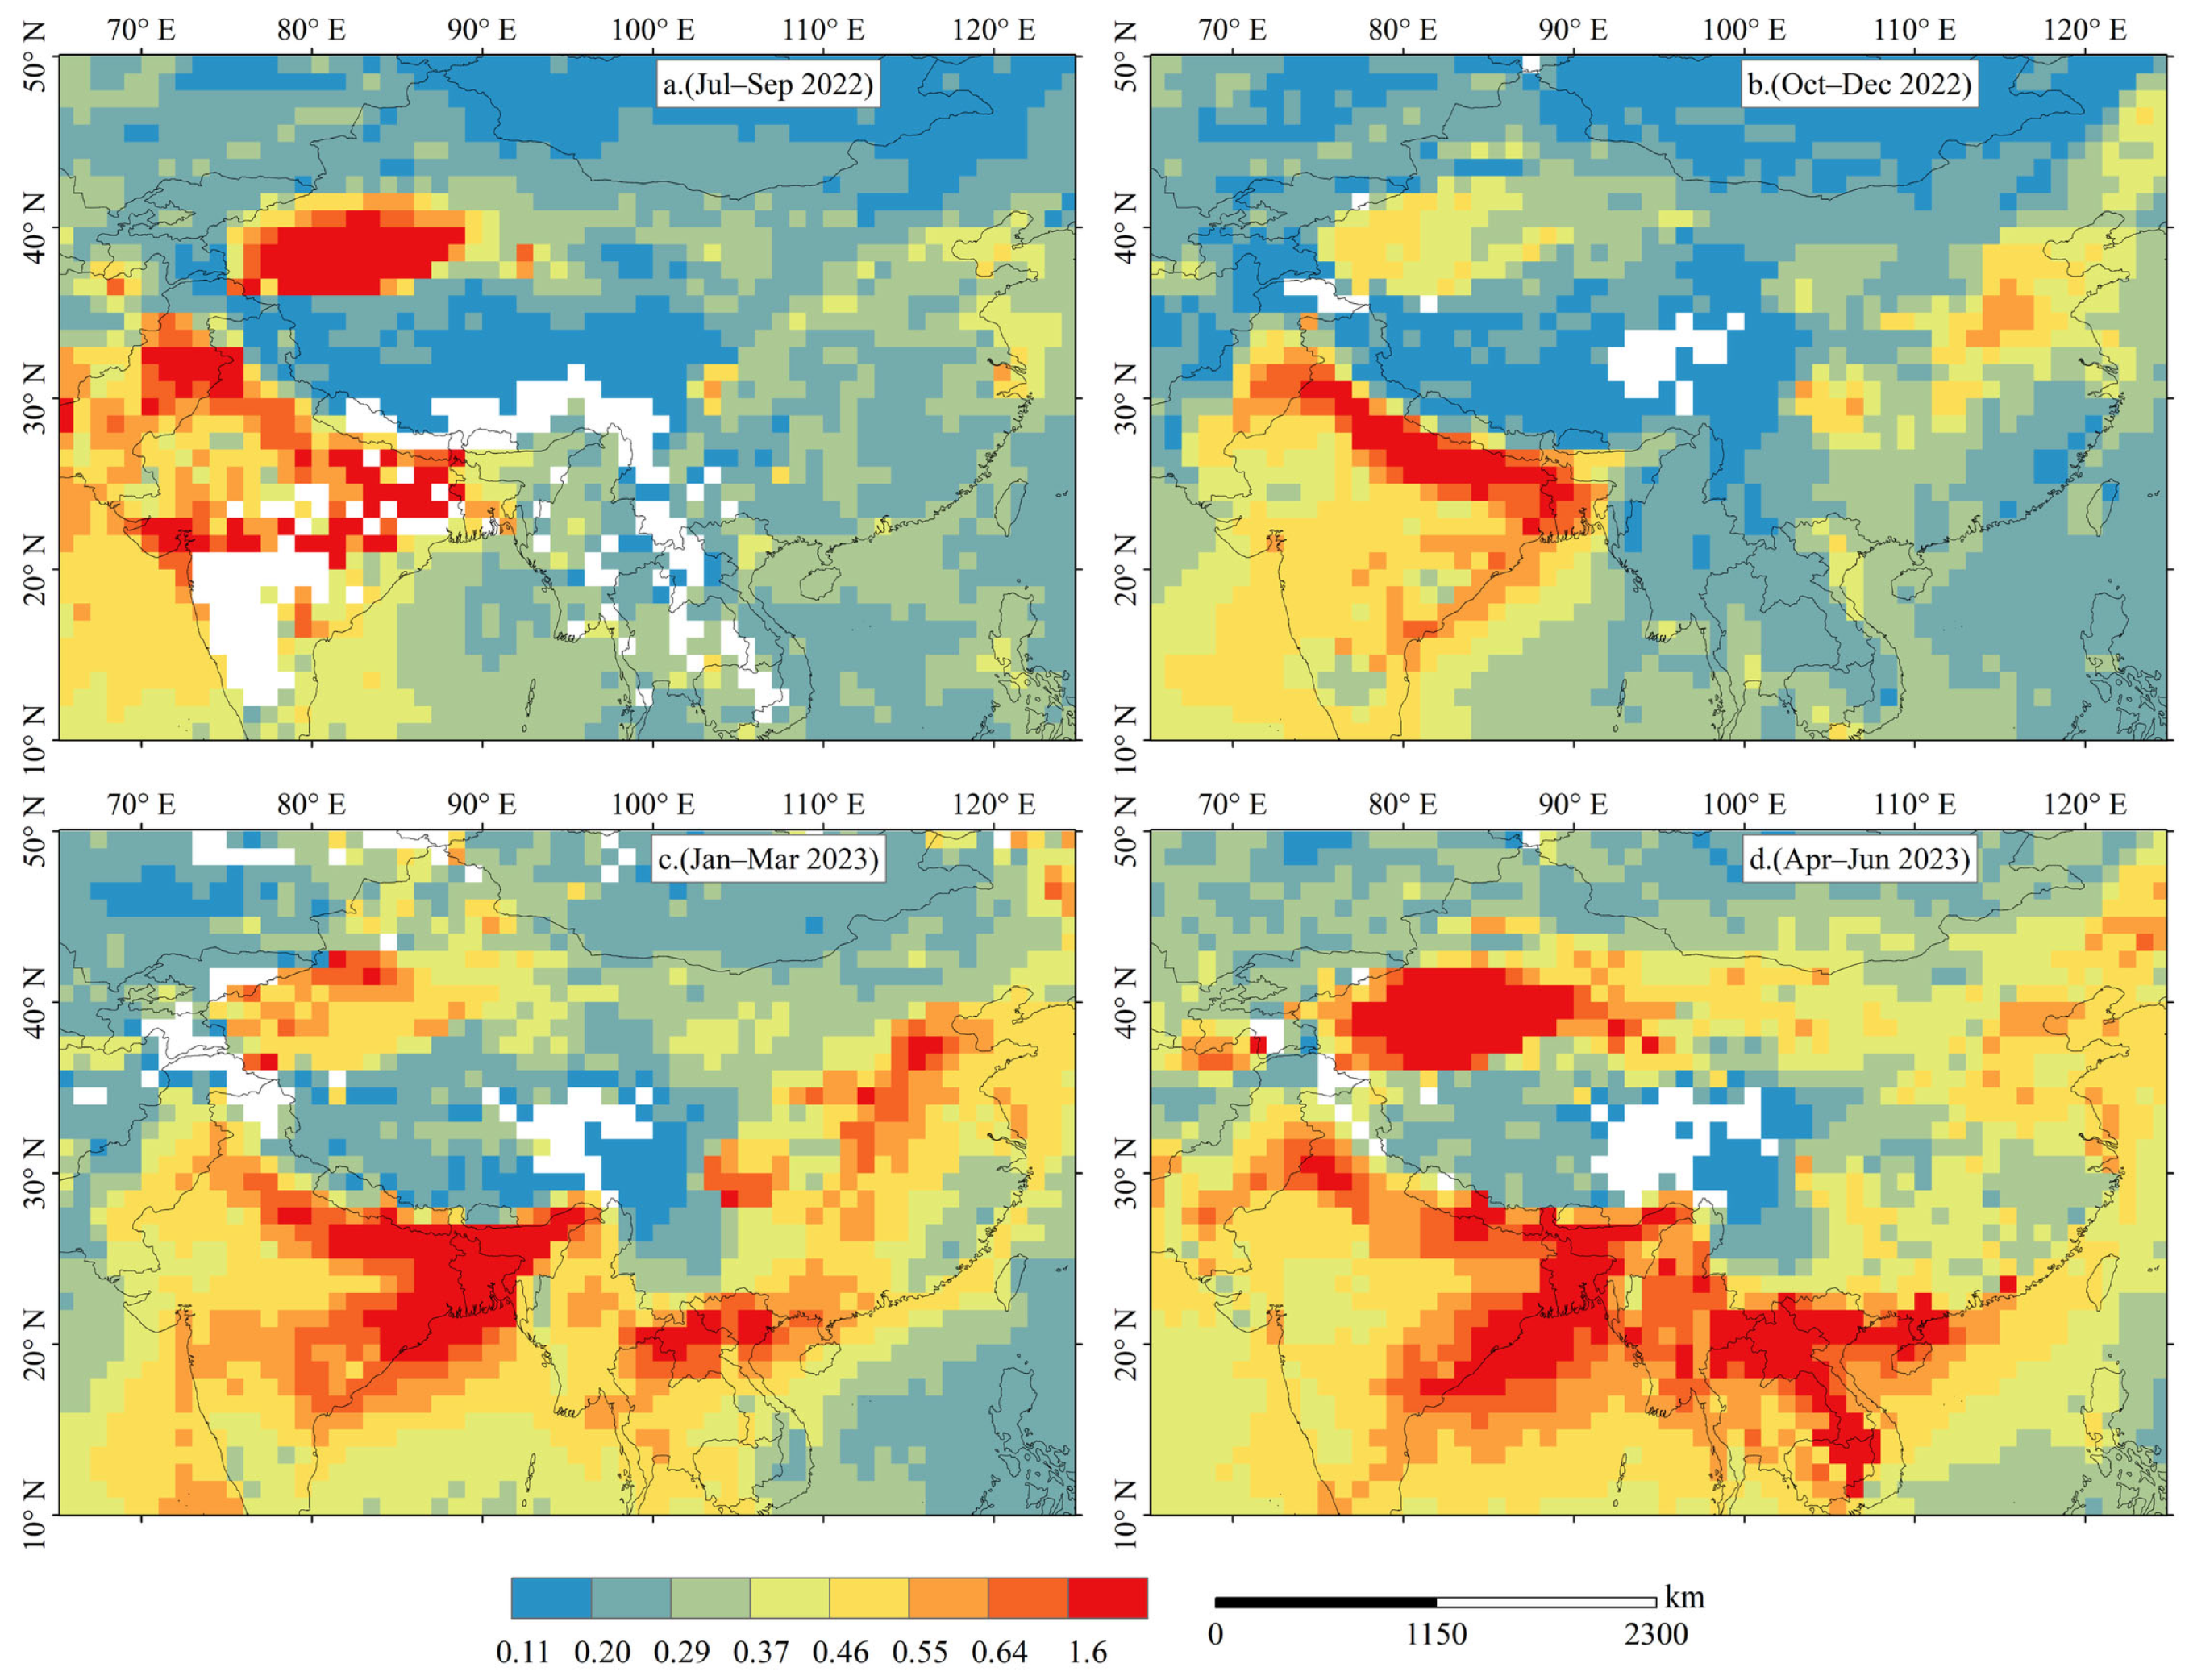
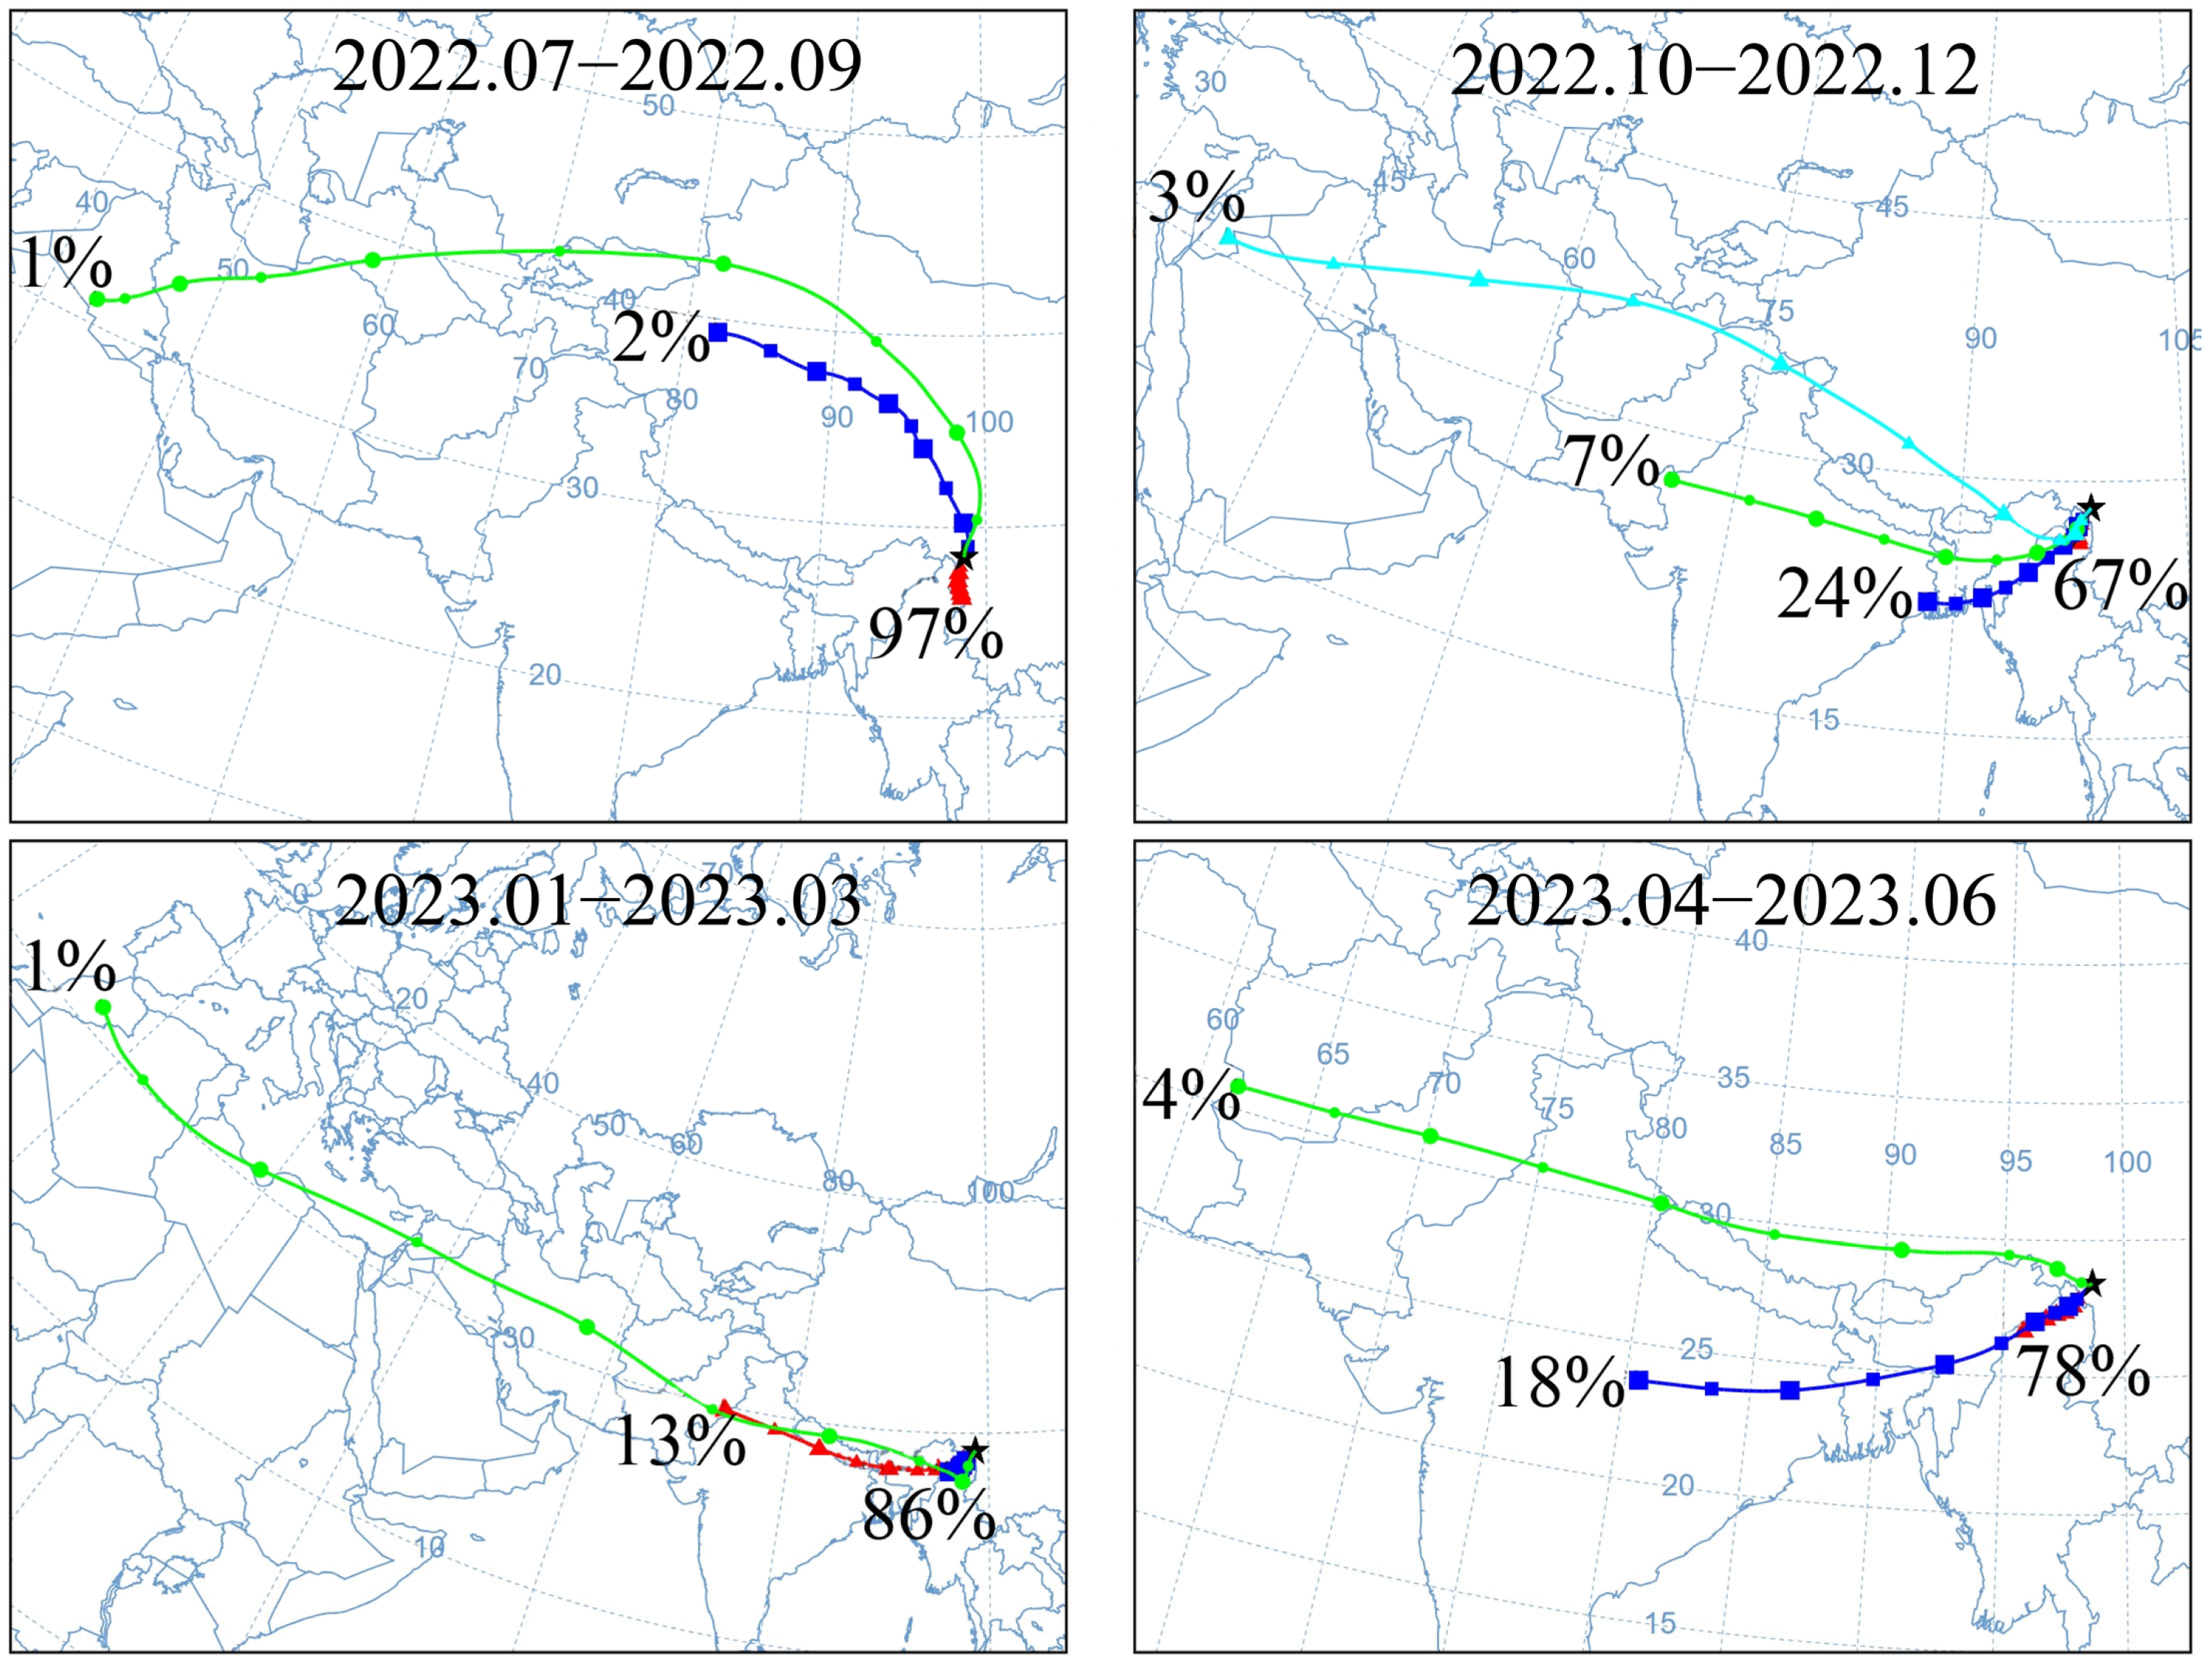
Based on the spatial distribution of Aerosol Optical Thickness (AOT) (Figure 5), regions with elevated values during July–September 2022 were primarily located in the Tarim Basin, Pakistan, and northern India. From October to December 2022, the high-AOT area shifted to the southern foothills of the Himalayas. Between January and March 2023, high AOT concentrations were concentrated in northeastern India and Bangladesh. During April–June 2023, the extent of high AOT expanded, covering areas such as the Tarim Basin, northwestern India, Bangladesh, and Laos.
Combined with backward trajectory analysis for the corresponding periods (Figure 6 [62]), these spatial–temporal patterns allow us to formulate a working hypothesis regarding the potential source regions of HMs in the study area. Specifically, the air masses arriving at the study site show possible pathways originating from the Tarim Basin during July–September 2022, and from India and Bangladesh during October 2022 to June 2023. However, it is important to emphasize that AOT reflects total aerosol column loading rather than chemical speciation, and HYSPLIT trajectories represent purely kinematic air-mass advection without carrying chemical fingerprints. Therefore, these results do not serve as direct evidence for the transport of specific metals (e.g., Cd, As, Ni, or Zn). Instead, they provide an indicative framework that points to potential external source areas. This hypothesis is further supported by previously published emission inventories and aerosol chemical composition studies in these regions [1,63,64,65], which consistently identify the Indo-Gangetic Plain and the Tarim Basin as major sources of dust-bound and anthropogenically derived trace elements. Nevertheless, direct verification through simultaneous aerosol chemical sampling, deposition flux measurements, or isotopic fingerprinting is required to conclusively confirm the actual contribution of these transported air masses to the local HM budget. With this caveat, our integrated analysis suggests that local and regional transport processes are the most plausible predominant contributors to HM levels in the study area, although this conclusion remains to be tested by future targeted chemical measurements.

3.3. Risk Assessment

3.3.1. Ecological Risk Assessment

Certain HMs, such as Cd, Ni, and As, are highly toxic to aquatic organisms even at trace levels [66]. Others, such as Cr, Cu, Zn, and Mn, are essential micronutrients but become hazardous when their levels exceed safe thresholds [2]. Chronic exposure to elevated concentrations of HMs can impair aquatic ecosystem functions and pose risks to human health via ingestion or dermal contact.
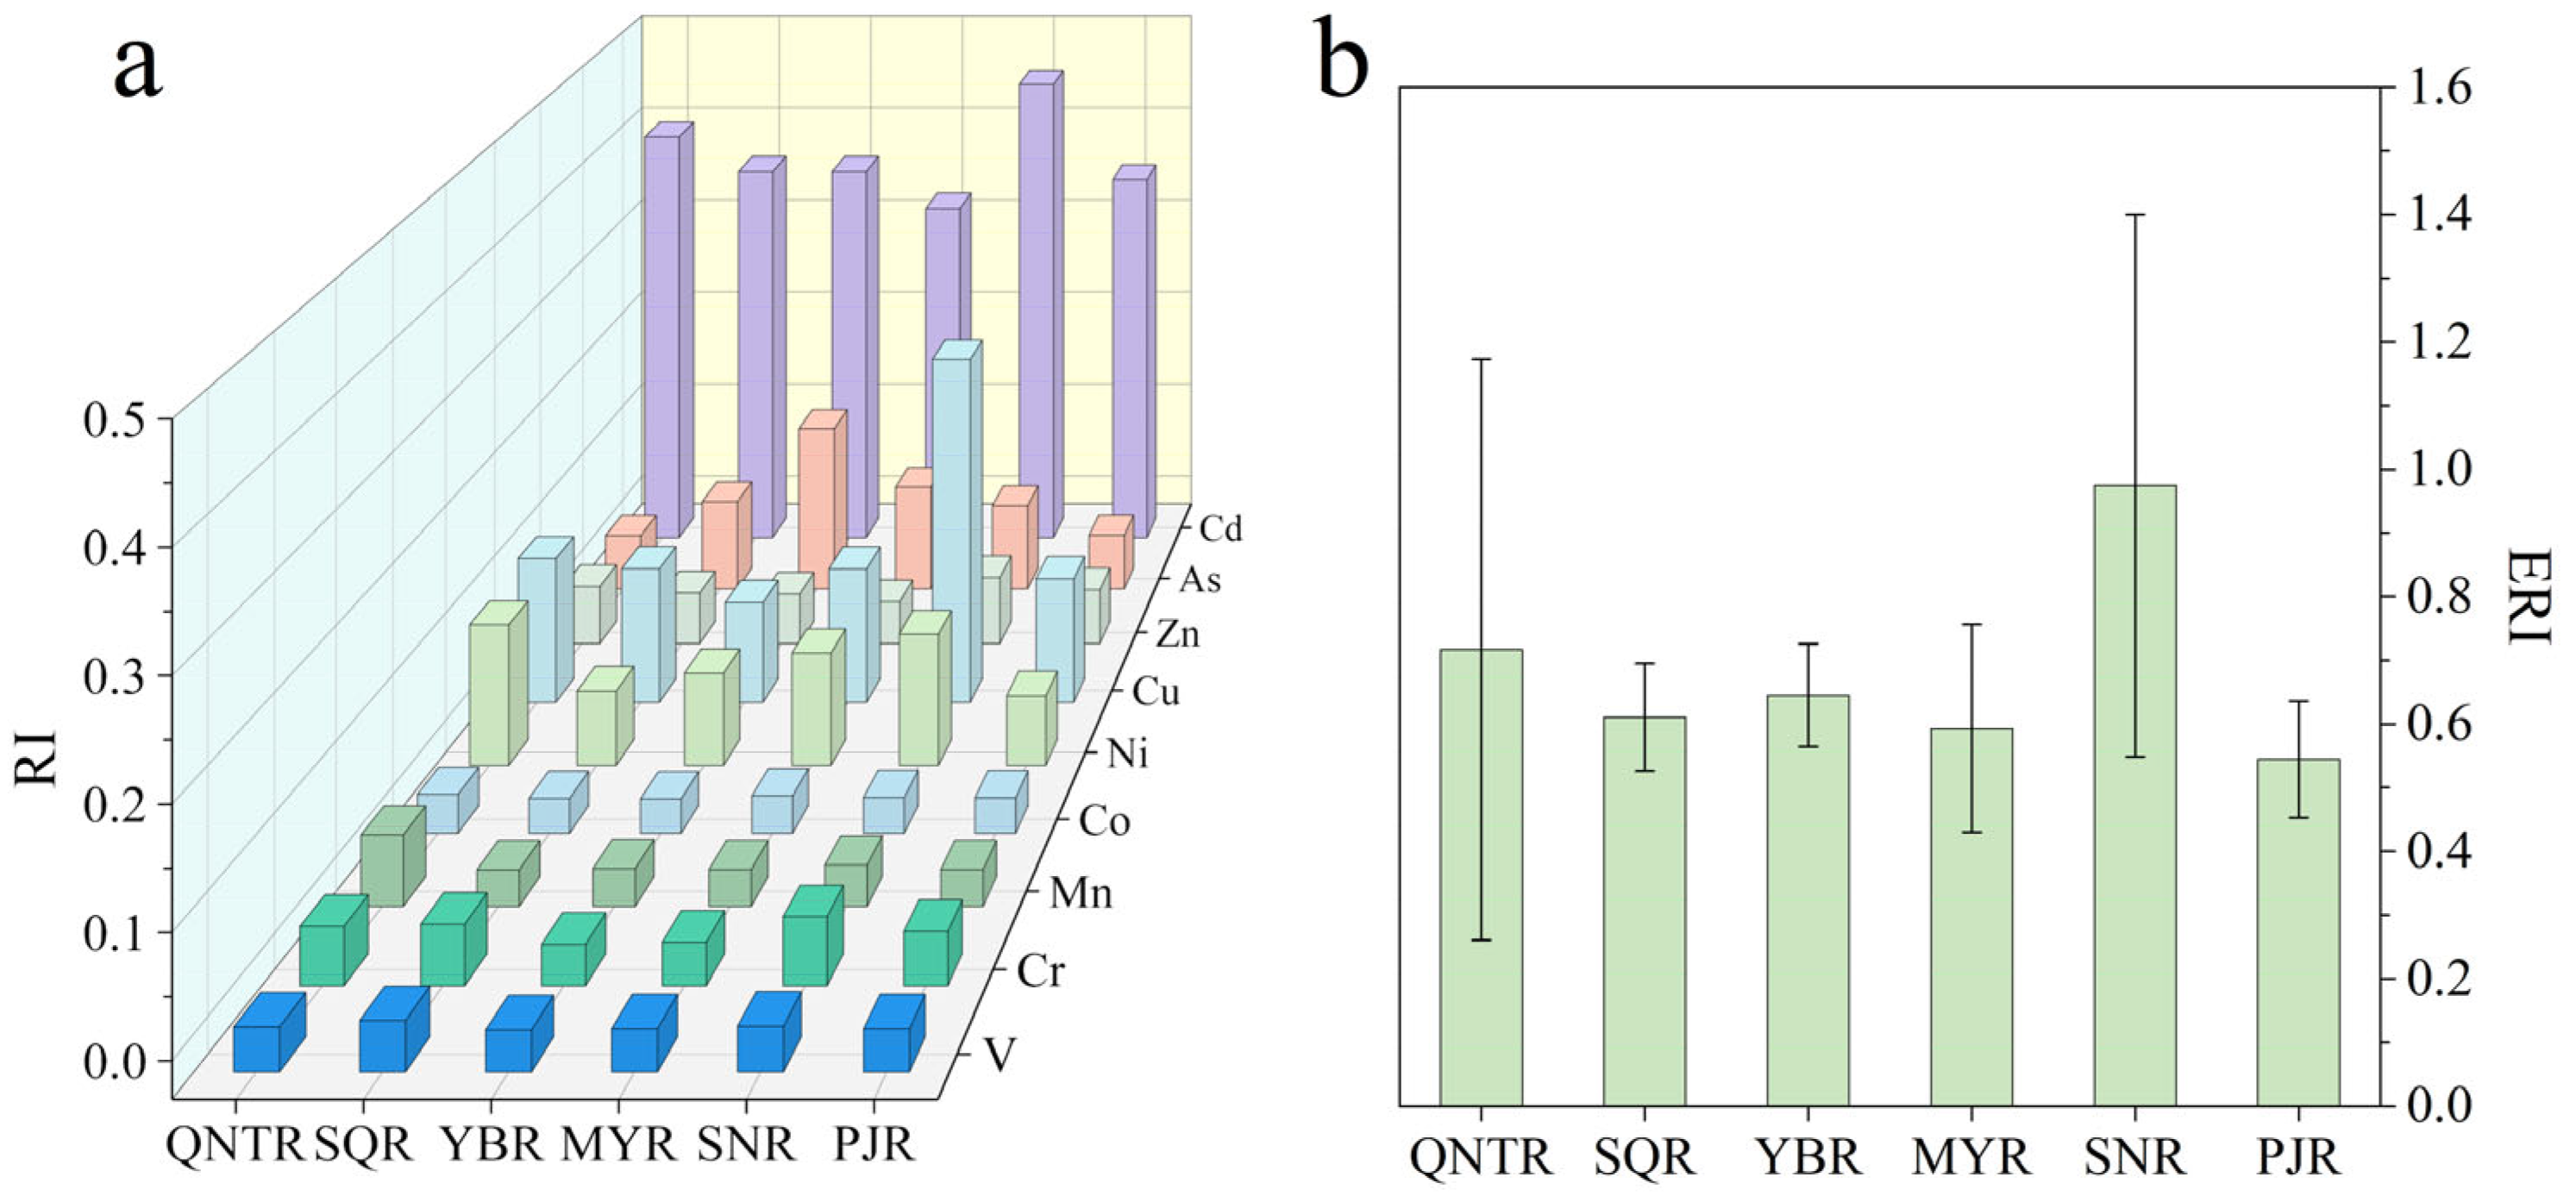
In this study, concentrations of the nine analyzed HMs at all sampling points were well below the limits set by both the WHO and the Chinese drinking water standard [17,67], indicating that current water quality remains safe for domestic use with no identified risks. This finding aligns with previous reports confirming generally good water quality across the TP [11,68], attributable to minimal anthropogenic impact due to sparse population and limited industrial and agricultural activities. To further assess the potential impact of HMs on aquatic ecosystems in the southeastern TP, the RI and ERI were calculated for each basin (Figure 7). Spatial variability in RI was the smallest in PJR. Across all six basins, RI values varied significantly for all HMs except V and Co. The mean RI values followed the order: Cd > Cu > Ni > As > Zn > Cr > Mn > V > Co (range: 0.003–0.381). All ERI values were well below 150, collectively demonstrating a low overall ecological risk for surface waters across the Meili Snow Mountains glacier basin.

3.3.2. Cancer Risk Assessment

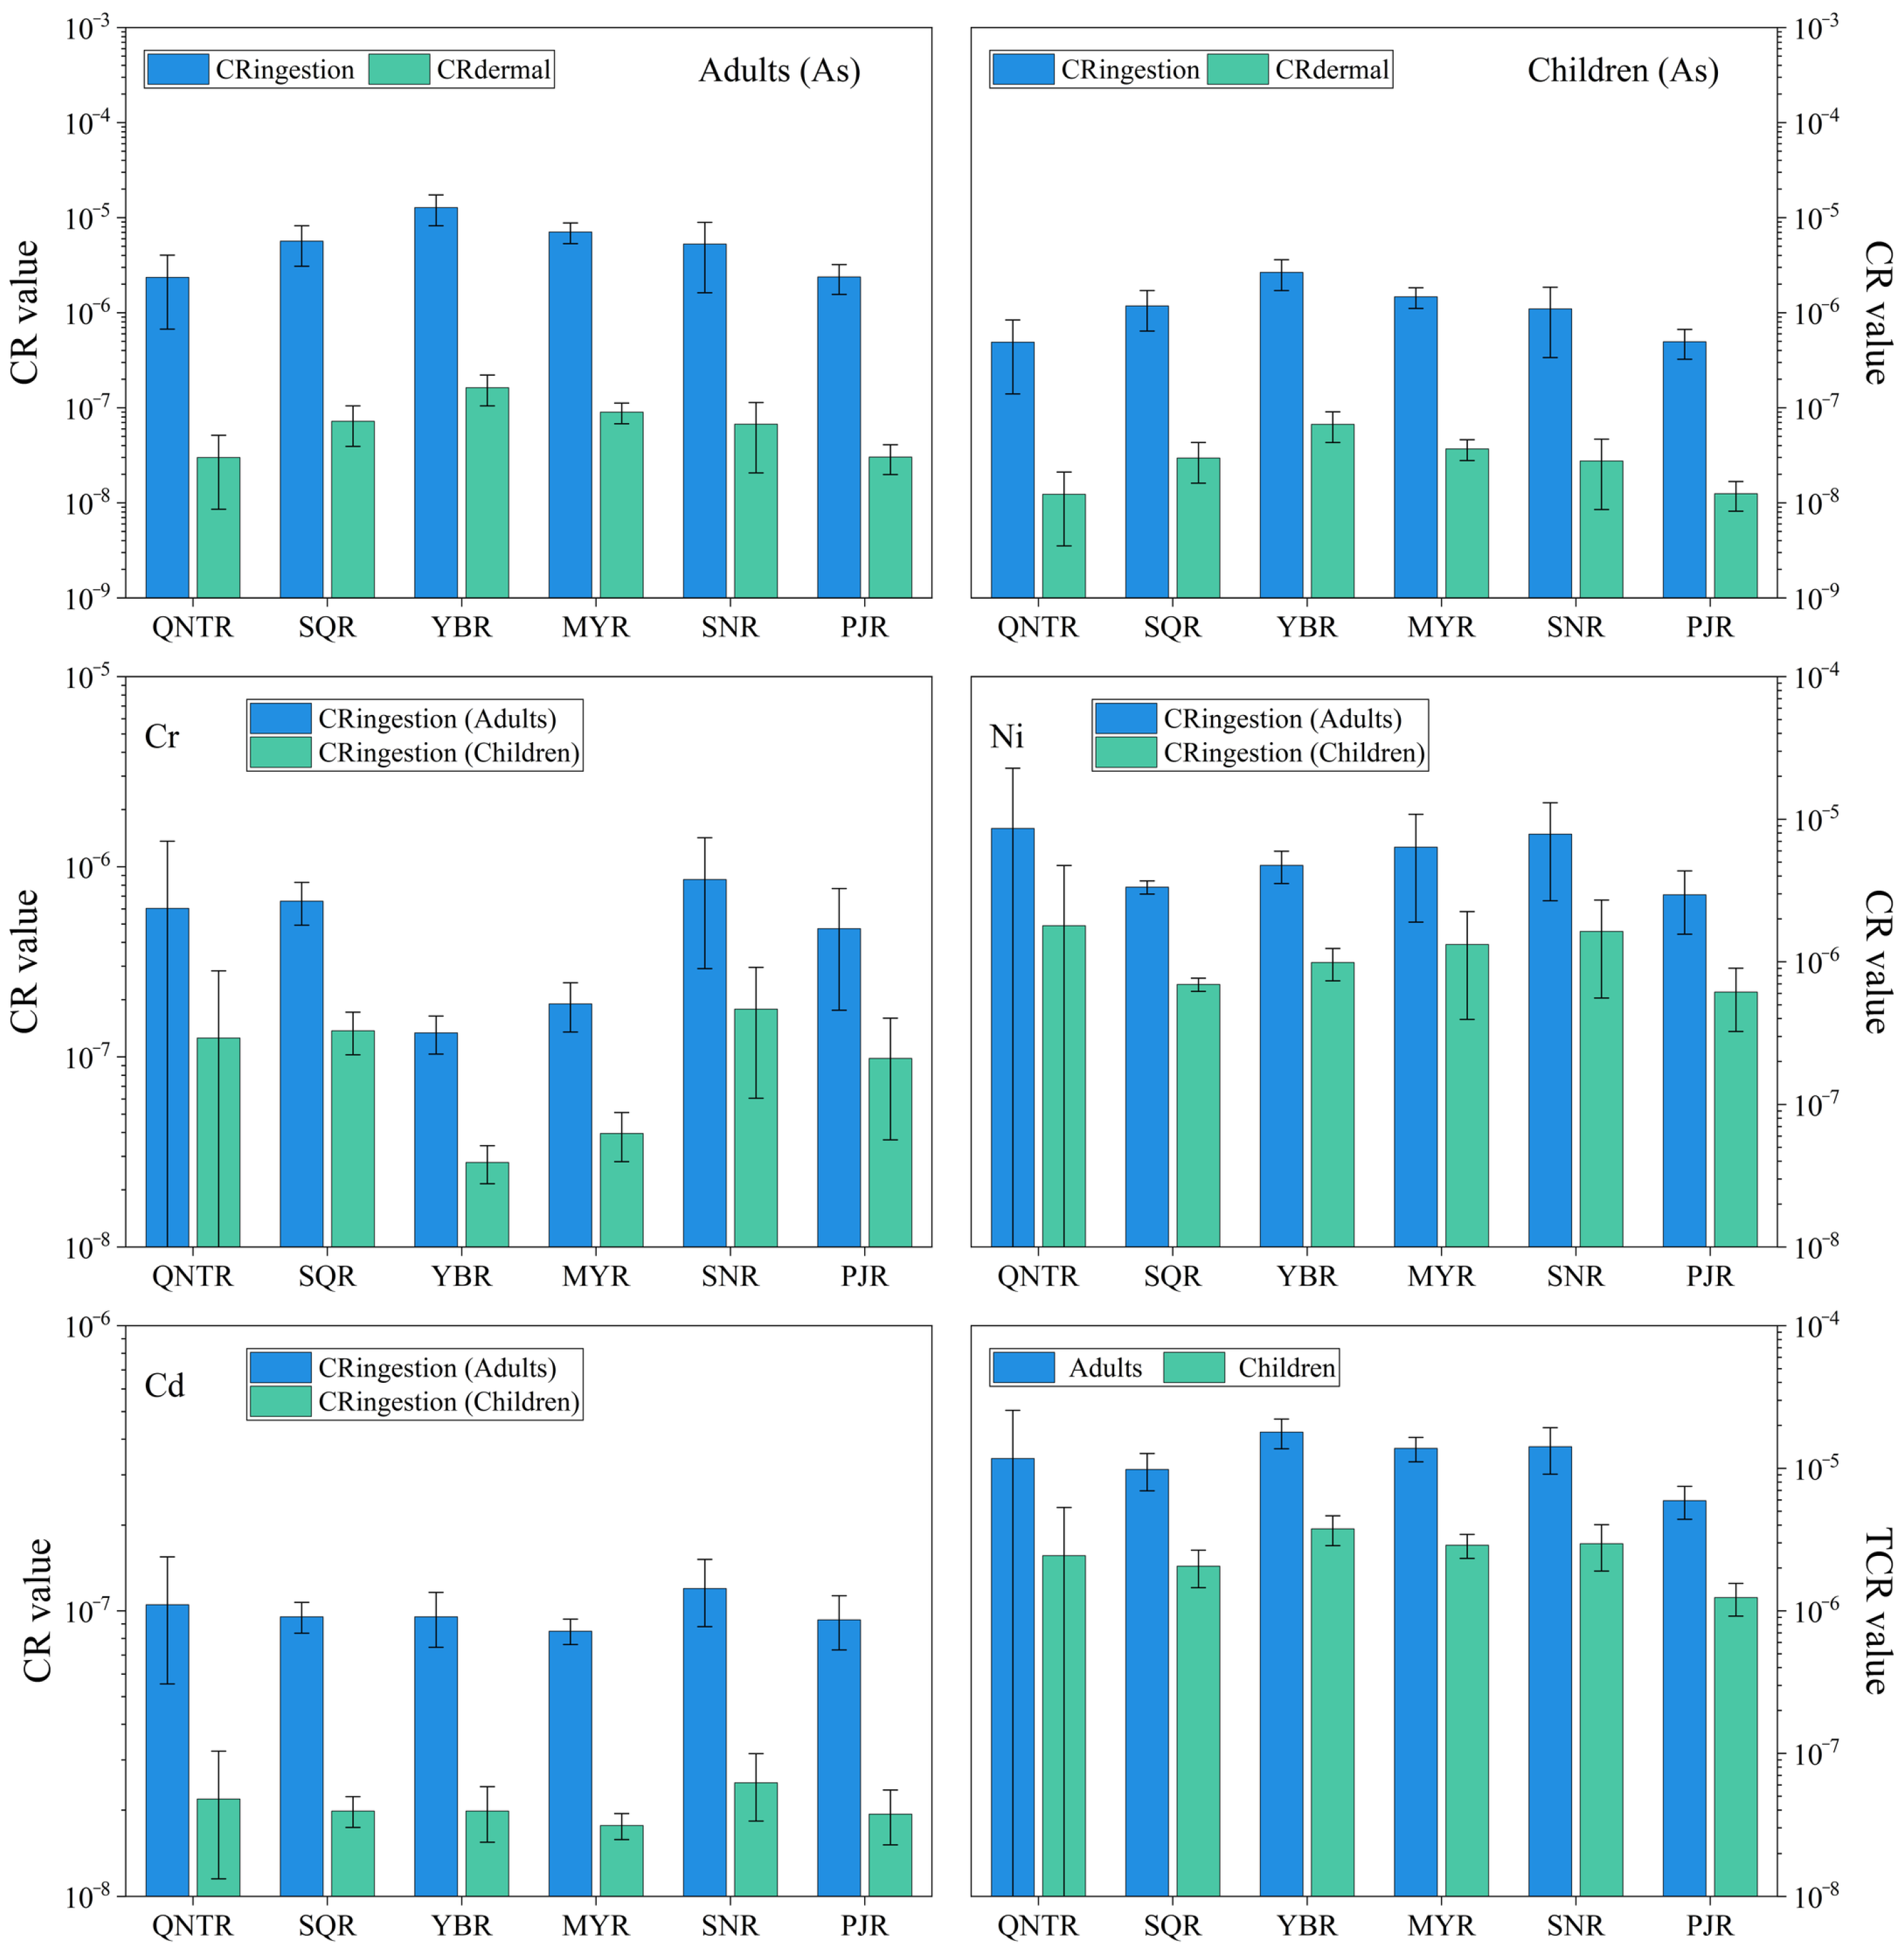
As, Ni, Cr and Cd, identified as potential carcinogens [10], were the focus of CR assessment in this study. The calculated CR and TCR values are shown in Figure 8. The cancer risks via ingestion (CRingestion) and dermal (CRdermal) exposure exhibited distinct spatial patterns across the six basins for different metals. For As, both CRingestion and CRdermal followed the same descending order: YBR > MYR > SQR > SNR > PJR > QNTR. In contrast, Ni posed a relatively higher risk via ingestion, with a completely reversed spatial order: QNTR > SNR > MYR > YBR > SQR > PJR. Cr and Cd showed different patterns, with their CRingestion orders being SNR > SQR > QNTR > PJR > MYR > YBR and SNR > QNTR > SQR = YBR > PJR > MYR, respectively. For all metals and exposure routes, cancer risks for adults were consistently approximately one order of magnitude higher than those for children, likely due to longer exposure durations. The CRingestion values for Ni exceeded those for Cr and Cd by one order of magnitude for adults, and by one to two orders of magnitude for children. Notably, the CRingestion values of Ni were comparable to those of As for both age groups. Furthermore, the ingestion route contributed to significantly higher cancer risks for As than dermal exposure across all basins, a pattern consistent with findings from river basins in China and Bangladesh [69,70]. This underscores that As poses a significant risk to local residents primarily via drinking water ingestion. The mean CRingestion values for Ni were 6.26 × 10⁻⁶ for adults and 1.30 × 10⁻⁶ for children, while for As they were 4.63 × 10⁻⁶ and 9.63 × 10⁻⁷, respectively. These levels are considered unacceptable according to domestic standards [71], but fall within the acceptable range defined by USEPA [21]. Chronic high As intake is linked to serious diseases, including hypertension, diabetes, neuropathies, cardiovascular and cerebrovascular diseases, skin lesions, and cancers of the liver, lung, bladder, kidney, and skin [28,72]. Similarly, long-term Ni ingestion is associated with health effects ranging from acute gastrointestinal symptoms to nasal and lung cancers [4]. Therefore, As and Ni require special attention, necessitating measures to preserve healthy aquatic ecosystems.
The TCR values ranged from 2.63 × 10⁻⁶ to 5.16 × 10⁻⁵ (mean: 1.15 × 10⁻⁵) for adults and from 5.49 × 10⁻⁷ to 1.05 × 10⁻⁵ (mean: 2.41 × 10⁻⁶) for children. Most values fell between 10−6 and 10−4, indicating an acceptable risk level [21], with adults being more susceptible than children to combined HM exposure in the study area. The spatial distribution of mean TCR values was as follows: YBR (adults: 1.79 × 10⁻⁵, children: 3.76 × 10⁻⁶) > SNR (1.41 × 10⁻⁵, 2.96 × 10⁻⁶) > MYR (1.38 × 10⁻⁵, 2.89 × 10⁻⁶) > QNTR (1.17 × 10⁻⁵, 2.44 × 10⁻⁶) > SQR (9.83 × 10⁻⁶, 2.06 × 10⁻⁶) > PJR (5.93 × 10⁻⁶, 1.24 × 10⁻⁶). The elevated risks in YBR, particularly for both age groups, are likely linked to intensified human impacts from tourism development in Yubeng Village. The carcinogenic risk probability aligns with earlier findings from the TP [8,10]. Therefore, regular monitoring in investigated basins is recommended to prevent the accumulation of As, Ni, Cd, Cr, and other toxic metals that may pose serious health threats, especially to adults.

3.3.3. Non-Cancer Risk Assessment

The NCR to human health from HMs in surface waters from six river basins was evaluated using the health risk assessment model recommended by the US EPA, with resulting HQingestion, HQdermal, and HI values presented in Table 3. Overall, the HI values were all below the threshold 1, suggesting no appreciable hazard from these basins. This is consistent with previous studies [11,67]. For both age groups, the HQingestion values remained below 1 (adults: 0.72 × 10⁻⁴ to 662.43 × 10⁻⁴, children: 0.75 × 10⁻⁴ to 688.93 × 10⁻⁴), implying that oral ingestion posed no significant adverse effects and a negligible NCR. The HQdermal values of HMs ranged from 0.01 × 10⁻⁴ to 5.07 × 10⁻⁴ for adults and 0.02 × 10⁻⁴ to 10.42 × 10⁻⁴ for children, similarly suggesting no health hazard via dermal contact. Notably, the children had consistently higher HQingestion, HQdermal, and HI values than adults (Table 3), reflecting their higher susceptibility under identical exposure conditions.
Among the studied HMs, As, Co, Mn, Cr and Cd were the major contributors to the elevated NCR for both children and adults. In particular, As showed the highest HQingestion and HI values, highlighting its potential detrimental impact on local residents’ health.
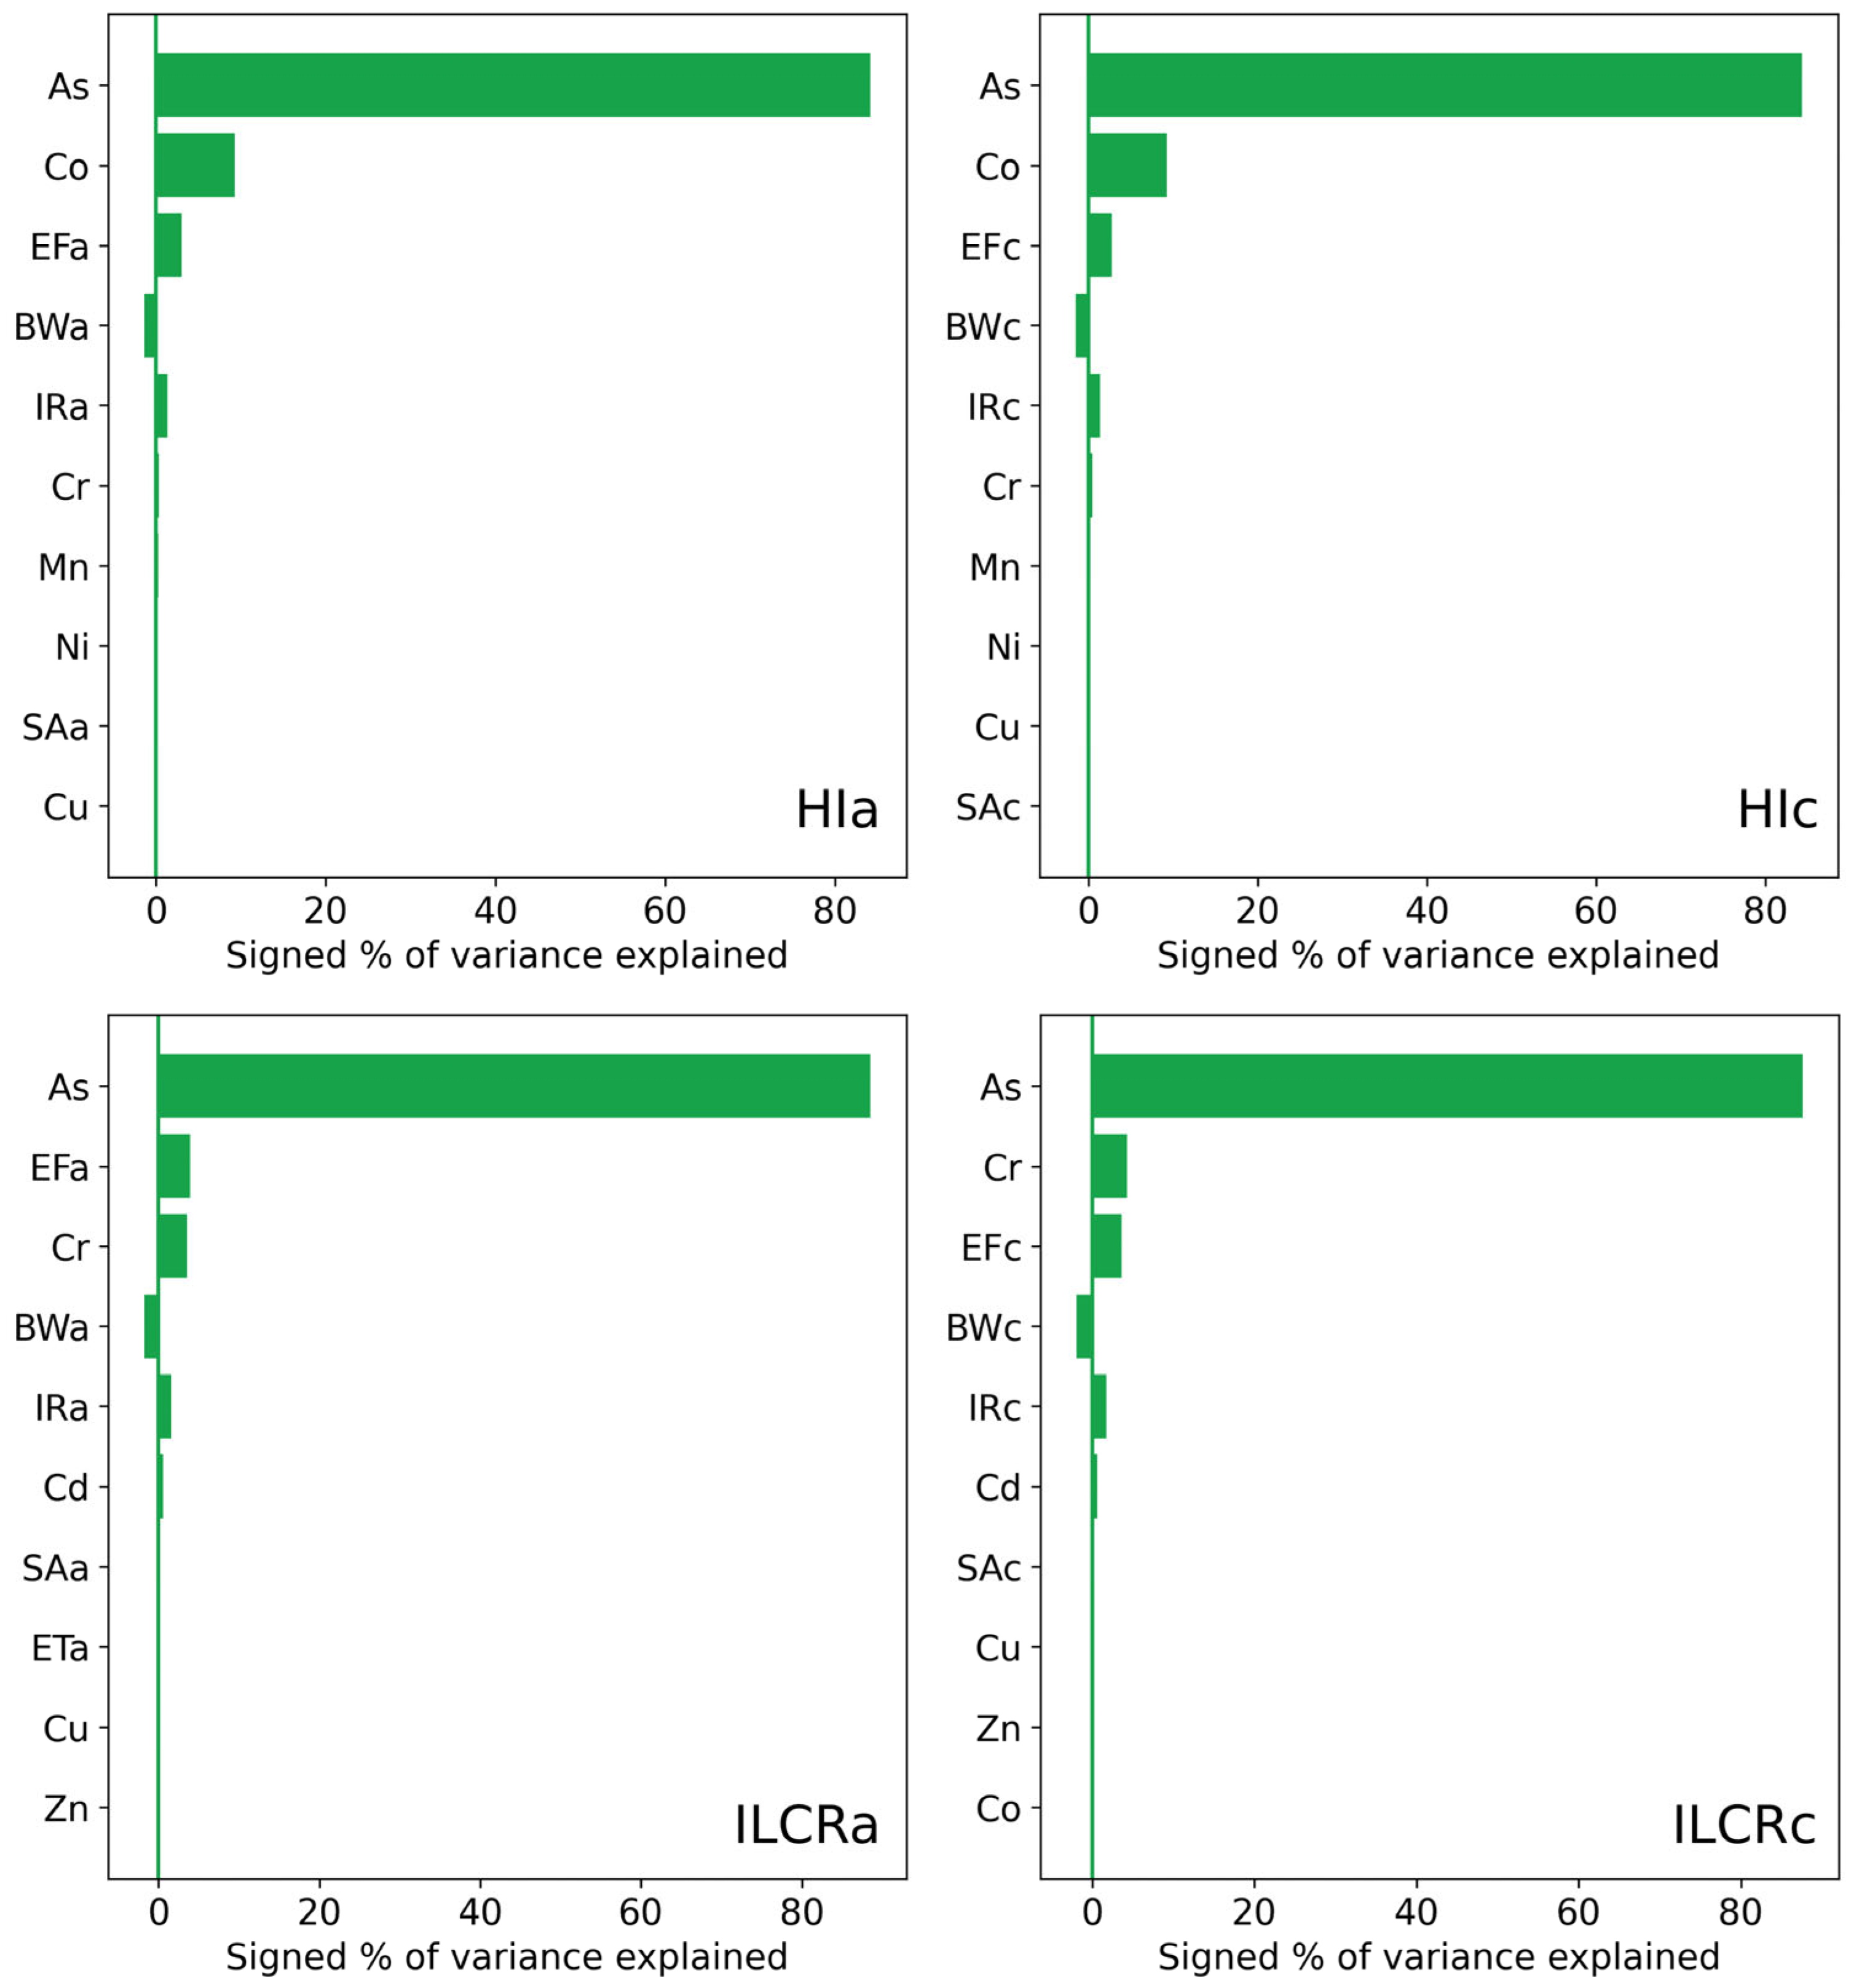
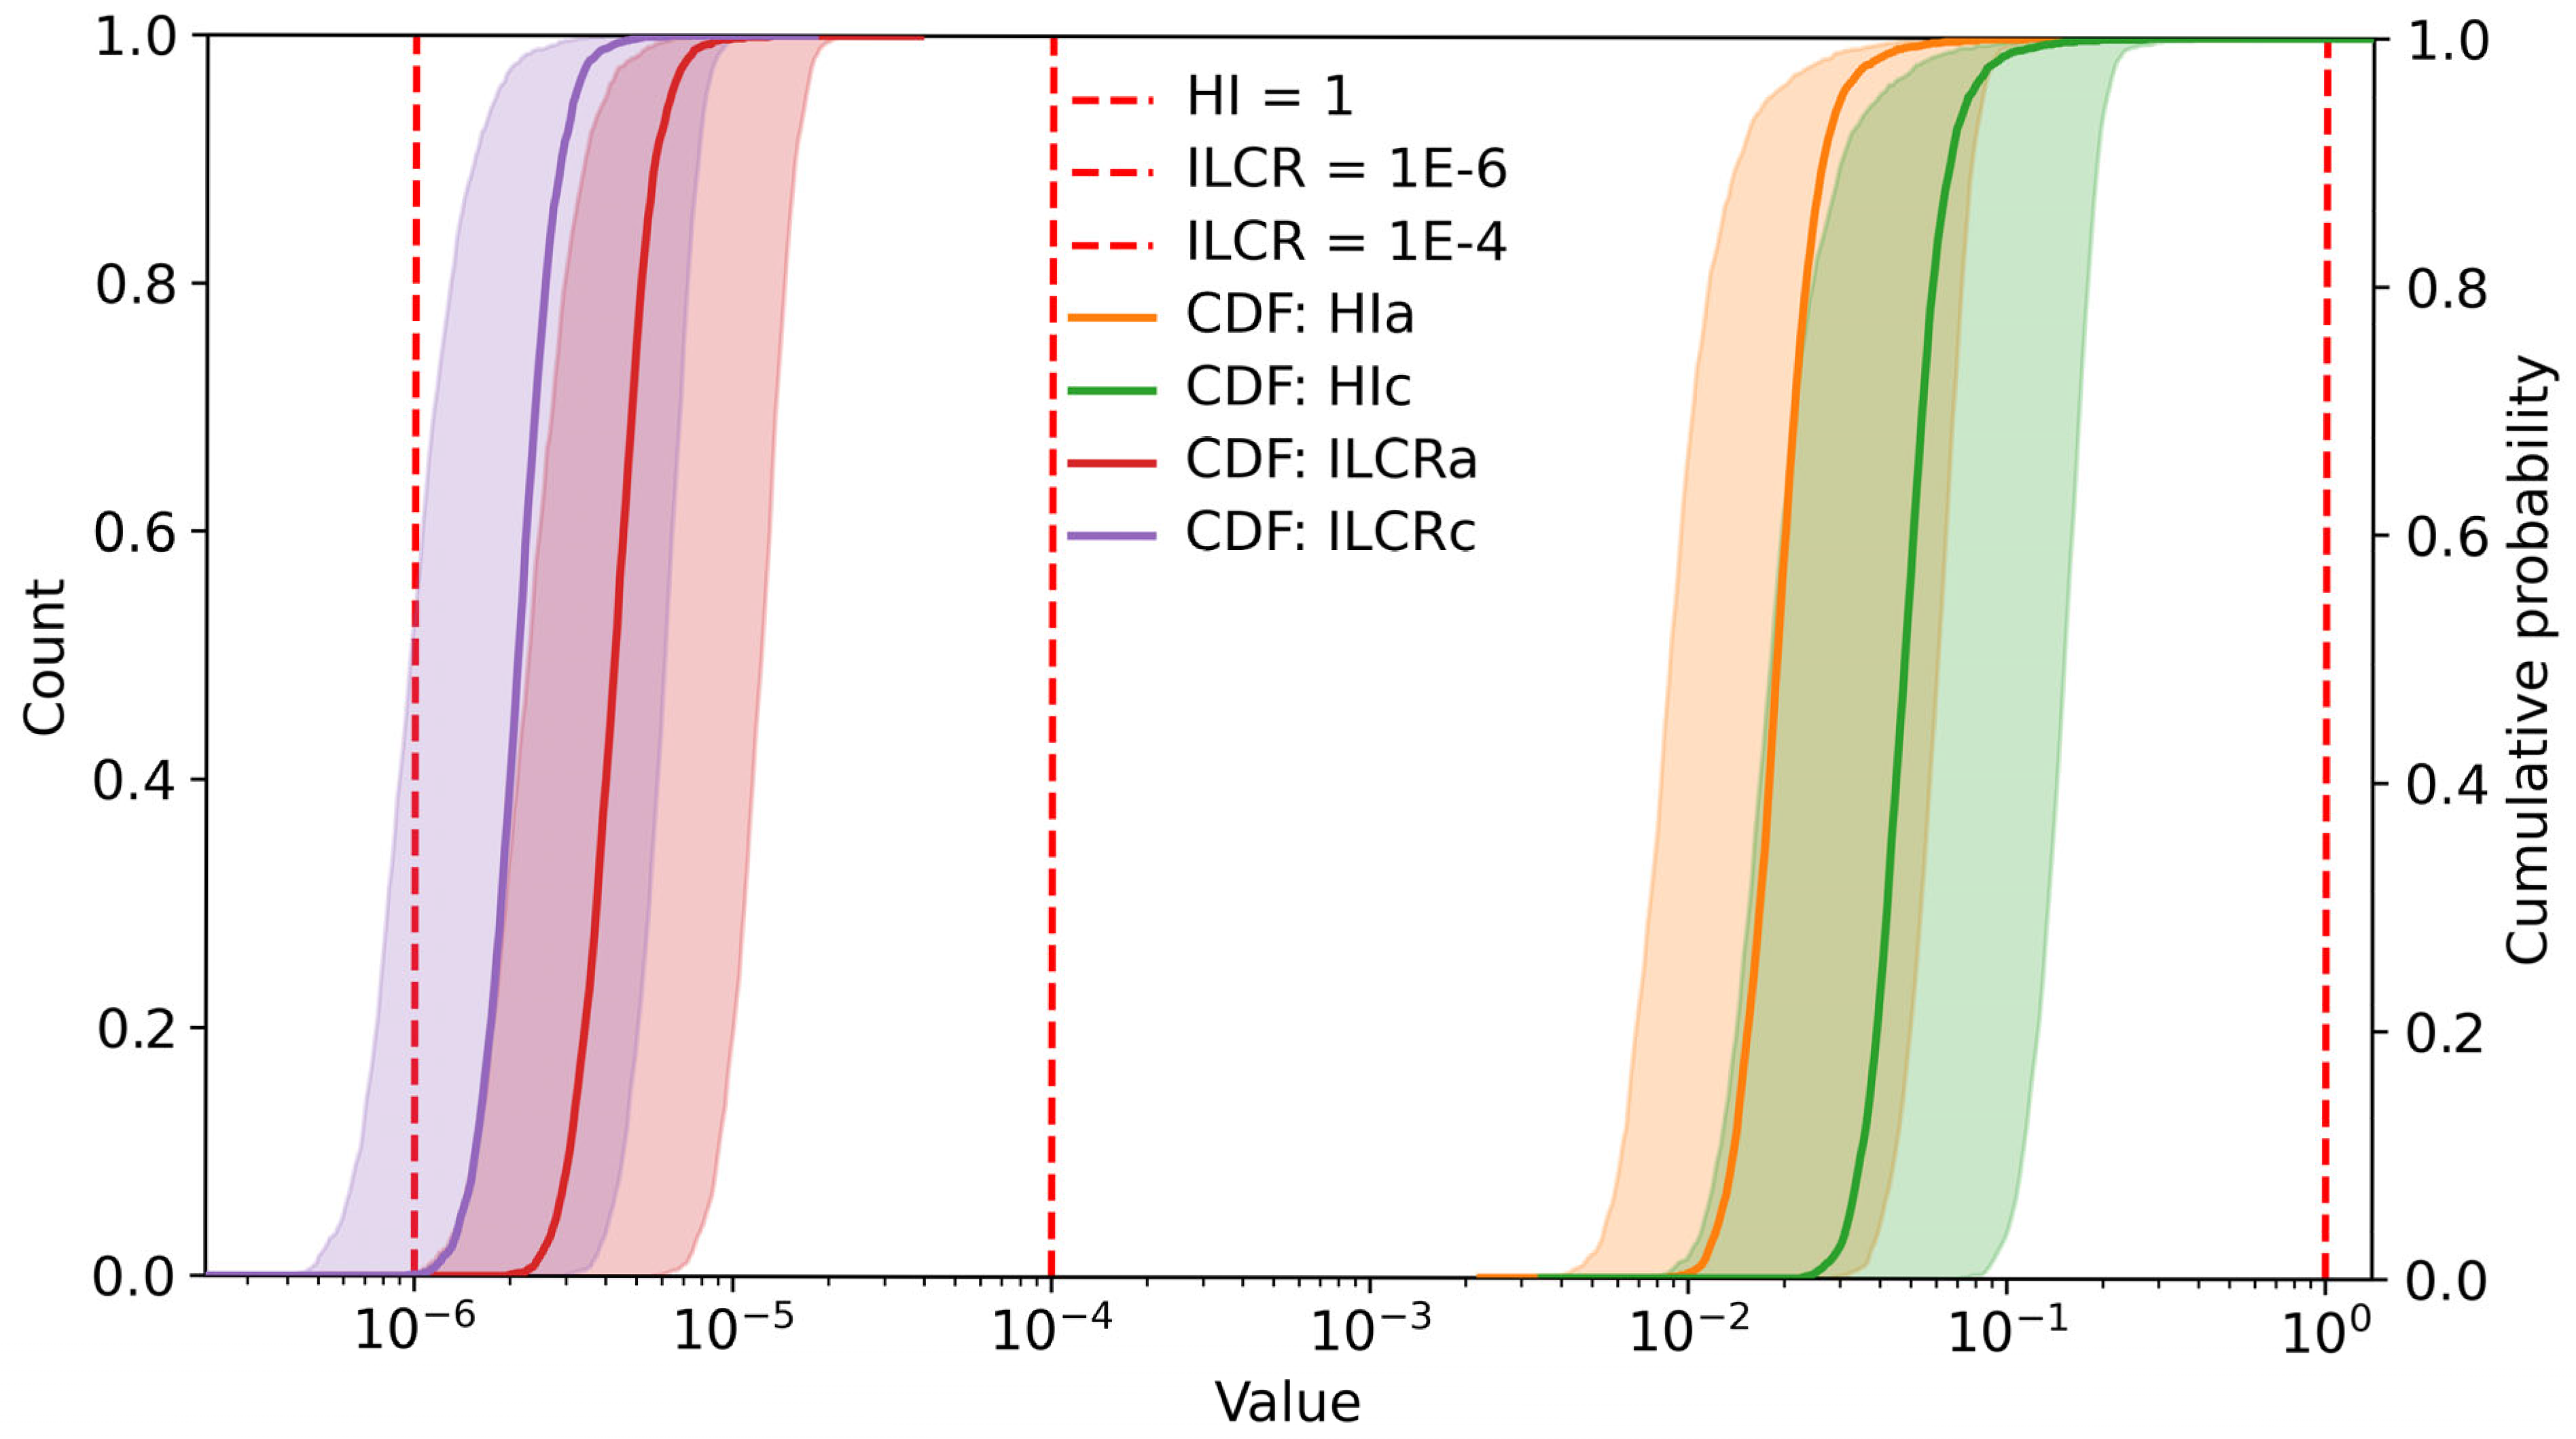
Based on the sensitivity analysis of variables for non-carcinogenic and carcinogenic risks (Figure 9), As was identified as the most sensitive variable and was consequently designated as the outer loop parameter in the two-dimensional Monte Carlo simulation, with all remaining variables serving as inner loop parameters. This simulation generated the cumulative distribution functions (CDFs) with confidence bands for both non-carcinogenic risk (adults: HIa; children: HIc) and total carcinogenic risk (adults: ILCRa; children: ILCRc), as presented in Figure 10 (generated using the OnVeMCS v1.1 software).
In Figure 10, the vertical red dashed line at HI = 1 denotes the threshold for non-carcinogenic risk. All simulated HI values fall below unity, underscoring the advantage of probabilistic methods over deterministic point estimates, which might otherwise overestimate the risk. For carcinogenic risk, the dashed lines at 10−6 and 10−4 mark the USEPA’s lower and upper acceptable risk boundaries. For both ILCRa and ILCRc, most simulated values lie within this interval; however, the ILCRa curve is positioned consistently higher than its ILCRc counterpart under the simulated scenarios, indicating relatively greater cancer risk estimates for adults.

4. Conclusions

The TP, a unique region with a delicate ecological balance that supplies water resources to approximately 40% of the global population, plays a critical role in maintaining both ecological security and human health. In this study, we performed a comprehensive analysis of multiple HMs (V, Cr, Mn, Co, Ni, Cu, Zn, As and Cd) based on extensive surface water samples collected from the Meili Snow Mountains glacier basin in the southeastern TP. Results indicated that HM concentrations were significantly lower in downstream rivers than those in the glacier basin, with correspondingly lower pollution levels in river samples compared to glacier meltwater. Notably, concentrations varied significantly across six river basins regardless of water type. Principal component analysis (PCA) revealed three dominant components (cumulatively explaining 76.6% of the variance), which grouped heavy metals into Mn–Co–Ni–Cd, Cu–Zn, and V–Cr associations, indicating mixed geogenic and anthropogenic influences. The PCA-derived patterns are broadly consistent with known sources (e.g., industrial emissions, fossil fuel combustion, and parent material weathering), but the method alone does not allow quantitative source apportionment due to the moderate sample-to-variable ratio. Given the surrounding heavily polluted regions, long-range atmospheric transport represents a non-negligible contributor to heavy metal deposition in the Tibetan Plateau aquatic environment, and future application of positive matrix factorization (PMF) with local emission inventories is recommended for robust quantitative allocation. The combined AOT and trajectory analysis points to local and regional transport as the primary drivers of HMs, with periodic contributions from India and Bangladesh and lesser input from the Tarim Basin, though this conclusion awaits validation by targeted chemical measurements. The calculated ERI values indicated a low overall ecological risk associated with HMs. The NCR values (HI < 1) were within safe limits, with children exhibiting greater susceptibility than adults and As being the primary risk contributor. The TCR values of As, Ni, Cr, and Cd fell within the acceptable range (10−6–10−4); however ingestion of As and Ni posed elevated risks, particularly in the YBR basin where adults were more sensitive. Together, these results provide a critical baseline for guiding future pollution prevention, water resource management, and public health protection on the TP.

Supplementary Materials

The following supporting information can be downloaded at: https://www.mdpi.com/article/10.3390/toxics14080672/s1. Table S1: The types of water samples and the correspondence between new and old IDs; Table S2: Parameters for indices’ calculation in the surface water; Table S3: Exposure and toxicological parameters used in health risk assessment; Table S4: Reference dose (RfD) and dermal permeability coefficient in samples (Kp) of HMs used for health risk assessment.

Author Contributions

Conceptualization, X.W. and H.Z.; methodology, H.Z.; software, X.W.; formal analysis, X.W. and R.Z.; investigation, X.W., R.Z., Q.H. and H.L.; resources, H.Z.; data curation, X.W., Q.H., H.L.,Y.Y., M.M. and B.R.; writing—original draft preparation, X.W. and H.Z.; writing—review and editing, H.Z.; supervision, H.Z.; project administration, H.Z. All authors have read and agreed to the published version of the manuscript.

Funding

This research received no external funding.

Institutional Review Board Statement

Not applicable.

Informed Consent Statement

Not applicable.

Data Availability Statement

The original contributions presented in this study are included in the article/Supplementary Materials. Further inquiries can be directed towards the corresponding authors.

Acknowledgments

The analysis of HMs was carried out at the Institute for Ecological Research and Pollution Control of Plateau Lakes, Yunnan University. We are grateful for their support. During the preparation of this work, we used Deepseek V3.2 for grammar, spelling, tone, and flow improvements. After using this tool, we reviewed and edited the content as needed and take full responsibility for the final publication.

Conflicts of Interest

The authors declare no conflicts of interest.

Abbreviations

TPTibetan Plateau
QNTRQunatong River
SQRShequ River
YBRYubeng River
MYRMingyong River
SNRSinong River
PJRPojun River
ICP–MSInductively coupled plasma–mass spectrometry
ERIEcological risk index
NCRNon-carcinogenic risk
US EPAUnited States Environmental Protection Agency
TCRTotal carcinogenic risk
CSFCancer slope factor
CVCoefficient of variation
SDStandard deviation
PCAPrincipal component analysis
PCsPrincipal components
VIIRSVisible Infrared Imaging Radiometer Suite
AOTAerosol Optical Thickness
HYSPLITHybrid Single Particle Lagrangian Integrated Trajectory
HMsHeavy metals
MCSMonte Carlo simulation
ADDaverage daily dose
HQhazard quotient
HIhazard index
CDFCumulative distribution function
PMFPositive matrix factorization

References

  1. Liu, X.; Dong, Z.; Wei, T.; Wang, L.; Gao, W.; Jiao, X.; Li, F. Composition, distribution, and risk assessment of heavy metals in large-scale river water on the Tibetan Plateau. J. Hazard. Mater. 2024, 476, 135094. [Google Scholar] [CrossRef] [Scilit] [PubMed]
  2. Yadav, S.K.; Attry, B.; Shukla, S.; Dutta, S.; Sharma, K.; Rajak, R.; Gupta, A.; Baruah, B.; Ranjan, R.K. Distribution, toxicity load and risk assessment of heavy metals in the groundwater of Dhemaji, Assam, India. Chemosphere 2024, 358, 141979. [Google Scholar] [CrossRef] [Scilit] [PubMed]
  3. Xu, W.; Jin, Y.; Zeng, G. Introduction of heavy metals contamination in the water and soil: A review on source, toxicity and remediation methods. Green Chem. Lett. Rev. 2024, 17, 2404235. [Google Scholar] [CrossRef] [Scilit]
  4. Saravanan, P.; Saravanan, V.; Rajeshkannan, R.; Arnica, G.; Rajasimman, M.; Baskar, G.; Pugazhendhi, A. Comprehensive review on toxic heavy metals in the aquatic system: Sources, identification, treatment strategies, and health risk assessment. Environ. Res. 2024, 258, 119440. [Google Scholar] [CrossRef] [Scilit] [PubMed]
  5. Yao, T.; Thompson, L.; Yang, W.; Yu, W.; Gao, Y.; Guo, X.; Yang, X.; Duan, K.; Zhao, H.; Xu, B.; et al. Different glacier status with atmospheric circulations in Tibetan Plateau and surroundings. Nat. Clim. Chang. 2012, 2, 663–667. [Google Scholar] [CrossRef] [Scilit]
  6. Huang, X.; Sillanpää, M.; Duo, B.; Gjessing, E.T. Water quality in the Tibetan Plateau: Metal contents of four selected rivers. Environ. Pollut. 2008, 156, 270–277. [Google Scholar] [CrossRef] [Scilit] [PubMed]
  7. Qu, B.; Zhang, Y.; Kang, S.; Sillanpää, M. Water quality in the Tibetan Plateau: Major ions and trace elements in rivers of the “Water Tower of Asia”. Sci. Total Environ. 2019, 649, 571–581. [Google Scholar] [CrossRef] [Scilit] [PubMed]
  8. Li, L.; Wu, J.; Lü, J.; Li, K.; Zhang, X.; Min, X.; Gao, C.; Xu, J. Water quality evaluation and ecological-health risk assessment on trace elements in surface water of the northeastern Qinghai-Tibet Plateau. Ecotoxicol. Environ. Saf. 2022, 241, 113775. [Google Scholar] [CrossRef] [Scilit] [PubMed]
  9. Zhou, Y.; Yuan, G.; Cong, Z.; Wang, X. Priorities for the sustainable development of the ecological environment on the Tibetan Plateau. Fundam. Res. 2021, 1, 329–333. [Google Scholar] [CrossRef] [Scilit]
  10. Peng, S.; Xiao, X.; Zou, H.; Yang, Z.; Ahmad, U.M.; Zhao, Y.; Chen, H.; Li, G.; Liu, G.; Duan, X.; et al. Levels, origins and probabilistic health risk appraisal for trace elements in drinking water from Lhasa, Tibet. Environ. Geochem. Health 2023, 45, 3405–3421. [Google Scholar] [CrossRef] [Scilit] [PubMed]
  11. Hong, J.; Zhang, J.; Song, Y.; Cao, X. Spatial and temporal distribution characteristics of nutrient elements and heavy metals in surface water of Tibet, China and their pollution assessment. Water 2022, 14, 3664. [Google Scholar] [CrossRef] [Scilit]
  12. Li, Y.; Li, Z.; Cozzi, G.; Turetta, C.; Barbante, C.; Huang, J.; Xiong, L. Signals of pollution revealed by trace elements in recent snow from mountain glaciers at the Qinghai–Tibetan plateau. Chemosphere 2018, 200, 523–531. [Google Scholar] [CrossRef] [Scilit] [PubMed]
  13. Ye, B.; Li, H.; Li, Y.; Chen, Y.; Yang, L.; Wang, W. Drinking water safety investigation in representative agricultural and pastoral areas of Lhasa River Valley. J. Environ. Hyg. 2016, 6, 79–81. (In Chinese) [Google Scholar]
  14. Fadlillah, L.N.; Utami, S.; Rachmawati, A.A.; Jayanto, G.D.; Widyastuti, M. Ecological risk and source identifications of heavy metals contamination in the water and surface sediments from anthropogenic impacts of urban river, Indonesia. Heliyon 2023, 9, e15485. [Google Scholar] [CrossRef] [Scilit] [PubMed]
  15. Proshad, R.; Islam, S.; Tusher, T.R.; Zhang, D.; Khadka, S.; Gao, J.; Kundu, S. Appraisal of heavy metal toxicity in surface water with human health risk by a novel approach: A study on an urban river in vicinity to industrial areas of Bangladesh. Toxin. Rev. 2020, 40, 803–819. [Google Scholar] [CrossRef] [Scilit]
  16. GB 3838-2002; Environmental Quality Standards for Surface Water. Ministry of Environmental Protection: Beijing, China, 2002.
  17. World Health Organization. Guidelines for Drinking-Water Quality, 4th ed.; World Health Organization (WHO): Geneva, Switzerland, 2022. [Google Scholar]
  18. Liu, H.; Bai, J.; Zhang, K.; Wang, C.; Liang, J.; Zhang, L.; Wang, Y.; Xiao, R. Heavy metal pollution and ecological risk assessment of surface sediments covered by emerged and submerged plants in a shallow lake. Ecohydrol. Hydrobiol. 2024, 24, 849–856. [Google Scholar] [CrossRef] [Scilit]
  19. Islam, A.R.M.T.; Islam, H.M.T.; Mia, M.U.; Khan, R.; Habib, M.A.; Bodrud-Doza, M.; Siddique, M.A.B.; Chu, R. Co-distribution, possible origins, status and potential health risk of trace elements in surface water sources from six major river basins, Bangladesh. Chemosphere 2020, 249, 126180. [Google Scholar] [CrossRef] [Scilit] [PubMed]
  20. Liu, N.; Ni, T.; Xia, J.; Dai, M.; He, C.; Lu, G. Non-carcinogenic risks induced by metals in drinking source water of Jiangsu Province, China. Environ. Monit. Assess. 2011, 177, 449–456. [Google Scholar] [CrossRef] [Scilit] [PubMed]
  21. United States Environmental Protection Agency (US EPA). Risk Assessment Guidance for Superfund Volume 1: Human Health Evaluation Manual (Part E, Supplemental Guidance for Dermal Risk Assessment); EPA/540/R/99/05; Office of Superfund Remediation and Technology Innovation, U.S. Environmental Protection Agency: Washington, DC, USA, 2004.
  22. Wang, J.; Liu, G.; Liu, H.; Lam, P.K.S. Multivariate statistical evaluation of dissolved trace elements and a water quality assessment in the middle reaches of Huaihe River, Anhui, China. Sci. Total Environ. 2017, 583, 421–431. [Google Scholar] [CrossRef] [Scilit] [PubMed]
  23. Zeng, X.; Liu, Y.; You, S.; Zeng, G.; Tan, X.; Hu, X.; Hu, X.; Huang, L.; Li, F. Spatial distribution, health risk assessment and statistical source identification of the trace elements in surface water from the Xiangjiang River, China. Environ. Sci. Pollut. Res. 2015, 22, 9400–9412. [Google Scholar] [CrossRef] [Scilit] [PubMed]
  24. Schecter, A.; Li, L. Dioxins, dibenzofurans, dioxin-like PCBs, and DDE in U.S. fast food, 1995. Chemosphere 1997, 34, 1449–1457. [Google Scholar] [CrossRef] [Scilit] [PubMed]
  25. United States Environmental Protection Agency (US EPA). Exposure Factors Handbook; 2011 ed.; U.S. Environmental Protection Agency: Washington, DC, USA, 2011.
  26. Duggal, V.; Rani, A. Carcinogenic and Non-Carcinogenic Risk Assessment of Metals in Groundwater via Ingestion and Dermal Absorption Pathways for Children and Adults in Malwa Region of Punjab. J. Geol. Soc. India 2018, 92, 187–194. [Google Scholar] [CrossRef] [Scilit]
  27. Teng, Y.; Li, J.; Wu, J.; Lu, S.; Wang, Y.; Chen, H. Environmental Distribution and Associated Human Health Risk Due to Trace Elements and Organic Compounds in Soil in Jiangxi Province, China. Ecotoxicol. Environ. Saf. 2015, 122, 406–416. [Google Scholar] [CrossRef] [Scilit] [PubMed]
  28. Xiao, J.; Wang, L.; Deng, L.; Jin, Z. Characteristics, sources, water quality and health risk assessment of trace elements in river water and well water in the Chinese Loess Plateau. Sci. Total Environ. 2019, 650, 2004–2012. [Google Scholar] [CrossRef] [Scilit] [PubMed]
  29. Eslami, H.; Esmaeili, A.; Razaeian, M.; Salari, M.; Hosseini, A.N.; Mobini, M.; Barani, A. Potentially toxic metal concentration, spatial distribution, and health risk assessment in drinking groundwater resources of southeast Iran. Geosci. Front. 2022, 13, 101276. [Google Scholar] [CrossRef] [Scilit]
  30. Vesković, J.; Onjia, A. Two-dimensional Monte Carlo simulation coupled with multilinear regression modeling of source-specific health risks from groundwater. J. Hazard. Mater. 2025, 488, 137309. [Google Scholar] [CrossRef] [Scilit] [PubMed]
  31. Imtiyaz, U.; Rather, M.A. Heavy metal pollution in northwestern Himalayan groundwater: Comprehensive assessment using multiple pollution indices and Monte Carlo simulation for health risk. Water Environ. Res. 2025, 97, e70078. [Google Scholar] [CrossRef] [Scilit] [PubMed]
  32. Onjia, A.; Vesković, J. OnVeMCS: A Standalone Software for Monte Carlo Simulation and Sensitivity Analysis of Risks from Multi-Pathway Human Exposure via Soil, Sediment, Water, Air, and Food. Environments 2026, 13, 332. [Google Scholar] [CrossRef] [Scilit]
  33. Long, Z.; Zhu, H.; Bing, H.; Tian, X.; Wang, Z.; Wang, X.; Wu, Y. Contamination, sources and health risk of heavy metals in soil and dust from different functional areas in an industrial city of Panzhihua City, Southwest China. J. Hazard. Mater. 2021, 420, 126638. [Google Scholar] [CrossRef] [Scilit] [PubMed]
  34. Sayer, A.M.; Hsu, N.C.; Lee, J.; Bettenhausen, C.; Kim, W.V.; Smirnov, A. Satellite Ocean Aerosol Retrieval (SOAR) algorithm extension to S-NPP VIIRS as part of the “Deep Blue” aerosol project. J. Geophys. Res. Atmos. 2018, 123, 380–400. [Google Scholar] [CrossRef] [Scilit] [PubMed]
  35. Hsu, N.C.; Lee, J.; Sayer, A.M.; Kim, W.; Bettenhausen, C.; Tsay, S.-C. VIIRS Deep Blue aerosol products over land: Extending the EOS long-term aerosol data records. J. Geophys. Res. Atmos. 2019, 124, 4026–4053. [Google Scholar] [CrossRef] [Scilit]
  36. Wang, Z.; Luo, P.; Zha, X.; Xu, C.; Kang, S.; Zhou, M.; Nover, D.; Wang, Y. Overview assessment of risk evaluation and treatment technologies for heavy metal pollution of water and soil. J. Clean. Prod. 2022, 379, 134043. [Google Scholar] [CrossRef] [Scilit]
  37. Li, Y.; Zhu, Y.; Chen, Y.; Wang, C.; Zhao, G.; Pan, H.; Wang, C.; Bao, H.; Ibrahim, M.; Norgbey, E. Heavy metals contamination in water-sediment systems of a large drinking water reservoir in southern China: Large-scale assessment and risk-based management. J. Clean. Prod. 2025, 525, 146557. [Google Scholar] [CrossRef] [Scilit]
  38. Li, R.; Shen, B.; Wu, X. Spatial distribution and source analysis of trace elements in typical mountain glaciers on the Qinghai-Tibet Plateau. J. Glaciol. Geocryol. 2021, 43, 1277–1289. (In Chinese) [Google Scholar]
  39. Dong, Z.; Brahney, J.; Kang, S.; Elser, J.; Wei, T.; Jiao, X.; Shao, Y. Aeolian dust transport, cycle and influences in high-elevation cryosphere of the Tibetan Plateau region: New evidences from alpine snow and ice. Earth-Sci. Rev. 2020, 211, 103408. [Google Scholar] [CrossRef] [Scilit]
  40. Wu, R.; Dong, Z.; Cheng, X.; Brahney, J.; Jiao, X.; Wu, L. Heavy metal levels and sources in suspended particulate matters of the glacier watersheds in Northeast Tibetan Plateau. Front. Environ. Sci. 2022, 10, 918514. [Google Scholar] [CrossRef] [Scilit]
  41. Pant, R.R.; Zhang, F.; Rehman, F.U.; Koirala, M.; Rijal, K.; Maskey, R. Spatiotemporal characterization of dissolved trace elements in the Gandaki River, Central Himalaya Nepal. J. Hazard. Mater. 2020, 389, 121913. [Google Scholar] [CrossRef] [Scilit] [PubMed]
  42. Li, X.; He, X.; Kang, S.; Sillanpää, M.; Ding, Y.; Han, T.; Wu, Q.; Yu, Z.; Qin, D. Diurnal dynamics of minor and trace elements in stream water draining Dongkemadi Glacier on the Tibetan Plateau and its environmental implications. J. Hydrol. 2016, 541, 1104–1118. [Google Scholar] [CrossRef] [Scilit]
  43. Gupta, D.; Shukla, R.; Srivastava, P.K.; Mishra, V.K. Assessment of heavy metal pollution level, ecological and human health risks in surface water of Narmada River, India. Sustain. Water Resour. Manag. 2024, 10, 154. [Google Scholar] [CrossRef] [Scilit]
  44. Arora, S.; Khandade, T.; Gupta, L.N.; Saha, P. Comprehensive analysis of heavy metal contamination in the Mandakini (Payaswini) river: Multivariate and index-based perspectives. Water Environ. Res. 2025, 97, e70060. [Google Scholar] [CrossRef] [Scilit] [PubMed]
  45. Pal, D.; Maiti, S.K. Heavy metal speciation, leaching and toxicity status of a tropical rain-fed river Damodar, India. Environ. Geochem. Health 2018, 40, 2303–2324. [Google Scholar] [CrossRef] [Scilit] [PubMed]
  46. Giri, S.; Singh, A.K. Risk assessment, statistical source identification and seasonal fluctuation of dissolved metals in the Subarnarekha River, India. J. Hazard. Mater. 2014, 265, 305–314. [Google Scholar] [CrossRef] [Scilit] [PubMed]
  47. Pant, R.R.; Bishwakarma, K.; Kandel, K.; Poudel, S.; Nepal, J.; Neupane, B.B.; Singh, V.B. Seasonal variations and health risk assessment of trace elements in the Badigad River, lesser Himalayas, Nepal. Acta Geochim. 2023, 42, 689–703. [Google Scholar] [CrossRef] [Scilit]
  48. Tripathee, L.; Kang, S.; Sharma, C.M.; Rupakheti, D.; Paudyal, R.; Huang, J.; Sillanpää, M. Preliminary health risk assessment of potentially toxic metals in surface water of the Himalayan rivers, Nepal. Bull. Environ. Contam. Toxicol. 2016, 97, 855–862. [Google Scholar] [CrossRef] [Scilit] [PubMed]
  49. Yuan, Y.; Liu, Y.; Luo, K.; Shahid, M.Z. Hydrochemical characteristics and a health risk assessment of the use of river water and groundwater as drinking sources in a rural area in Jiangjin District, China. Environ. Earth Sci. 2020, 79, 160. [Google Scholar] [CrossRef] [Scilit]
  50. Ali, W.; Muhammad, S.; Tokatli, C.; Ahmad, A.; Zhang, L. Toxicological risk assessment and sources of heavy metal(loid)s using compositional data analysis, Astore River Basin, Himalaya. Mar. Pollut. Bull. 2025, 217, 118065. [Google Scholar] [CrossRef] [Scilit] [PubMed]
  51. Qu, B.; Zhang, Y.; Kang, S.; Sillanpää, M. Water chemistry of the southern Tibetan Plateau: An assessment of the Yarlung Tsangpo river basin. Environ. Earth Sci. 2017, 76, 74. [Google Scholar] [CrossRef] [Scilit]
  52. Xiao, J.; Jin, Z.; Wang, J. Geochemistry of trace elements and water quality assessment of natural water within the Tarim River Basin in the extreme arid region, NW China. J. Geochem. Explor. 2014, 136, 118–126. [Google Scholar] [CrossRef] [Scilit]
  53. Dong, Z.; Kang, S.; Qin, D.; Qin, X.; Yan, F.; Du, W.; Wei, T. Temporal and diurnal analysis of trace elements in the cryospheric water at remote Laohugou basin in northeast Tibetan Plateau. Chemosphere 2017, 171, 386–398. [Google Scholar] [CrossRef] [Scilit] [PubMed]
  54. Jiao, X.; Dong, Z.; Kang, S.; Li, Y.; Jiang, C.; Rostami, M. New insights into heavy metal elements deposition in the snowpacks of mountain glaciers in the eastern Tibetan Plateau. Ecotoxicol. Environ. Saf. 2021, 207, 111228. [Google Scholar] [CrossRef] [Scilit] [PubMed]
  55. Wei, T.; Dong, Z.; Kang, S.; Zong, C.; Rostami, M.; Shao, Y. Atmospheric deposition and contamination of trace elements in snowpacks of mountain glaciers in the northeastern Tibetan Plateau. Sci. Total Environ. 2019, 689, 754–764. [Google Scholar] [CrossRef] [Scilit] [PubMed]
  56. Wu, R.; Dong, Z.; Wei, T.; Cheng, X.; Jiao, X.; Shao, Y. Comparison on distribution and sources of typical major and toxic trace elements in various glacial watersheds of the northeast Tibetan Plateau. Ecotoxicol. Environ. Saf. 2023, 263, 115271. [Google Scholar] [CrossRef] [Scilit] [PubMed]
  57. Vu, C.T.; Lin, C.; Shern, C.-C.; Yeh, G.; Le, V.G.; Tran, H.T. Contamination, ecological risk and source apportionment of heavy metals in sediments and water of a contaminated river in Taiwan. Ecol. Indic. 2017, 82, 32–42. [Google Scholar] [CrossRef] [Scilit]
  58. Fang, X.; Han, X.; Tang, C.; Peng, B.; Peng, Q.; Hu, L.; Zhong, Y.; Shi, S. Distribution characteristics, mobility, and influencing factors of heavy metals at the sediment–water interface in South Dongting Lake. Water 2025, 17, 2331. [Google Scholar] [CrossRef] [Scilit]
  59. Huang, J.; Li, Y.; Li, Z.; Xiong, L. Spatial variations and sources of trace elements in recent snow from glaciers at the Tibetan Plateau. Environ. Sci. Pollut. Res. 2018, 25, 7875–7883. [Google Scholar] [CrossRef] [Scilit] [PubMed]
  60. Xia, Z.; Zhang, J.; Yan, Y.; Zhang, W.; Zhao, Z. Heavy metals in suspended particulate matter in the Yarlung Tsangpo River, Southwest China. Geosyst. Geoenviron. 2024, 3, 100160. [Google Scholar] [CrossRef] [Scilit]
  61. Dong, Z.; Kang, S.; Qin, X.; Li, X.; Qin, D.; Ren, J. New insights into trace elements deposition in the snow packs at remote alpine glaciers in the northern Tibetan Plateau, China. Sci. Total Environ. 2015, 529, 101–113. [Google Scholar] [CrossRef] [Scilit] [PubMed]
  62. Zhang, H.; Yao, Y.; Wen, X.; Zhang, R.; Liu, R. Glacial Waters Under Threat: Risk Assessment and Source Identification of Polychlorinated Biphenyls in Meili Snow Mountains, Southeastern Tibetan Plateau. Toxics 2025, 13, 391. [Google Scholar] [CrossRef] [Scilit] [PubMed]
  63. Tiwari, P.; Mehrotra, B.J.; Gupta, S.; Srivastava, M.K.; Kumar, M.; Vijayan, N.; Choudhary, A.; Sharma, S.K. Unveiling the elemental composition, sources and health impacts of PM10 over the central Indo-Gangetic plain (IGP) of India. Phys. Chem. Earth 2024, 136, 103752. [Google Scholar] [CrossRef] [Scilit]
  64. Shukla, A.K.; Tripathi, S.N.; Talukdar, S.; Murari, V.; Gaddamidi, S.; Manousakas, M.-I.; Lalchandani, V.; Dixit, K.; Ruge, V.M.; Khare, P.; et al. Measurement report: Sources and meteorology influencing highly time-resolved PM2.5 trace elements at three urban sites in the extremely polluted Indo-Gangetic Plain in India. Atmos. Chem. Phys. 2025, 25, 3765–3784. [Google Scholar] [CrossRef] [Scilit]
  65. Kumar, M.; Kumar, S.; Lovish. Statistical and geospatial assessment of trace and toxic elements distribution in ground and surface water of northern parts of the Indo-Gangetic plains: Source identification and health risk assessment. Chemosphere 2024, 364, 142990. [Google Scholar] [CrossRef] [Scilit] [PubMed]
  66. Yadav, S.K.; Baruah, B.; Dutta, K.; Rai, K.; Rai, A.; Rajak, R.; Gupta, A.; Misra, A.K.; Wanjari, N.; Ranjan, R.K. Exploring the multi-faceted health risks of heavy metals exposure in Sikkim’s unique Himalayan ecosystem, India. Environ. Monit. Assess. 2025, 197, 286. [Google Scholar] [CrossRef] [Scilit] [PubMed]
  67. State Administration for Market Regulation. Standards for Drinking Water Quality; State Administration for Market Regulation of China: Beijing, China, 2022.
  68. Mao, G.; Zhang, Y.; Tong, Y.; Huang, X.; Mehr, F. Ecological risk assessment of heavy metals to aquatic organisms in the Lhasa River, Tibet, China. Environ. Sci. Pollut. Res. 2020, 27, 26091–26102. [Google Scholar] [CrossRef] [Scilit] [PubMed]
  69. Gao, B.; Gao, L.; Gao, J.; Xu, D.; Wang, Q.; Sun, K. Simultaneous evaluations of occurrence and probabilistic human health risk associated with trace elements in typical drinking water sources from major river basins in China. Sci. Total Environ. 2019, 666, 139–146. [Google Scholar] [CrossRef] [Scilit] [PubMed]
  70. Islam, A.R.M.T.; Ahmed, N.; Bodrud-Doza, M.; Chu, R. Characterizing groundwater quality ranks for drinking purposes in Sylhet district, Bangladesh, using entropy method, spatial autocorrelation index, and geostatistics. Environ. Sci. Pollut. Res. 2017, 24, 26350–26374. [Google Scholar] [CrossRef] [Scilit] [PubMed]
  71. State Environmental Protection Administration. Technical Guidelines for Risk Assessment of Contaminated Sites; State Environmental Protection Administration of China: Beijing, China, 2014.
  72. Li, S.; Zhang, Q. Risk assessment and seasonal variations of dissolved trace elements and heavy metals in the Upper Han River, China. J. Hazard. Mater. 2010, 181, 1051–1058. [Google Scholar] [CrossRef] [Scilit] [PubMed]
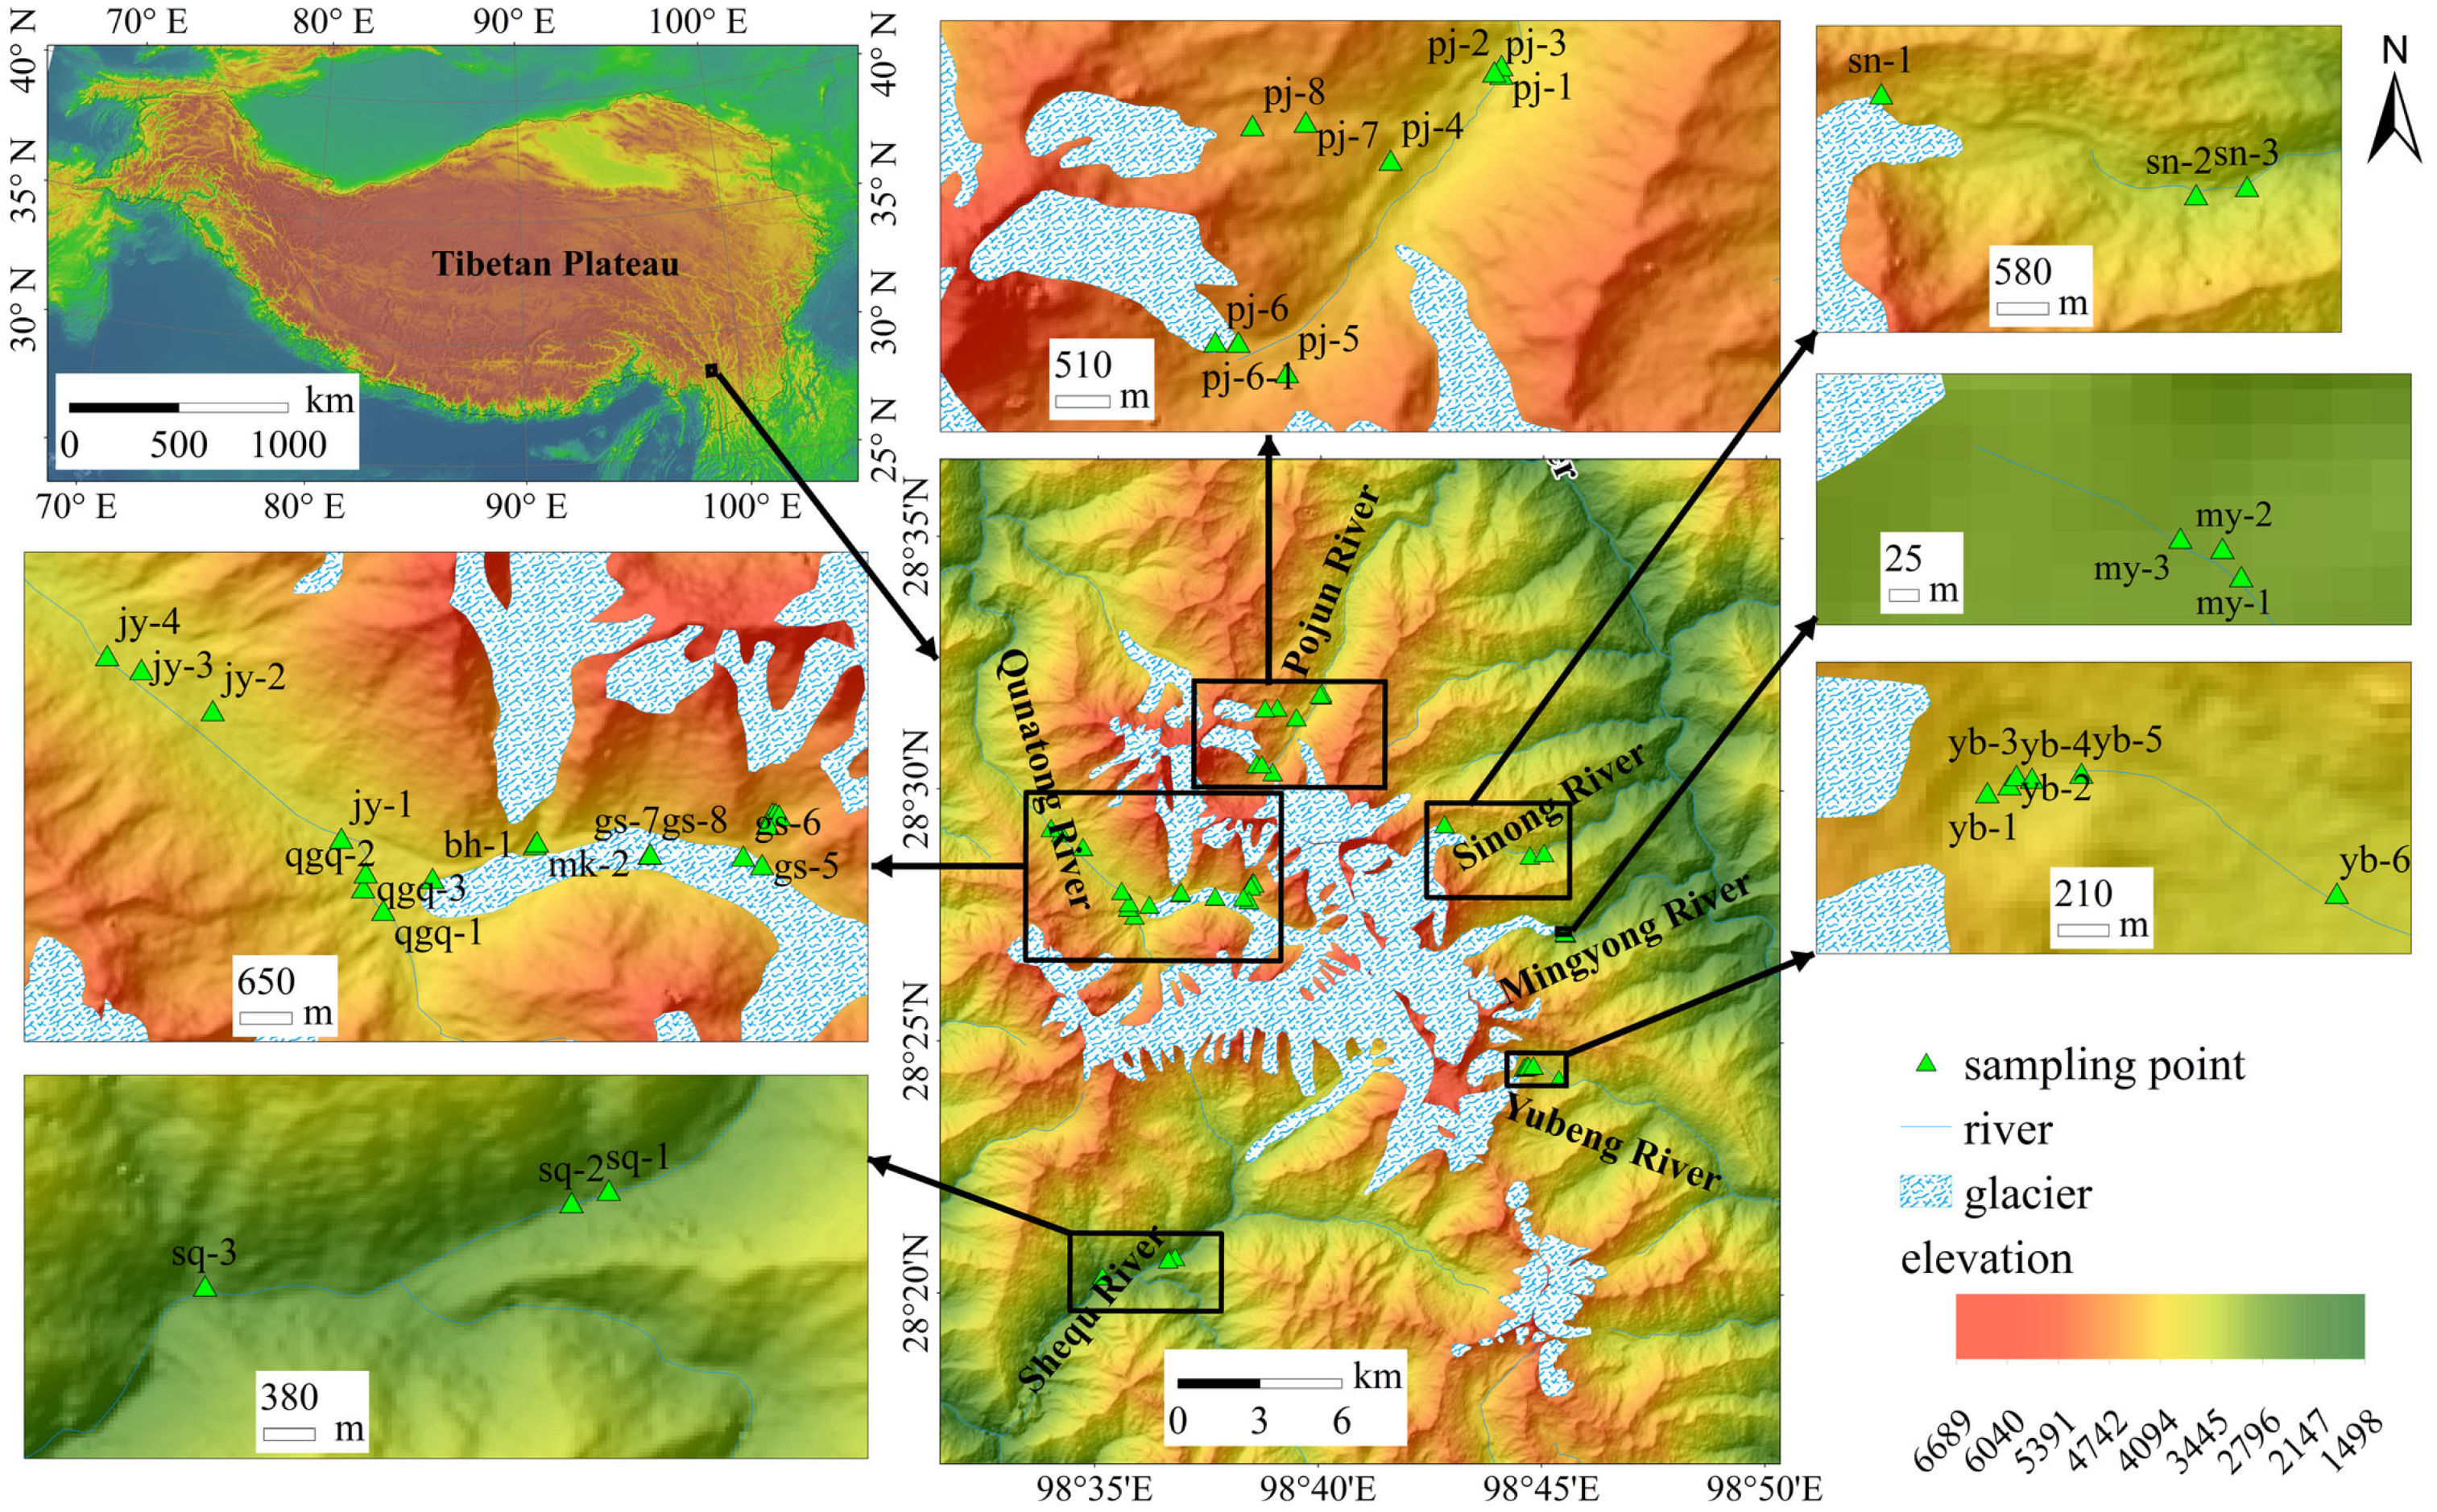
Figure 1. Map showing the sampling points and surrounding areas of the six river basins in the Meili Snow Mountains.
Toxics 14 00672 g001
Figure 2. HM concentration of different sampling points, and the mean concentrations of different river basins ((a,c): glacier meltwater; (b,d): river water. Data on the bars and error bars are derived from the mean values and standard deviations of each basin).
Toxics 14 00672 g002
Figure 3. The mean concentration of HMs in water bodies of each river basin.
Toxics 14 00672 g003
Figure 5. Aerosol Optical Thickness (AOT) from VIIRS/NOAA-20 during July 2022–June 2023 (https://ladsweb.modaps.eosdis.nasa.gov/ (accessed on 8 January 2026)).
Toxics 14 00672 g005
Figure 6. A cluster analysis of the 5-day backward trajectories of air masses in the Meili Snow Mountains from July 2022 to June 2023. The colored lines present different clusters.
Toxics 14 00672 g006
Figure 7. Mean RI (a) and ERI (b) values of HMs across different river basin.
Toxics 14 00672 g007
Figure 8. CR assessment of As, Cr, Ni and Cd for children and adults via ingestion and dermal exposure in different river basins.
Toxics 14 00672 g008
Figure 9. Sensitivity plot illustrating the effect of each input variable on non-carcinogenic risk for adults (HIa) and children (HIc), and total carcinogenic risk for adults (ILCRa) and children (ILCRc).
Toxics 14 00672 g009
Figure 10. Cumulative distribution functions (CDFs) with confidence bands for the simulated risk metrics, illustrating model output distributions and uncertainty across Monte Carlo simulations.
Toxics 14 00672 g010
Table 1. Summary statistics of trace element concentrations in glacial and river waters of the Tibetan Plateau.
ElementGlacier MeltwaterRiver Water
MeanMaxMinSDCV(%)MeanMaxMinSDCV(%)
V0.02200.08200.006000.017760.03900.06900.01600.02051
Cr0.07900.5660.01400.1061350.08000.1340.02400.03239
Mn1.9633.40.05206.4793310.1780.2820.07300.07341
Co0.03700.4460.003000.0902440.009000.01200.005000.00331
Ni0.3332.330.06800.5311600.1750.3130.1080.05934
Cu0.2411.430.03900.3101280.1610.3470.07300.07648
Zn1.324.160.2290.941720.9232.850.3160.72278
As0.2281.080.03800.2311010.2890.8810.09200.24786
Cd0.01300.03100.006000.005410.01200.01500.009000.00219
Table 2. Variable rotated component matrix for HMs in glacier meltwater and river water.
ElementPC1PC2PC3
V−0.164−0.0680.866
Cr−0.0480.1240.883
Mn0.964−0.023−0.097
Co0.9670.021−0.114
Ni0.9510.111−0.125
Cu0.0220.7930.046
Zn−0.0400.851−0.042
As−0.189−0.486−0.043
Cd0.9030.216−0.022
Eigenvalue3.8311.6901.373
Variance (%)42.5718.7715.26
Cumulative variance (%)42.5761.3476.60
Table 3. NCR of HMs in surface water samples from six river basins, evaluated using HQ and HI (×10−4).
QNTRSQRYBRMYRSNRPJR
AdultsChildrenAdultsChildrenAdultsChildrenAdultsChildrenAdultsChildrenAdultsChildren
HQingestion
V1.211.262.252.340.720.750.900.931.341.390.900.93
Cr9.399.7610.2510.662.082.162.953.0713.3013.837.337.63
Mn38.8540.411.942.023.113.232.092.186.987.262.122.20
Co46.8248.6911.1511.597.357.6533.3834.7218.6919.4315.9716.61
Ni5.926.152.292.383.263.394.374.545.395.612.032.11
Cu1.591.661.451.510.971.011.451.514.424.591.311.36
Zn1.321.381.011.050.961.000.580.601.761.841.171.21
As121.97126.85293.35305.08662.43688.93366.30380.95273.24284.17123.50128.44
Cd7.788.107.067.347.067.346.286.548.889.236.897.16
HQdermal
V0.631.301.182.420.380.780.470.960.701.440.470.96
Cr1.964.032.144.400.430.890.621.272.785.711.533.15
Mn5.0710.420.250.520.410.830.270.560.911.870.280.57
Co0.100.200.020.050.020.030.070.140.040.080.030.07
Ni0.150.320.060.120.090.170.110.230.140.290.050.11
Cu0.040.090.040.080.030.050.040.080.120.240.030.07
Zn0.020.040.020.030.010.030.010.020.030.060.020.04
As0.671.381.613.313.647.482.014.141.503.080.681.39
Cd0.811.670.741.510.741.510.661.350.931.900.721.48
HI
V1.842.563.434.761.101.531.371.902.042.831.361.89
Cr11.3513.7912.3815.052.53.053.574.3416.0819.548.8710.77
Mn43.9250.832.192.543.514.072.372.747.899.132.402.77
Co46.9148.8911.1711.647.377.6833.4534.8618.7219.5116.0016.67
Ni6.076.472.352.513.353.574.484.785.545.902.082.22
Cu1.641.741.491.590.991.061.491.584.534.831.341.43
Zn1.341.421.021.080.971.030.590.621.791.891.181.25
As122.64128.23294.96308.39666.07696.41368.31385.09274.74 287.26124.18129.84
Cd8.609.777.808.867.808.866.947.889.8011.137.618.64
Disclaimer/Publisher’s Note: The statements, opinions and data contained in all publications are solely those of the individual author(s) and contributor(s) and not of MDPI and/or the editor(s). MDPI and/or the editor(s) disclaim responsibility for any injury to people or property resulting from any ideas, methods, instructions or products referred to in the content.