Article

Age-Specific Radiological Risk of 222Rn in Drinking Water Wells Along the Sultandağı Fault Zone (Türkiye): A One-Year Monitoring Study

by
Ayla Sandıkcıoğlu Gümüş
Department of Physics, Faculty of Science and Literature, Afyon Kocatepe University, Afyonkarahisar 03200, Türkiye
Toxics 2026, 14(8), 670; https://doi.org/10.3390/toxics14080670
Submission received: 16 June 2026 / Revised: 20 July 2026 / Accepted: 26 July 2026 / Published: 29 July 2026

Highlights

What are the main findings?
  • ²²²Rn was monitored biweekly in 15 drinking-water wells over a one-year period.
  • ²²²Rn concentrations ranged from 0.05 to 26.64 Bq L−1; only one well exceeded the USEPA-recommended limit, whereas all remained below the WHO reference level.
  • Age-specific annual effective dose (AED) and excess lifetime cancer risk (ELCR) were highest for infants.
  • Groundwater ²²²Rn concentrations were significantly higher in spring than in autumn.
What are the implications of the main findings?
  • Long-term monitoring revealed seasonal variability in groundwater ²²²Rn concentrations.
  • The findings provide baseline data for radiological monitoring of drinking-water wells in tectonically active regions.

Abstract
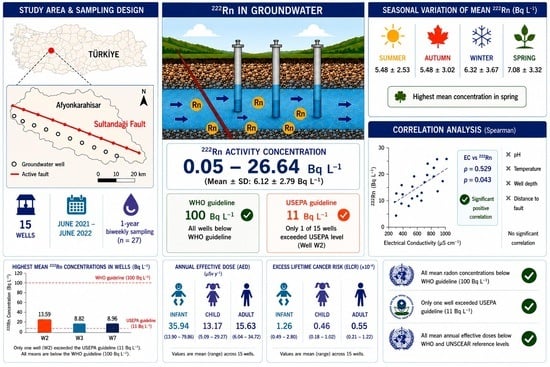
Background: Radon in drinking water is a potential source of ionizing radiation exposure, yet long-term monitoring data from active tectonic regions remain limited. This study investigated 222Rn activity concentrations in drinking-water wells along the Sultandağı Fault (Afyonkarahisar, Türkiye) and assessed age-dependent radiological risks. Methods: 222Rn concentrations were measured at two-week intervals in 15 drinking-water wells between June 2021 and June 2022 using a WG-1001 water–gas separation system and an AB-5R radiation monitor. Annual effective dose (AED) and excess lifetime cancer risk (ELCR) were calculated for infants, children, and adults. Results: 222Rn concentrations ranged from 0.05 to 26.64 Bq L−1, with a mean of 6.12 ± 2.79 Bq L−1. Only one well exceeded the USEPA guideline level (11.1 Bq L−1), whereas all measurements remained below the WHO reference level (100 Bq L−1). Seasonal mean concentrations varied between 5.48 ± 2.53 and 7.08 ± 3.32 Bq L−1. Mean AED values were 35.94, 13.17, and 15.63 μSv y−1 for infants, children, and adults, respectively. Corresponding ELCR values were 1.26 × 10⁻⁴, 0.46 × 10⁻⁴, and 0.55 × 10⁻⁴. Conclusions: The results indicate generally low radiological risk from radon in drinking water within the study area, although elevated values were observed in some wells. Higher age-specific dose and risk estimates were obtained for infants. These findings provide long-term data on groundwater 222Rn variability in an active fault zone and support regional radiological risk assessment.

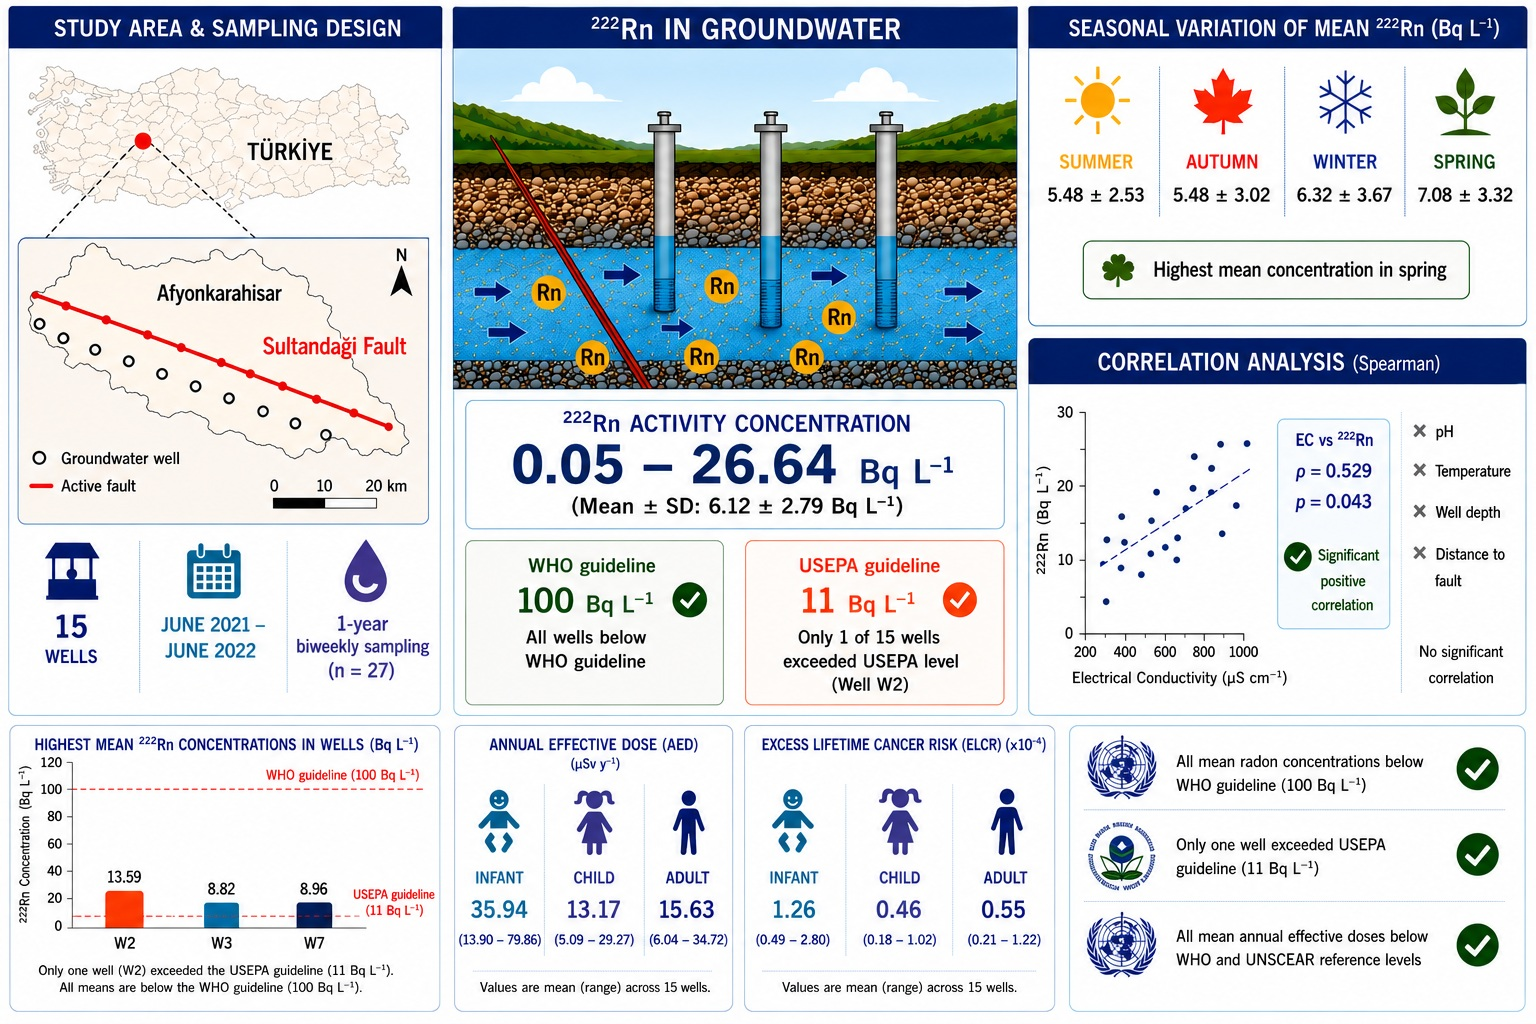
Graphical Abstract

1. Introduction

Humans have been exposed to natural radiation originating from long-lived radionuclides present in the Earth’s crust since the formation of the planet. Radiation emitted during the decay of these radionuclides constitutes a significant component of natural radiation exposure. A considerable fraction of natural radioactivity on Earth originates from 235U, 238U, 232Th, and 40K. The primary sources of uranium and thorium are rocks and soils that make up the Earth’s crust. These radionuclides and their decay products are distributed at varying concentrations in soil, water, air, rocks, building materials, food, and beverages. Radioactive elements present in rocks and soils continuously interact with water and may dissolve and migrate into aquatic environments, thereby contributing to natural radioactivity levels. Consequently, groundwater is generally expected to contain higher levels of radioactivity than surface water. The Earth’s crust generally contains uranium at concentrations ranging from 0.5 to 5 ppm, corresponding to specific activity concentrations of approximately 6.3–62.5 Bq kg−1 [1].
Radon, an important component of natural radioactivity, is produced through the alpha decay of 226Ra within the 238U decay series. With a half-life of 3.82 days, radon (222Rn) is a radioactive noble gas that plays a significant role in various geophysical and environmental processes. Naturally occurring radon isotopes also include 220Rn and 219Rn, which belong to the 232Th and 235U decay series, respectively. However, due to their relatively short half-lives and limited environmental significance, 222Rn is considered the principal contributor to environmental radon exposure.
Radon is a colorless, odorless, and chemically inert gas and is the 86th element of the periodic table. It can migrate through pore spaces and fracture networks in rocks and soils and subsequently enter the atmosphere and groundwater systems. For this reason, the distribution of radon in soil gas and groundwater has been extensively investigated [2]. The environmental behavior of radon is strongly influenced by geological, hydrogeological, and tectonic conditions. Radon generated within rocks and soils can be transported through pores, fractures, and fault-related discontinuities, facilitating its release into surrounding environments [1,2,3]. Active fault zones, in particular, act as natural conduits for the upward migration of deep crustal gases. Consequently, radon distribution is closely associated with tectonic structures, lithological characteristics, and hydrogeological conditions. Fracture systems developed along active faults may enhance radon transport into groundwater systems, thereby influencing groundwater radon concentrations [1,2]. Because the recoil distance of radon atoms is limited, only those generated near mineral surfaces can enter water, making groundwater radon concentrations highly dependent on local geological conditions [4]. Accordingly, elevated radon concentrations have frequently been reported in water resources located within tectonically active regions [5,6,7,8,9]. Fault zones facilitate radon migration by providing preferential pathways for subsurface fluid circulation [6], resulting in radon concentrations that are often higher than regional background levels [10].
Environmental radon exposure accounts for a substantial fraction of the natural radiation dose received by humans [1,3]. Radon progeny, particularly 218Po and 214Po, are alpha-emitting radionuclides that contribute significantly to internal radiation doses following inhalation [1]. Inhaled radon and its decay products may accumulate in lung tissue, delivering ionizing radiation and increasing the risk of lung cancer following prolonged exposure [3,11,12]. Furthermore, radon progeny can attach to airborne particles, enhancing their deposition within the respiratory tract [2,13]. Drinking water represents another important pathway of radon exposure. Radon dissolved in groundwater may enter the human body through ingestion, while radon released from water during domestic use may also contribute to inhalation exposure [3,14]. Therefore, radon exposure may occur through both inhalation and ingestion pathways, constituting a significant public health concern.
Epidemiological studies have consistently identified smoking as the leading cause of lung cancer, with radon recognized as the second most important environmental risk factor. The World Health Organization (WHO) classifies radon as a human carcinogen and identifies it as the second leading cause of lung cancer after smoking [1,3]. Depending on national smoking prevalence and average indoor radon levels, approximately 3–14% of all lung cancer cases are estimated to be attributable to radon exposure [3]. Moreover, increases in long-term average radon concentrations have been associated with elevated lung cancer risk, with studies reporting an approximately 10–16% increase in risk for every 100 Bq m−3 increase in radon concentration [3,15].
Radon studies have been extensively conducted worldwide across various environmental media. Researchers have investigated radon concentrations in soils [16,17], atmospheric air [18,19], residential environments [20,21], workplaces and schools [22,23], groundwater [24,25,26], well waters [27,28], spa waters [29,30], thermal waters [31,32], and spring waters [33,34]. These investigations continue to provide valuable information on the spatial and temporal variability of radon in different environmental systems. Previous studies indicate that radon distribution may be influenced by geological, hydrogeological, and tectonic characteristics. In particular, variations in radon concentrations have been reported in areas located on or near fault zones, where geological and hydrogeological conditions may contribute to differences in radon occurrence [5,10,35,36,37,38,39,40,41].
Groundwater resources provide a substantial proportion of drinking water supplies, particularly in rural and semi-rural regions. Radon present in these resources may pose a potential public health concern due to exposure through drinking water consumption. Therefore, several international organizations have established guideline and reference values for radon concentrations in drinking water. The United States Environmental Protection Agency (USEPA) has proposed a maximum contaminant level goal of 11.1 Bq L−1 for radon in drinking water [42], whereas the World Health Organization (WHO) has established a reference level of 100 Bq L−1 for radon concentrations in drinking water [43]. These values highlight the importance of regular monitoring and assessment of radon levels in drinking water sources. In drinking-water radon studies, measured concentrations are generally compared with guideline and reference values recommended by international organizations to evaluate potential health risks. However, a considerable proportion of groundwater radon studies are based on single-time sampling, which may not adequately represent the temporal variability of radon concentrations.
Türkiye is located in an actively deforming tectonic region due to the interaction between the Eurasian, African, and Arabian plates and contains numerous active fault systems [44,45]. In particular, the extensional tectonic regime of Western Anatolia has resulted in the development of extensive fault and fracture systems [46,47]. These structures may contribute to hydrogeological processes affecting groundwater circulation and represent one of the factors that may influence radon distribution in groundwater systems.
The study area is located within the Akşehir–Simav Fault System (ASFS), an active tectonic zone associated with the 2002 Afyon earthquake (Mw 6.2). In this context, the present study aimed to determine 222Rn concentrations in well waters used for drinking purposes in Çay district and surrounding villages of Afyonkarahisar, situated within the broader tectonic setting of the Akşehir–Simav Fault System (ASFS), and to assess the potential radiological health risks associated with the ingestion of drinking water from the investigated wells. Annual effective dose (AED) and excess lifetime cancer risk (ELCR) were calculated for different age groups. Measurements were performed at two-week intervals over one year, allowing more representative annual mean 222Rn concentrations and exposure estimates to be obtained compared with single-time sampling approaches. Additionally, seasonal variations in 222Rn concentrations were evaluated.

2. Materials and Methods

2.1. Geology of the Study Area

The study area is located within the Akşehir–Simav Fault System (ASFS) and encompasses the town of Çay and its surrounding settlements in Afyonkarahisar Province, western Türkiye. Situated in Central-Western Anatolia, the region lies within Turkey’s first- and second-degree seismic hazard zones, indicating significant tectonic activity and a high earthquake potential. Afyonkarahisar is located in the central sector of the ASFS, one of the principal structural elements defining the extensional neotectonic regime of southwestern Türkiye [48]. Extending from Karaman to Sındırgı (Balıkesir), the fault system is a NE–SW-trending discontinuous oblique-slip normal fault zone approximately 500 km long and 10–30 km wide.
Numerous earthquakes have occurred along the active ASFS, particularly on the Akşehir and Simav segments. Since 1921, many earthquakes with moment magnitudes (Mw) greater than 4.5 have been recorded, and the system is considered capable of generating earthquakes of up to Mw 7.0. Among these events, the Mw 6.2 earthquake that occurred between Çay and Sultandağı on 3 February 2002 is particularly notable due to the surface ruptures and structural damage it produced. The tectonic deformation observed along the ASFS is consistent with the extensional tectonic regime and associated normal faulting that characterize western Anatolia [44]. Post-earthquake geological and geophysical investigations revealed the activation of previously unmapped or buried secondary fault segments, indicating that the rupture propagated through a complex and distributed fault network. These findings suggest that the 2002 Sultandağı earthquakes were not confined to the previously recognized principal fault segments but also involved structurally significant secondary fault zones within the region [49]. This evidence highlights the complex deformation pattern of the area and emphasizes the importance of detailed fault mapping and reassessment of regional seismic hazards [49].
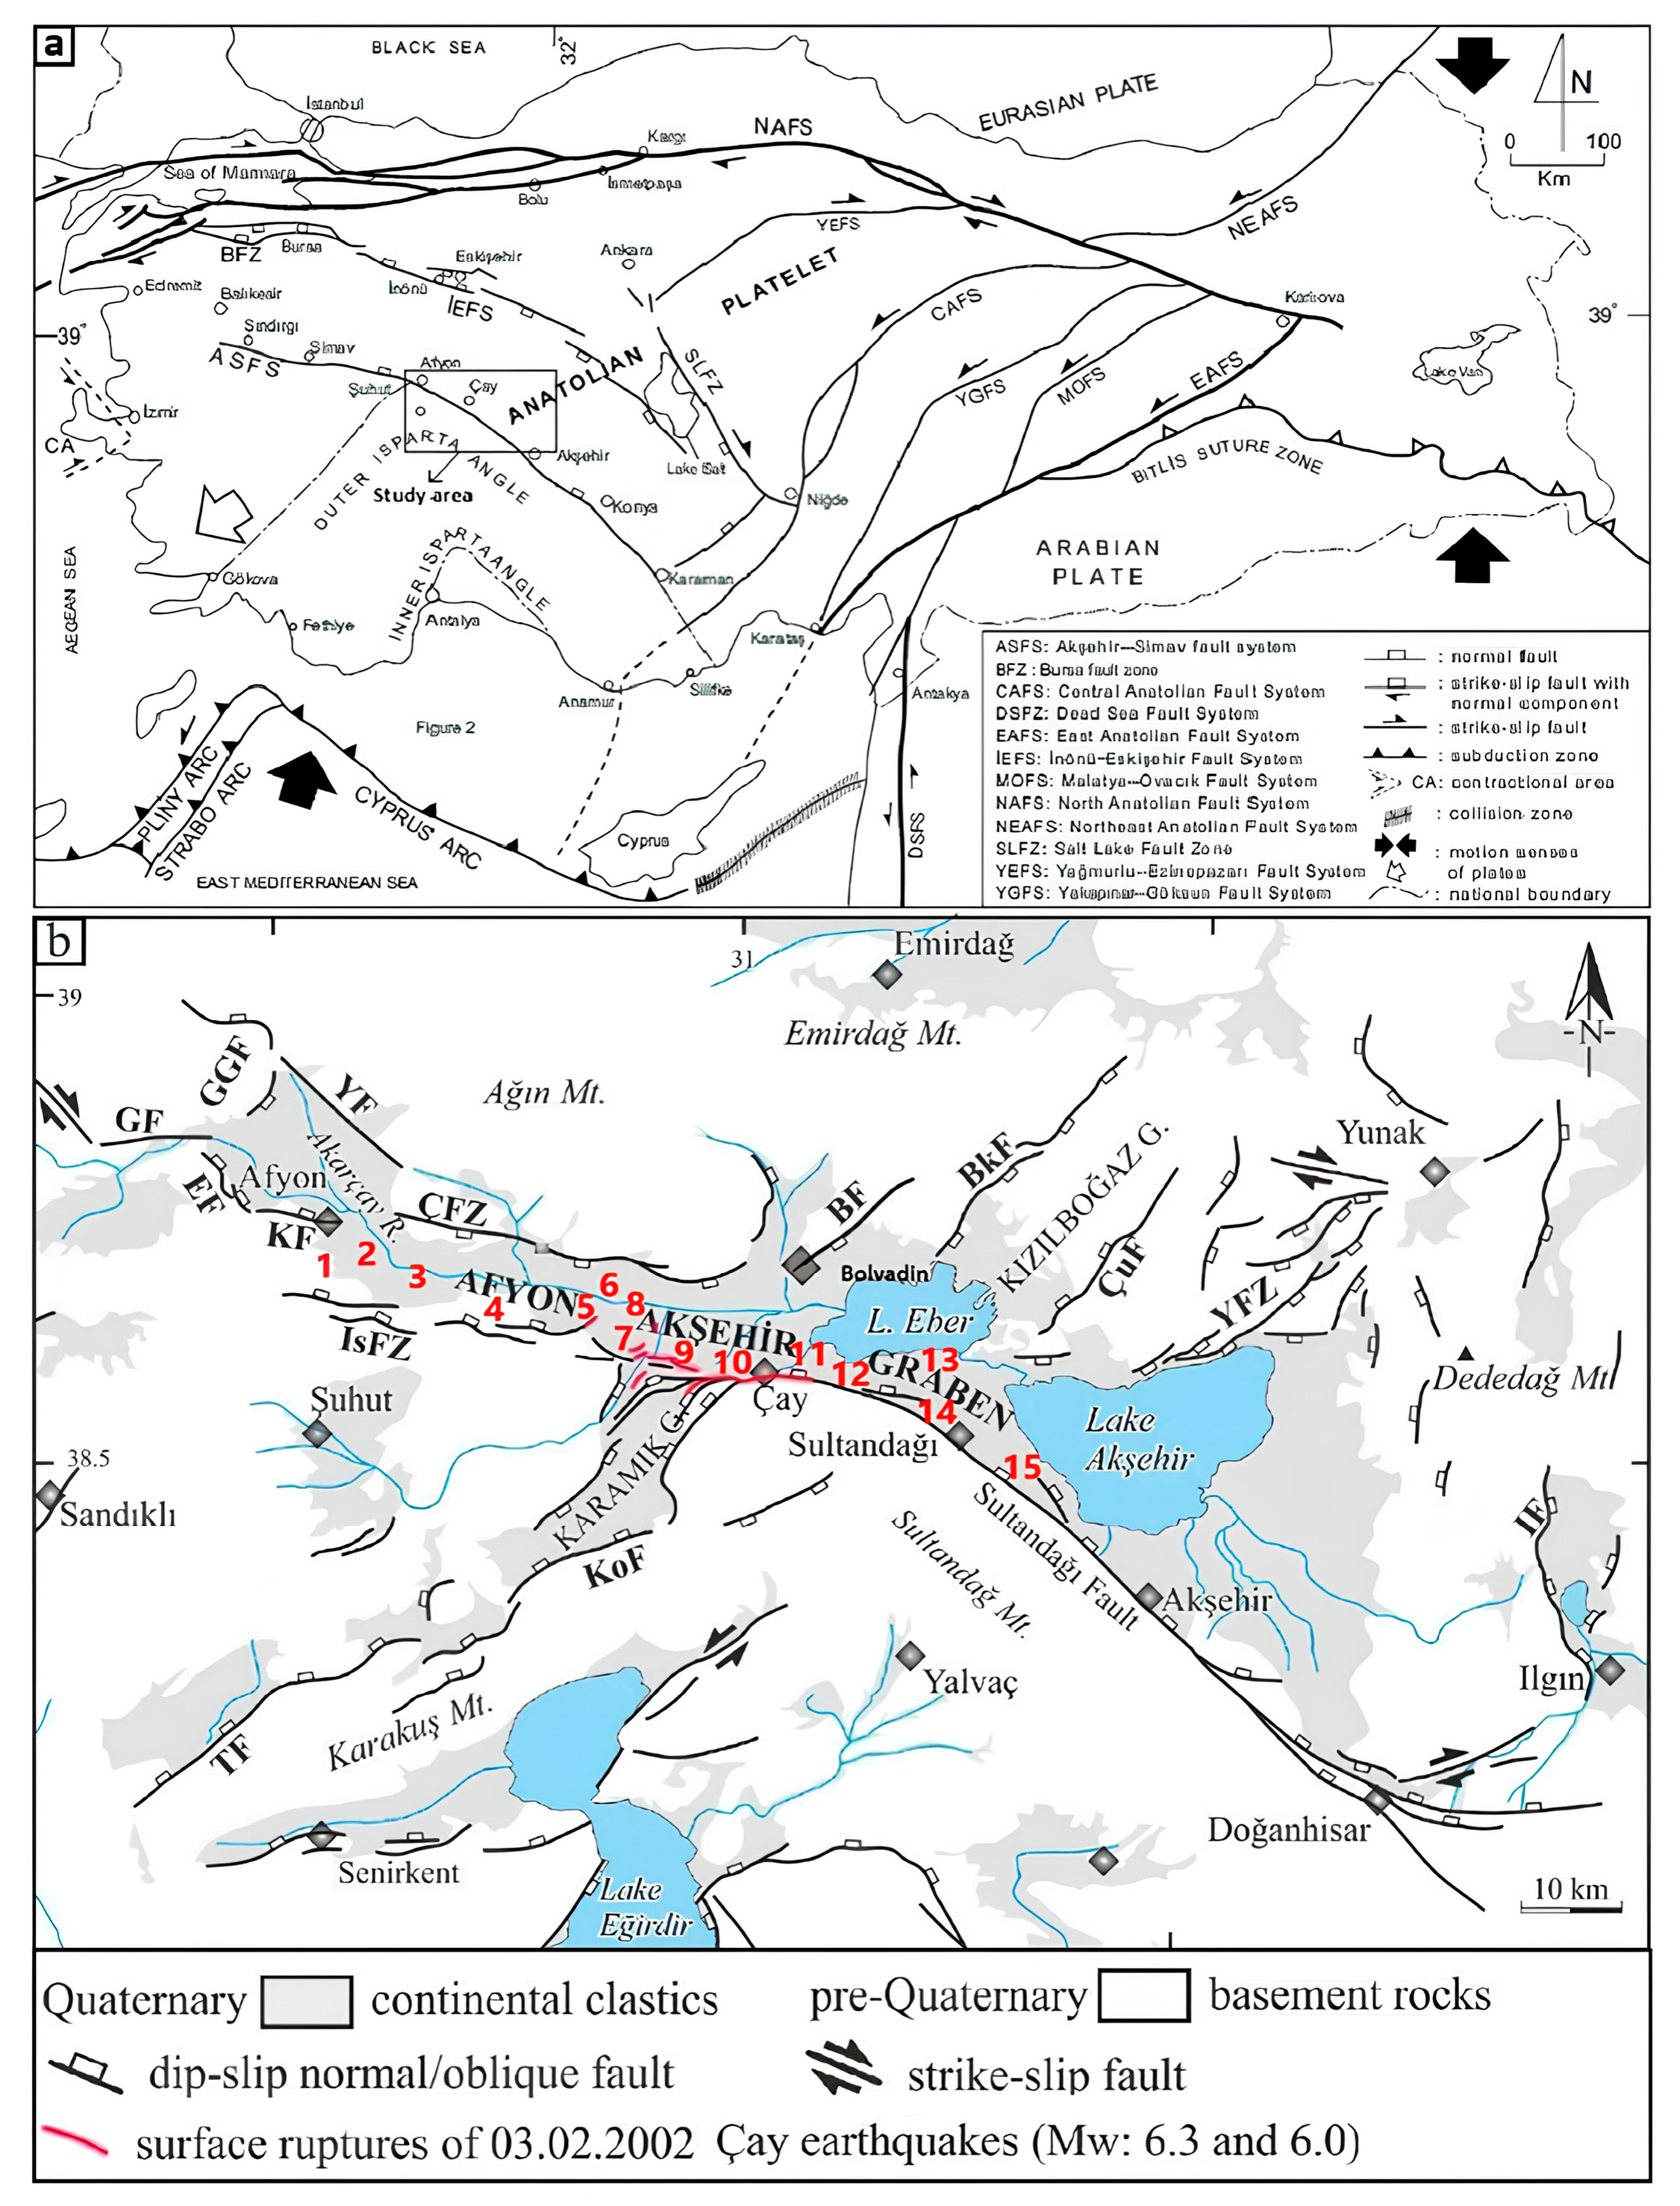
The Akşehir–Simav Fault System comprises numerous active fault segments developed under the influence of the regional extensional tectonic regime. The Sultandağı Fault, located in the southwestern part of the system, constitutes one of the major segments of the ASFS. In addition to controlling the morphotectonic evolution of the region, this structural framework may also influence groundwater circulation and hydrogeological processes. Accordingly, while the regional tectonic setting is discussed within the context of the ASFS, radon measurements were conducted along the Sultandağı Fault. Sampling locations were selected from drinking water wells situated in areas affected by the Sultandağı Fault and associated structural features. The spatial distribution of the sampled wells relative to the Akşehir–Simav Fault System and the Sultandağı Fault is presented in Figure 1.
All investigated groundwater wells are located within Quaternary alluvial deposits of the Afyon–Akşehir Graben. All groundwater samples analyzed in this study were collected from wells located within the same surficial geological unit [50,51].

2.2. Sampling and Measurements

2.2.1. Concentration of Radon in Groundwater

Fifteen deep groundwater wells located on or in close proximity to the Sultandağı Fault and used for drinking water supply were selected for this study. Sampling locations were chosen based on their proximity to the Sultandağı Fault and their active use by local residents. In the rural settlements within the study area, groundwater from these wells constitutes an important source of drinking water and is consumed daily by a portion of the local population. Therefore, determining radon levels in these water resources is important from a public health perspective. The groundwater from these wells is consumed directly after extraction without intermediate storage, aeration, treatment, blending, or distribution processes. Therefore, the measured 222Rn concentrations were considered representative of the water consumed by the local population. The hydrogeological and physicochemical characteristics of the sampled wells, including well depth, pH, electrical conductivity (EC), and water temperature, are presented in Table 1.
Water samples were collected from the drinking water wells between 19 June 2021 and 14 June 2022 over a 12-month period at approximately two-week (15-day) intervals, and radon concentrations were subsequently determined. For the evaluation of seasonal variation, the measurements were grouped into four meteorological seasons: summer (June–August 2021), autumn (September–November 2021), winter (December 2021–February 2022), and spring (March–May 2022). Seasonal mean 222Rn concentrations were calculated for each season. No scheduled sampling campaigns were missed during the monitoring period; therefore, the dataset contained no missing data for the seasonal analysis. Samples were collected directly from the discharge outlet of the operating well pumps into 250 mL borosilicate glass bottles equipped with specially designed airtight caps to prevent gas leakage. Prior to sampling, each well was purged for approximately 5 min to ensure the collection of representative groundwater samples. The bottles were carefully filled to overflowing in order to avoid headspace formation, and the caps were immediately sealed while maintaining continuous overflow to minimize radon loss. All collected samples were transported immediately to the Nuclear Physics Laboratory of Afyon Kocatepe University, where radon analyses were performed on the same day as sample collection.
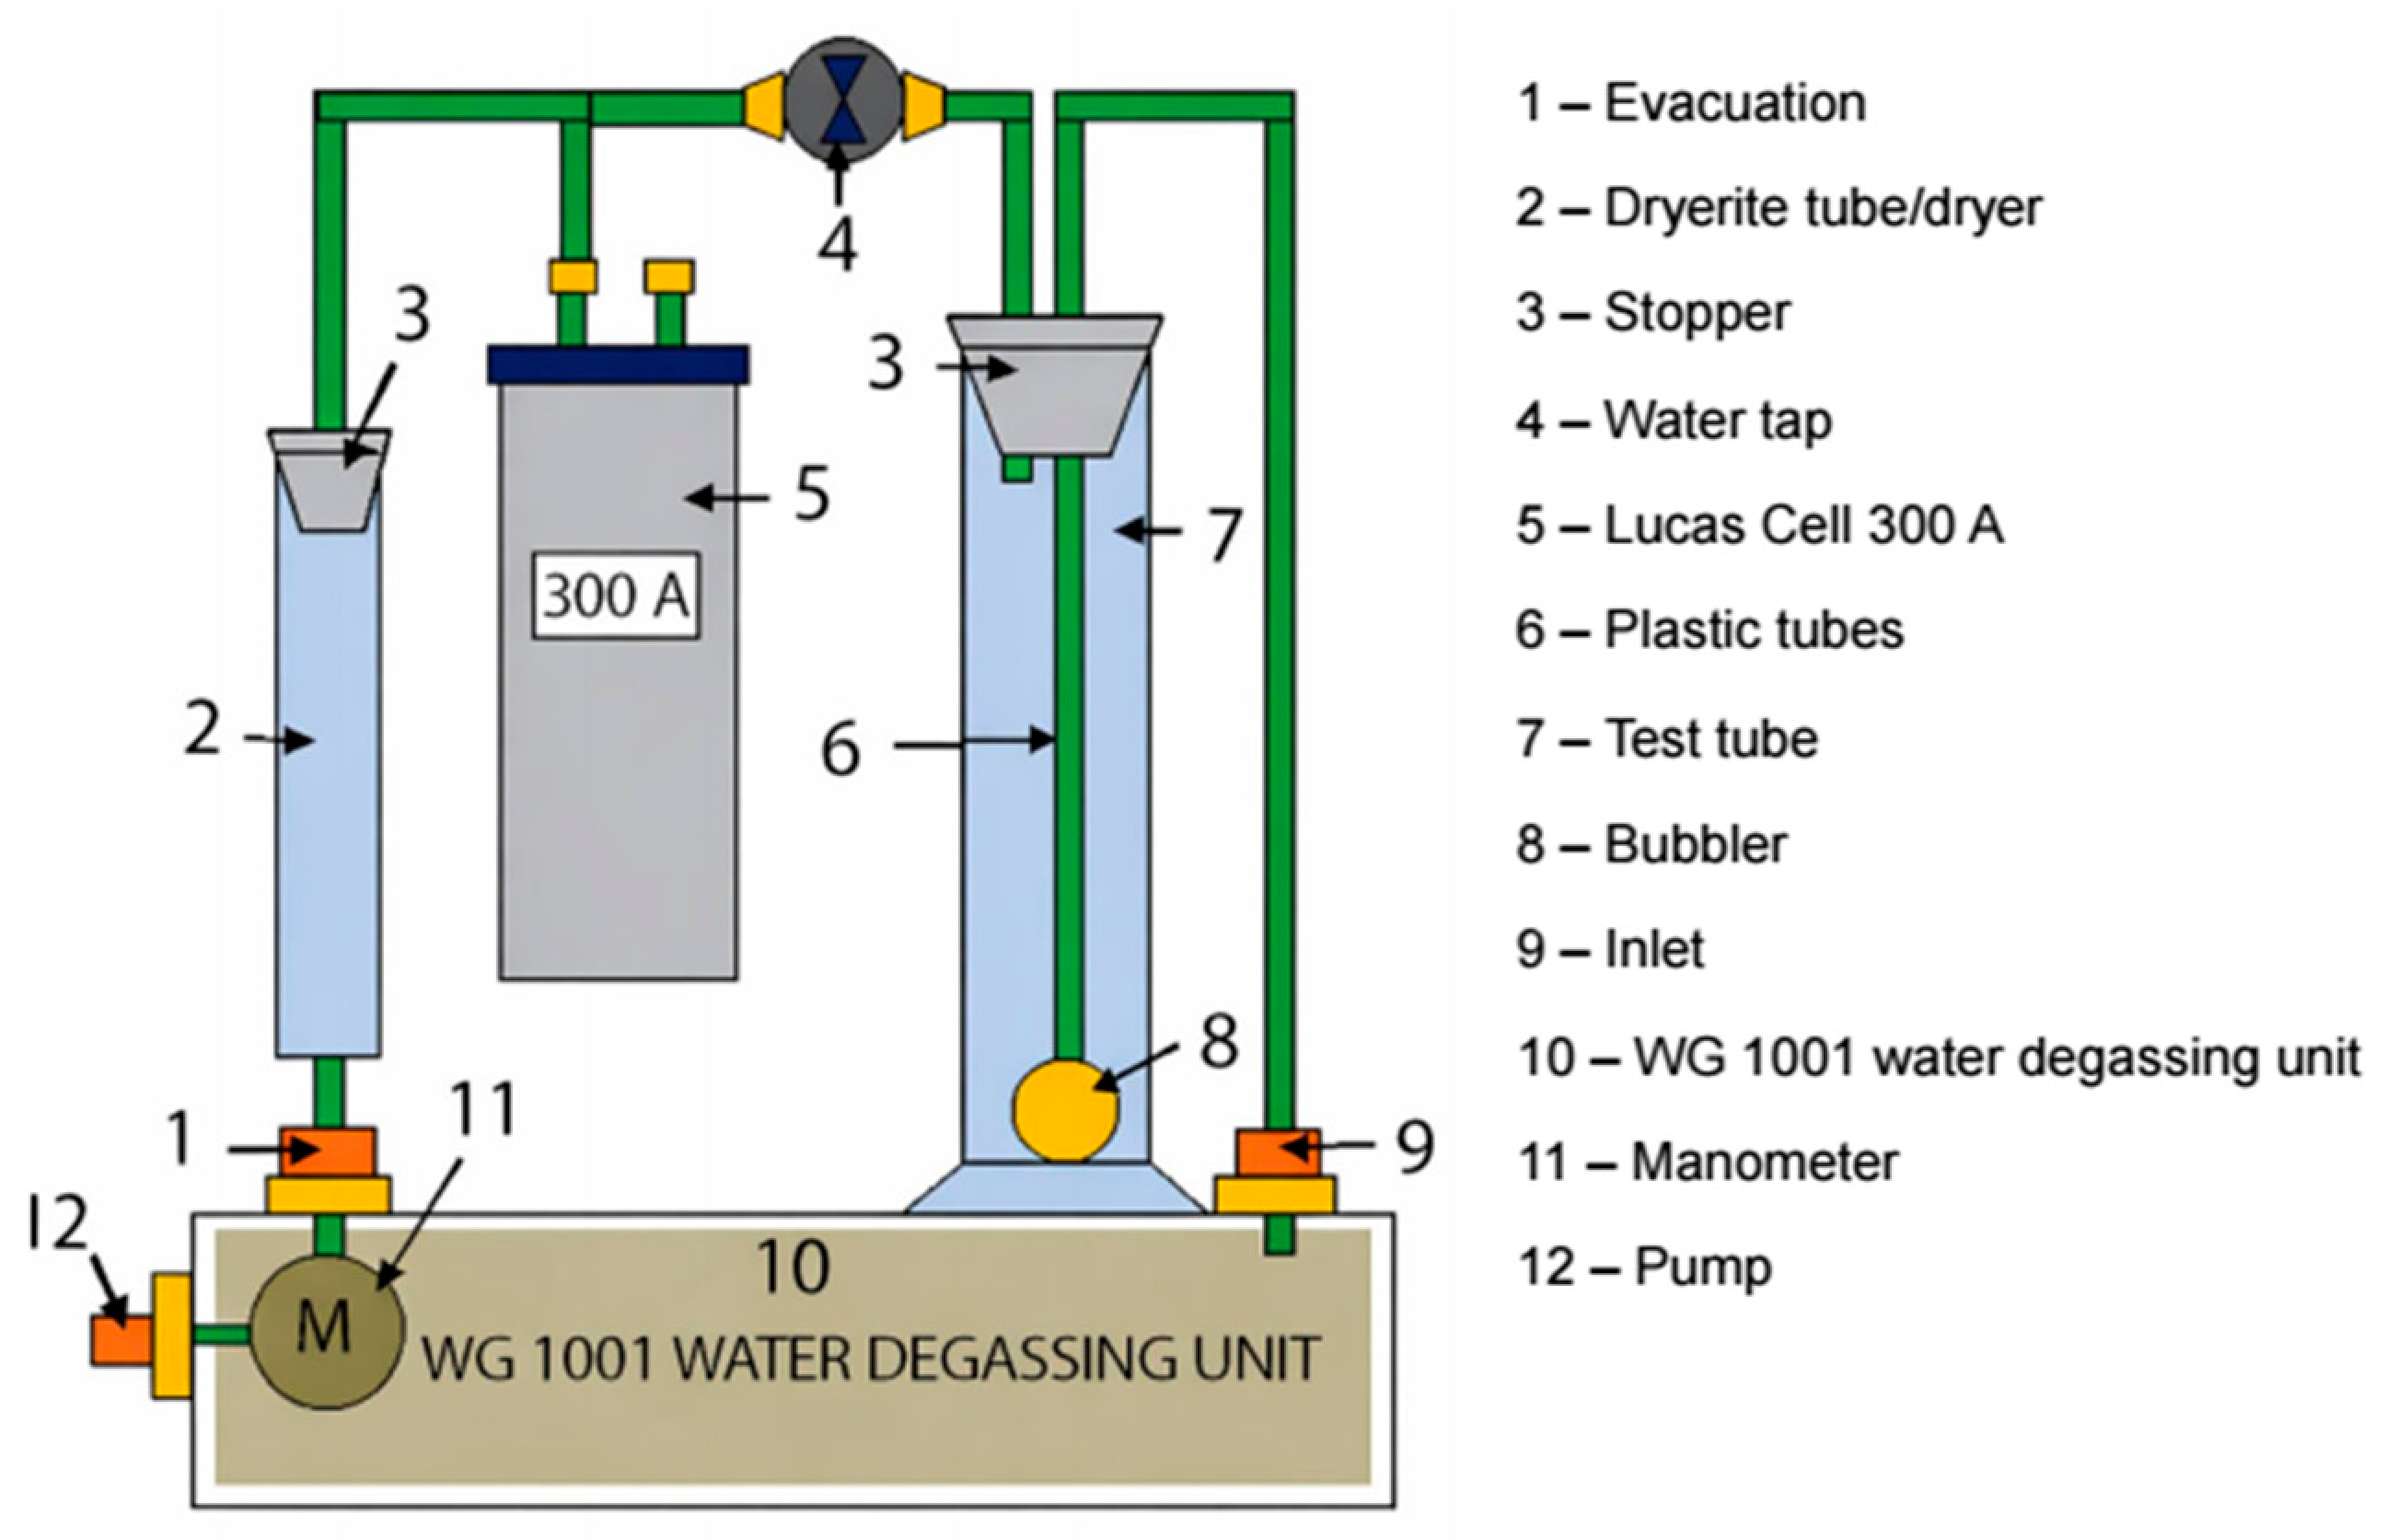
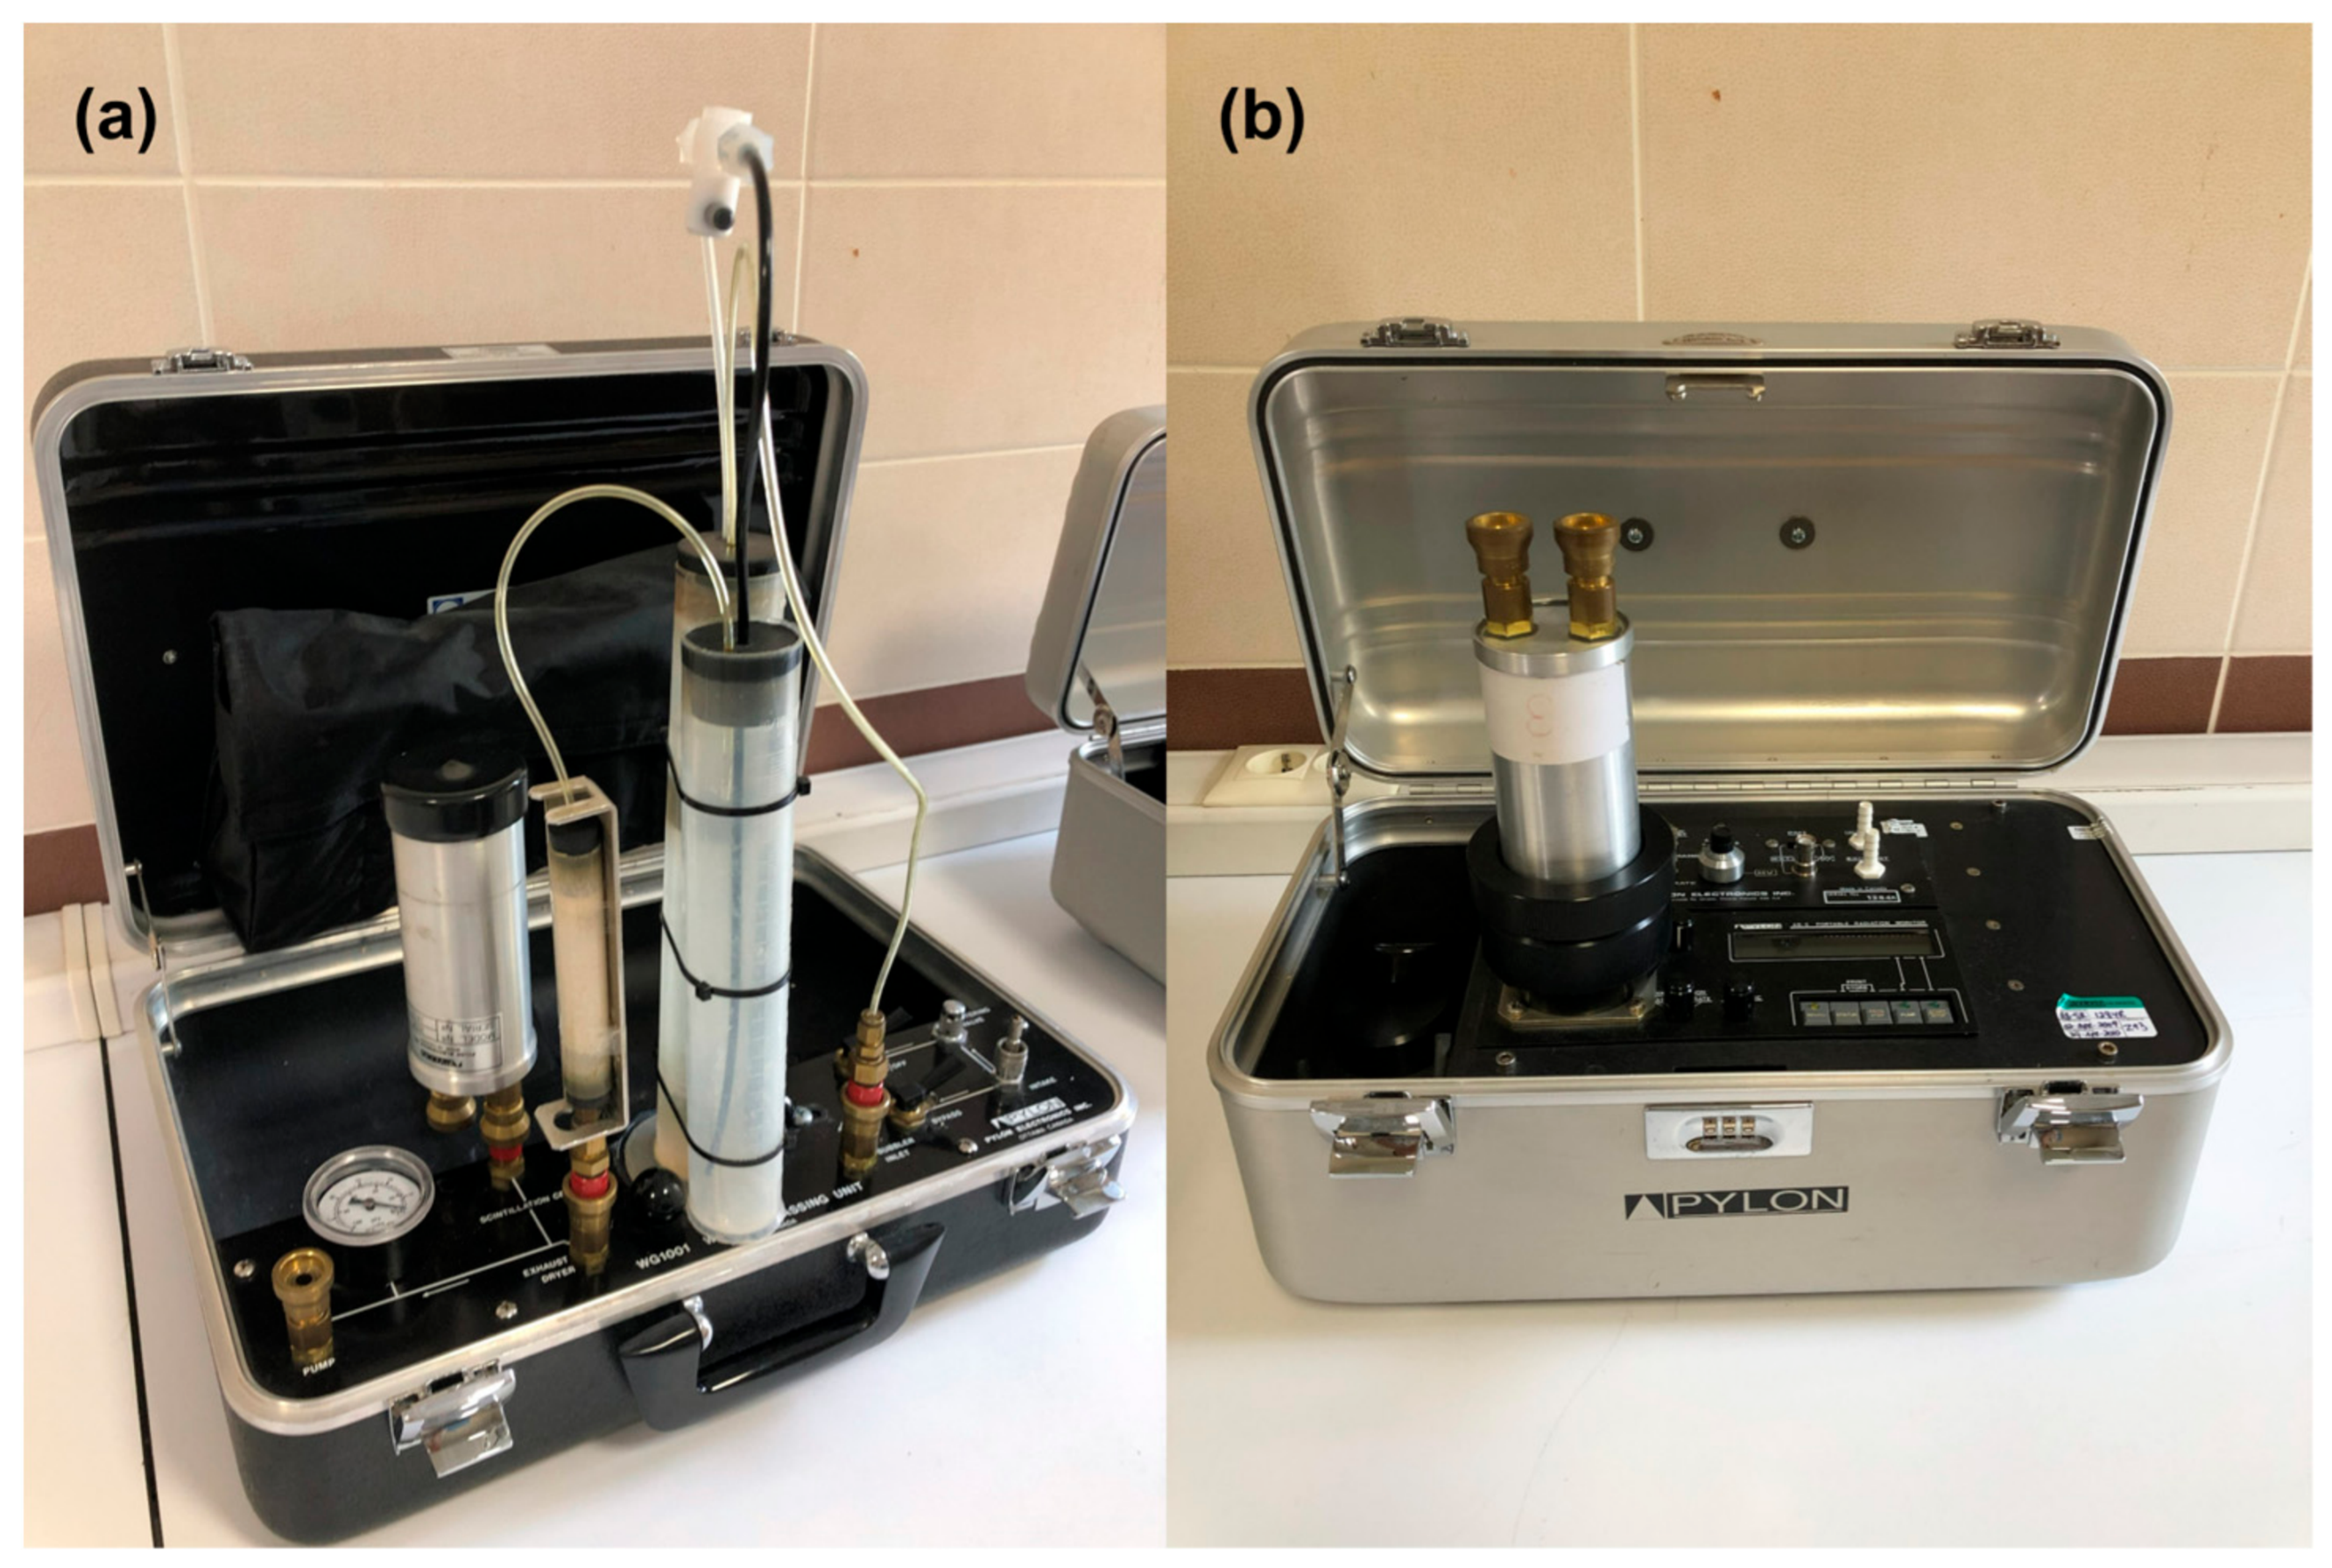
Radon concentrations in groundwater samples were measured using a WG-1001 vacuum water–gas separation system and an AB-5R radiation monitor manufactured by Pylon Electronics (Pylon Electronic Development Company Ltd., Ottawa, ON, Canada). The AB-5R is a portable radon monitor characterized by high sensitivity and a low background count rate. In this method, radon gas extracted from water by the WG-1001 unit was quantified by counting alpha decays originating from radon and its short-lived progeny using the photomultiplier tube integrated within the Pylon AB-5R portable radon monitor (Pylon Electronic Development Company Ltd., Ottawa, ON, Canada) [52]. Radon measurements were performed using the Lucas scintillation cell technique, which is based on transferring the extracted gas into an evacuated and isolated scintillation chamber for alpha counting. A schematic diagram of the WG-1001 water–gas separation unit and the Lucas scintillation cell-based measurement system is shown in Figure 2. Photographs of the WG-1001 vacuum water–gas separation system and the AB-5R radiation monitor used in this study are presented in Figure 3.
Radon measurements were performed using a leak-tight Pylon LC-300A Lucas-type scintillation cell (Pylon Electronic Development Company Ltd., Ottawa, ON, Canada) internally coated with silver-activated zinc sulfide [ZnS(Ag)]. Following the decay of residual scintillation signals on the ZnS(Ag)-coated surface, the cell was analyzed over three consecutive 5 min counting intervals. The background radiation of each scintillation cell was determined prior to sample analysis by averaging six separate 5 min background measurements (total counting time of 30 min). The resulting values were converted to counts per minute (cpm) and used to determine the background count rate (B) applied in subsequent calculations. A 190 mL water sample was transferred to the degassing vessel connected to the WG-1001 unit. The radon-containing water sample was circulated using the integrated vacuum pump, while the system pressure was continuously monitored with a manometer to ensure appropriate degassing conditions. The system was evacuated to a minimum pressure of 584 mmHg, corresponding to the barometric pressure at an elevation of approximately 1000 m in Afyonkarahisar [52]. Operation under reduced pressure facilitates the transfer of dissolved radon from the aqueous phase to the gas phase, allowing the released radon gas to be drawn into the measurement system through a vacuum line.
To prevent interference during detection and remove moisture, the extracted radon gas was passed through a drying tube filled with desiccant (Drierite). The dried gas was subsequently directed through a bubbler to ensure complete moisture removal before entering the detection chamber. Finally, the gas was transferred into the 300A Lucas scintillation cell. When radon and its short-lived decay products (e.g., 218Po) undergo alpha decay, the emitted alpha particles interact with the ZnS(Ag) coating, producing scintillation events. These light pulses are amplified by a photomultiplier tube (PMT), converted into electrical signals, and recorded by the detector system. After the gas extraction process, the Lucas scintillation cell filled with radon gas was stored for 3.5 h to allow radioactive equilibrium to be established between radon and its short-lived progeny. Once equilibrium had been reached, the scintillation cell was placed in the radiation monitor and counted. Six consecutive 5 min counting intervals were performed, yielding a total counting period of 30 min. The mean gross count rate (C) obtained from these six counting intervals was used to calculate the 222Rn concentration according to Equation (1), following the manufacturer’s recommended operating procedure. Following the analysis of each water sample, the Lucas scintillation cell was purged according to the manufacturer’s recommended operating procedure to remove residual radon from the previous sample. This cleaning procedure required approximately 20 min and involved repeated evacuation of the cell to approximately 22 inches Hg two to three times, thereby minimizing the influence of residual radon from the previous sample and establishing background conditions [52].
Measured count values were converted to counts per minute (cpm) and defined as the gross count rate (C), while the counting time ( T C ) was recorded. The elapsed time between sample collection ( T s ) and counting ( T C ) was also recorded for each sample, and radioactive decay during this interval was corrected using the sample-specific decay correction factor (S) included in Equation (1). Radon concentrations in the water samples were calculated using the equation provided by the manufacturer [52]:
A = C B × k 6.66 × F × D × S × V
where:
  • A is the radon concentration (Bq L−1);
  • C is the gross count rate (counts per minute, cpm);
  • B is the background count rate (cpm);
  • F is the counting efficiency of the Lucas cell (0.745 in this study);
  • D is the gas extraction efficiency of the Pylon 300A Lucas cell (0.90);
  • S is the sample-specific decay correction factor selected from the decay correction table provided in the manufacturer’s operating manual according to the elapsed time between the sampling time ( T s ) and counting time ( T C );
  • V is the sample volume (0.19 L);
  • k is the conversion factor from pCi to Bq (1 pCi = 0.037 Bq);
  • 6.66 is the calibration constant representing the theoretical number of alpha decays per minute produced by 1 pCi of 222Rn in equilibrium with its short-lived decay products.
The mean and standard deviation (SD) of 222Rn activity concentrations for each well were calculated using data obtained from 27 consecutive measurements conducted throughout the monitoring period. Results are presented as mean ± SD, and minimum and maximum values were additionally reported to characterize the variability of radon concentrations.

2.2.2. Health Risk Assessment

Annual Effective Dose from Ingestion of 222Rn in Drinking Water
The annual effective dose due to ingestion of 222Rn (AED) was calculated for infants, children, and adults using Equation (2) based on the parameters recommended by [1]:
AED ing = C w × W L × DCF × T
where AEDing is the annual effective dose due to radon ingestion from drinking water (Sv y−1); Cw is the activity concentration of 222Rn in water (Bq L−1); DCF is the ingestion dose conversion factor for radon [3.5 nSv Bq−1 for adults, 5.9 nSv Bq−1 for children, and 23 nSv Bq−1 for infants], corresponding to the age groups > 17 years (adults), 7–12 years (children), and 1–2 years (infants), respectively [1]; WL is the daily water consumption rate [0.75, 1.0, and 2.0 L day−1 for infants, children, and adults, respectively]; and T is the water consumption period (365 days) [54].
Excess Lifetime Cancer Risk (ELCR)
Excess lifetime cancer risk (ELCR) is an indicator of the probability of developing cancer over an individual’s lifetime. The potential lifetime cancer risk associated with long-term exposure to radon in groundwater was evaluated using the ELCR parameter. ELCR calculations are widely employed to assess the potential health effects of radon-contaminated water resources. In this study, ELCR values for the groundwater samples were calculated using Equation (3) [55]:
  ELCR = AED × DL × RF
where ELCR is the excess lifetime cancer risk, AED is the annual effective dose due to ingestion, DL is the average lifespan (70 years), and RF is the cancer risk factor (5.5 × 10⁻² Sv−1) [56].

2.3. Statistical Analysis

Statistical analyses were conducted using IBM SPSS Statistics for Windows, Version 30.0 (IBM Corp., Armonk, NY, USA) to investigate the relationships between mean 222Rn concentrations and selected hydrogeological and physicochemical parameters, including well depth, pH, electrical conductivity (EC), and water temperature. Given the relatively small sample size and the potential non-normal distribution of the dataset, Spearman’s rank correlation coefficient was used to assess the strength and direction of these associations. To evaluate seasonal differences in groundwater 222Rn concentrations while accounting for repeated measurements obtained from the same wells, a linear mixed-effects model was applied, with season treated as a fixed effect and well included as a random effect. Regression coefficients (β), 95% confidence intervals (95% CI), and p-values were reported. Statistical significance was evaluated at the 95% confidence level, and p-values < 0.05 were considered statistically significant.

3. Results and Discussion

3.1. 222Rn Activity Concentrations in Drinking Water Wells

In this study, 222Rn activity concentrations measured in drinking water wells located along the Sultandağı Fault were evaluated. Using data collected over the one-year monitoring period, the minimum, maximum, and annual mean radon concentrations were calculated for each well. The measured 222Rn concentrations in groundwater samples ranged from 0.05 to 26.64 Bq L−1. The lowest concentration was recorded in well W13 during August 2021 (0.05 Bq L−1), whereas the highest concentration was observed in well W2 during May 2022 (26.64 Bq L−1). The minimum, maximum, and mean radon concentrations for the sampled wells are presented in Table 2.
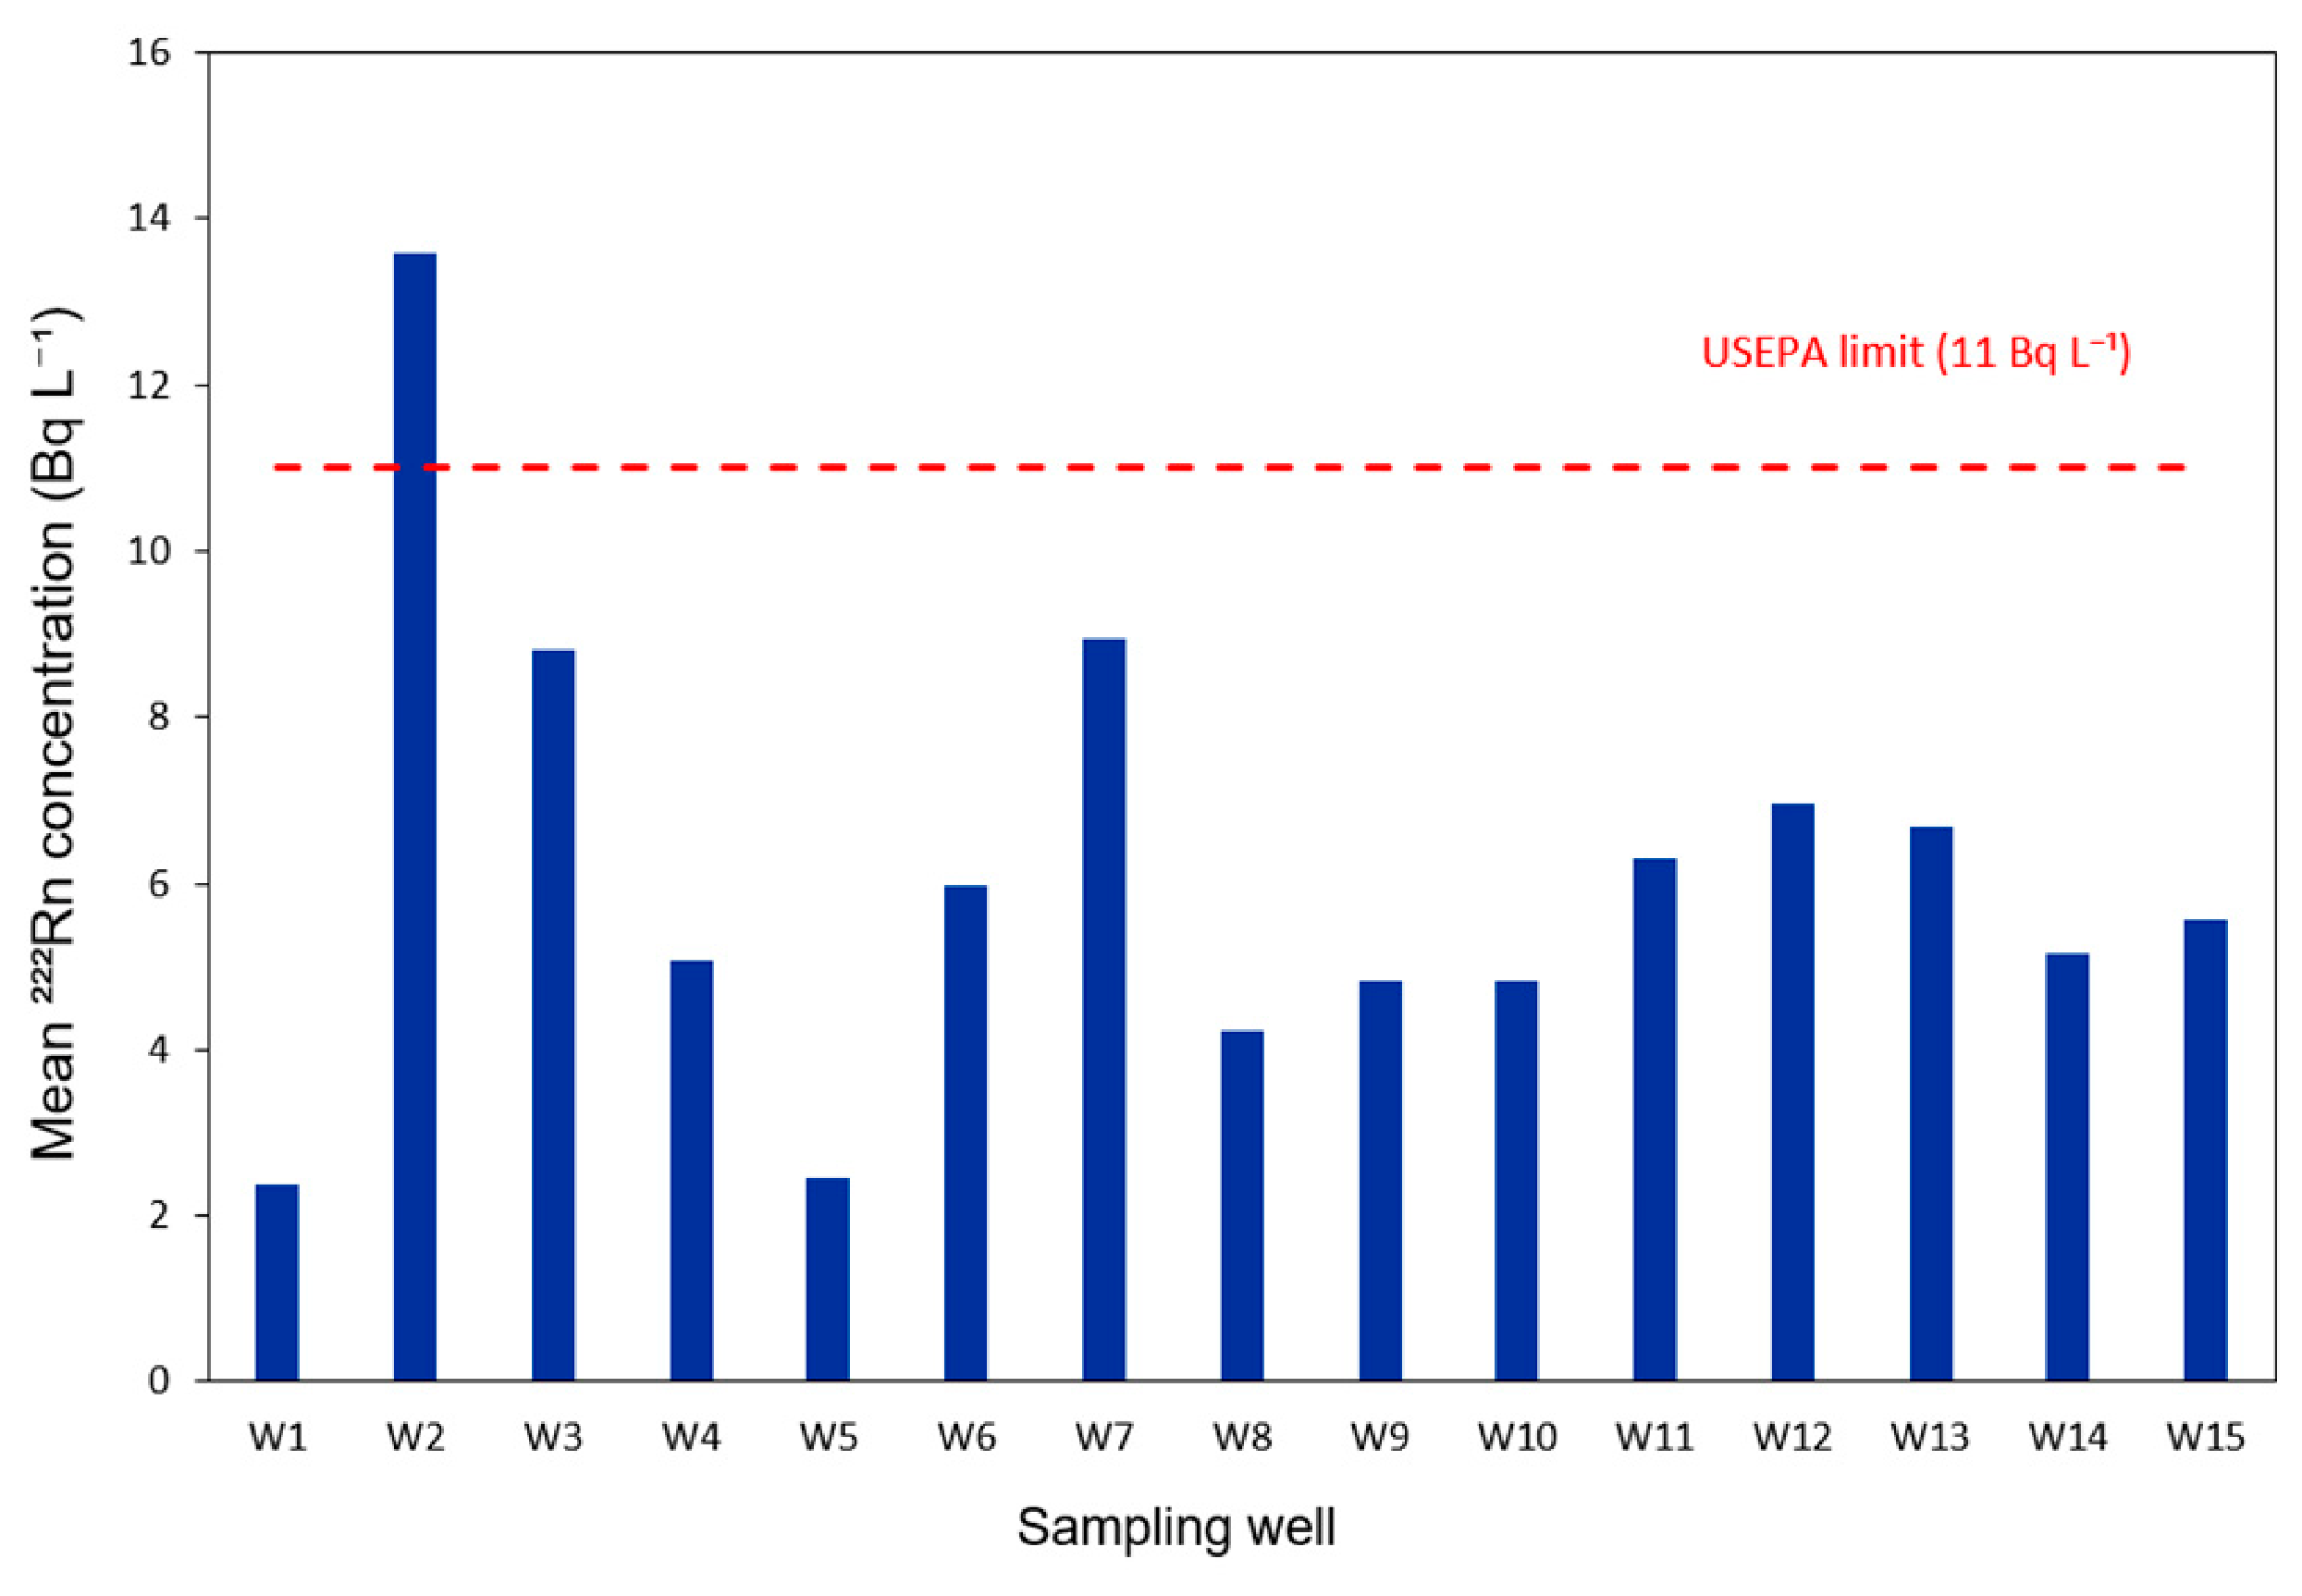
Annual mean 222Rn concentrations in the 15 investigated wells ranged from 2.37 to 13.59 Bq L−1. The overall mean concentration for the study area was 6.12 ± 2.79 Bq L−1, calculated as the arithmetic mean of the annual mean concentrations of all 15 investigated wells. The majority of the wells exhibited mean radon concentrations between 4 and 8 Bq L−1 (Figure 4). The highest annual mean radon concentration was observed in well W2 (Salar), with a value of 13.59 Bq L−1, whereas the lowest mean concentration was recorded in well W1 (Ali İhsan Paşa), where a value of 2.37 Bq L−1 was measured.
As shown in Figure 4, all mean radon concentrations obtained from measurements conducted at two-week intervals over a 12-month period in the drinking water wells remained below the WHO reference level of 100 Bq L−1 for radon in drinking water [43]. In addition, the results were evaluated with respect to the USEPA guideline value of 11 Bq L−1 [42]. According to this assessment, only the mean radon concentration measured in well W2 (13.59 Bq L−1) exceeded the recommended guideline value. Mean radon concentrations in all other wells remained below the USEPA guideline value of 11 Bq L−1. These findings indicate that radon concentrations in most of the investigated wells remained below the guideline or reference values for drinking water. However, more detailed monitoring of radon levels may be beneficial at certain locations. It is well known that radon concentrations in groundwater can vary considerably depending on the geological and hydrogeological conditions. These findings are consistent with previous studies investigating radon levels in well waters in Afyonkarahisar. Measurements conducted in ten deep wells located along the Akşehir Fault System reported mean radon concentrations ranging from 2.2 to 7.7 Bq L−1 [57]. In the same study, minimum and maximum radon concentrations of 0.7 and 31.7 Bq L−1, respectively, were reported. Although different wells were investigated, both studies focused on deep groundwater systems in the same region, allowing regional-scale comparisons. In the present study, mean radon concentrations ranged from 2.37 to 13.59 Bq L−1. The lowest mean radon concentrations reported in the two studies were very similar, being 2.2 Bq L−1 in [57] and 2.37 Bq L−1 in the present study. In contrast, the highest mean radon concentration determined in this study (13.59 Bq L−1) was higher than the maximum mean value reported by [57] (7.7 Bq L−1). Similarly, the maximum measured radon concentrations were of the same order of magnitude, reaching 31.7 Bq L−1 in [57] and 26.64 Bq L−1 in the present study.
The wide range of 222Rn concentrations reported in groundwater and drinking water worldwide is summarized in Table 3. The mean 222Rn concentration determined in the present study (6.12 Bq L−1) was higher than the values reported for tap water in Thailand (0.40 Bq L−1) [58], groundwater in eastern Saudi Arabia (1.16 Bq L−1) [59], and groundwater from the Gandhinagar region of India (2.19 Bq L−1) [60]. In contrast, it was substantially lower than the mean radon concentrations reported for hand-dug wells (94.11 Bq L−1) and boreholes (82.75 Bq L−1) in Dutse, Nigeria [61]. The mean concentration reported for well water in the Peshawar Basin, Pakistan (12.0 Bq L−1) [62] was more comparable to the value obtained in the present study.
In the present study, radon concentrations in well waters ranged from 0.05 to 26.64 Bq L−1, with a mean value of 6.12 Bq L−1. Similarly, a study conducted in Sakarya Province reported radon concentrations ranging from 1.98 to 20.80 Bq L−1 in well waters, with a mean concentration of 9.05 Bq L−1 [63]. These findings indicate that mean radon concentrations in the Sakarya wells were slightly higher than those observed in the present study. In both studies, the mean radon concentrations remained well below the WHO reference level of 100 Bq L−1 for radon in drinking water [43]. Overall, both studies indicate that radon levels in well waters do not pose a significant radiological health risk.
Table 3. Comparison of 222Rn activity concentrations, annual effective doses (AEDs), and excess lifetime cancer risks (ELCRs) in drinking-water sources reported worldwide and in the present study.
Region/CountryWater Source222Rn Range
(Bq L−1)
Mean 222Rn
(Bq L−1)
Annual Effective Doses (AEDs) (μSv y−1)Excess Lifetime Cancer Risk (ELCR) ( × 10−4)Ref.
InfantsChildrenAdultsInfantsChildrenAdults
Dutse, NigeriaBore.31.66–27782.751057.1906.1604.137.031.7121.14[61]
Dutse, NigeriaHDW33.15–25694.111202.21030.5687.042.1036.1023.70[61]
Iluagba, NigeriaGW/SW10.6–43.124.132.327.417.63.173.012.71[64]
Ratchathani, ThailandTW0.00–2.10.402.10.81.00.0910.0340.044[58]
Minna, NigeriaOW2.1–27.9 10.253.271.674.6NRNR1.0[65]
Minna, NigeriaBore.2.8–39.214.374.3100.0104.2NRNR1.3[65]
Peshawar PakistanWell2.6–23.012.048.036.035.0NRNR0.84[62]
SW Punjab, IndiaSBW0.89–7.73.47NRNR9.0NRNR2.49[66]
SW Punjab, IndiaDBW1.39–11.83.97NRNR9.8NRNR2.74[66]
Kerala, IndiaGW0.64–79.98.134.11.52.0NRNR0.80[67]
Gandhinagar, IndiaGW0.07–8.32.197.54.53.8NRNRNR[68]
Eastern Saudi ArabiaGW0.03–3.21.166.12.32.9NRNRNR[59]
Ekiti, NigeriaHDW0.6–36.213.3NRNR34.1NRNRNR[69]
Ekiti, NigeriaHPB7.0–41.523.3NRNR59.6NRNRNR[69]
Ekiti, NigeriaMB0.6–27.47.4NRNR19.0NRNRNR[69]
Kahramanmaraş,
Türkiye
Bottled0.0135–0.03170.02120.0740.0440.054NRNR0.0024[70]
Sakarya, TürkiyeWell1.98–20.89.0527.516.413.9NRNRNR[63]
Çorlu, TürkiyeWell22.04–63.92 43.25NRNR8.7NRNRNR[33]
Afyonkarahisar,
Türkiye
Well0.42–28.8NRNRNR73.8NRNRNR[57]
This studyWell0.05–26.646.1235.913.215.61.260.460.55
Abbreviations: Bore., bore; HDW, hand-dug well; OW, open well; HPB, hand-pumped borehole; MB, motorized borehole; SBW, shallow borewell; DBW, deep borewell; GW, groundwater; SW, surface water; TW, tap water; GW/SW, mixed groundwater and surface water; AED, annual effective dose; ELCR, excess lifetime cancer risk; NR, not reported. Note: Values reported for the present study represent arithmetic mean values calculated from annual average 222Rn concentrations measured in 15 drinking water wells over a one-year monitoring period. The studies summarized in this table were conducted under diverse geological and hydrogeological conditions, which strongly influence groundwater 222Rn concentrations. Accordingly, the reported values are intended to provide a general comparison, and site-specific geological and hydrogeological differences should be considered when interpreting the results. It should be noted that differences in assumptions used for dose and risk calculations, including water consumption rates, dose conversion factors, and exposure durations, may contribute to the variability among reported risk estimates in previous studies. Accordingly, comparisons based on radon concentrations provide a more consistent basis for evaluation, whereas dose and risk values should be interpreted considering the methodological differences among studies.
When compared with previous radon studies conducted in groundwater and drinking water resources in Türkiye, the mean 222Rn concentration determined in the present study (6.12 ± 2.79 Bq L−1) was considerably lower than the value reported for well waters in the Çorlu region (43.25 ± 7.92 Bq L−1) [33]. Similarly, the mean annual effective dose reported in the Çorlu study was 8.65 ± 1.58 μSv y−1.
The mean 222Rn concentration determined in the present study (6.12 ± 2.79 Bq L−1) was substantially higher than that reported for commercially bottled drinking waters in Kahramanmaraş (0.021 ± 0.002 Bq L−1) [70]. Likewise, the maximum concentration measured in this study (26.64 Bq L−1) greatly exceeded the maximum value reported in the bottled-water study (0.0317 Bq L−1). In bottled waters, radioactive decay during storage and transportation, together with radon degassing from water into the atmosphere during shelf life, can substantially reduce radon concentrations in bottled waters. The potential effects of selected hydrogeological parameters on groundwater 222Rn concentrations were also evaluated. For this purpose, Spearman correlation analysis was performed using the mean 222Rn concentrations and measured physicochemical parameters of the investigated wells. The results are presented in Table 4.
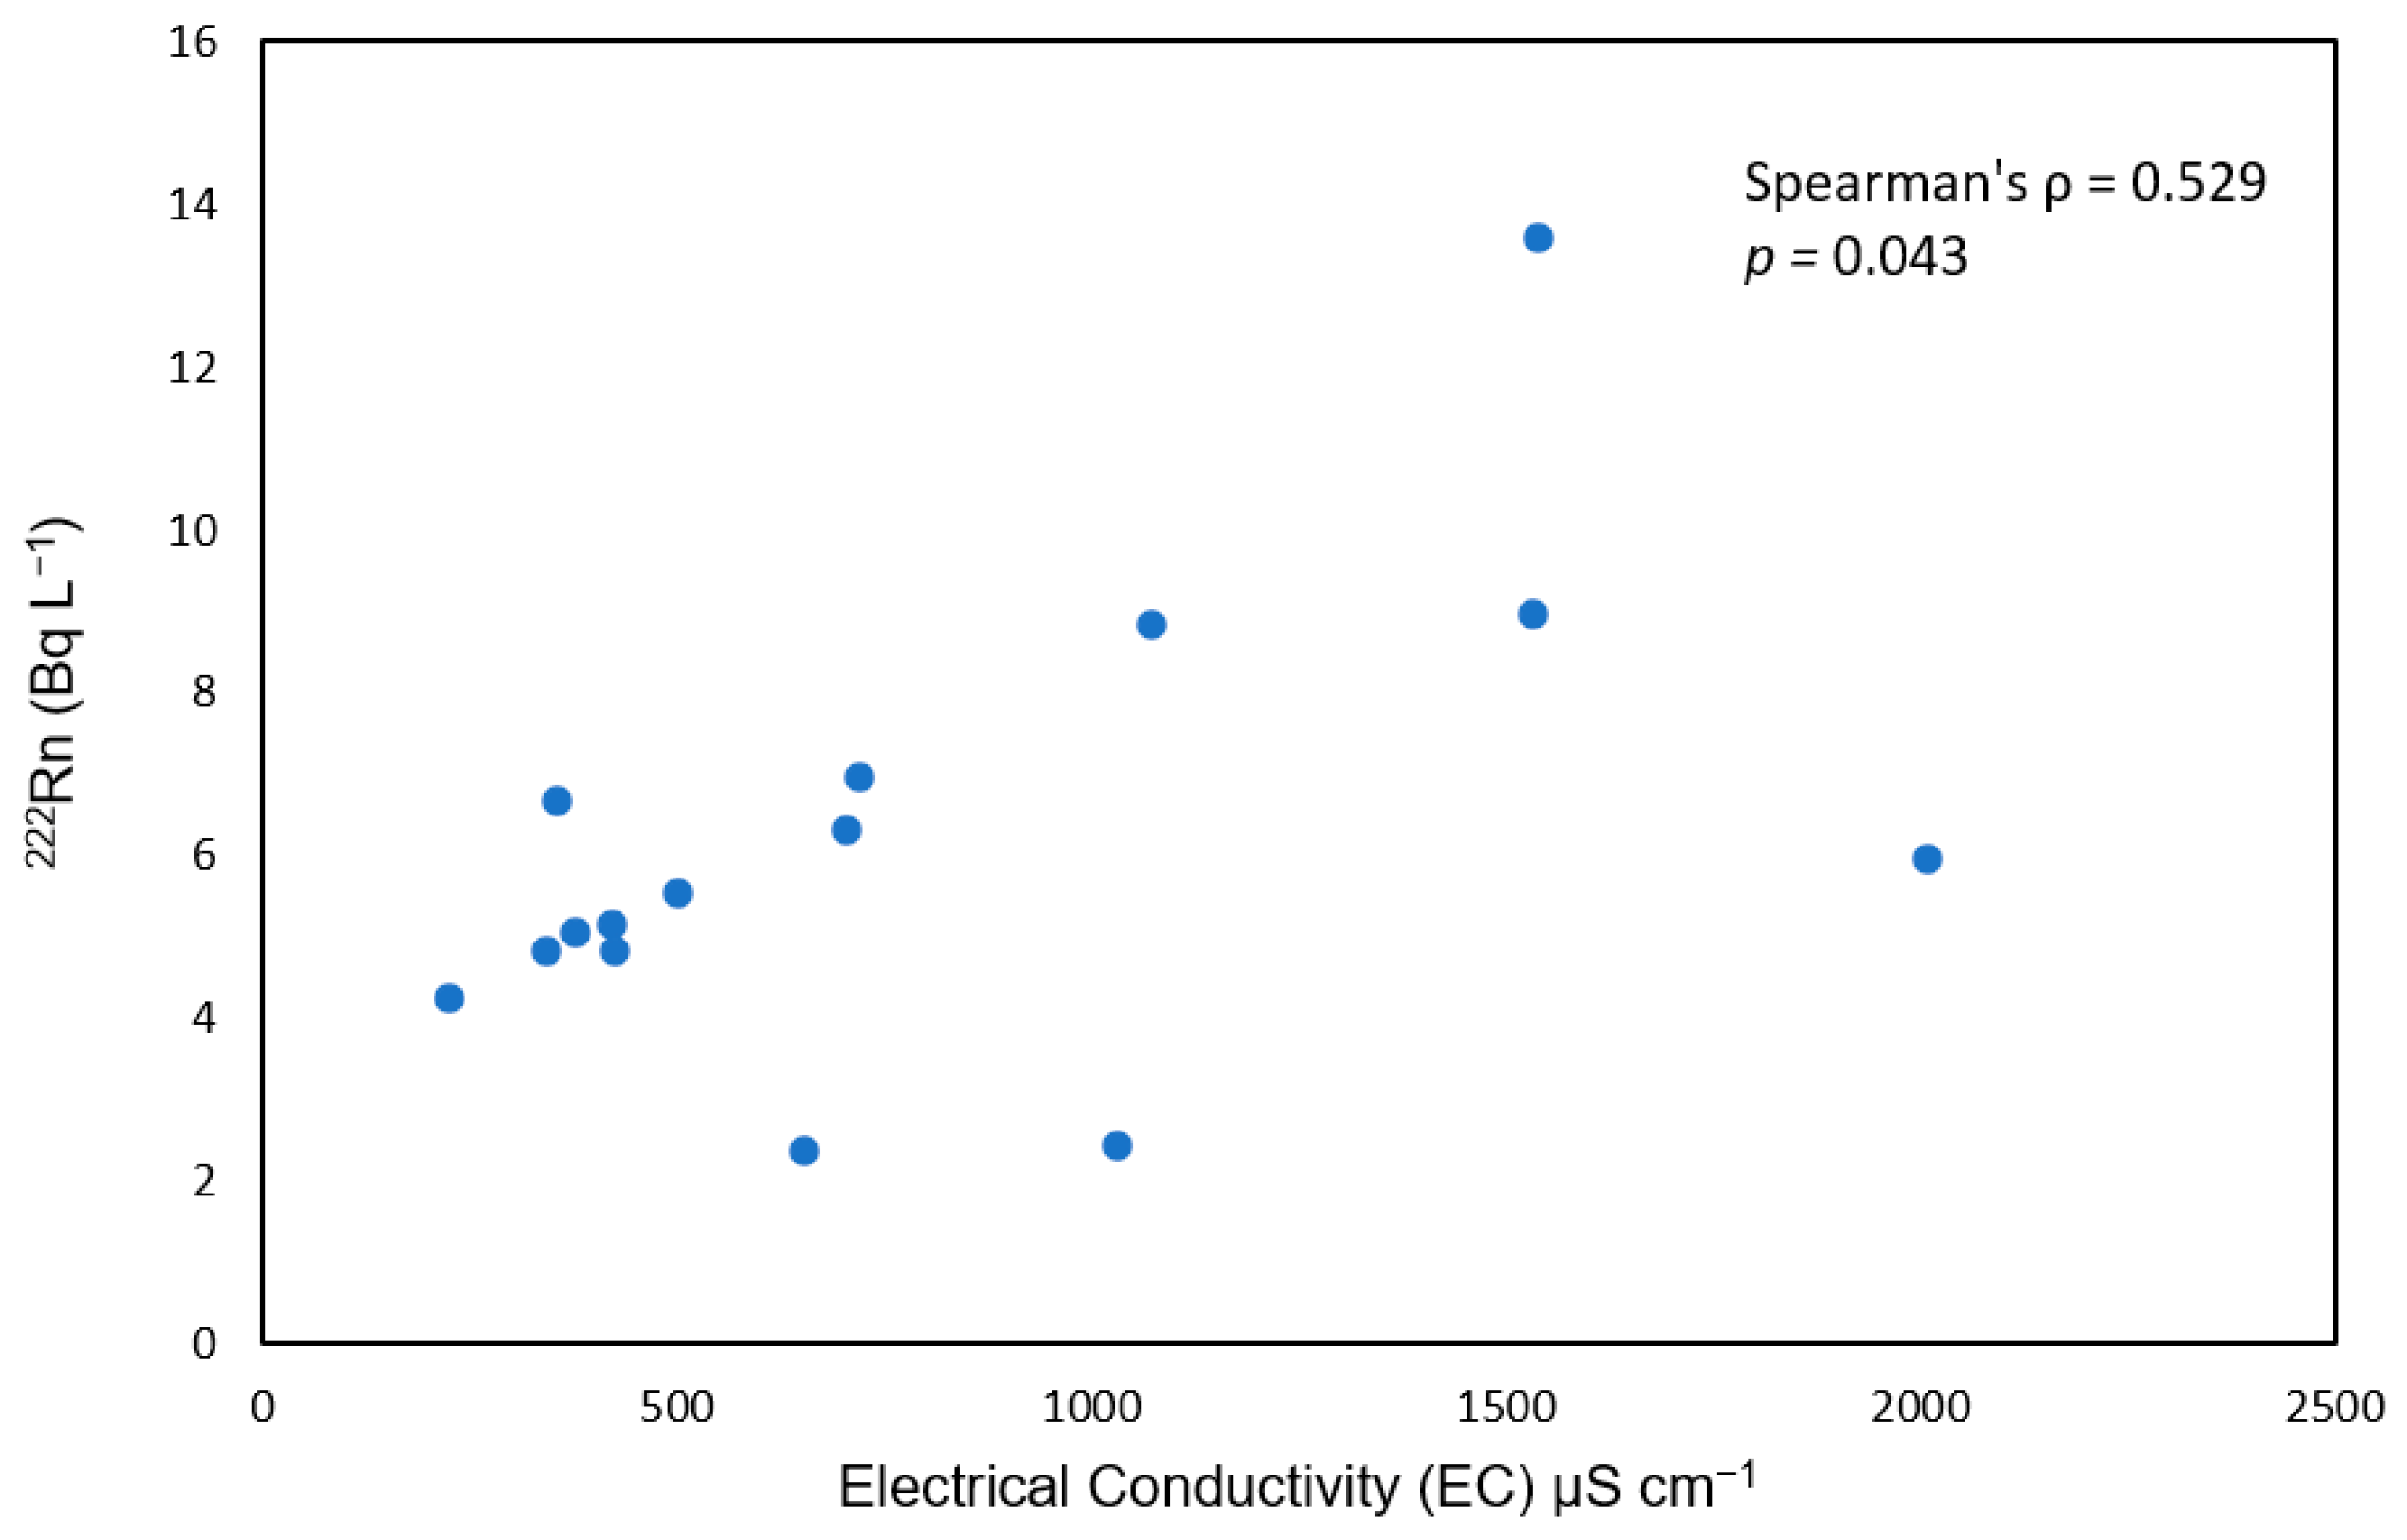
As electrical conductivity (EC) was the only parameter significantly correlated with 222Rn concentrations, the relationship between these variables is illustrated in greater detail in Figure 5.
The correlation analysis revealed no statistically significant relationships between 222Rn concentrations and well depth, pH, or water temperature (p > 0.05). This finding suggests that well depth, pH, and water temperature alone do not adequately explain the observed variability in groundwater 222Rn concentrations in the study area. However, a moderate and statistically significant positive correlation was identified between 222Rn concentration and electrical conductivity (EC) (ρ = 0.529, p = 0.043).
As EC is an indicator of dissolved ion content, the observed positive relationship may be associated with water–rock interaction processes and the resulting degree of mineralization. Similar positive relationships between groundwater radon concentrations and EC have also been reported by [71,72]. Ref. [71] reported a strong correlation between groundwater 222Rn concentrations and EC, whereas [72] described this relationship as a moderate positive correlation (r = 0.39). The moderate positive correlation observed in the present study (ρ = 0.529) is consistent with these previous findings. This suggests that EC may serve not as a parameter directly controlling groundwater 222Rn concentrations, but rather as an indicator of hydrogeochemical processes such as water–rock interaction and dissolved ion content. However, given the moderate strength of the correlation and the limited number of well-level observations, the observed relationship should not be interpreted as evidence of a direct cause-and-effect relationship. Nevertheless, the relationship between EC and 222Rn appears to vary depending on the hydrogeological setting. Ref. [73] found no significant correlation between groundwater 222Rn concentrations and EC and concluded that radon distribution is primarily controlled by rock characteristics, 226Ra content, emanation coefficient, and structural features. Similarly, previous studies have emphasized that high radon production potential or high emanation capacity does not necessarily result in elevated groundwater radon concentrations, as radon transport and accumulation in groundwater are also influenced by hydrogeological processes such as fracture systems, groundwater circulation, and water–rock interactions [73,74]. Spearman correlation analysis revealed no statistically significant relationship between mean 222Rn concentrations and the distance to the nearest mapped fault (ρ = 0.361, p = 0.187).
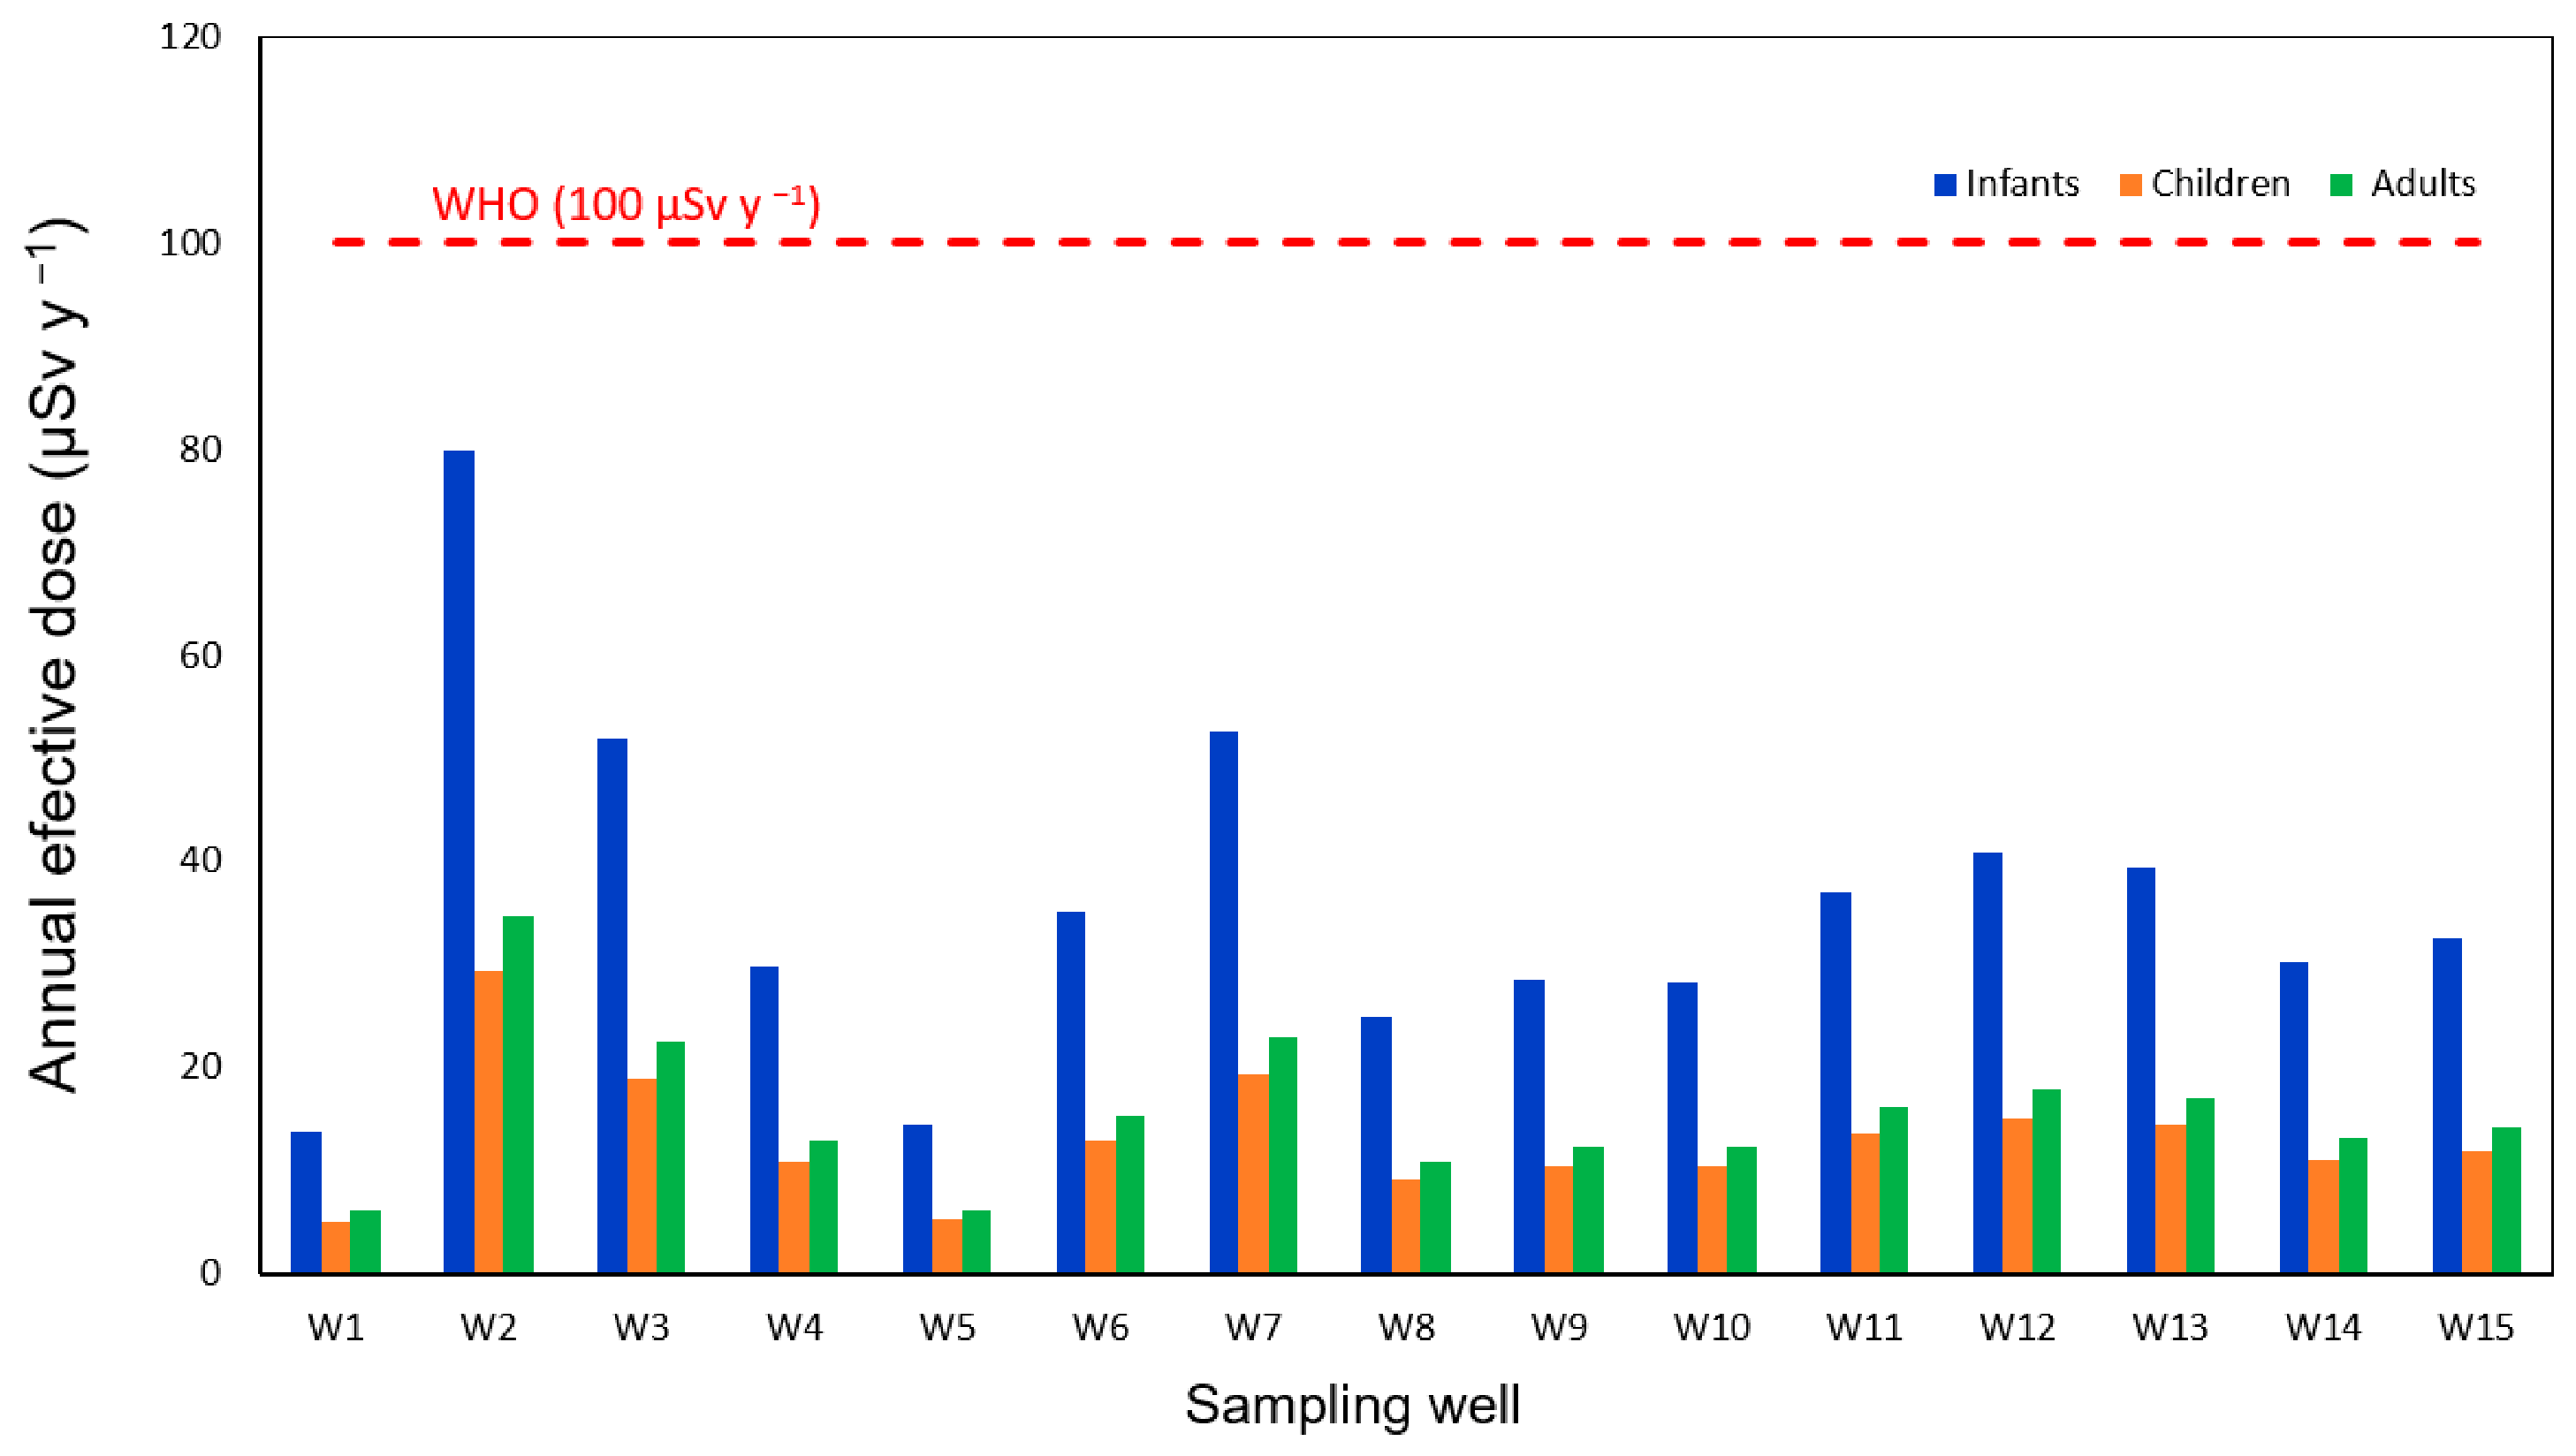
The annual effective doses (AEDs) due to ingestion, calculated from the measured 222Rn concentrations in groundwater, are presented in Table 2. The calculated AED values ranged from 13.90 to 79.86 μSv y−1 for infants, 5.09 to 29.27 μSv y−1 for children, and 6.04 to 34.72 μSv y−1 for adults. The corresponding mean AED values were 35.94, 13.17, and 15.63 μSv y−1 for infants, children, and adults, respectively. At all sampling locations, the highest AED values were obtained for infants, followed by adults and children. This difference may be attributed to age-dependent dose conversion factors and differences in daily water consumption rates used in the dose calculations.
Among the investigated wells, the highest AED values were observed in well W2, whereas the lowest values were calculated for well W1. The variation in annual effective doses primarily reflects the differences in measured radon concentrations among groundwater samples. However, as shown in Figure 6, even the highest AED value (79.86 μSv y−1 for infants in well W2) remained below the WHO reference dose criterion of 100 μSv y−1, recommended for drinking water quality [54]. Furthermore, all calculated AED values were lower than the reference dose level of 290 μSv y−1 recommended by [1].
The obtained results indicate that, under the current conditions, the groundwater resources in the study area do not pose a significant radiological risk through drinking-water consumption. Nevertheless, the relatively higher AED values observed in some wells highlight the importance of regular monitoring of radon levels in groundwater. When compared with the literature data summarized in Table 3, the AED and ELCR values calculated in this study were lower than those reported for many regions and comparable to those reported in some previous studies. However, it should be noted that differences in AED and ELCR values among studies are not solely attributable to variations in radon concentrations, as dose conversion factors, age-group classifications, water-consumption rates, and risk coefficients may differ between studies.
The excess lifetime cancer risk (ELCR) values associated with 222Rn concentrations in groundwater are presented in Table 2. The calculated ELCR values ranged from 0.49 × 10⁻⁴ to 2.80 × 10⁻⁴ for infants, from 0.18 × 10⁻⁴ to 1.02 × 10⁻⁴ for children, and from 0.21 × 10⁻⁴ to 1.22 × 10⁻⁴ for adults. The mean ELCR values were calculated as 1.26 × 10⁻⁴, 0.46 × 10⁻⁴, and 0.55 × 10⁻⁴ for infants, children, and adults, respectively. At all sampling locations, the highest ELCR values were observed for infants, followed by adults and children. This difference among age groups can be attributed to variations in age-dependent dose conversion factors and daily water-consumption rates used in the calculations.
Among the investigated wells, the highest ELCR values were obtained for well W2, whereas the lowest values were observed for well W1. The variation in ELCR values is directly related to the measured 222Rn concentrations in groundwater and the corresponding annual effective doses. The reference risk level of 1 × 10⁻⁴ was adopted based on the recommendations of the United States Environmental Protection Agency (USEPA), which generally uses a lifetime excess cancer risk range of 10−6–10−4 for risk management decisions [75]. Comparison with this reference level showed that some of the calculated ELCR values were higher than 1 × 10⁻⁴ [76]. In particular, the highest ELCR values were recorded in well W2, reaching 2.80 × 10⁻⁴ for infants, 1.02 × 10⁻⁴ for children, and 1.22 × 10⁻⁴ for adults. These findings indicate that wells with elevated radon concentrations may also exhibit higher ELCR values. Therefore, periodic monitoring is recommended, particularly for wells with comparatively high radon levels. Nevertheless, the mean ELCR values for children and adults remained below the reference level of 1 × 10⁻⁴, and elevated risk values were observed only in a limited number of wells [76]. Furthermore, all measured radon concentrations in the study area remained below the reference level of 100 Bq L−1 recommended by the World Health Organization (WHO) for drinking water [43]. These results suggest that the investigated groundwater sources generally pose a low radiological risk through drinking-water consumption, although regular monitoring of radon levels may be beneficial at certain sampling locations.
The age-specific ELCR values presented in this study were derived from age-specific annual effective doses calculated using age-dependent dose conversion factors and water-consumption rates. In the ELCR calculation, the 70-year duration represents the conventional reference lifetime widely adopted in radiological risk assessment rather than the duration of a specific age category [58]. Accordingly, the calculated age-specific ELCR values provide a comparative assessment of radiological risk among different age groups within the adopted assessment methodology. Considering that 222Rn concentrations in groundwater may exhibit temporal variability, health-risk assessments based on long-term monitoring data are likely to provide more reliable estimates than those based on single measurements.
Measurements conducted at approximately two-week intervals over a one-year period revealed that some wells exhibited consistently higher 222Rn concentrations than others. Previous studies have reported that significant differences in 222Rn concentrations may occur even among wells located within the same geological unit and in close proximity to one another [73]. Such differences have been attributed to variations in geological and hydrogeological characteristics of aquifers, groundwater-flow conditions, and groundwater residence times [73,77]. In addition, temporal and seasonal variations in groundwater 222Rn concentrations have been reported in several studies [78,79].

3.2. Seasonal Variation of 222Rn Activity Concentrations in Drinking Water Wells

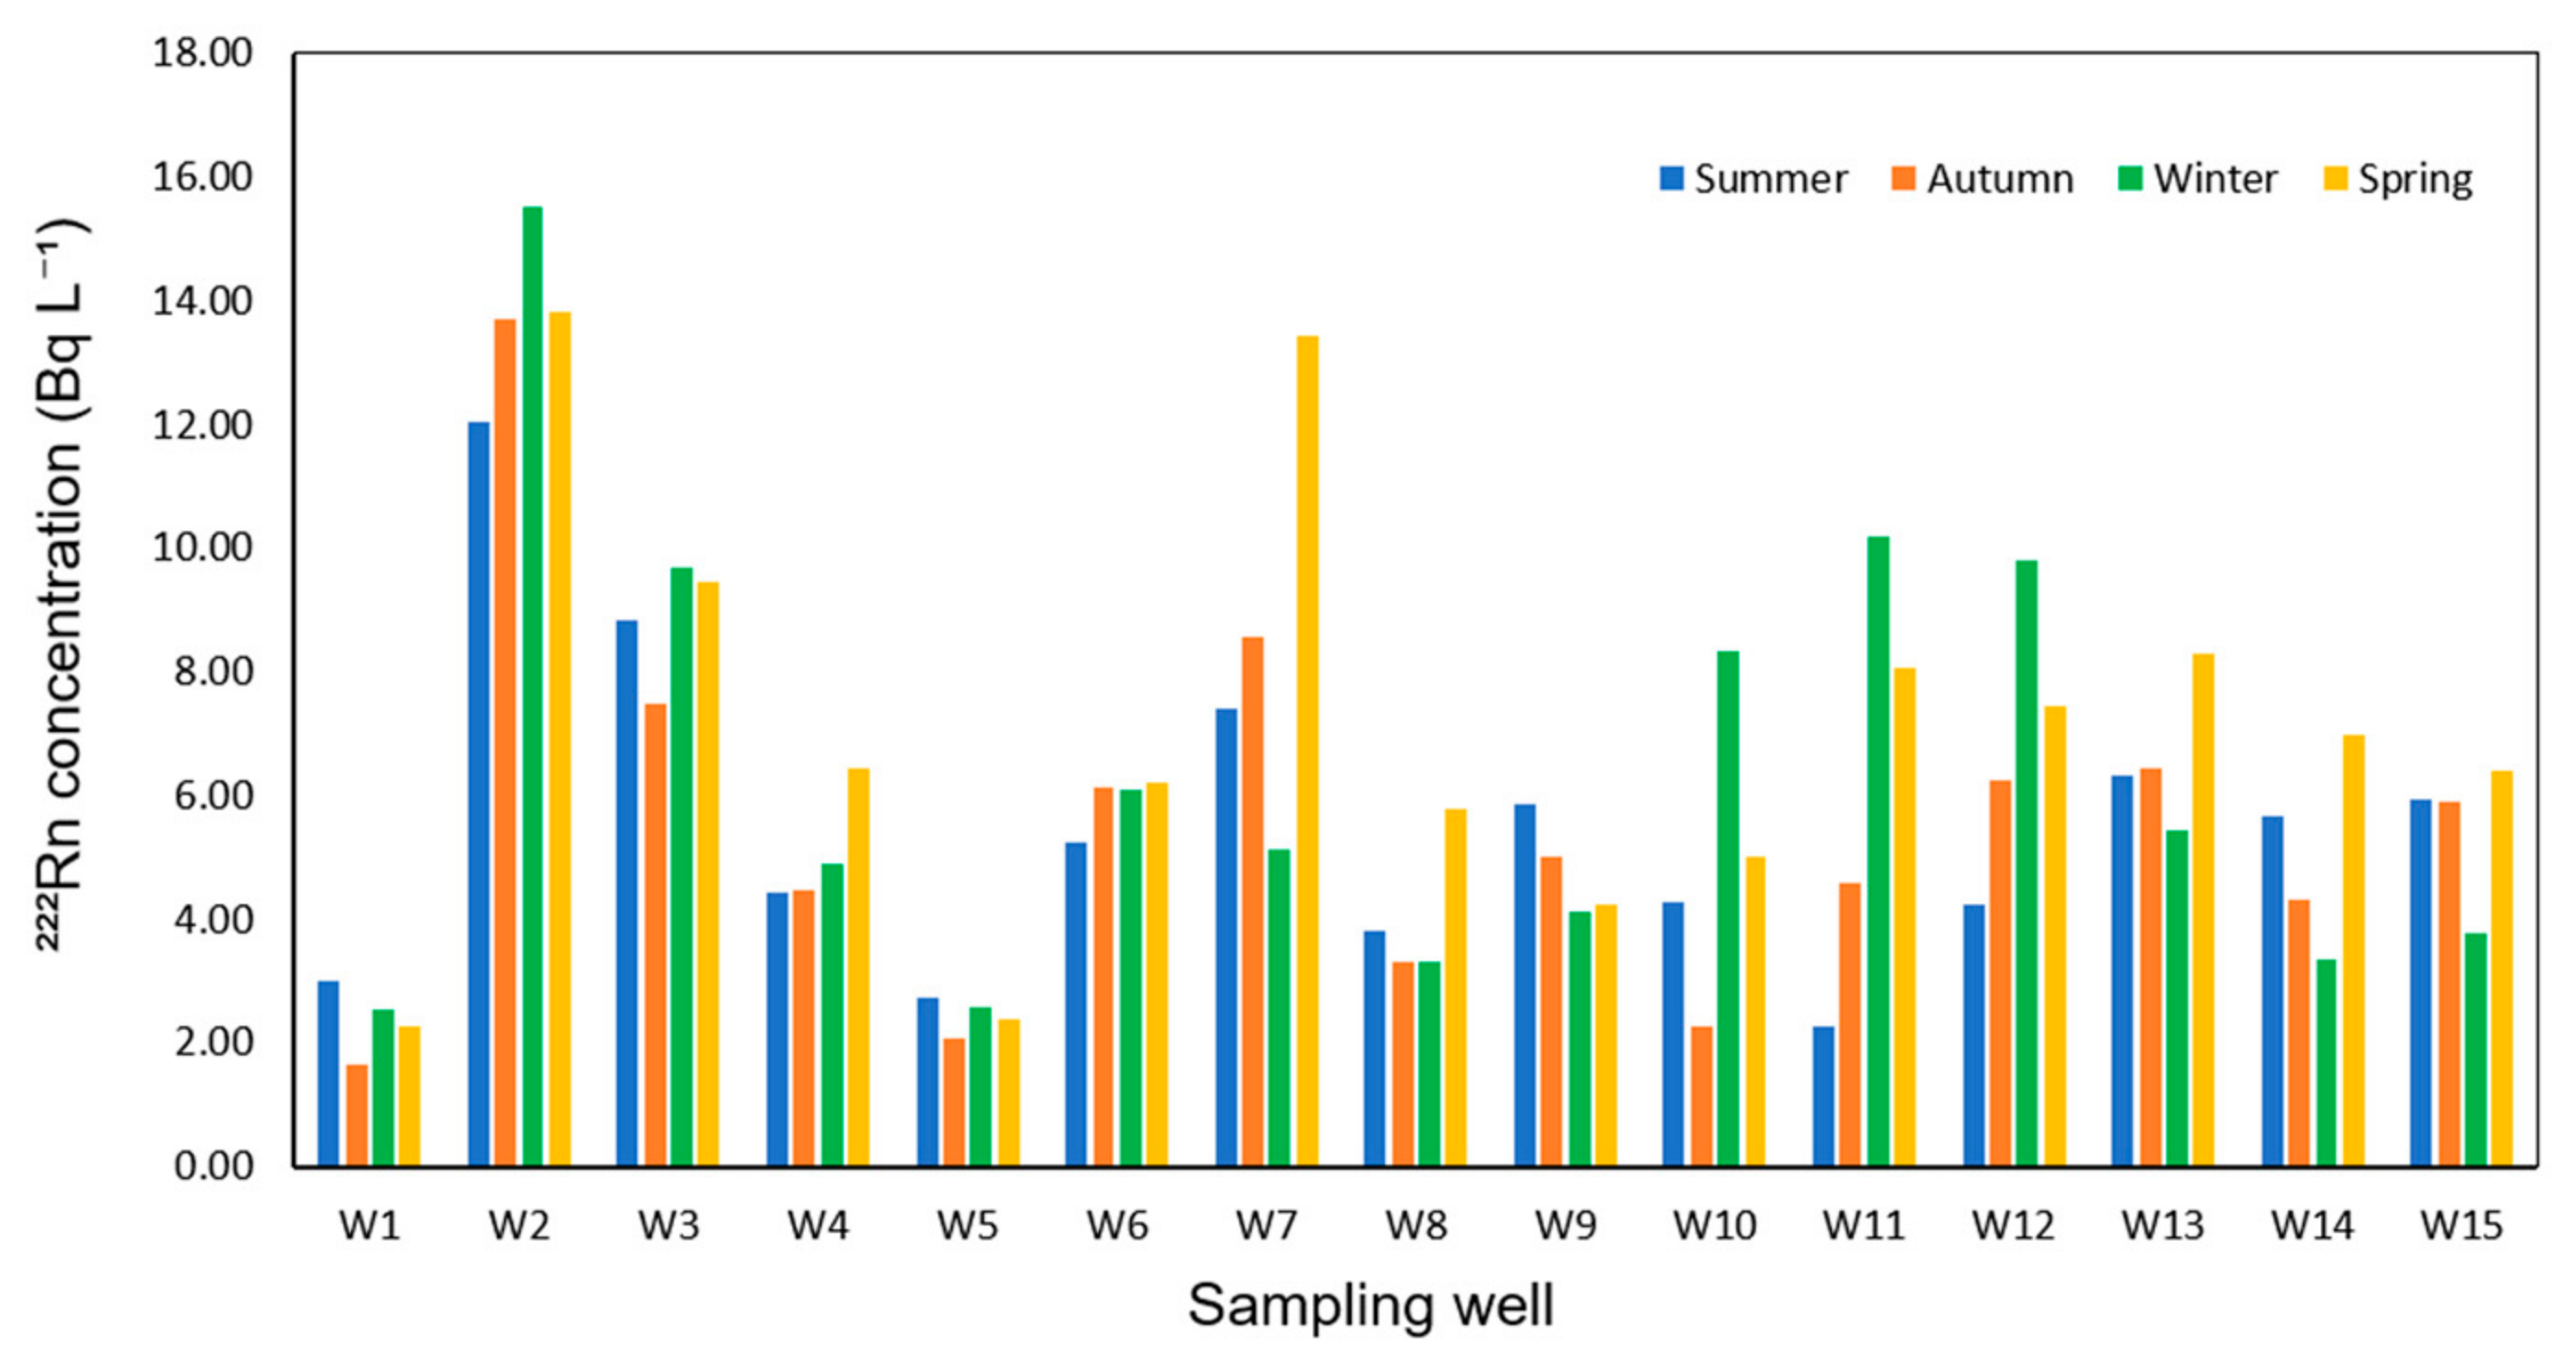
The seasonal mean 222Rn activity concentrations measured in the investigated wells are presented in Figure 7. The seasonal average 222Rn concentrations within the study area were calculated as 5.48 ± 2.53, 5.48 ± 3.02, 6.32 ± 3.67, and 7.08 ± 3.32 Bq L−1 during summer, autumn, winter, and spring, respectively. These results indicate that the average 222Rn concentrations in the study area tended to be relatively higher during the winter and spring seasons. The findings further reveal that 222Rn concentrations exhibited different seasonal patterns among the wells. While relatively elevated concentrations were observed in some wells during winter and spring, seasonal variations were found to be limited in others. Overall, the seasonal fluctuations in groundwater 222Rn concentrations did not exhibit a consistent trend across the study area, indicating that seasonal variability differed among the investigated wells. To account for the repeated measurements obtained from the same wells during the one-year monitoring period, a linear mixed-effects model was applied, with season treated as a fixed effect and well as a random effect. This approach accounted for the non-independence of repeated observations from the same well and distinguished within-well seasonal variation from between-well variability. The analysis identified a significant difference in groundwater 222Rn concentrations between spring and autumn (β = 1.604 Bq L−1, 95% CI: 0.674–2.534, p = 0.001). In contrast, no statistically significant differences were observed between summer and autumn (β = 0.000 Bq L−1, 95% CI: −0.930 to 0.930, p = 1.000) or between winter and autumn (β = 0.844 Bq L−1, 95% CI: −0.121 to 1.809, p = 0.086). The model also revealed substantial between-well variability, suggesting that differences among wells were greater than seasonal differences.
As shown in Figure 7, the differences observed among the wells persisted throughout the entire monitoring period. In particular, wells W2, W7, and W11 consistently exhibited higher 222Rn concentrations than the other wells across all seasons, whereas wells W1 and W5 were characterized by lower and relatively stable concentrations. Furthermore, the maximum 222Rn concentrations were observed at different sampling times among the investigated wells, indicating the absence of a common seasonal pattern.
Examination of the seasonal variations revealed that although elevated 222Rn concentrations were observed in some wells during winter and spring, this pattern was not consistent throughout the study area. For example, pronounced increases were observed during spring in wells W7 and W13, whereas higher concentrations were recorded during winter in wells W11 and W12.
The average 222Rn concentration in the study area was highest during spring (7.08 ± 3.32 Bq L−1), while lower values were observed during summer and autumn. The mixed-effects analysis further showed that groundwater 222Rn concentrations were significantly higher in spring than in autumn (p = 0.001), whereas no significant differences were detected between autumn and either summer or winter. Previous studies have reported that 222Rn concentrations in groundwater may exhibit seasonal variability [78,79]. Similarly, seasonal fluctuations in groundwater 222Rn concentrations have been documented in different hydrogeological settings [25,80]. However, the present dataset does not allow the observed seasonal variations to be directly attributed to any specific environmental factor. Moreover, seasonal patterns were not uniform among the wells; higher 222Rn concentrations were observed during winter in some wells and during spring in others. These findings suggest that the observed variability in 222Rn concentrations cannot be explained solely by seasonal influences.
The study area is located within the Akşehir–Simav Fault System, providing an active tectonic setting for investigating groundwater 222Rn variability. However, no statistically significant relationship was observed between groundwater 222Rn concentrations and distance to the nearest mapped fault. Considerable spatial variability was observed among the sampled wells, with the highest mean 222Rn concentrations recorded in wells W2 and W7.
It is widely recognized that 222Rn concentrations in groundwater can be affected by aquifer characteristics, water–rock interactions, and groundwater circulation conditions. Ref. [81] reported that radon concentrations in groundwater are influenced primarily by lithological characteristics and rock–water interactions rather than by the chemical composition of the water itself. The well-specific variations observed in the present study may likewise be associated with similar natural processes.
In the literature, health risks associated with groundwater radon are generally evaluated using data obtained from single-period or short-term measurements. In contrast, the present study is based on the average of measurements conducted at regular intervals over a one-year period and therefore provides a more comprehensive assessment that accounts for the seasonal variability of radon concentrations. This approach may contribute to a more reliable evaluation of radiological risks associated with drinking water consumption.

4. Conclusions

In this study, 222Rn activity concentrations were monitored at biweekly intervals over a one-year period in 15 drinking water wells located within the Sultandağı Fault Zone in Afyonkarahisar, Türkiye, and the associated radiological risks were evaluated. The results showed that 222Rn concentrations in groundwater ranged from 0.05 to 26.64 Bq L−1, with an overall annual mean concentration of 6.12 ± 2.79 Bq L−1 for all investigated wells. The highest annual mean concentration was recorded in well W2 (13.59 ± 5.86 Bq L−1), whereas the lowest value was observed in well W1 (2.37 ± 2.02 Bq L−1).
All measured average radon concentrations were below the reference level of 100 Bq L−1 recommended by the World Health Organization (WHO) for drinking water [43]. Furthermore, only one of the fifteen investigated wells (W2) exhibited an annual average radon concentration exceeding the 11 Bq L−1 limit recommended by the United States Environmental Protection Agency [42]. These findings indicate that the measured radon concentrations were generally below the international reference levels used for comparison in this study.
Seasonal evaluation revealed average 222Rn concentrations of 5.48 ± 2.53, 5.48 ± 3.02, 6.32 ± 3.67, and 7.08 ± 3.32 Bq L−1 during summer, autumn, winter, and spring, respectively. Although relatively higher concentrations were observed during winter and spring, seasonal variations did not exhibit a uniform pattern across all wells. Nevertheless, the mixed-effects analysis demonstrated significantly higher groundwater 222Rn concentrations in spring than in autumn over the one-year monitoring period.
Correlation analysis revealed a moderate and statistically significant positive relationship between 222Rn concentration and electrical conductivity (EC) (ρ = 0.529, p = 0.043), whereas no significant correlations were observed with well depth, pH, or water temperature.
The annual effective dose (AED) values associated with groundwater consumption ranged from 13.90 to 79.86 μSv y−1 for infants, 5.09 to 29.27 μSv y−1 for children, and 6.04 to 34.72 μSv y−1 for adults. The corresponding mean AED values were calculated as 35.94, 13.17, and 15.63 μSv y−1, respectively. Since all AED values remained below the reference levels of 100 μSv y−1 recommended by WHO and 290 μSv y−1 suggested by UNSCEAR, relatively low estimated ingestion doses were obtained under the assumptions applied in this study [1,54].
The excess lifetime cancer risk (ELCR) values ranged from 0.49 × 10⁻⁴ to 2.80 × 10⁻⁴ for infants, 0.18 × 10⁻⁴ to 1.02 × 10⁻⁴ for children, and 0.21 × 10⁻⁴ to 1.22 × 10⁻⁴ for adults. The corresponding mean ELCR values were 1.26 × 10⁻⁴, 0.46 × 10⁻⁴, and 0.55 × 10⁻⁴, respectively. The highest risk values were observed in well W2, highlighting the importance of elevated radon concentrations in radiological risk assessments.
Overall, the measured 222Rn concentrations in the investigated drinking-water wells did not indicate elevated radiological exposure from drinking-water ingestion under the assumptions used for dose assessment. Nevertheless, regular monitoring of 222Rn concentrations and periodic assessments of the associated radiological risk are recommended for groundwater resources used for drinking purposes, particularly for wells exhibiting relatively elevated radon concentrations and in regions characterized by active tectonic features. This study represents one of the few long-term 222Rn monitoring studies in drinking-water wells in Türkiye, based on biweekly measurements conducted over a one-year period in 15 wells. Through biweekly measurements conducted over a one-year period, seasonal variations in 222Rn concentrations and the associated radiological risk parameters were comprehensively evaluated. Compared with studies based on single-period measurements, the present work offers a more reliable assessment of radiological risks and is expected to contribute valuable information for future investigations on environmental radioactivity, hydrogeology, and groundwater quality.

Funding

This research received no external funding.

Institutional Review Board Statement

Not applicable.

Informed Consent Statement

Not applicable.

Data Availability Statement

The raw data supporting the conclusions of this article will be made available by the author on request.

Conflicts of Interest

The author declares no conflicts of interest.

References

  1. UNSCEAR. Sources and Effects of Ionizing Radiation, Report to the General Assembly, with Scientific Annexes Volume I: Sources United Nations; UNSCEAR: New York, NY, USA, 2000. [Google Scholar]
  2. Gundersen, L.C.S.; Wanty, R.B. Field Studies of Radon in Rocks, Soils, and Water; Gundersen, L.C.S., Wanty, R.B., Eds.; U.S. Geological Survey; U.S. Government Printing Office: Washington, DC, USA, 1991.
  3. WHO. The World Health Organization, Handbook on Indoor Radon: A Public Health Perspective; World Health Organization: Geneva, Switzerland, 2009. [Google Scholar]
  4. Kito, M.E.; Kuhland, M.K.; Dansereau, R.E. Direct Comparison of three Methods for the Determination of Radon in Well Water. Health Phys. 1996, 70, 358–362. [Google Scholar] [CrossRef] [Scilit]
  5. Abbas, S.Q.; Khan, J.; Riaz, M.T.; Rafique, M.; Zaman, A.; Khan, S. Radon Concentration in Spring Water as an Indicator of Seismic Activity: A Case Study of the Muzaffarabad Fault in Pakistan. Environ. Monit. Assess. 2024, 196, 41. [Google Scholar] [CrossRef] [Scilit] [PubMed]
  6. Etiope, G.; Martinelli, G. Migration of Carrier and Trace Gases in the Geosphere: An Overview. Phys. Earth Planet. Inter. 2002, 129, 185–204. [Google Scholar] [CrossRef] [Scilit]
  7. Khattak, N.U.; Khan, M.A.; Shah, M.T.; Ali, N. Radon Concentration in Drinking Water Sources of the Region Adjacent to a Tectonically Active Karak Thrust, Southern Kohat Plateau, Khyber Pakhtunkhwa, Pakistan. J. Radioanal. Nucl. Chem. 2014, 302, 315–329. [Google Scholar] [CrossRef] [Scilit]
  8. Planinić, J.; Radolić, V.; Vuković, B. Radon as an Earthquake Precursor. Nucl. Instrum. Methods Phys. Res. A 2004, 530, 568–574. [Google Scholar] [CrossRef] [Scilit]
  9. Puchkov, A.; Yakovlev, E.; Druzhinin, S.; Tokarev, I. Radon (222Rn) Concentrations in Groundwater and Surface Water in the Mountainous Areas of the Northern Tien Shan and Assessment of Radiological Impact on Health (Case Study in the Ala-Archa River Basin, Kyrgyz Republic). Environ. Geochem. Health 2025, 47, 234. [Google Scholar] [CrossRef] [Scilit] [PubMed]
  10. Liu, Z.; Chen, Z.; Li, Y.; Du, P.; Zhao, Y.; Lei, L.; Lu, C.; Huangfu, R. Degassing of Soil Gas Radon and Its Implication to Fault Activity in the Western Margin of the Ordos Block, China. Terra Nova 2024, 36, 191–200. [Google Scholar] [CrossRef] [Scilit]
  11. ICRP. The International Commission on Radiological Protection, Lung Cancer Risk from Radon and Progeny and Statement on Radon (ICRP Publication 115); ICRP: Oxford, UK, 2010. [Google Scholar]
  12. UNSCEAR. Report of the United Nations Scientific Committee on the Effects of Atomic Radiation, General Assembly Official Records Sixty-Third Session Supplement No. 46; UNSCEAR: New York, NY, USA, 2008. [Google Scholar]
  13. Robertson, A.; Allen, J.; Laney, R.; Curnow, A. The Cellular and Molecular Carcinogenic Effects of Radon Exposure: A Review. Int. J. Mol. Sci. 2013, 14, 14024–14063. [Google Scholar] [CrossRef] [Scilit] [PubMed]
  14. UNSCEAR. Sources and Effects of Ionizing Radiation: United Nations Scientific Committee on the Effects of Atomic Radiation: UNSCEAR 2008 Report to the General Assembly, with Scientific Annexes; United Nations: New York, NY, USA, 2010. [Google Scholar]
  15. Darby, S.; Hill, D.; Auvinen, A.; Barros-Dios, J.M.; Baysson, H.; Bochicchio, F.; Deo, H.; Falk, R.; Forastiere, F.; Hakama, M.; et al. Radon in Homes and Risk of Lung Cancer: Collaborative Analysis of Individual Data from 13 European Case-Control Studies. Br. Med. J. 2005, 330, 223–226. [Google Scholar] [CrossRef] [Scilit] [PubMed]
  16. Oni, E.A.; Abilawon, J.A.; Aremu, A.A.; Oloyede, O.O.; Ayanlola, P.S.; Oladapo, O.O.; Oyewole, O.J.; Lawal, M.K.; Olajide, T.A.; Oni, O.M. Determination of Radon Gas Risk Indices in Soil on Fractured Basement of Ayetoro Housing Scheme, Oyo. Environ. Monit. Assess. 2025, 197, 834. [Google Scholar] [CrossRef] [Scilit] [PubMed]
  17. Yıldız, A.; Başaran, C.; Bağcı, M.; Gümüş, A.; Çonkar, F.E.; Ulutürk, Y.; Yalım, H.A. The Measurement of Soil Gases and Shallow Temperature for Determination of Active Faults in a Geothermal Area: A Case Study from Ömer–Gecek, Afyonkarahisar (West Anatolia). Arab. J. Geosci. 2018, 11, 175. [Google Scholar] [CrossRef] [Scilit]
  18. Pressyanov, D.; Zajonchovska, V.; Dimitrov, D. Examining Radon Levels in Soil Gas and Atmospheric Air near the Soil–Air Interface. Eur. Phys. J. Spec. Top. 2025, 235, 1019–1026. [Google Scholar] [CrossRef] [Scilit]
  19. Tan, W.; Nie, Y. Radon Concentration in Air and Evaluation of the Radiation Dose in Villages near Shizhuyuan, Southern Hunan, China. Atmosphere 2024, 15, 786. [Google Scholar] [CrossRef] [Scilit]
  20. Mphaga, K.V.; Utembe, W.; Mbonane, T.P.; Rathebe, P.C. Indoor Radon Exposure and Health Risks in a Community Proximal to Gold Mine Tailings in Gauteng Province, South Africa: A Cross-Sectional Study. Environ. Geochem. Health 2025, 47, 363. [Google Scholar] [CrossRef] [Scilit] [PubMed]
  21. Yalım, H.A.; Gümüş, A.; Açil, D.; Ünal, R.; Yıldız, A. Indoor Radon Activity Concentrations and Effective Dose Rates at Houses in the Afyonkarahisar Province of Turkey. Arab. J. Geosci. 2020, 13, 91. [Google Scholar] [CrossRef] [Scilit]
  22. Büyükuslu, H.; Özdemir, F.B.; Öge, T.Ö.; Gökce, H. Indoor and Tap Water Radon (222Rn) Concentration Measurements at Giresun University Campus Areas. Appl. Radiat. Isot. 2018, 139, 285–291. [Google Scholar] [CrossRef] [Scilit] [PubMed]
  23. Cevik, U.; Celik, A.; Celik, N.; Ozkalayci, F.; Akbulute, S. Assessment of Radiological Levels at Schools in Trabzon, Turkey. Indoor Built Environ. 2013, 22, 376–383. [Google Scholar] [CrossRef] [Scilit]
  24. Cadungog, D.G.E.; Racadio, C.D.T.; Valdez, J.D.G.; Racho, J.M.D.; Mendoza, N.D.S.; Sucgang, R.J. Radiological Investigation of Radon in Groundwater around the Active Taal Volcano (Philippines) and Dose Evaluation. Environ. Geochem. Health 2025, 47, 287. [Google Scholar] [CrossRef] [Scilit] [PubMed]
  25. Krishan, G.; V, S.; Rao, M.S.; Khobragade, S.D.; Singh, H.; Tomar, V.; Bussa, R. Seasonal Variations in Radon Concentrations in Groundwater of Dehradun and Haridwar Districts, Uttarakhand. J. Radioanal. Nucl. Chem. 2025, 334, 1455–1469. [Google Scholar] [CrossRef] [Scilit]
  26. Nazir, S.; Simnani, S.; Sahoo, B.K.; Rashid, I.; Masood, S. Dose Estimation of Radioactivity in Groundwater of Srinagar City, Northwest Himalaya, Employing Fluorimetric and Scintillation Techniques. Environ. Geochem. Health 2021, 43, 837–854. [Google Scholar] [CrossRef] [Scilit] [PubMed]
  27. Erdogan, M.; Eren, N.; Demirel, S.; Zedef, V. Determination of Radon Concentration Levels in Wellwater in Konya, Turkey. Radiat. Prot. Dosim. 2013, 156, 489–494. [Google Scholar] [CrossRef] [Scilit] [PubMed]
  28. Yalım, H.A.; Sandıkcıoğlu, A.; Ertuğrul, O.; Yıldız, A. Determination of the Relationship between Radon Anomalies and Earthquakes in Well Waters on the Akşehir-Simav Fault System in Afyonkarahisar Province, Turkey. J. Environ. Radioact. 2012, 110, 7–12. [Google Scholar] [CrossRef] [Scilit] [PubMed]
  29. La Verde, G.; D’Avino, V.; Sabbarese, C.; Roca, V.; Pugliese, M. Radon Surveys and Effectiveness of Remedial Actions in Spas on the Ischia Island (Italy). Appl. Radiat. Isot. 2022, 185, 110221. [Google Scholar] [CrossRef] [Scilit] [PubMed]
  30. Oner, F.; Yigitoglu, I.; Yalim, H.A. Measurements of Radon Concentrations in Spa Waters in Amasya, Turkey. Radiat. Prot. Dosim. 2013, 157, 221–224. [Google Scholar] [CrossRef] [Scilit] [PubMed]
  31. Sahin, L.; Durak, S.; Hafızoğlu, N. Assessment of Radiation Doses from Natural Radioactivity Measurements in the Spa Centres of Kütahya Province, Turkey. J. Radioanal. Nucl. Chem. 2022, 331, 2993–3004. [Google Scholar] [CrossRef] [Scilit]
  32. Ullah, F.; Muhammad, S.; Ali, W. Radon Concentration and Potential Risks Assessment through Hot Springs Water Consumption in the Gilgit and Chitral, Northern Pakistan. Chemosphere 2022, 287, 132323. [Google Scholar] [CrossRef] [Scilit] [PubMed]
  33. Manisa, K.; Erdogan, M.; Usluer, A.; Cetinkaya, H.; Isik, U.; Sahin, L.; Zedef, V. Assessment of Natural Radioactivity Level of Soil and Water in the Region of Çorlu (Turkey). J. Radioanal. Nucl. Chem. 2021, 329, 1213–1221. [Google Scholar] [CrossRef] [Scilit]
  34. Sajid, A.; Anjum, M.; Younis, H.; Salouci, M.; Mehboob, K.; Haj Ismail, A. Assessment of Radon Concentration and Health Hazards in Natural Spring Water of a Sub-Himalayan District. Atmosphere 2024, 15, 940. [Google Scholar] [CrossRef] [Scilit]
  35. Al-Tamimi, M.H.; Abumurad, K.M. Radon Anomalies along Faults in North of Jordan. Radiat. Meas. 2001, 34, 397–400. [Google Scholar] [CrossRef] [Scilit]
  36. García, B.; Guevara-Pillaca, C.J.; Unsworth, M.; Pereyra, P.; Benavente, C.; Combey, A.; Palacios, D.; Palomino, A.; Ponce, R.; Rosell, L.; et al. Locating Active Faults in the Cusco Valley Using Magnetotelluric and Radon Gas Data. Tectonophysics 2025, 898, 230639. [Google Scholar] [CrossRef] [Scilit]
  37. Kang, G.; He, L.; He, Z.; Wu, X.; Guan, S. Radon Gas and Geomorphic Analysis as Supportive Tools for Fault Exploration: An Example from the Aba South Fault Basin, Western Sichuan. J. Radioanal. Nucl. Chem. 2024, 333, 5915–5926. [Google Scholar] [CrossRef] [Scilit]
  38. Khan, M.A.; Khattak, N.U.; Hanif, M. Radon Emission along Faults: A Case Study from District Karak, Sub-Himalayas, Pakistan. J. Radioanal. Nucl. Chem. 2022, 331, 1995–2003. [Google Scholar] [CrossRef] [Scilit]
  39. Sun, X.; Yang, P.; Xiang, Y.; Si, X.; Liu, D. Across-Fault Distributions of Radon Concentrations in Soil Gas for Different Tectonic Environments. Geosci. J. 2018, 22, 227–239. [Google Scholar] [CrossRef] [Scilit]
  40. Xuan, P.T.; Duong, N.A.; Van Chinh, V.; Dang, P.T.; Qua, N.X.; Pho, N. Van Soil Gas Radon Measurement for Identifying Active Faults in Thua Thien Hue (Vietnam). J. Geosci. Environ. Prot. 2020, 08, 44–64. [Google Scholar] [CrossRef]
  41. Zafar, W.A.; Ahmed, J.; Barkat, A.; Nabi, A.; Mahmood, R.; Manzoor, S.; Iqbal, T. Spatial Mapping of Radon: Implication for Fault Delineation. Geochem. J. 2018, 52, 359–371. [Google Scholar] [CrossRef] [Scilit]
  42. USEPA. The United States Environmental Protection Agency, National Primary Drinking Water Regulations for Radionuclides. EPA/570/9-91/700; Governmental Printing Office: Washington, DC, USA, 1991.
  43. WHO. The World Health Organization, Guidelines for Drinking-Water, Quality, 4th ed.; World Health Organization: Geneva, Switzerland, 2011. [Google Scholar]
  44. Bozkurt, E. Neotectonics of Turkey—A Synthesis. Geodin. Acta 2001, 14, 3–30. [Google Scholar] [CrossRef] [Scilit]
  45. Yön, B.; Onat, O.; Emin Öncü, M.; Karaşin, A. Failures of Masonry Dwelling Triggered by East Anatolian Fault Earthquakes in Turkey. Soil Dyn. Earthq. Eng. 2020, 133, 106126. [Google Scholar] [CrossRef] [Scilit]
  46. Şengör, A.M.C. The North Anatolian Transform Fault: Its Age, Offset and Tectonic Significance. J. Geol. Soc. Lond. 1979, 136, 269–282. [Google Scholar] [CrossRef] [Scilit]
  47. Şengör, A.M.C. Mid-Mesozoic Closure of Permo–Triassic Tethys and Its Implications. Nature 1979, 279, 590–593. [Google Scholar] [CrossRef] [Scilit]
  48. Koçyiǧit, A.; Deveci, Ş. A N-S-Trending Active Extensional Structure, the Şuhut (Afyon) Graben: Commencement Age of the Extensional Neotectonic Period in the Isparta Angle, SW Turkey. Turk. J. Earth Sci. 2007, 16, 391–416. [Google Scholar]
  49. Emre, O.; Duma, T.Y.; Doğan, A.; Özalp, S.; Tokay, F.; Kuşçu, I. Surface Faulting Associated with the Sultandagĭ Earthquake (Mw 6.5) of 3 February 2002, Southwestern Turkey. Seismol. Res. Lett. 2003, 74, 382–392. [Google Scholar] [CrossRef] [Scilit]
  50. Emre, Ö.; Duman, T.Y.; Özalp, S.; Olgun, Ş.; Elmacı, H. 1:250,000 Scale Active Fault Map Series of Turkey, Afyon (NJ 36-5) Quadrangle. Serial Number: 16; MTA: Ankara, Turkey, 2011.
  51. Özkaymak, Ç.; Sözbilir, H.; Geçievi, M.O.; Tiryakioğlu, İ. Late Holocene Coseismic Rupture and Aseismic Creep on the Bolvadin Fault, Afyon Akşehir Graben, Western Anatolia. Turk. J. Earth Sci. 2019, 28, 787–804. [Google Scholar] [CrossRef] [Scilit]
  52. PYLON. Vacuum Water-Degassing System Manual; A900037 Rev. 2; Pylon Electronic Development Company Ltd.: Ottawa, ON, Canada, 1991. [Google Scholar]
  53. Calin, M.R.; Ion, A.C.; Radulescu, I.; Simion, C.A.; Mincu, M.M.; Ion, I. Analysis of the Radon Concentrations in Natural Mineral and Tap Water Using Lucas Cells Technique. J. Environ. Eng. Landsc. Manag. 2022, 30, 370–379. [Google Scholar] [CrossRef] [Scilit]
  54. WHO. The World Health Organization, Guidelines for Drinking-Water Quality, 3rd ed.; Volume 1: Recommendations; World Health Organization: Geneva, Switzerland, 2004. [Google Scholar]
  55. Husen, J.M.; Hassan, H.J. Evaluation of Radiological Hazards and Annual Effective Dose from Radon and Toxic Elements in Groundwater of Sulaymaniyah Governorate, Iraq. J. Radiat. Res. Appl. Sci. 2026, 19, 102282. [Google Scholar] [CrossRef] [Scilit]
  56. ICRP—International Commission on Radiological Protection. The 2007 recommendations of the International Commission on Radiological Protection (ICRP Publication 103). In Annals of the ICRP; ICRP: Oxford, UK, 2007; Volume 37. [Google Scholar]
  57. Yalım, H.A.; Sandıkcıoglu, A.; Ünal, R.; Orhun, Ö. Measurements of Radon Concentrations in Well Waters near the Akşehir Fault Zone in Afyonkarahisar, Turkey. Radiat. Meas. 2007, 42, 505–508. [Google Scholar] [CrossRef] [Scilit]
  58. Sittitanadol, I.; Prakhammin, K.; Somtua, J.; Atyotha, V. Age-Specific Assessment of Annual Effective Dose and Excess Lifetime Cancer Risk from Radon in Tap Water of Mueang Ubon Ratchathani, Thailand. Appl. Radiat. Isot. 2026, 230, 112455. [Google Scholar] [CrossRef] [Scilit] [PubMed]
  59. Mamun, A.; Alazmi, A.S. Investigation of Radon in Groundwater and the Corresponding Human-Health Risk Assessment in Northeastern Saudi Arabia. Sustainability 2022, 14, 14515. [Google Scholar] [CrossRef] [Scilit]
  60. Sahoo, S.K.; Perumal, B.C.; Vaishali, R.; Maripireddy, A.; Katlamudi, M. Assessment of Radon Concentration in Groundwater and Its Human Health Implications: A Case Study of Gandhinagar, Gujarat, India. Environ. Geochem. Health 2025, 47, 301. [Google Scholar] [CrossRef] [Scilit] [PubMed]
  61. Dankawu, U.M.; Shuaibu, H.Y.; Maharaz, M.N.; Zangina, T.; Lariski, F.M.; Ahmadu, M.; Zarma, S.S.; Benedict, J.N.; Uzair, M.; Adamu, G.D.; et al. Estimation of Excess Life Cancer Risk and Annual Effective Dose for Boreholes and Well Water in Dutse, Jigawa State Nigeria. Dutse J. Pure Appl. Sci. 2022, 7, 209–218. [Google Scholar] [CrossRef] [Scilit]
  62. Shah, S.S.A.; Asif, A.R.; Ilahi, M.; Haroon, H.; Islam, I.; Qadir, A.; Nisar, I.; Sani, M.M.U.; Iqbal, R.; Rahman, M.H.u.; et al. Geographical Distribution of Radon and Associated Health Risks in Drinking Water Samples Collected from the Mulazai Area of Peshawar, Pakistan. Sci. Rep. 2024, 14, 6042. [Google Scholar] [CrossRef] [Scilit] [PubMed]
  63. Yakut, H.; Tabar, E.; Zenginerler, Z.; Demirci, N.; Ertugral, F. Measurement of 222Rn Concentration in Drinking Water in Sakarya, Turkey. Radiat. Prot. Dosim. 2013, 157, 397–406. [Google Scholar] [CrossRef] [Scilit] [PubMed]
  64. Bello, I.A.; Vatsa, A.M.; Momoh, H.A.; Abadunmi, T.; Bello, A.A. Health Risk Assessment of Radon Exposure through Drinking Water in Iluagba, Kogi State, Nigeria. Isot. Environ. Health Stud. 2026, 1–13. [Google Scholar] [CrossRef] [Scilit] [PubMed]
  65. Kolo, M.T.; Olarinoye, O.; Salihu, S.O.; Ugwuanyi, H.A.; Onuche, P.; Falade, O.; Chibueze, N. Annual Effective Dose and Excess Lifetime Cancer Risk Due to Ingestion and Inhalation of Radon in Groundwater of Bosso Community Minna, North-Central Nigeria. J. Niger. Soc. Phys. Sci. 2023, 5, 896. [Google Scholar] [CrossRef] [Scilit]
  66. Singh, S.; Malyan, S.K.; Singh, K.; Kashyap, S.; Singh, R.; Rai, S.P.; Kumar, S.; Kumar, P. Contamination Profile and Potential Human Health Risks of Radon in Groundwater of Southwest Region of Punjab, India. Environ. Geochem. Health 2025, 47, 430. [Google Scholar] [CrossRef] [Scilit] [PubMed]
  67. Anurani, G.R.; Sukanya, S.; Joseph, S.; Selvakumar, S. Radiological Risk Assessment of Radon in Groundwater of a Tropical River Basin, SW India: Integrating Deterministic and Probabilistic Approaches. Environ. Geochem. Health 2025, 47, 540. [Google Scholar] [CrossRef] [Scilit] [PubMed]
  68. Sahoo, S.K.; Katlamudi, M.; Gakka, U.L. Singular Spectrum Analysis on Soil Radon Time Series (222 Rn) in Kachchh, Gujarat, India: Detection of Periodic Oscillations and Earthquake Precursors. Arab. J. Geosci. 2020, 13, 973. [Google Scholar] [CrossRef] [Scilit]
  69. Isinkaye, M.O.; Matthew-Ojelabi, F.; Adegun, C.O.; Fasanmi, P.O.; Adeleye, F.A.; Olowomofe, O.G. Annual Effective Dose from 222Rn in Groundwater of a Nigeria University Campus Area. Appl. Water Sci. 2021, 11, 85. [Google Scholar] [CrossRef] [Scilit]
  70. Gümbür, S.; Küçükönder, E. Radiological Risk Assessment Due to Radon in Bottled Drinking Water Sold in Kahramanmaraş Town, Turkiye. Isot. Environ. Health Stud. 2025, 61, 273–281. [Google Scholar] [CrossRef] [Scilit] [PubMed]
  71. Mbembe, S.M.; Mbembe, B.A.; Maya, J.; Mohamadou, L.L.; Boubakari, M. Preliminary Studies on 222Rn Concentration in Groundwater of Yaounde, Cameroon. J. Appl. Math. Phys. 2021, 09, 1423–1433. [Google Scholar] [CrossRef]
  72. Gopala, J.; Madhura, R.; Dongre, S.; Suresh, S.; Srinivasa, E.; Sannappa, J. Study on Radon Concentration and Physicochemical Parameters in Groundwater of Tobacco-Growing Villages around Periyapatna Taluk, Karnataka State, India. Radiat. Prot. Environ. 2025, 48, 182–197. [Google Scholar] [CrossRef] [Scilit]
  73. Sukanya, S.; Noble, J.; Joseph, S. Factors Controlling the Distribution of Radon (222Rn) in Groundwater of a Tropical Mountainous River Basin in Southwest India. Chemosphere 2021, 263, 128096. [Google Scholar] [CrossRef] [Scilit] [PubMed]
  74. Martins, L.; Pereira, A.; Oliveira, A.; Fernandes, A.; Sanches Fernandes, L.F.; Pacheco, F.A.L. An Assessment of Groundwater Contamination Risk with Radon Based on Clustering and Structural Models. Water 2019, 11, 1107. [Google Scholar] [CrossRef] [Scilit]
  75. USEPA. The United States Environmental Protection Agency, Establishment of Cleanup Levels for CERCLA Sites with Radioactive Contamination; (OSWER Directive 9200.4-18); USEPA: Washington, DC, USA, 1997. [Google Scholar]
  76. USEPA. Risk Assessment: Guidance for Superfund Volume 1 Human Health Evaluation Manual (Part A); USEPA: Washington, DC, USA, 1989.
  77. Arabi, A.S.; Funtua, I.I.; Dewu, B.B.M.; Kwaya, M.Y.; Kurowska, E.; Hauwau Kulu, S.; Abdulhamid, M.S.; Mahed, G. Geology, Lineaments, and Sensitivity of Groundwater to Radon Gas Contamination. Sustain. Water Resour. Manag. 2018, 4, 643–653. [Google Scholar] [CrossRef] [Scilit]
  78. Nakano-Ohta, T.; Saito, T.; Sato, J. Seasonal Variation in 222Rn Concentration of Groundwater Observed at Kawasaki. Radioisotopes 2005, 54, 593–597. [Google Scholar] [CrossRef] [Scilit]
  79. Seminsky, K.Z.; Seminsky, A.K. Radon Concentration in Groundwater Sources of the Baikal Region (East Siberia, Russia). Appl. Geochem. 2019, 111, 104446. [Google Scholar] [CrossRef] [Scilit]
  80. Rengan, A.G.; Joseph, S.; Sellamuthu, S. Seasonal and Geological Controls of Radon (222Rn) in Groundwater of Vamanapuram River Basin, SW India. Geocarto Int. 2022, 37, 18448–18473. [Google Scholar] [CrossRef] [Scilit]
  81. Belgacem, A.; Souid, F.; Telahigue, F.; Kharroubi, A. Temperature and Radon-222 as Tracer of Groundwater Flow: Application to El Hamma Geothermal Aquifer System, Southeastern Tunisia. Arab. J. Geosci. 2015, 8, 11161–11174. [Google Scholar] [CrossRef] [Scilit]
Figure 1. (a) Location of the study area and major active fault systems. (b) Active fault map of the Afyon–Akşehir Graben (AAG), adapted from [50,51], with sampling locations added. Abbreviations: KG, Karamık Graben; GF, Gecek Fault; GGF, Gazlıgöl Fault; EF, Erkmen Fault; KF, Karahisar Fault; ÇFZ, Çobanlar Fault Zone; IsFZ, Işıklar Fault Zone; YFZ, Yunak Fault Zone; IF, Ilgın Fault; BF, Bolvadin Fault; BkF, Büyük Karabağ Fault; ÇuF, Çukurcak Fault; YF, Yarıkkaya Fault; KoF, Kocbeyli Fault; TF, Tatarlı Fault.
Toxics 14 00670 g001
Figure 2. Schematic diagram of the WG-1001 water–gas separation unit and the Lucas scintillation cell-based radon measurement system [53].
Toxics 14 00670 g002
Figure 3. Photographs of the equipment used for 222Rn measurements: (a) WG-1001 vacuum water–gas separation unit and (b) AB-5R radiation monitor.
Toxics 14 00670 g003
Figure 4. Mean 222Rn concentrations measured in the investigated drinking water wells. The red dashed line indicates the USEPA guideline value of 11 Bq L−1 [42].
Toxics 14 00670 g004
Figure 5. Relationship between mean 222Rn concentration and electrical conductivity (EC) in the investigated groundwater wells. Spearman rank correlation analysis indicated a moderate positive correlation (ρ = 0.529, p = 0.043).
Toxics 14 00670 g005
Figure 6. Annual effective dose from ingestion of groundwater for infants, children and adults at the sampled wells (W1–W15). The red dashed line indicates the WHO guideline value of 100 µSv y−1 [54].
Toxics 14 00670 g006
Figure 7. Seasonal variation in mean 222Rn activity concentrations in the investigated drinking water wells during the one-year monitoring period.
Toxics 14 00670 g007
Table 1. Geographic locations and selected hydrogeological and physicochemical characteristics of the drinking-water wells sampled in the Sultandağı Fault Zone, Türkiye, including their distances to the nearest mapped fault.
Well IDLocation NameLat. (°N)Long. (°E)Alt. (m)Depth (m)pHEC
(µS cm−1)
Water Temp. (°C)Fault Dist. (km)
W1Ali İhsan Paşa38.711030.605510081177.4465419.55.4
W2Salar38.714130.625810081006.651540214.75
W3Sülümenli38.675930.73721000457.11107414.97.1
W4Heybeli38.645830.834210012806.91377430.17
W5Maltepe38.607030.90981005ND7.331032200.13
W6Kadıköy38.637330.9185988507.9201015.33.27
W7Çobanlar 138.640230.86879766007.08153427.12.9
W8Çobanlar 238.641230.86869827007.55226202.97
W9Cumhuriyet38.602030.9386998858.734216.80.07
W10Ali Kaleli38.597930.98829881208.2342415.30.97
W11Çay38.597131.041510231608.15704121.09
W12Çayırpınar38.590031.09519961007.6572216.21.59
W13Kocaoğuz38.609331.1623983808.3357144.62
W14Yakasenek38.579931.22519912008.142215.35.72
W15Dereçine 38.501231.26801015107.9550018.81.56
ND = no data available.
Table 2. Minimum, maximum and annual mean (±SD) 222Rn activity concentrations measured in drinking-water wells during the one-year monitoring period, as well as the corresponding age-dependent annual effective doses (AEDs) and excess lifetime cancer risks (ELCRs).
Well ID222Rn Concentrations
Bq L−1
Annual Effective Doses
(μSv y−1)
ELCR ( × 10−4)
MinMaxMean ± SD InfantsChildrenAdultsInfantsChildrenAdults
W10.3911.202.37 ± 2.0213.905.096.040.490.180.21
W20.1626.6413.59 ± 5.8679.8629.2734.722.801.021.22
W31.0115.528.82 ± 3.1151.8318.9922.531.810.660.79
W40.8512.775.06 ± 1.9229.7510.9012.931.040.380.45
W50.56.772.45 ± 1.0814.375.276.250.500.180.22
W62.128.285.97 ± 1.6435.0912.8615.261.230.450.53
W70.1315.248.96 ± 5.8952.6519.2922.891.840.680.80
W80.167.434.23 ± 2.7224.869.1110.810.870.320.38
W90.6212.114.84 ± 2.9628.4410.4212.371.000.360.43
W100.5512.764.82 ± 3.8228.3210.3812.310.990.360.43
W110.113.286.30 ± 4.0737.0313.5716.101.300.470.56
W120.7810.856.96 ± 3.1940.9315.0017.791.430.520.62
W130.0511.406.68 ± 3.0939.2514.3817.071.370.500.60
W140.8110.355.14 ± 2.2230.2211.0713.141.060.390.46
W152.912.355.55 ± 1.9732.6211.9514.181.140.420.50
Mean 6.12 ± 2.7935.9413.1715.631.260.460.55
Table 4. Spearman correlation coefficients between mean 222Rn concentrations and selected hydrogeological and structural parameters.
ParameterSpearman’s ρp-Value
Depth−0.2730.345
pH−0.2390.39
EC0.5290.043
Water temperature−0.160.57
Distance to nearest mapped fault (km)0.3610.187
Disclaimer/Publisher’s Note: The statements, opinions and data contained in all publications are solely those of the individual author(s) and contributor(s) and not of MDPI and/or the editor(s). MDPI and/or the editor(s) disclaim responsibility for any injury to people or property resulting from any ideas, methods, instructions or products referred to in the content.