3.1. Characteristics of Potentially Toxic Element Pollution
PTE concentrations in surface dust from bus stops and parking lots in Binzhou City are shown in
Table 5. In bus stop dust, the concentrations (mean ± standard deviation) of As, Zn, Pb, Cu, Cd, Cr, Ni, and Mn were 4.43 ± 1.31, 284.71 ± 84.47, 54.21 ± 34.20, 57.70 ± 32.78, 0.39 ± 0.37, 77.57 ± 56.67, 26.88 ± 11.18, and 387.26 ± 87.87 mg/kg, respectively, with a descending order of Mn > Zn > Cr > Cu > Pb > Ni > As > Cd. In parking lot dust, the concentrations were 3.63 ± 1.27, 234.59 ± 103.38, 89.03 ± 86.52, 34.07 ± 19.55, 0.28 ± 0.21, 71.04 ± 32.03, 24.85 ± 12.09, and 463.71 ± 92.17 mg/kg, respectively, following the order of Mn > Zn > Pb > Cr > Cu > Ni > As > Cd. Compared with the soil background values of Binzhou City, the contents of As, Ni, and Mn in dusts from both bus stops and parking lots were lower than corresponding reference values, while those of Zn, Pb, Cu, Cd, and Cr exceeded the associated values. In bus stops, Zn, Pb, Cu, Cd, and Cr were 4.12, 2.45, 2.42, 2.65, and 1.13 times the background values, respectively, and those in parking lots were 3.39, 4.03, 1.43, 1.90, and 1.04 times the background values, respectively. This indicated that some metal elements were mainly from natural sources, while others might have external input problems.
Table 6 lists the PTE concentrations in road dusts from different regions. It could be observed that the levels of most elements in the present study were lower than those in other regions. Only a few elements showed relative higher levels. For example, Zn, Cu, and Cd were higher than in Chongqing [
38], Pb was higher than in Beijing [
36], Cr was higher than in Nanjing [
39], Guangzhou [
40], and Chongqing [
38], Ni was slightly higher than in Beijing [
36] and Guangzhou [
40], and Mn was slightly higher than in Guangzhou [
40]. The ranking order of metal concentrations in road dusts varied among different regions because of the complex effects of both natural conditions and anthropogenic factors.
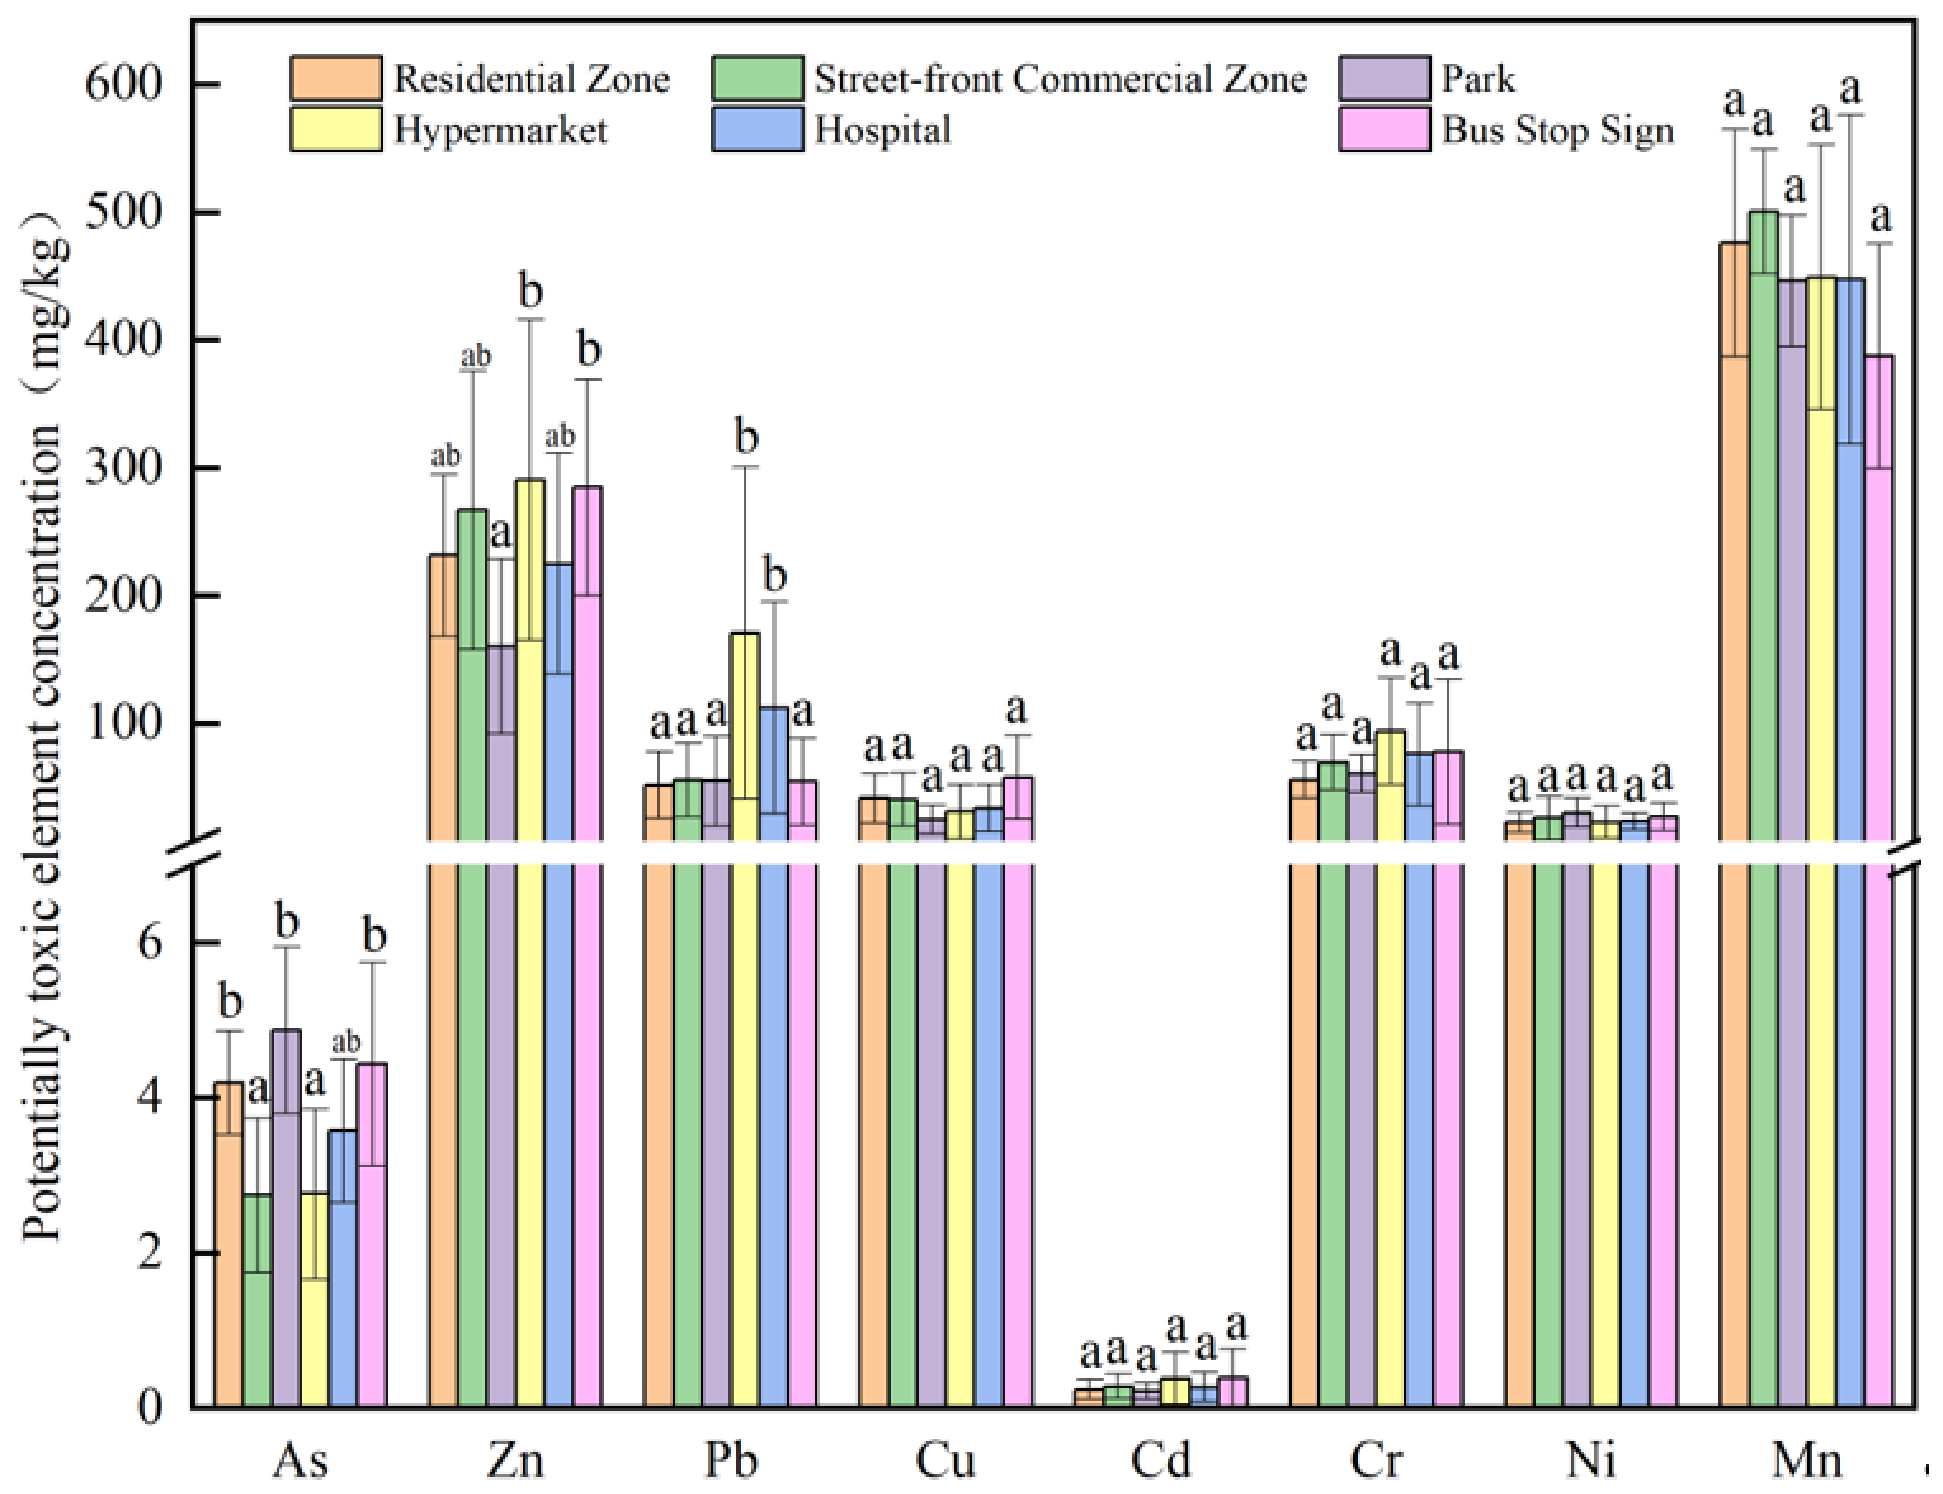
The pollution levels of PTEs in dusts from parking lots in different functional areas (residential, street-front, park, hypermarket, and hospital) and bus stops are shown in
Figure 2. Overall, Mn had the highest concentration, followed by Zn, and Cd had the lowest. The PTE concentrations decreased following different orders. In detail, in the parking lots, Mn > Zn > Cr > Pb > Cu > Ni > As > Cd, which was also observed for residential and street-front areas; Mn > Zn > Cr > Pb > Ni > Cu > As > Cd was observed for parks and Mn > Zn > Pb > Cr > Cu > Ni > As > Cd for hypermarkets and hospitals. The ANOVA results showed that As concentrations in residential areas, parks, and bus stops were significantly higher than in street-front areas and hypermarkets (
p < 0.05); Zn concentrations in hypermarkets and bus stops were significantly higher than in parks (
p < 0.05); Pb concentrations in hypermarkets and hospitals were significantly higher than in other functional areas (
p < 0.05), while Cu, Cd, Cr, Ni, and Mn concentrations showed no significant differences among functional areas (
p > 0.05).
Such PTE concentration discrepancies were closely associated with Binzhou’s industrial structure, traffic conditions, and urban development status. As a typical emerging industrial city in the Yellow River Delta, Binzhou was mainly dominated by light manufacturing, agricultural processing, and chemical supporting industries, without large-scale heavy metallurgy, non-ferrous smelting, and high-pollution automobile manufacturing industries, which caused serious PTE accumulation in megacities like Shanghai and Xi’an [
41,
42], and which fundamentally limited the urban dust PTE pollution level. In terms of traffic, Binzhou had far fewer vehicle holdings and road traffic volumes than first-tier and provincial capital cities [
36,
39]. Strict road dust and emission control policies reduced continuous traffic-related PTE emissions [
43], whereas frequent vehicle braking and start–stop activities in residential and commercial areas triggered local enrichment of PTEs. In terms of urban construction, most sampling sites were newly built urban areas with complete road renovation and regular cleaning, which effectively reduced the accumulation of historical traffic pollutants compared with the old industrial urban areas [
24,
41]. Geologically, the Yellow River Delta was covered by alluvial loam with low PTE background values, leading to weak natural geological interference on surface dust pollution. Atmospheric transport of trace pollutants from surrounding chemical parks only formed local pollution hotspots instead of city-wide high PTE concentrations.
Table 6.
Potentially toxic element concentrations in road dust from this study and other cities (mg/kg).
Table 6.
Potentially toxic element concentrations in road dust from this study and other cities (mg/kg).
| Cities/Country | As | Zn | Pb | Cu | Cd | Cr | Ni | Mn | References |
|---|
| Binzhou, China | 4.03 | 259.65 | 71.62 | 45.89 | 0.34 | 74.31 | 25.87 | 425.49 | This study |
| Yenimahalle, Ankara | - | 97.98 | 55.22 | 3.81 | 52.45 | 66.88 | 38.37 | - | [15] |
| Multan, Pakistan | 18.91 | 257.35 | 53.43 | 49.46 | - | 90.15 | 38.6 | 38.19 | [24] |
| Karachi, Pakistan | - | 4254.40 | 426.60 | 332.90 | 62.30 | 148.10 | 389.70 | - | [44] |
| Delhi, India | | 365.92 | 597.63 | 512.28 | 18.94 | 4816.94 | - | - | [45] |
| Luanda, Angola | 5 | 317 | 351 | 42 | 1.1 | 26 | 10 | - | [46] |
| Narayanganj Sadar, Bangladesh | - | - | 56.35 | 247.86 | 3.53 | 317.25 | 53.26 | 227.18 | [23] |
| Dhaka, Bangladesh | 8.09 | 239.16 | 18.99 | 49.68 | 11.64 | 144.34 | 37.01 | - | [43] |
| Toronto, Canada | - | 200.3 | 182.8 | 162 | 0.51 | 197.9 | 58.8 | 1202.2 | [47] |
| Abeokuta, Nigeria | 0.64 | 197.68 | 96.12 | 67.84 | 1.54 | 50.75 | 15.71 | - | [25] |
| Kaifeng, China | 8.66 | 287.07 | 172.67 | 76.25 | 0.74 | 126.48 | 27.68 | - | [48] |
| Xiangtan, China | - | 536.80 | 549.63 | 91.30 | 0.43 | 115.60 | - | - | [49] |
| Beijing, China | - | - | 50.79 | 63.73 | 0.47 | 77.36 | 23.60 | 564.12 | [36] |
| Xian, China | 78.67 | 279.00 | 119.73 | 50.66 | 8.82 | 138.35 | 30.99 | - | [41] |
| Shanghai, China | - | 687.25 | 212.94 | 186.41 | 0.97 | 218.91 | 64.91 | - | [50] |
| Nanjing, China | - | 302.7 | 82.65 | 102.83 | 4.37 | 67.13 | 46.24 | - | [39] |
| Guangzhou, China | - | - | 84.1 | 102 | - | 64.3 | 23.6 | 411 | [40] |
| Chongqing, China | - | 82.05 | 86.88 | 22.56 | 0.07 | 57.63 | 90.65 | - | [38] |
3.2. Spatial Distribution of Potentially Toxic Elements
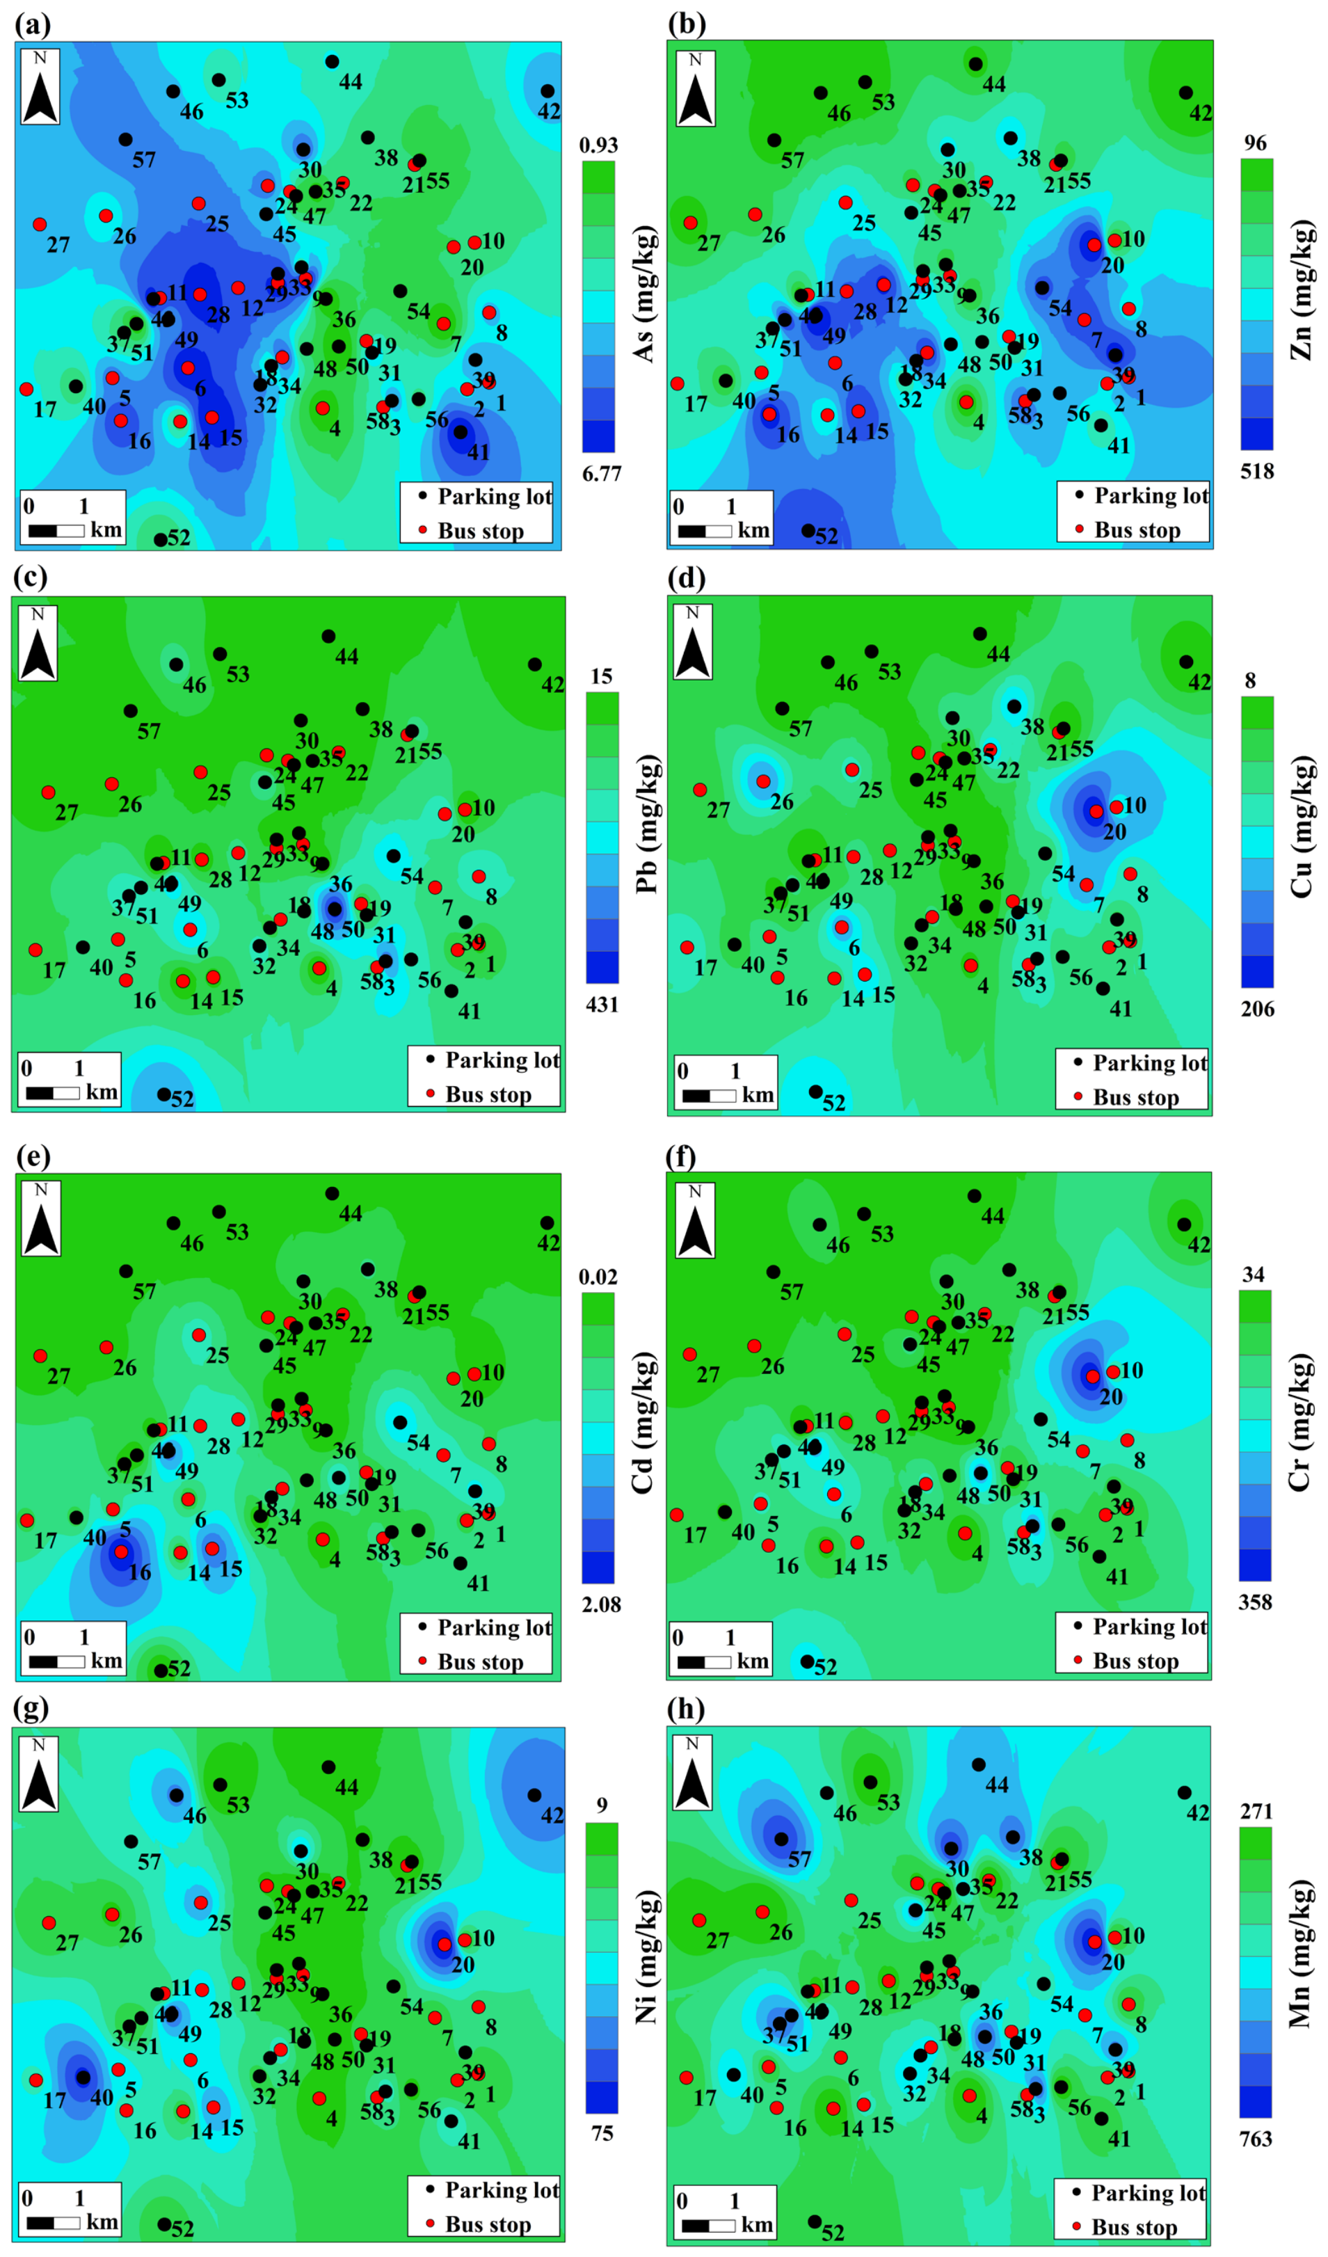
The spatial distribution of eight potentially toxic elements in surface dust from bus stops and parking lots was mapped via Kriging interpolation (
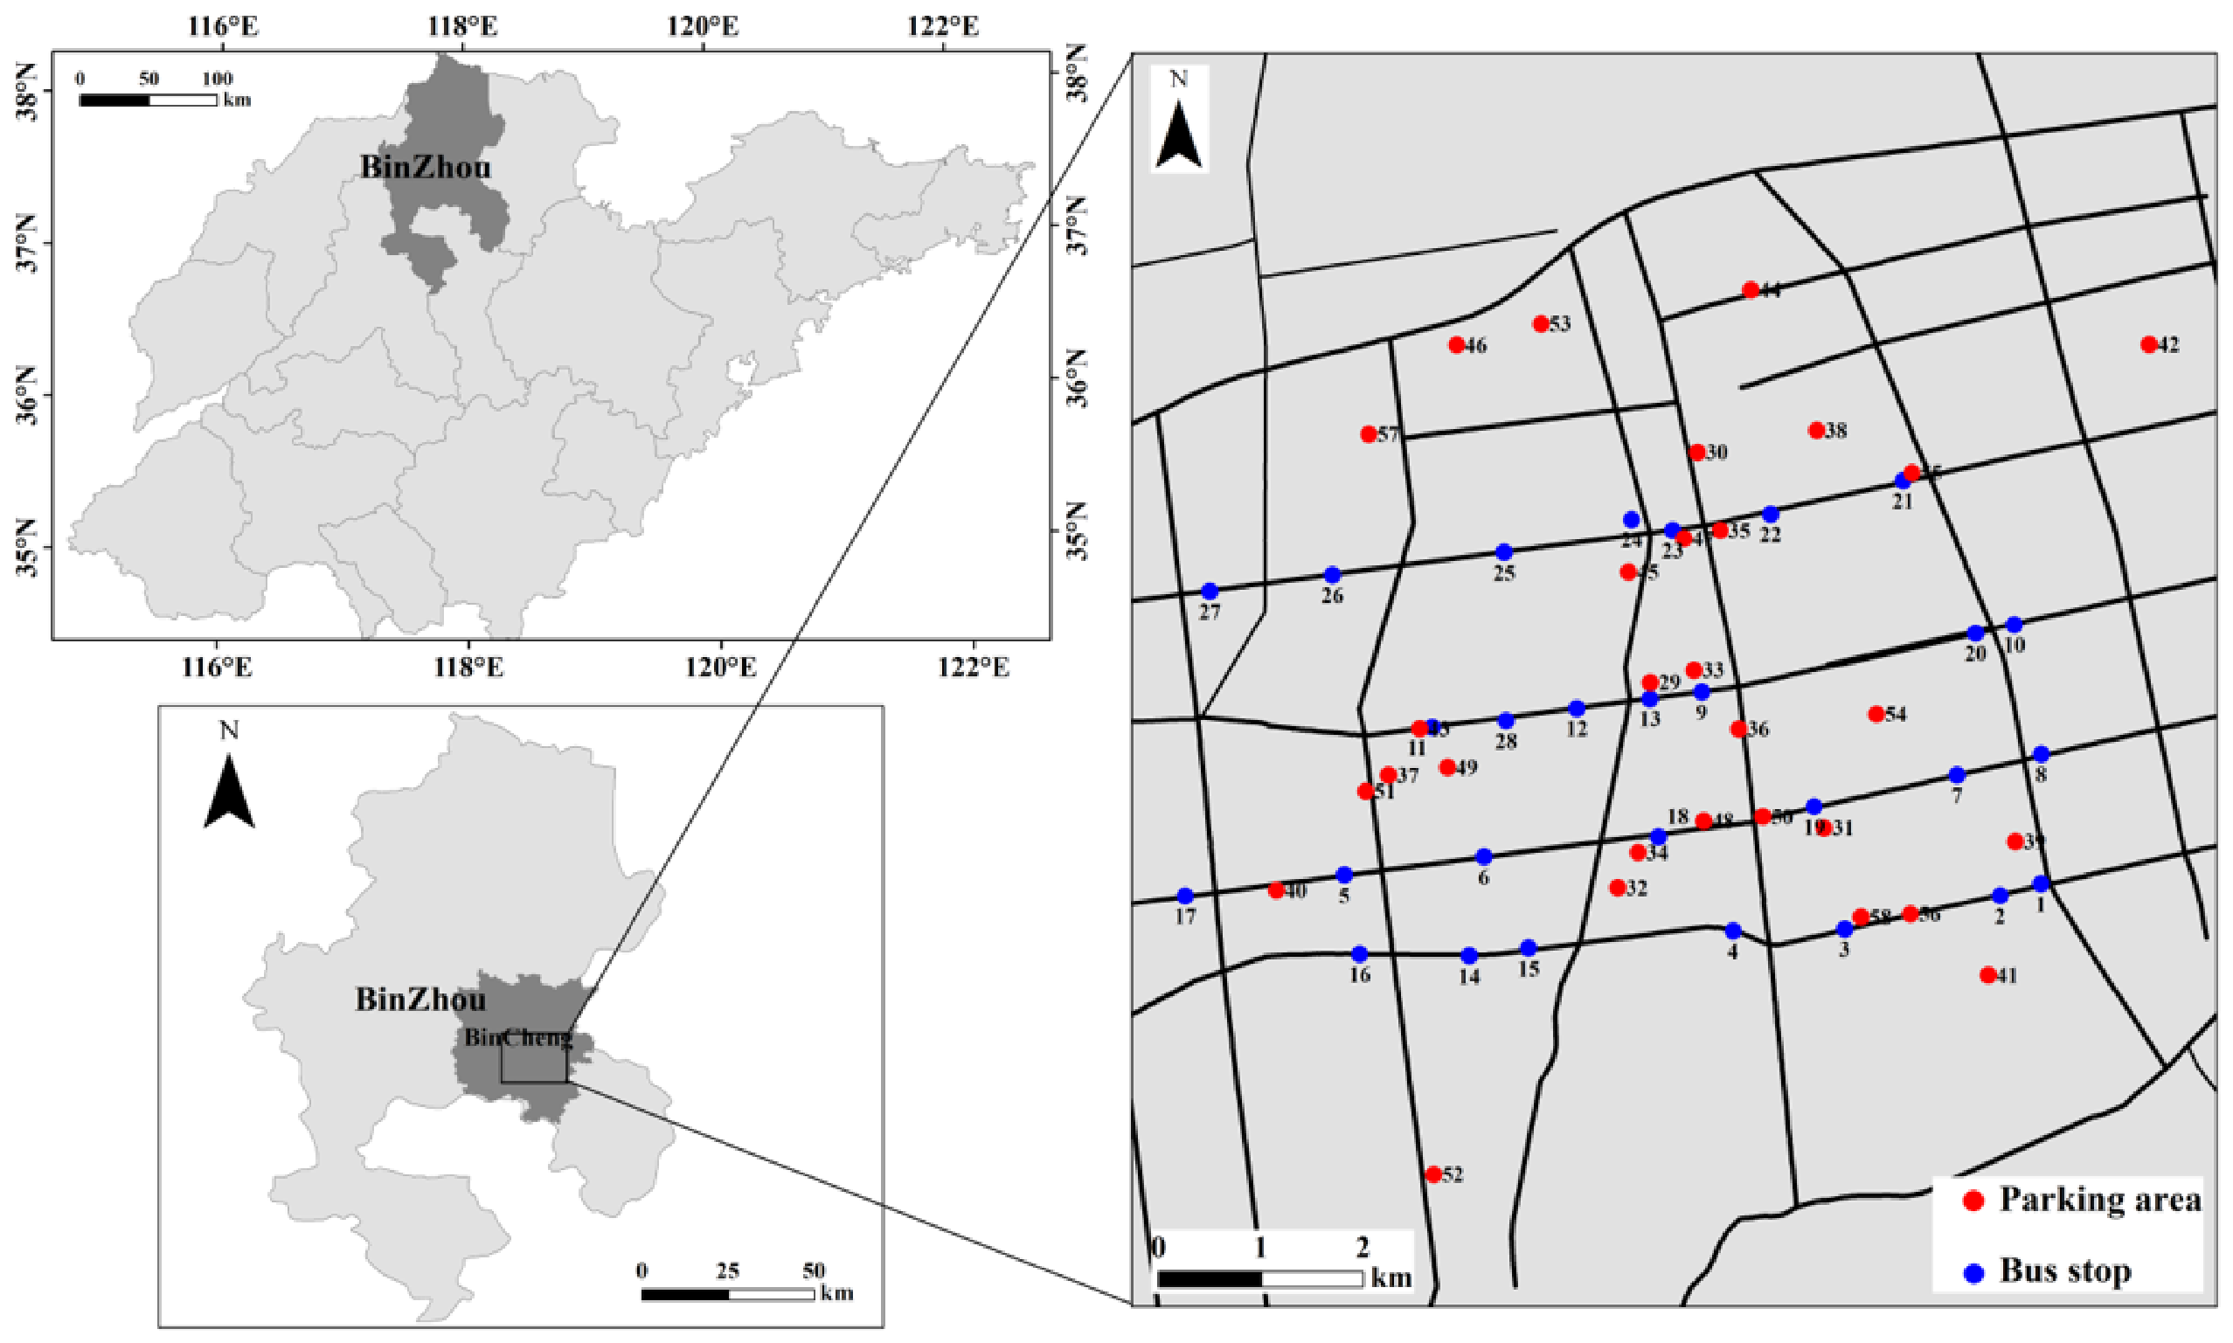
Figure 3). Except for As and Zn, the remaining elements exhibited obvious spatial differentiation characteristics of point-source pollution, and the high-value enrichment zones of different PTEs varied markedly. Overall, As, Zn, Ni and Mn were enriched at both functional zones (bus stops and parking lots) with widespread spatial distribution. The other four elements displayed distinct accumulation restricted to a single functional zone: Cu, Cd and Cr mainly accumulated at bus stops, while Pb was concentrated in parking lots and urban hypermarkets. Notably, Site 20 (a bus stop) presented synergistic high concentrations of Zn, Cu, Cr, Ni and Mn. Apart from contributions from typical traffic sources such as vehicle mechanical abrasion and exhaust emissions, this sampling site is adjacent to the Binbei Industrial Park. Dust deposition derived from industrial activities along the periphery constitutes a critical factor leading to multi-element co-enrichment and superimposed pollution at this location. As showed a typical area-source pollution pattern, with its hotspots mostly distributed at bus stops; seven high-As zones in the study area corresponded to bus stations, and only Parking Lot No. 41 was a local high-concentration point for As. High-value Zn sites occurred in both functional zones, including eight hotspots at bus stops and five at parking lots. Zn possessed a more scattered spatial distribution and relatively weak differentiation between the two functional zones.
Combined with the results of Q-mode hierarchical cluster analysis (HCA,
Figure S1), the dust PTE pollution characteristics of bus stops and parking lots partially overlapped with similar enrichment rules of some elements, yet significant overall pollution differentiation existed between them. Such discrepancies mainly stemmed from differences in human activity patterns, vehicle flow conditions and supporting facilities at the two types of sites. At bus stops, frequent vehicle starting and stopping and dense pedestrian flow led to continuous inputs of abrasion debris from brake pads and tires, in addition to traffic exhaust, resulting in prominent accumulation of traffic-derived PTEs, including Cu, Cd and Cr. In contrast, vehicles stayed in idle or low-speed parking states for much longer in parking lots, and superimposed domestic pollution sources from surrounding parking lots contributed to higher Pb concentrations. Furthermore, spatial variations in industrial and commercial surroundings around the two functional zones further aggravated the divergent spatial distribution patterns of potentially toxic elements.
3.3. Source Identification of Potentially Toxic Elements
Potentially toxic elements in dust are influenced by both natural and anthropogenic factors, and similarities in their sources can lead to certain correlations between different elements [
43,
46]. Pearson’s correlation analysis results for PTEs in dust from bus stops and parking lots are shown in
Table 7 and
Table 8, respectively. It could be observed that in bus stops, As was not correlated with any other elements; Cd was only positively correlated with Zn; and all the other elements showed significant (
p < 0.05) or extremely significant (
p < 0.01) correlations from each other. This suggested that the sources of the PTEs varied and most elements had similar sources or environmental behaviors. In parking lots, As was only positively correlated to Ni; Ni also showed a significant correlation with Cd; Mn only showed a significant relationship with Cr; Cu showed significant relationships with Zn and Cr; other elements showed significant or extremely significant relationships. This indicated the sources of PTEs in dusts from those parking lots might be more complex.
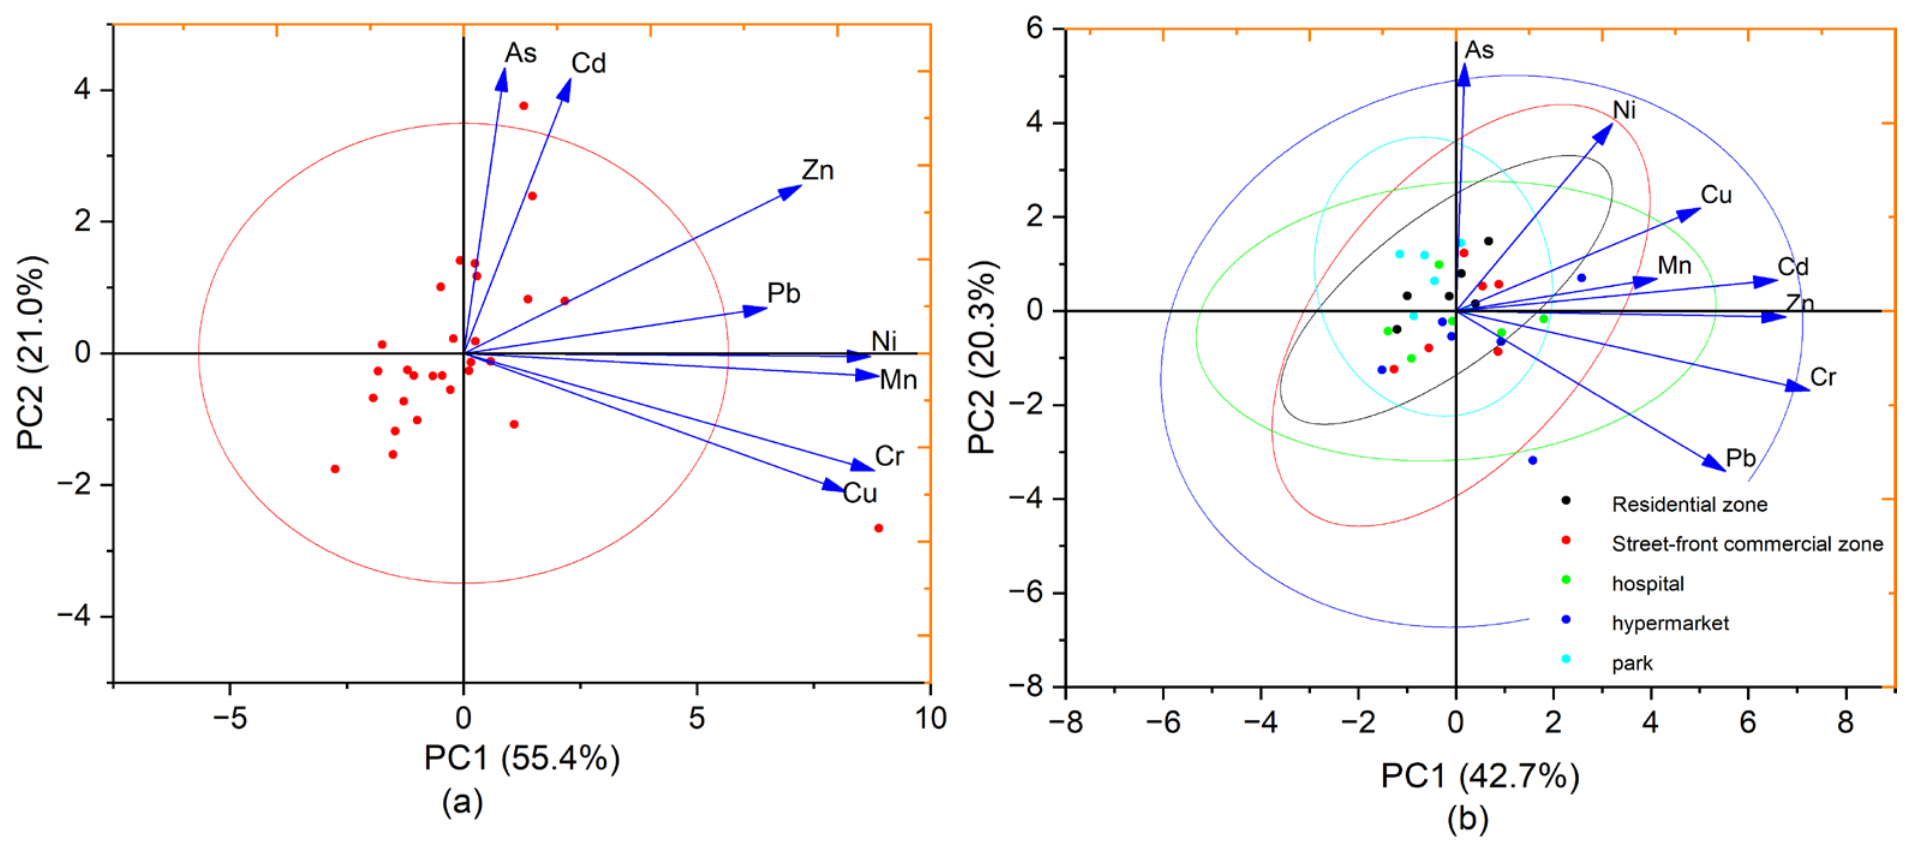
The results of principal component analysis (PCA,
Figure 4 and
Figure S2) and hierarchical cluster analysis (HCA,
Figure S1) further clarified the co-occurrence patterns of potentially toxic element at bus stop and parking lot sampling sites. Samples from parking lots and bus stops differed slightly in spatial distribution, revealing distinct potential toxic elements pollution characteristics for the two site types. Bus stop samples featured a wider distribution range and higher dispersion, whereas parking lot samples showed tighter aggregation with more uniform pollution signatures.
Based on the loading characteristics of each element, samples collected from bus stops could be classified into four elemental assemblages (
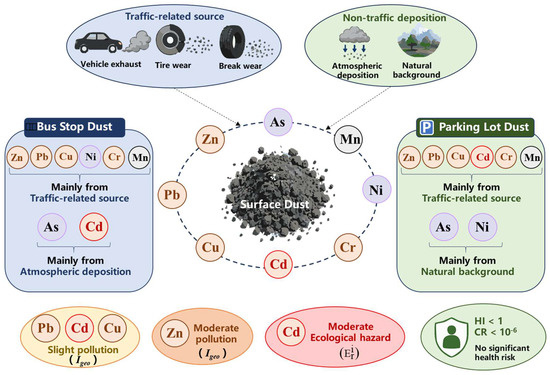
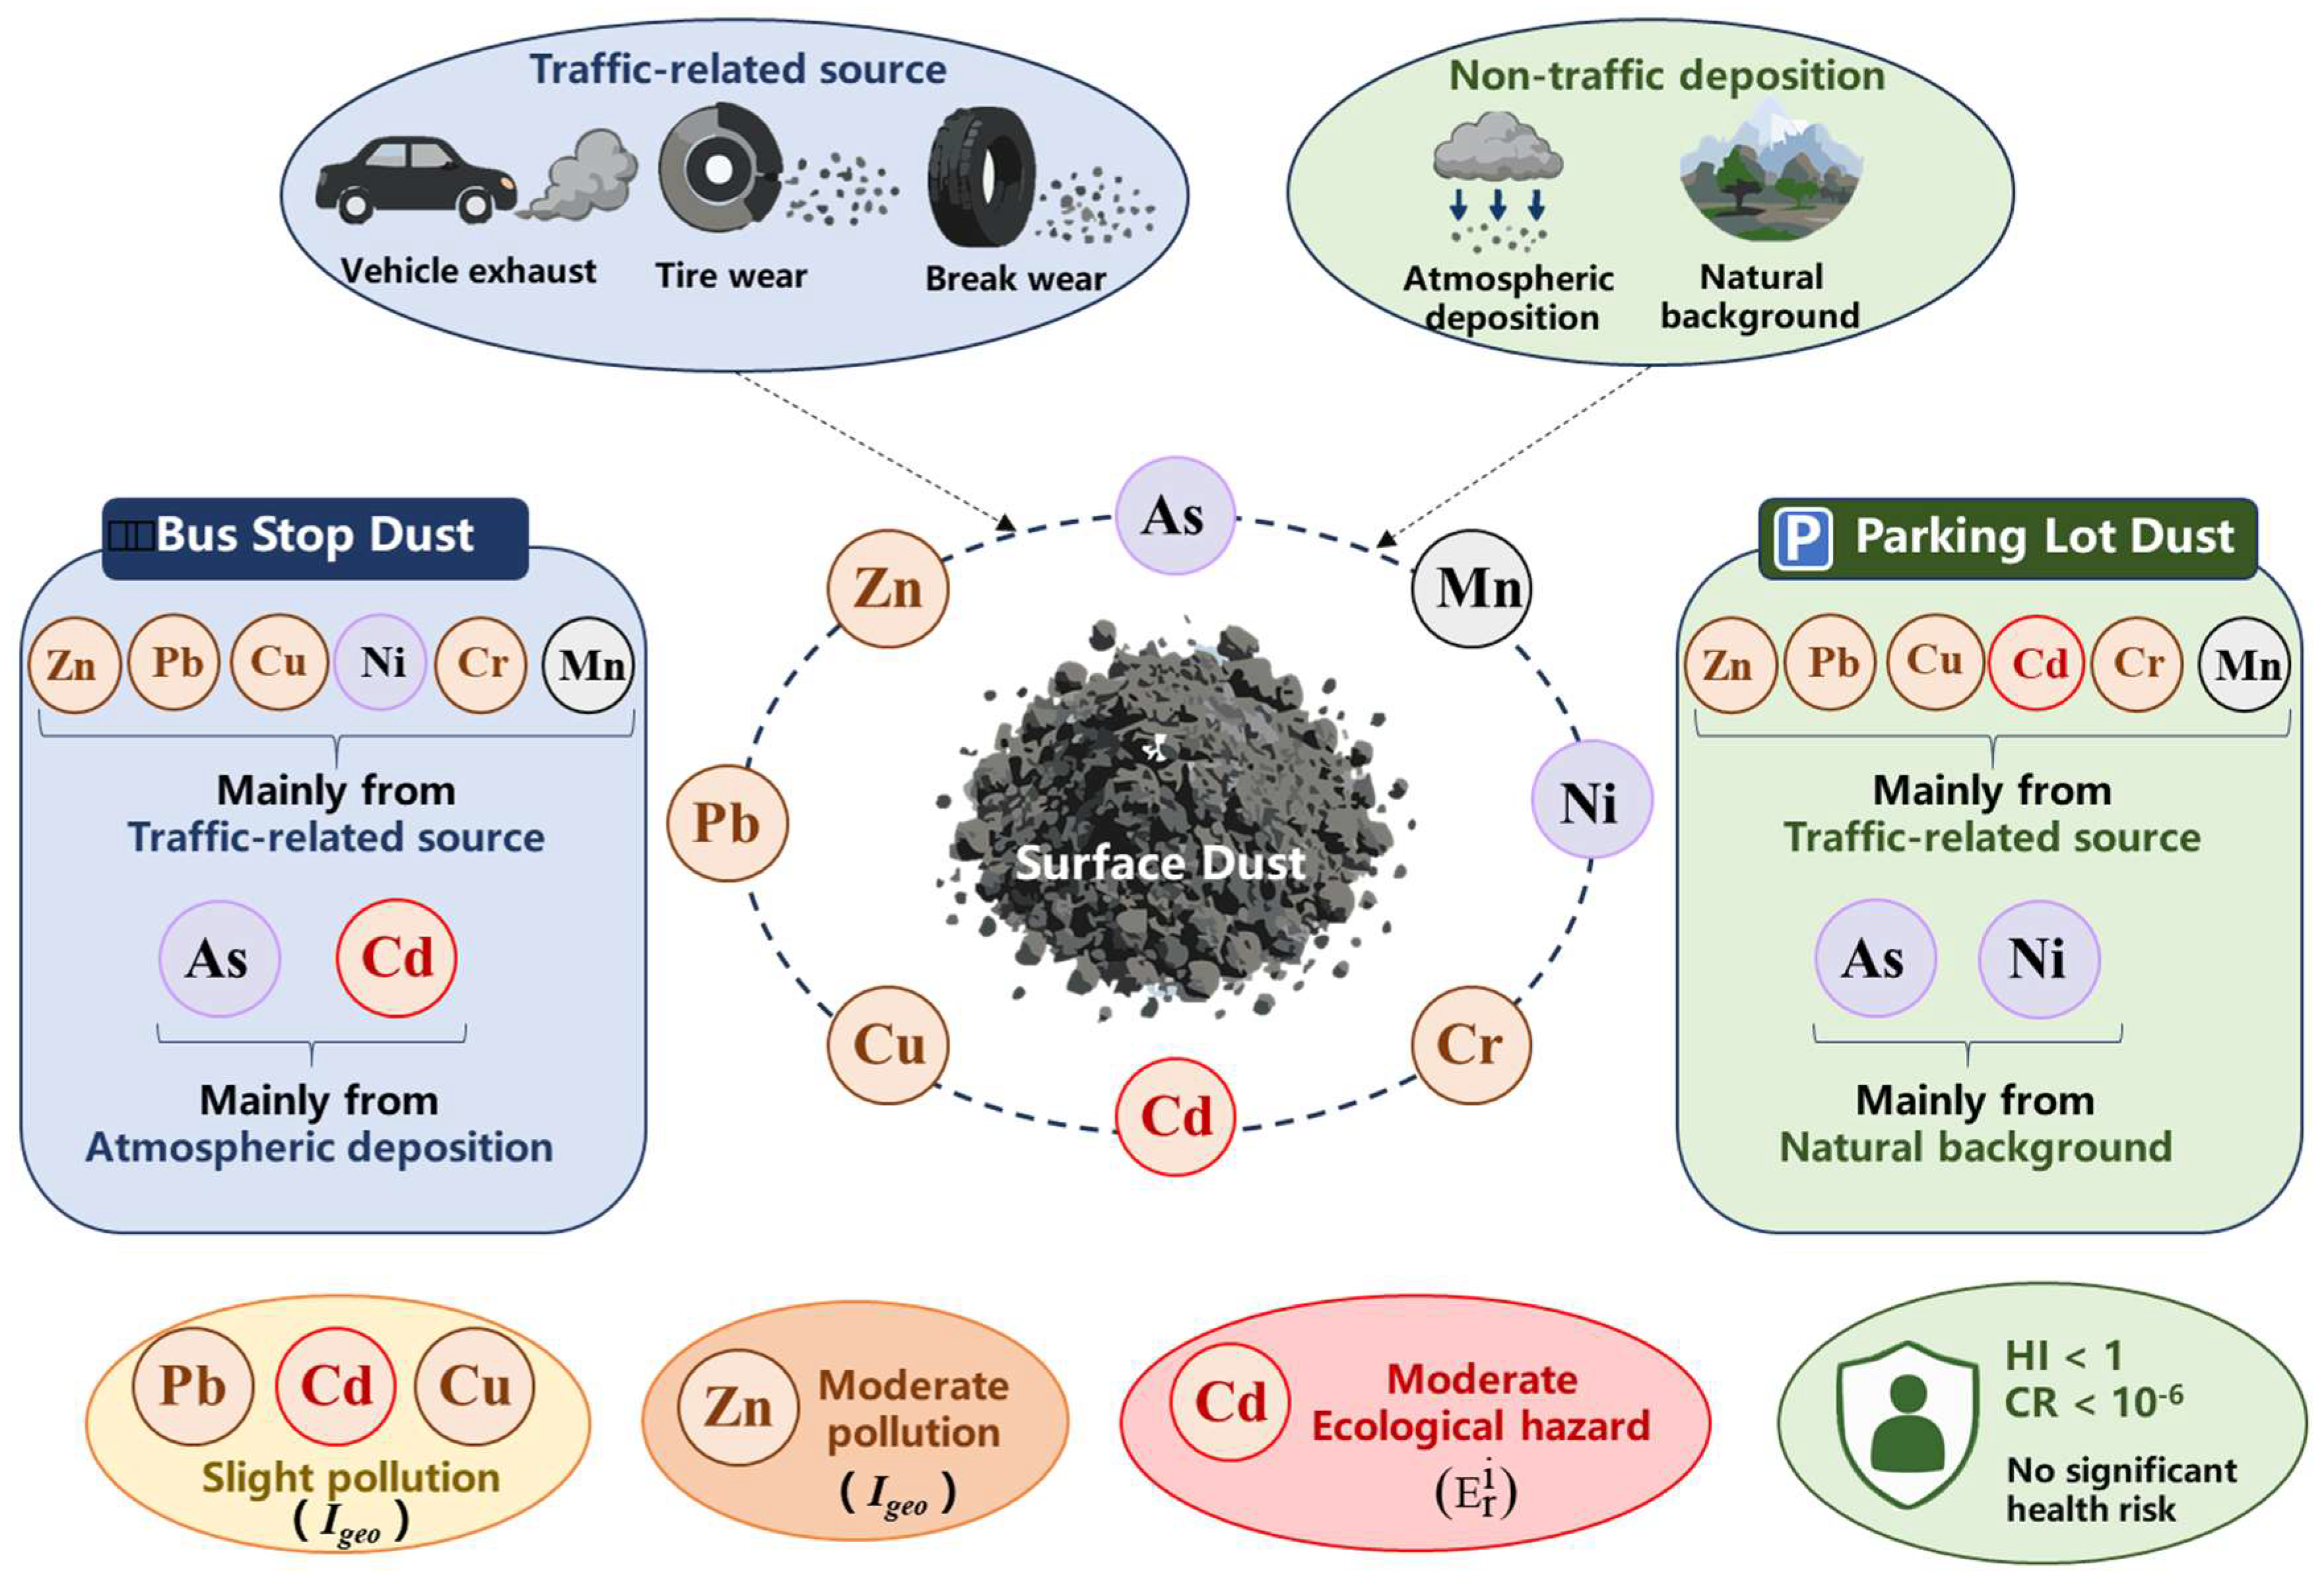
Figure 4a). Zn and Pb both showed positive loadings on Principal Component 1 (PC1) (Zn = 0.362, Pb = 0.325), as well as positive loadings on Principal Component 2 (PC2) (Zn = 0.358, Pb = 0.096). This indicated that the two elements shared consistent spatial distribution patterns and identical pollution sources. This group of elements was significantly enriched in densely populated areas, traffic corridors alongside administrative districts, urban parks, and parking lots of large supermarkets. They primarily represented urban non-point-source pollution derived from vehicle wear, superimposed with input from local industrial emissions. Ni and Mn exhibited moderate-to-high positive loadings on PC1 (Ni = 0.436, Mn = 0.445) and weak negative loadings on PC2 (Ni = −0.007, Mn = −0.049). These two elements were strongly correlated, and their spatially high-concentration zones were concentrated on the urban periphery, around hospitals, and near large downtown supermarkets with heavy pedestrian traffic. Their pollution sources were dominated by emissions from fossil fuel combustion for power generation and vehicle abrasion. Cu and Cr have high positive loadings on PC1 (Cu = 0.409, Cr = 0.440) and distinct negative loadings on PC2 (Cu = −0.294, Cr = −0.250). This pair of elements features the strongest intra-group correlation and clusters tightly in the PCA biplot, revealing highly overlapping pollution sources. Combined with their spatial distribution trends, this elemental assemblage was jointly controlled by vehicle emissions and minor industrial pollution inputs. Apart from natural sources, the six aforementioned elements mainly originated from traffic-related pollution sources, including vehicle exhaust emissions [
20], tire wear debris [
21], and road surface abrasion fragments [
22]. As and Cd display unique differentiation characteristics. They carried extremely low loadings on PC1 (As = 0.044, Cd = 0.115) and the highest positive PC2 loadings among all detected elements (As = 0.607, Cd = 0.585). In the two-dimensional PCA space, they were fully separated from the other three elemental groups. As presented moderate enrichment along busy arterial roads near schools, administrative districts, and urban parks with dense human activity. The As concentrations within the study area were lower than the local soil background values, suggesting composite pollution sources: historical accumulated contamination formed by long-term atmospheric deposition [
50,
51], alongside newly added anthropogenic pollution released from vehicle exhaust, tires and road pavement materials [
52,
53].
For parking lots, two principal components were extracted, explaining 42.7% and 20.3% of the total variance, respectively. The factor loading distribution is shown in
Figure 4b. Pb, Cu and Mn were classified as Group 1. All three elements presented positive loadings of 0.28–0.44 on Principal Component 1 (PC1) and positive loadings of 0.08–0.27 on Principal Component 2 (PC2), while their intra-group correlations were weak. Cr and Pb belong to Group 2, with positive loadings of 0.48 and 0.36 on PC1, and negative loadings of −0.29 and −0.25 on PC2, respectively. This group had the strongest intra-element correlations and clusters together in the PCA biplot, suggesting partial overlap of pollution sources. As and Ni formed Group 3. They showed low loadings of 0.01 and 0.21 on PC1 and the highest loadings of 0.66 and 0.50 on PC2, and were fully separated from the other three groups in the PCA space. Zn constituted an independent group, with a moderate positive loading of 0.45 on PC1 and a low negative loading of −0.02 on PC2. It was highly significantly correlated with Pb, Cu, Cd and Cr, indicating homologous pollution sources. The six aforementioned elements (Zn, Pb, Cu, Cd, Cr, Mn) were predominantly derived from traffic-related pollution sources. In contrast, As and Ni featured more complex source contributions, which were mainly attributed to the superposition of natural geogenic sources and vehicle emissions [
53].
3.4. Potentially Toxic Element Pollution Assessment
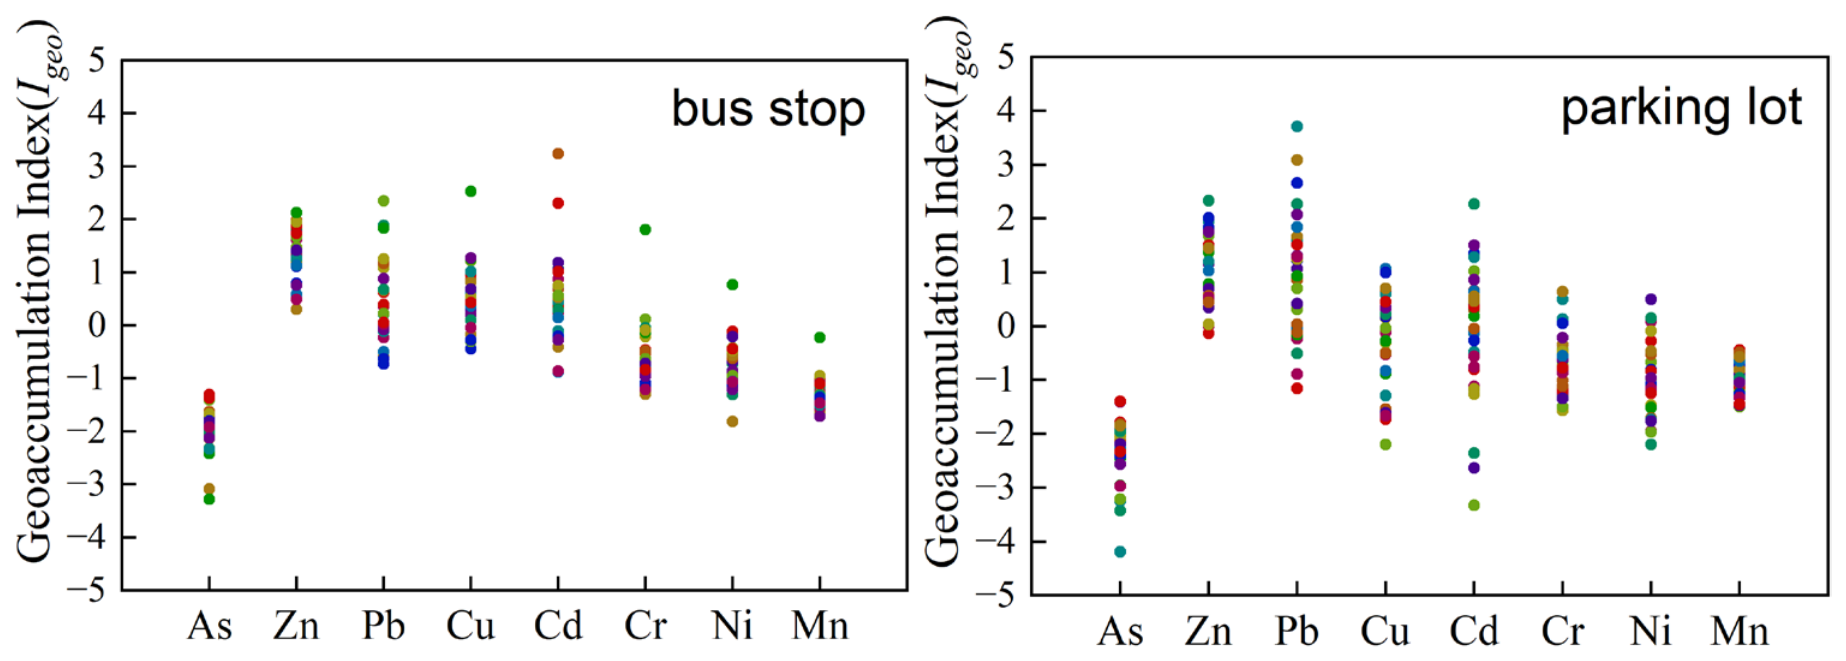
The pollution degree and potential ecological risk of PTEs in dust were evaluated by calculating the
Igeo (
Figure 5) and
(
Table 9). The
Igeo values for As, Zn, Pb, Cu, Cd, Cr, Ni, and Mn ranged from −4.19 to −1.31, −0.13 to 2.33, −1.16 to 3.71, −2.20 to 2.53, −3.33 to 3.24, −1.56 to 1.81, −2.19 to 0.76, and −1.72 to −0.23, respectively. The average
Igeo values (mean ± standard deviation) for As, Cr, Ni, and Mn were −2.16 ± 0.57, −0.61 ± 0.58, −0.90 ± 0.57, and −1.10 ± 0.31, respectively, all lower than 0, indicating negligible environmental impact of these four elements. The average
Igeo values for Pb, Cu, and Cd were 0.72 ± 1.01, 0.09 ± 0.91, and 0.19 ± 1.09, respectively, with mean values between 0 and 1, indicating slight pollution by these three PTEs. The
Igeo value for Zn was 1.21 ± 0.59, with a mean value greater than 1, indicating moderate pollution of Zn.
The results of
Igeo analysis were highly consistent with the spatial distribution characteristics of PTEs obtained via Kriging interpolation. Overall, Zn, Pb and Cd exhibited positive mean
Igeo values with obvious anthropogenic enrichment, which were strongly affected by human activities. Combined with the spatial differentiation map (
Figure 3), high-Pb enrichment hotspots were predominantly distributed in parking lots. Site 50, which had the highest Pb concentration, was situated near large shopping malls, and vehicle-related wear and exhaust emissions served as the dominant source of Pb accumulation here. In comparison, Cd enrichment hotspots were clustered around bus stops; the peak Cd concentration appeared at Site 15 within the industrial park of the development zone. This zone hosted textile manufacturers including Weiqiao Textile and new material-processing enterprises, together with densely populated residential blocks. Accordingly, Cd accumulation in this region was driven by a combination of traffic pollutants and industrial atmospheric discharges. In contrast, As, Mn, Ni and Cr had negative average
Igeo values, and their concentrations were primarily controlled by natural geogenic sources with weak overall anthropogenic disturbance. Nevertheless, evident anthropogenic enrichment still occurred at partial sampling sites, indicating exogenous pollutant inputs could not be completely excluded. Distinct differences existed in the spatial variability in target elements. Pb and Cd showed the strongest variability, with standard deviations of 1.02 and 1.10 respectively. This demonstrated that the enrichment degrees of the two elements differed greatly across various urban functional zones such as bus stops and parking lots, presenting extremely high spatial heterogeneity.
As shown in
Table 9, the
values decreased following a general trend of Cd > Pb > Cu > Ni > Zn > As > Cr > Mn. Except for Cd, the average
values for individual elements in dust samples were below 40, indicating low ecological risk from these PTEs. Cd posed a moderate ecological hazard. The average comprehensive ecological risk index (RI) was 108.05, below 150, indicating very low comprehensive ecological risk from multiple metal elements.
3.5. Human Health Risk Assessment of Potentially Toxic Elements
The average daily exposure doses (ADDs) and risk values (HI) for non-carcinogenic risk of PTEs in dust through ingestion, inhalation, and dermal contact for adult and child were calculated using the US EPA health risk model, with the results shown in
Table 10a,b and
Table 11a,b.
For adults, the HI values for different exposure pathways and all metal elements in both bus stops and parking lots were lower than the standard value of 1, indicating no non-carcinogenic health risk from the eight PTEs and three exposure pathways. This is similar to previous studies [
54,
55]. The HI value order for PTEs in bus stops was Cr > As > Pb > Mn > Cd > Cu > Ni > Zn, while the HI value for parking lot was Cr > Pb > As > Mn > Cd > Ni > Cu > Zn. The HI values for Pb and Mn in bus stop dust were lower than in parking lots, while other elements were higher in bus stops than in parking lots. For children, the HI value order for PTEs in both bus stops and parking lots was Cr > As > Pb > Mn > Cu > Ni > Zn > Cd. The HI values are consistently elevated in parking lots relative to bus stops, which implies higher PTE exposure risks for children within parking lot environments. This suggests that under current environmental conditions, exposure to PTEs in road dust via common pathways poses negligible non-carcinogenic risks to adults in these two functional areas. Despite the overall acceptable risk level, Cr, As and Pb still represent the dominant contributors to non-carcinogenic risk and should remain key targets for long-term environmental monitoring.
From the perspective of different exposure pathways, the total HI of eight PTEs differed noticeably between adults and children at both bus stops and parking lots. For adults, the ranking of risks across exposure pathways followed ingestion > inhalation > dermal contact, whereas for children, the ranking was ingestion > inhalation > dermal contact. For adults at bus stops, the HI value order for ingestion was Cr > Pb > As > Mn > Cu > Ni > Zn > Cd; for inhalation, it was Mn > Cr > As > Pb > Cu > Ni > Zn > Cd; and for dermal contact, it was Cr > As > Mn > Pb > Cd > Ni > Cu > Zn. For parking lots, the HI value order for ingestion was Pb > Cr > As > Mn > Ni > Cu > Zn > Cd; for inhalation, it was Mn > Cr > As > Pb > Ni > Cu > Zn > Cd; and for dermal contact, it was Cr > As > Mn > Pb > Cd > Ni > Zn > Cu. This result was slightly different from the conclusion reached by Zhang et al. that ingestion was the main exposure pathway in their study on road dust and green belt soils [
54]. This indicates that dermal absorption poses the most significant non-carcinogenic health risk in roadside microenvironments, which should be prioritized in exposure prevention and control. This discrepancy might be attributed to regional environmental conditions, physicochemical properties of settled dust, and the US EPA exposure parameters adopted in this study. Binzhou is an emerging city that underwent urban expansion starting in 2003. Having developed for less than 30 years, the city features limited heavy industry, which results in low accumulation of potentially toxic elements in the environment. In addition, the parameter value of skin area adopted in this study was set to 5000 [
36], which further lowered the risk contribution proportion of the ingestion pathway. The distinct ranking patterns of PTEs among ingestion, inhalation, and dermal pathways suggested that the health risks of different PTEs were highly pathway-dependent, and comprehensive risk management should be tailored accordingly.
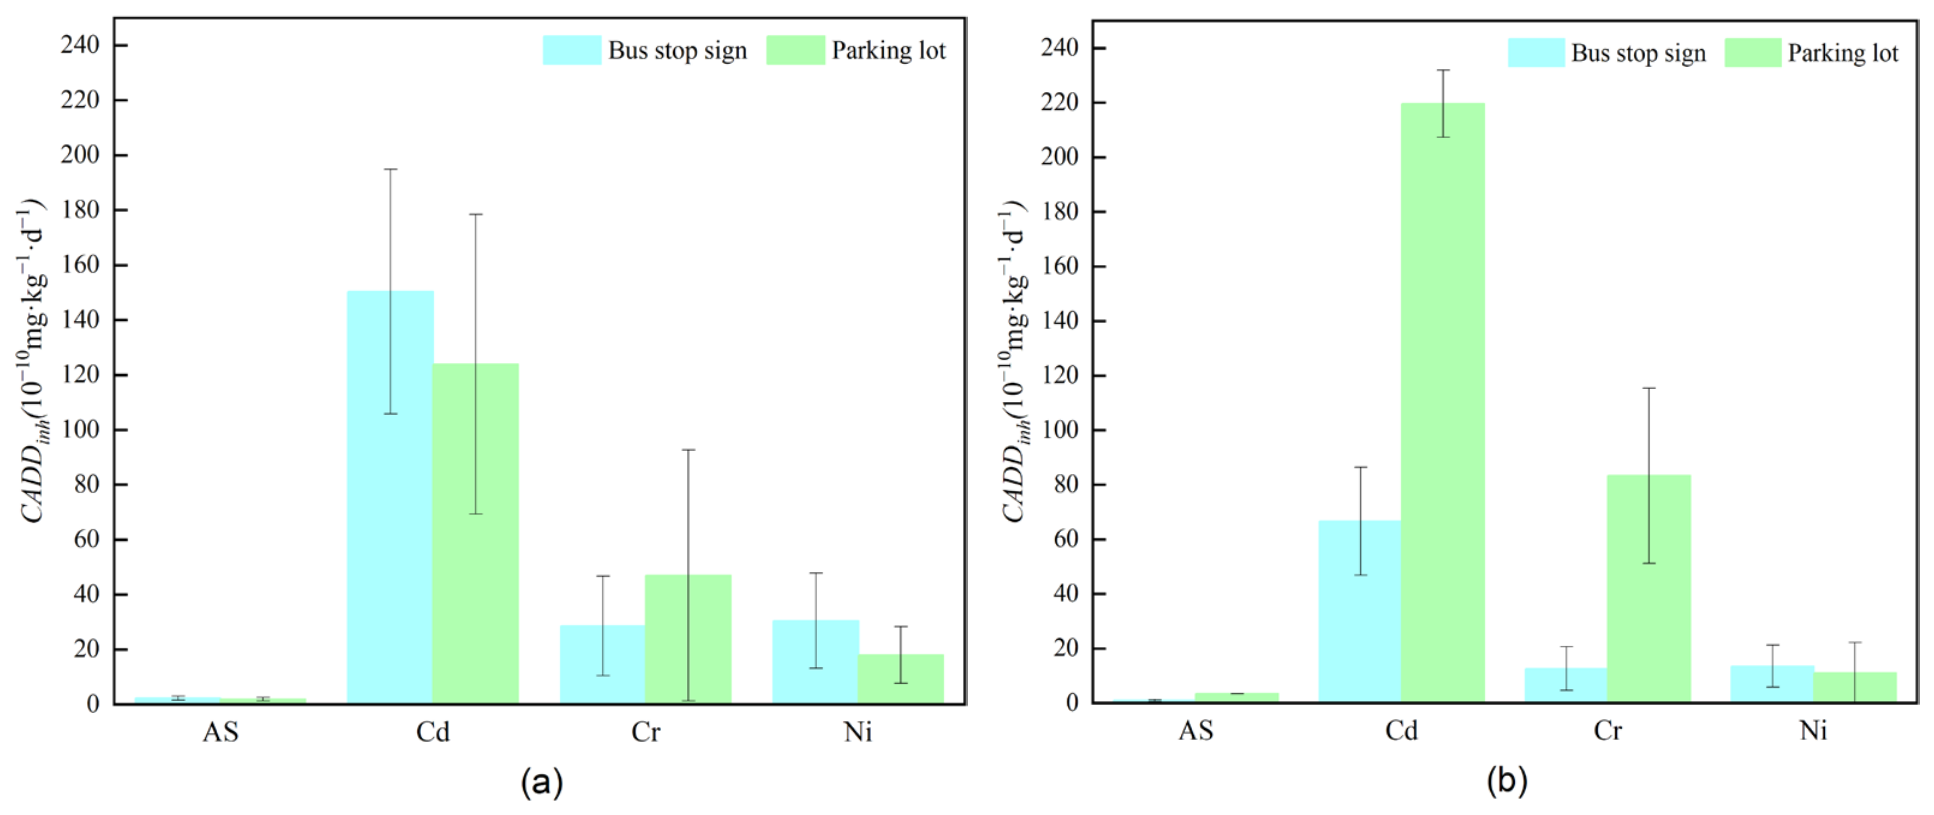
The daily exposure doses and carcinogenic risk values for carcinogenic PTEs As, Cd, Cr, and Ni through inhalation are shown in
Figure 6 and
Table 12, respectively. The daily exposure dose order for PTEs for adults and children at both bus stops and parking lots was Cd > Cr > Ni > As, and the carcinogenic risks order was Cr > Cd > Ni > As. The average daily exposure doses and carcinogenic risks of As, Cd, and Ni for adults in bus stops were higher than those in parking lots, whereas Cr exhibited lower values at bus stops relative to parking lots. For children, the average daily exposure doses of Cd, Cr, and Ni in bus stops were higher than those in parking lots, while the carcinogenic risk of Cr and Ni in bus stops was higher than in parking lots. The comprehensive carcinogenic risk value (CR) for bus stops was lower than for parking lots, but both CR values lower less than 1 × 10
−6, indicating inhalation exposure to PTEs poses no carcinogenic risk even though children exhibited higher risk values than adults. Previous studies had shown that the elevated lifetime carcinogenic risk in urban environments mainly originates from Cr, Ni, and As, which was consistent with the findings of this study [
54,
56]. Although Cr contributed the most to carcinogenic risk among the four metals, its individual risk remained within an acceptable range in both functional areas. The overall low carcinogenic risk suggests that inhalation exposure to these PTEs in roadside microenvironments did not pose an obvious cancer threat to the general population under current conditions.
In the present inhalation exposure evaluation, we used total dust concentrations rather than graded particle fractions. As reported in previous studies, particle size largely determines the penetration capacity of dust in the respiratory tract; inhalable and respirable particles are the main contributors to inhalation health risks. Considering that the inhalation hazard quotients of all detected elements were well below the critical value of 1.0, the inhalation health impact on the crowd was minimal. Accordingly, particle size classification was not conducted in our sampling and testing procedures. We acknowledge that this simplification may bring certain uncertainties to the assessment results.




 ,
,