2.2. Variable Selection
The specific variables selected in this research are presented in
Table 1.
Reasons for using haze data instead of ultrafine particle data in the relevant analysis:
First, haze pollution is a phenomenon of visual obscuration. Haze is caused by a large number of particles, while the mass of the particles has a very small effect. For example, taking spherical particles as an illustration, the mass of one PM
2.5 particle ≈ the mass of 125 PM
0.5 particles ≈ the mass of 15,625 PM
0.1 particles (assuming identical density). One hundred PM
0.5 particles are equal to 80% of the mass of one PM
2.5 particle. If these 100 PM
0.5 particles are arranged into four layers, with 25 particles per layer, the total light-blocking area and the average thickness of the four layers of 25 PM
0.5 particles are far greater than those of a single PM
2.5 particle. The light-blocking effect of 100 PM
0.5 particles, despite weighing 20% less, is far stronger than that of one PM
2.5 particle [
16]. Moreover, existing studies have found through experiments that in some regions, ultrafine particles account for a large proportion of the mass of haze pollutants. Our project team, through the above conversion, has found that the number of ultrafine particles accounts for more than 99% of the total particle number in haze pollutants, and in some cases even more than 99.9%.
Second, the objective of this study is to identify the main sources of ultrafine particles during the severe haze pollution period in China (2012–2016). The main sources of ultrafine particles in the air may differ across periods and regions. It is not accurate to identify the main sources of ultrafine particles in the past air solely through experiments, and high-altitude sampling is also not feasible.
Third, the haze data selected for this study are derived from haze satellite imagery. Based on the haze formation mechanism—ultrafine particles continuously transform into light-absorbing fine particles in the air, and this transformation accelerates with increasing humidity; under stagnant weather conditions, light-absorbing fine particles accumulate in increasing numbers, eventually forming haze pollution—the satellite images of haze can be directly converted into fine particle data, which can then be further converted into ultrafine particle data [
2]. Given the complex sources of ultrafine particles, the great difficulty and high cost of monitoring, and the current lack of ultrafine particle monitoring data, the use of haze data converted from satellite imagery as a substitute for ultrafine particle monitoring data is an effective solution we have identified.
Air Pollution Index (pollution): The Air Pollution Index (API) is widely used as a core indicator for evaluating regional air pollution levels. It is typically constructed through the aggregation of multiple pollutant concentrations, including PM
2.5, PM
10, SO
2, and NO
2. By integrating information from various pollutants, the API is capable of providing a comprehensive and accurate representation of the overall impacts of air pollution on human health and the ecological environment. Yang et al. (2023) employed the API to investigate the mechanisms through which meteorological and geographical factors influence air pollution in chemical industrial parks, thereby revealing the dynamic effects of these factors on API variations [
20]. In this study, the Air Pollution Index is comprehensively calculated based on the emissions of three major pollutants: sulfur dioxide emissions, nitrogen oxide emissions, and the geographical average PM
2.5. The formula is: Air Pollution Index = (SO
2 emissions/GDP + NO
x emissions/GDP + geographical average PM
2.5/GDP)/3.
Output Value of Air Pollution-Intensive Industries: Previous research by [
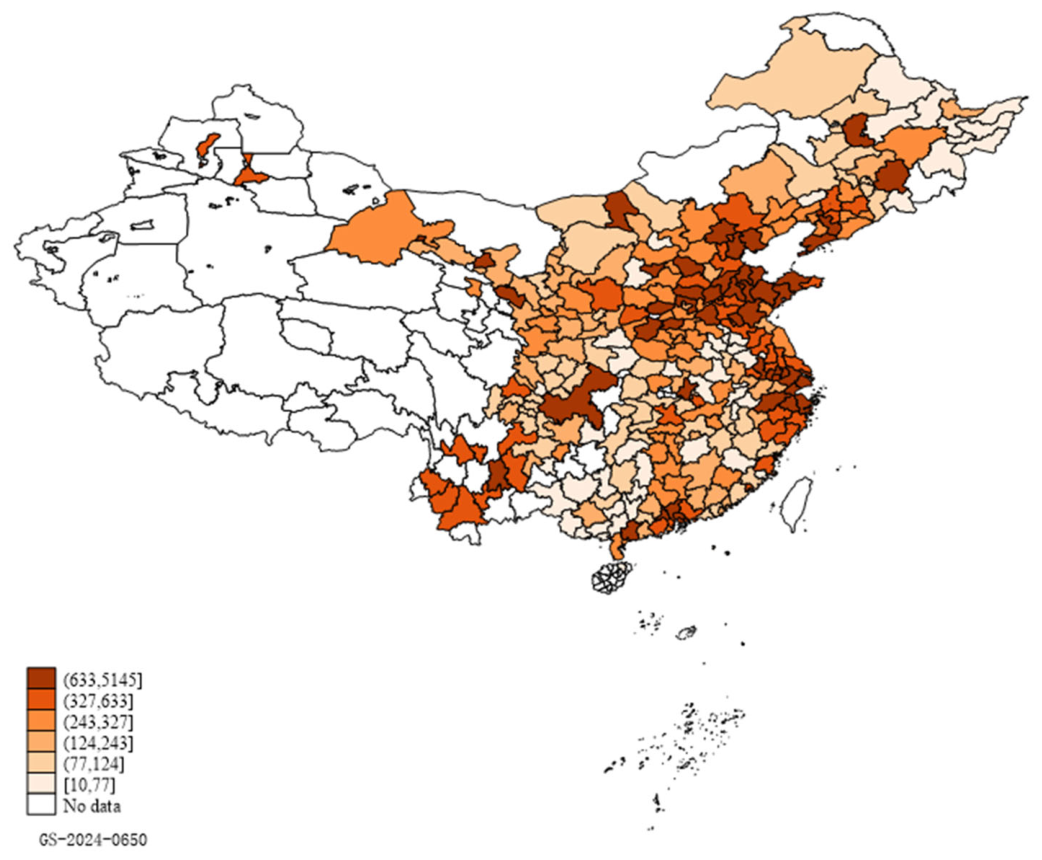
21], focusing on the determinants and spatial spillover effects of haze pollution in the Beijing–Tianjin–Hebei region, has identified several key findings: In cities with a strong industrial base or those undertaking industrial transfer, a higher share of the secondary industry in the economic structure has been identified as a major contributor to deteriorating air quality. In addition, significant structural issues in energy consumption, characterized by high energy intensity and high pollution emissions, have further accelerated air quality deterioration, particularly in Hebei Province. These findings indirectly suggest a strong association between the output of air pollution-intensive industries and haze pollution. Based on data from 2009, 2011, 2013, and 2015, the air pollution intensity indices for different industries in China were calculated. The six industries with the highest pollution intensity indices are: Production and Supply of Electric Power and Heat Power; Smelting and Pressing of Ferrous Metals; Petroleum Processing and Coking; Manufacture of Raw Chemical Materials and Chemical Products; Manufacture of Non-metallic Mineral Products; and Smelting and Pressing of Non-ferrous Metals. The output value of pollution-intensive industries is taken as the sum of the output values of these six industries with the highest pollution intensity indices [
22].
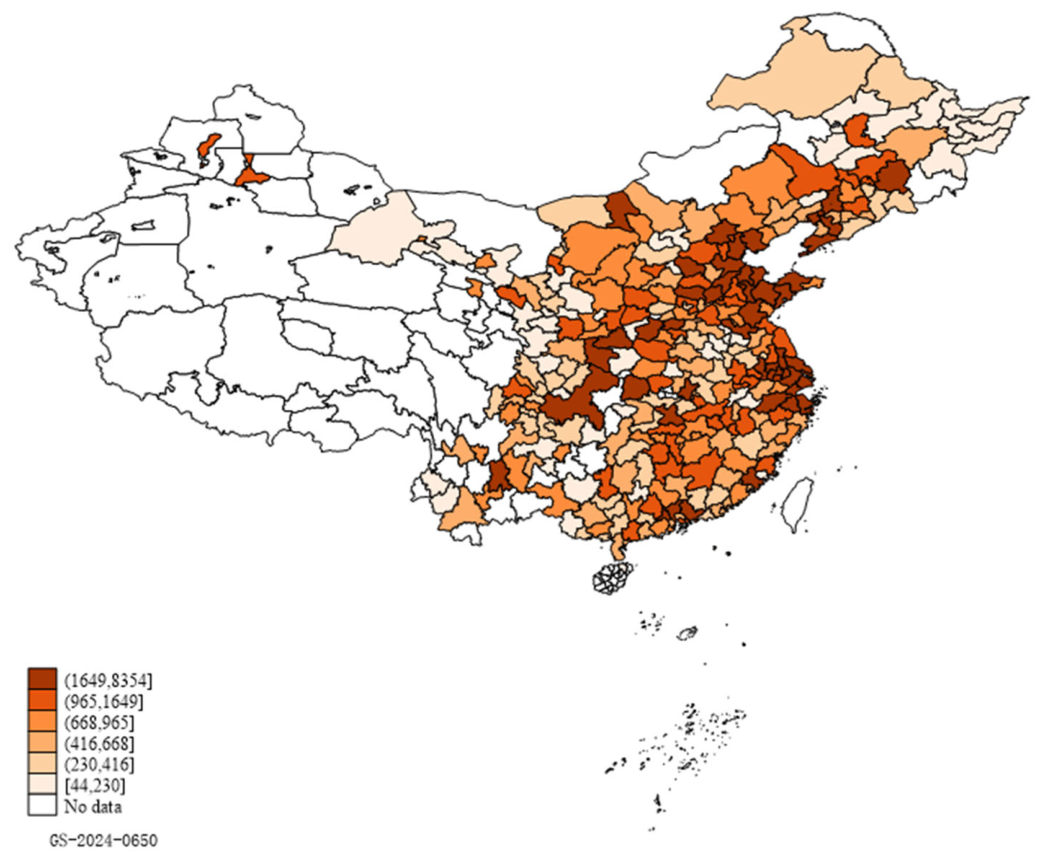
Sales Value of Air Pollution-Intensive Industries: This variable focuses on six representative industries that are closely associated with atmospheric pollution within the industrial economic structure. It is constructed by aggregating the sales values of these six industries. The selection of these industries is based on a comprehensive consideration of their contributions to air pollutant emissions, their shares in the regional economy, and the sustainability of their development.
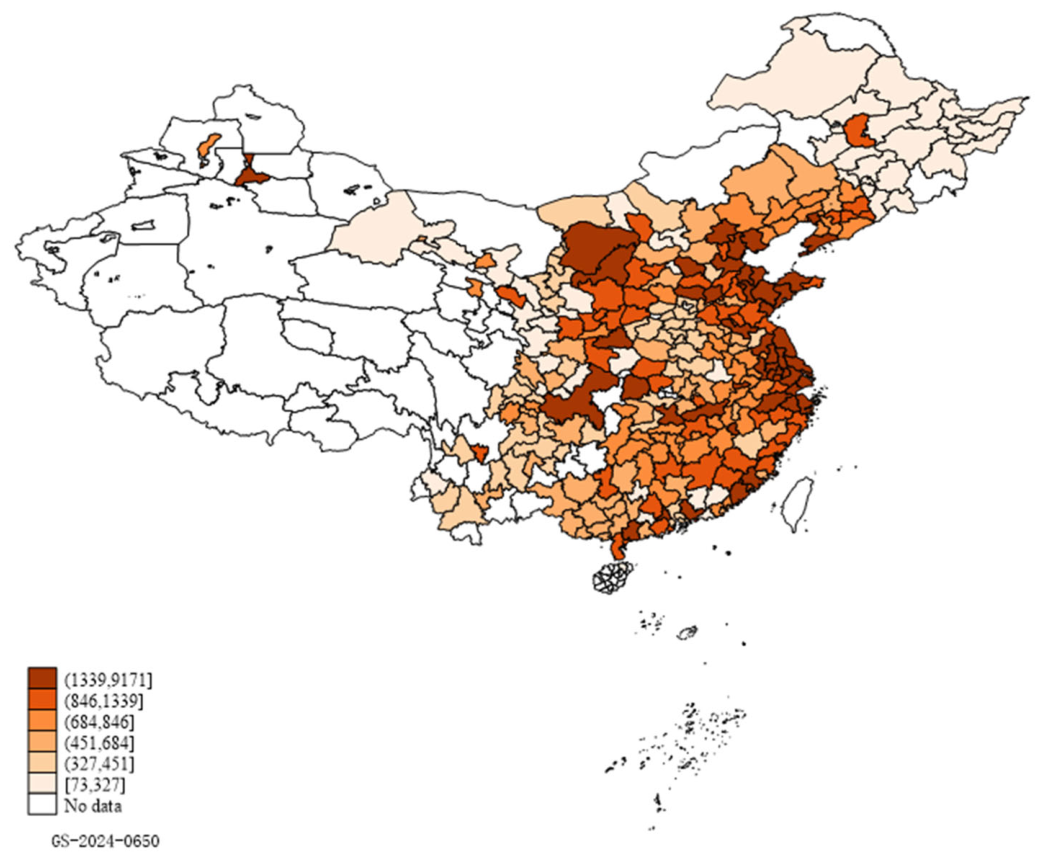
Carrying Capacity Index for Pollution-Intensive Industries: This variable is employed to quantify the ability of the atmospheric environment to accommodate and buffer pollutant inputs. As a complex and dynamic system, the atmosphere possesses an inherent capacity to absorb and assimilate a certain level of pollutants. This index is constructed by comprehensively incorporating the influences of atmospheric physical properties, the chemical properties of particulate matter (especially ultrafine particles), and meteorological conditions on pollutant dispersion and assimilation. Drawing on the perspectives of [
23] and the evaluation indicator systems constructed by [
24], [
25], [
26], [
27], [
28], and [
29], this study designs an evaluation indicator system for the carrying capacity of pollution-intensive industries based on environmental self-purification capacity from four dimensions: industrial attractiveness, industrial selectivity, industrial support capacity, and industrial development capacity (see
Table 2). Principal component analysis is then used to calculate the carrying capacity for pollution-intensive industries.
Green Technological Innovation (gti): This variable refers to a system of technologies that reduces pollution, lowers resource consumption, and improves ecological performance. It is characterized by a dynamic system composed of knowledge, capabilities, and material means. In this research, the level of green technological innovation is measured by the number of green patents across cities in different years.
Administrative Area Size (1): This is defined as the total land and water area under the jurisdiction of an administrative unit. A larger administrative area is generally associated with a more dispersed distribution of population and industrial activities, which may contribute to the physical dilution of air pollutants. In addition, variations in area size reflect differences in resource endowments and environmental carrying capacity, thereby influencing the dispersion potential of pollutants and the effectiveness of governance strategies.
Urbanization Level (2): This is a key indicator of the urbanization process and is measured by the proportion of the urban population in the total population. It reflects the degree of population agglomeration in urban areas. During the urbanization process, significant changes occur in industrial activity, energy consumption, and transportation flows, generating complex effects on the atmospheric environment. On the one hand, urbanization may increase pollution emissions; on the other hand, it may also be accompanied by improved environmental awareness and advances in pollution control technologies.
Registered Urban Unemployment Rate (3): This is an important indicator for assessing economic vitality and labor market conditions. In general, lower unemployment rates are associated with higher economic activity, which may lead to increased industrial production and energy consumption, thereby affecting the atmospheric environment. In addition, overall employment conditions may influence the level of environmental investment and the priority of policy implementation by governments and society.
Tax Policy (4): Tax policy can regulate corporate behavior and economic activities through fiscal instruments. The imposition of higher environmental taxes on polluting entities can increase production costs and incentivize emission reductions. Conversely, tax incentives for environmental protection industries and green technological innovation can stimulate investment and the adoption of cleaner technologies, thereby contributing to improvements in air quality.
2.3. Data Sources
This research selects “the Beijing–Tianjin–Hebei region and its 26 neighboring pollution-monitoring cities” in China, which constitute the urban agglomeration most severely affected by haze pollution—namely, the Beijing–Tianjin–Hebei air pollution transmission channel cities. The sample includes Beijing and Tianjin; Shijiazhuang, Tangshan, Langfang, Baoding, Cangzhou, Hengshui, Xingtai, and Handan in Hebei Province; Taiyuan, Yangquan, Changzhi, and Jincheng in Shanxi Province; Jinan, Zibo, Jining, Dezhou, Liaocheng, Binzhou, and Heze in Shandong Province; and Zhengzhou, Kaifeng, Anyang, Hebi, Xinxiang, Jiaozuo, and Puyang in Henan Province [
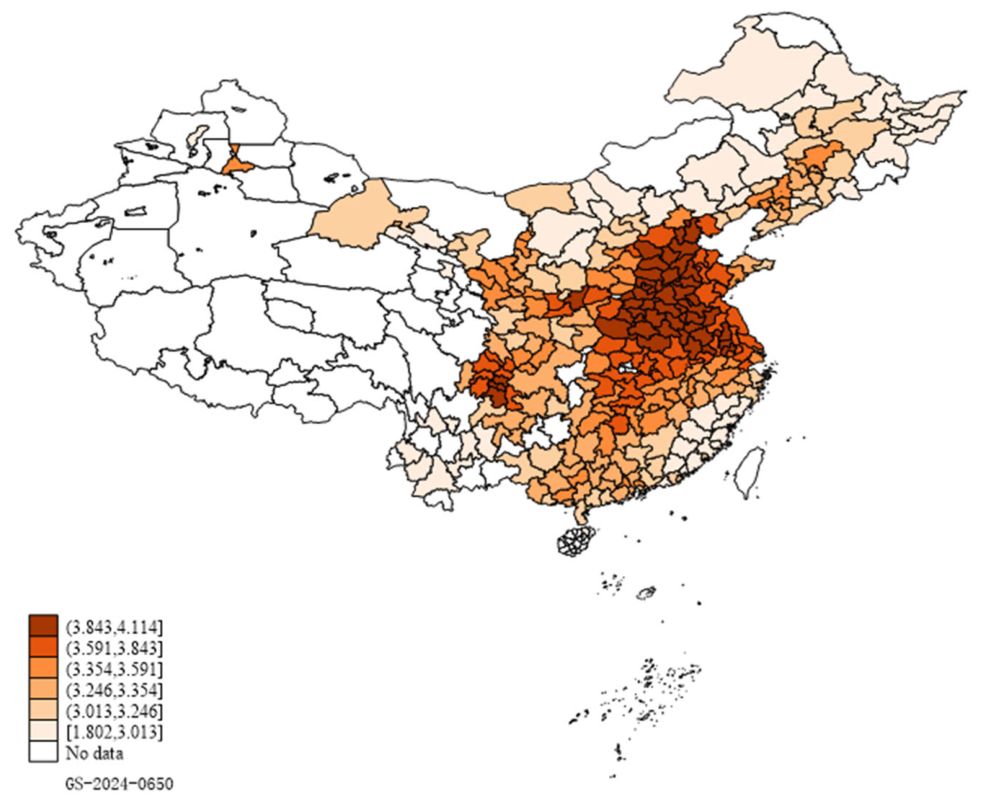
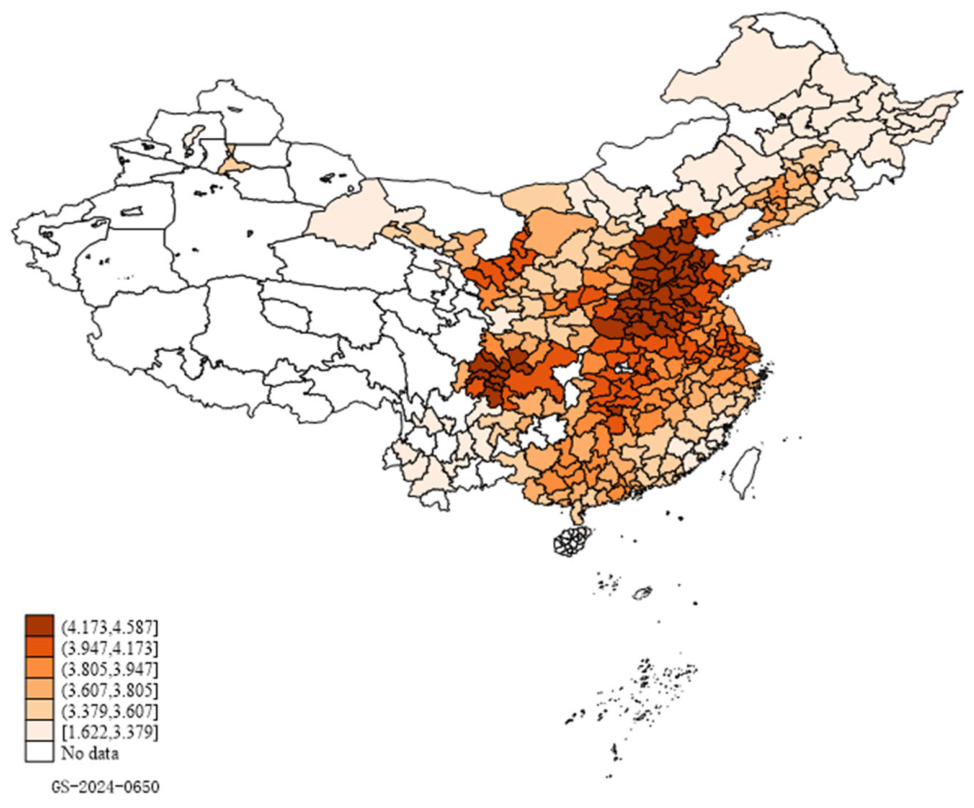
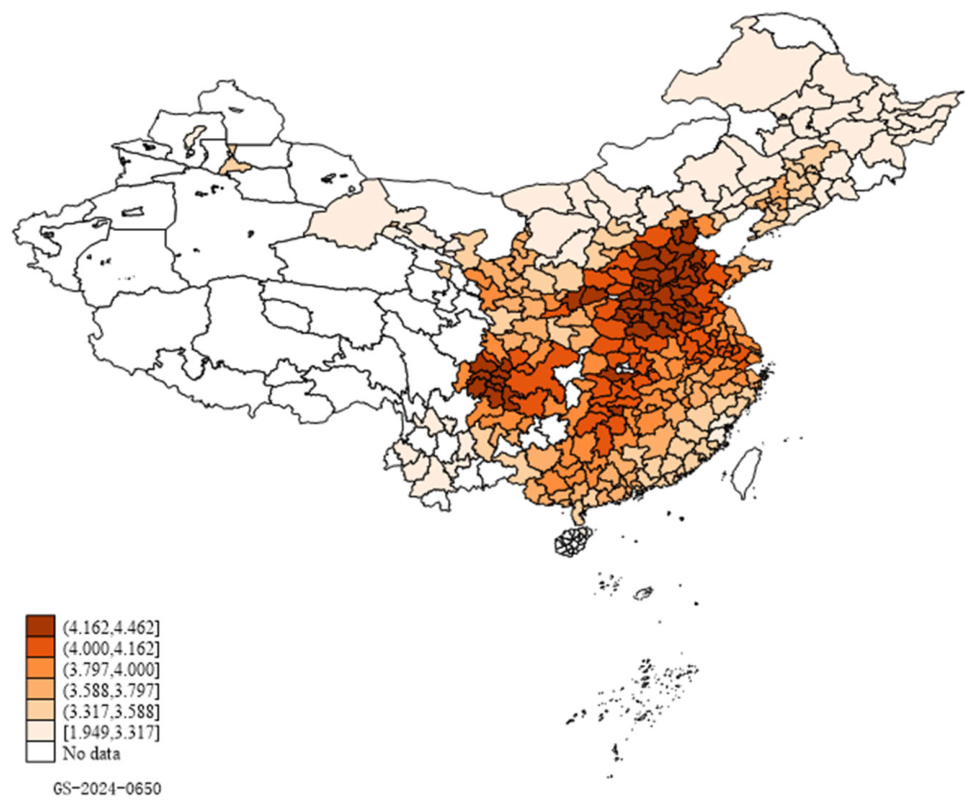
30]. Based on the carrying capacity index for pollution-intensive industries, this research further examines the impact of output from air pollution-intensive industries on haze pollution. Due to the lack of direct monitoring data for UFPs, haze pollution data are used as a proxy for assessing UFP-related atmospheric pollution in this research. Given that large-scale administrative shutdowns and production restrictions of approximately 100,000 polluting enterprises occurred in China during 2017–2018, which may introduce structural disturbances into the analysis, the final dataset covers a panel of prefecture-level cities across 31 provinces in China over the period 2000–2018. For the analysis of ultrafine particle sources using the spatial Durbin model and other methods, data for the 28 cities in the Beijing–Tianjin–Hebei air pollution transmission channel over the period 2000–2017 are employed. Regarding data sources, haze pollution data are obtained from the Socioeconomic Data and Applications Center at Columbia University, which provides global annual mean PM
2.5 concentration data derived from satellite observations. The dataset is available at
https://www.earthdata.nasa.gov/centers/sedac-daac (accessed on 29 June 2026). Data on green patent grants are obtained from the China National Intellectual Property Administration and manually compiled by the authors. All other data are collected from the China Environmental Statistical Yearbook, China City Statistical Yearbook, China Urban Construction Statistical Yearbook, China Regional Economic Statistical Yearbook, and statistical yearbooks of individual provinces [
31].