Article

Characterizing Indoor Black Carbon Dynamics in a Residential Environment: The Role of Human Activity and Ventilation Behavior

1
Institute for Medical Research and Occupational Health, 10000 Zagreb, Croatia
2
The Lisbon Council, 1040 Brussels, Belgium
3
Ruđer Bošković Institute, 10000 Zagreb, Croatia
4
Ascalia d.o.o., 40000 Cakovec, Croatia
5
Institute for Anthropological Research, 10000 Zagreb, Croatia
6
Faculty of Food Technology Osijek, Josip Juraj Strossmayer University of Osijek, 31000 Osijek, Croatia
*
Author to whom correspondence should be addressed.
Toxics 2025, 13(7), 536; https://doi.org/10.3390/toxics13070536
Submission received: 6 June 2025 / Revised: 22 June 2025 / Accepted: 23 June 2025 / Published: 26 June 2025
(This article belongs to the Section Air Pollution and Health)

Abstract

Understanding indoor black carbon (BC) dynamics is important for assessing human exposure and informing air quality management in residential settings. This study presents a high-resolution, multi-sensor dataset collected over 24 days in a semi-occupied home in Zagreb, Croatia, designed to characterize the temporal behavior and sources of indoor BC. Indoor BC concentrations were measured at 1 min resolution using a dual-spot aethalometer, with source apportionment into biomass burning and fossil fuel components. Complementary contextual data including motion detection, door and window states, and traffic activity were collected in parallel using smart sensors and annotated experimental logs. Across the monitoring period, daily mean BC concentrations ranged from 174.7 and 1053.1 ng/m3 for biomass burning BC and between 53.2 and 880.3 ng/m3 for fossil fuel component. Statistical analyses revealed significant increases in BC concentrations during direct combustion-related activities, including scented candle burning and gas burner use. Additional BC elevations were associated with mechanical heat sources and nearby vehicle traffic, particularly affecting the fossil fuel BC component. In contrast, non-combustion activities such as brief human presence exhibited minor or inconsistent effects on indoor BC levels. This study elucidates the primary role of combustion-based indoor activities in influencing short-term BC exposure and highlights the importance of synchronized, high-resolution datasets for indoor air quality research.

Graphical Abstract

1. Introduction

Air pollution remains one of the leading environmental health risks worldwide, contributing to an estimated 7 million premature deaths annually [1,2,3,4]. Among the different air pollutants, particulate matter (PM) is one of the most important contributors to health outcomes, with extensive epidemiological and toxicological evidence for both short- and long-term exposure to increased risks of cardiovascular and respiratory diseases, pulmonary inflammation, lung cancer, and neurodegenerative and developmental disorders [5,6,7,8,9,10]. Within the fine particulate matter fraction, black carbon (BC)—a component of PM and resulting dominantly from incomplete combustion of fossil fuels, biomass, and other carbon-rich materials—has gained increasing attention due to its dual impact on human health and climate change [11,12,13,14,15,16]. BC is particularly harmful because of its small particle size, high surface area, and ability to adsorb and transport toxic organic compounds [17]. Exposure to BC has been associated with systemic inflammation, oxidative stress, impaired lung function, and increased risk of cardiovascular morbidity [18,19]. Vulnerable populations, such as children, the elderly, and individuals with pre-existing health conditions, are especially at risk [20,21,22]. Many research initiatives, including the Horizon Europe EDIAQI project (Evidence-Driven Indoor Air Quality Improvement, https://ediaqi.eu/; Grant Agreement No. 101057497), are actively investigating the impacts of indoor air pollution on human health, with a particular focus on vulnerable populations and evidence-based strategies for improving indoor air quality [23,24]. Importantly, indoor exposure can account for a significant amount of an individual’s total BC exposure, particularly in regions or seasons when people spend most of their time indoors. Despite growing evidence on outdoor BC levels and their impacts, indoor concentrations remain understudied, particularly in real-life residential settings. Indoor BC levels can be influenced by both outdoor infiltration and indoor sources, such as cooking, heating, and the use of candles or other combustion-based products [25,26,27]. Outdoor sources of BC primarily stem from incomplete combustion of fossil fuels and biomass, including vehicular traffic, residential wood burning, industrial activities, and, in some regions, open agricultural burning [28,29,30]. In addition, human behavior (e.g., window opening, occupancy patterns) and ventilation dynamics have an impact on modulating indoor concentrations [31,32,33].
This study presents a high-resolution dataset focused on indoor BC dynamics in a residential setting. By integrating BC measurements with detailed contextual information, including human activity, ventilation behavior, and pollution sources, this work aims to provide a better understanding of the drivers of indoor BC variability and to support improved exposure assessment in everyday environments.
To our knowledge, this is the first study to measure indoor BC concentrations in a residential setting in this region using both high-resolution source-apportioned BC data and an extensive network of supporting sensors. While previous research in Croatia and the broader region has primarily focused on ambient air pollution and outdoor PM, comprehensive indoor monitoring, particularly with synchronized data on human activity, ventilation, meteorology, and source events, is lacking. This dataset and study design provide a rare opportunity to explore how indoor BC levels fluctuate in response to real-life behaviors and environmental conditions, contributing a better understanding of both regional air quality research and broader efforts to assess indoor pollutant exposure.

2. Materials and Methods

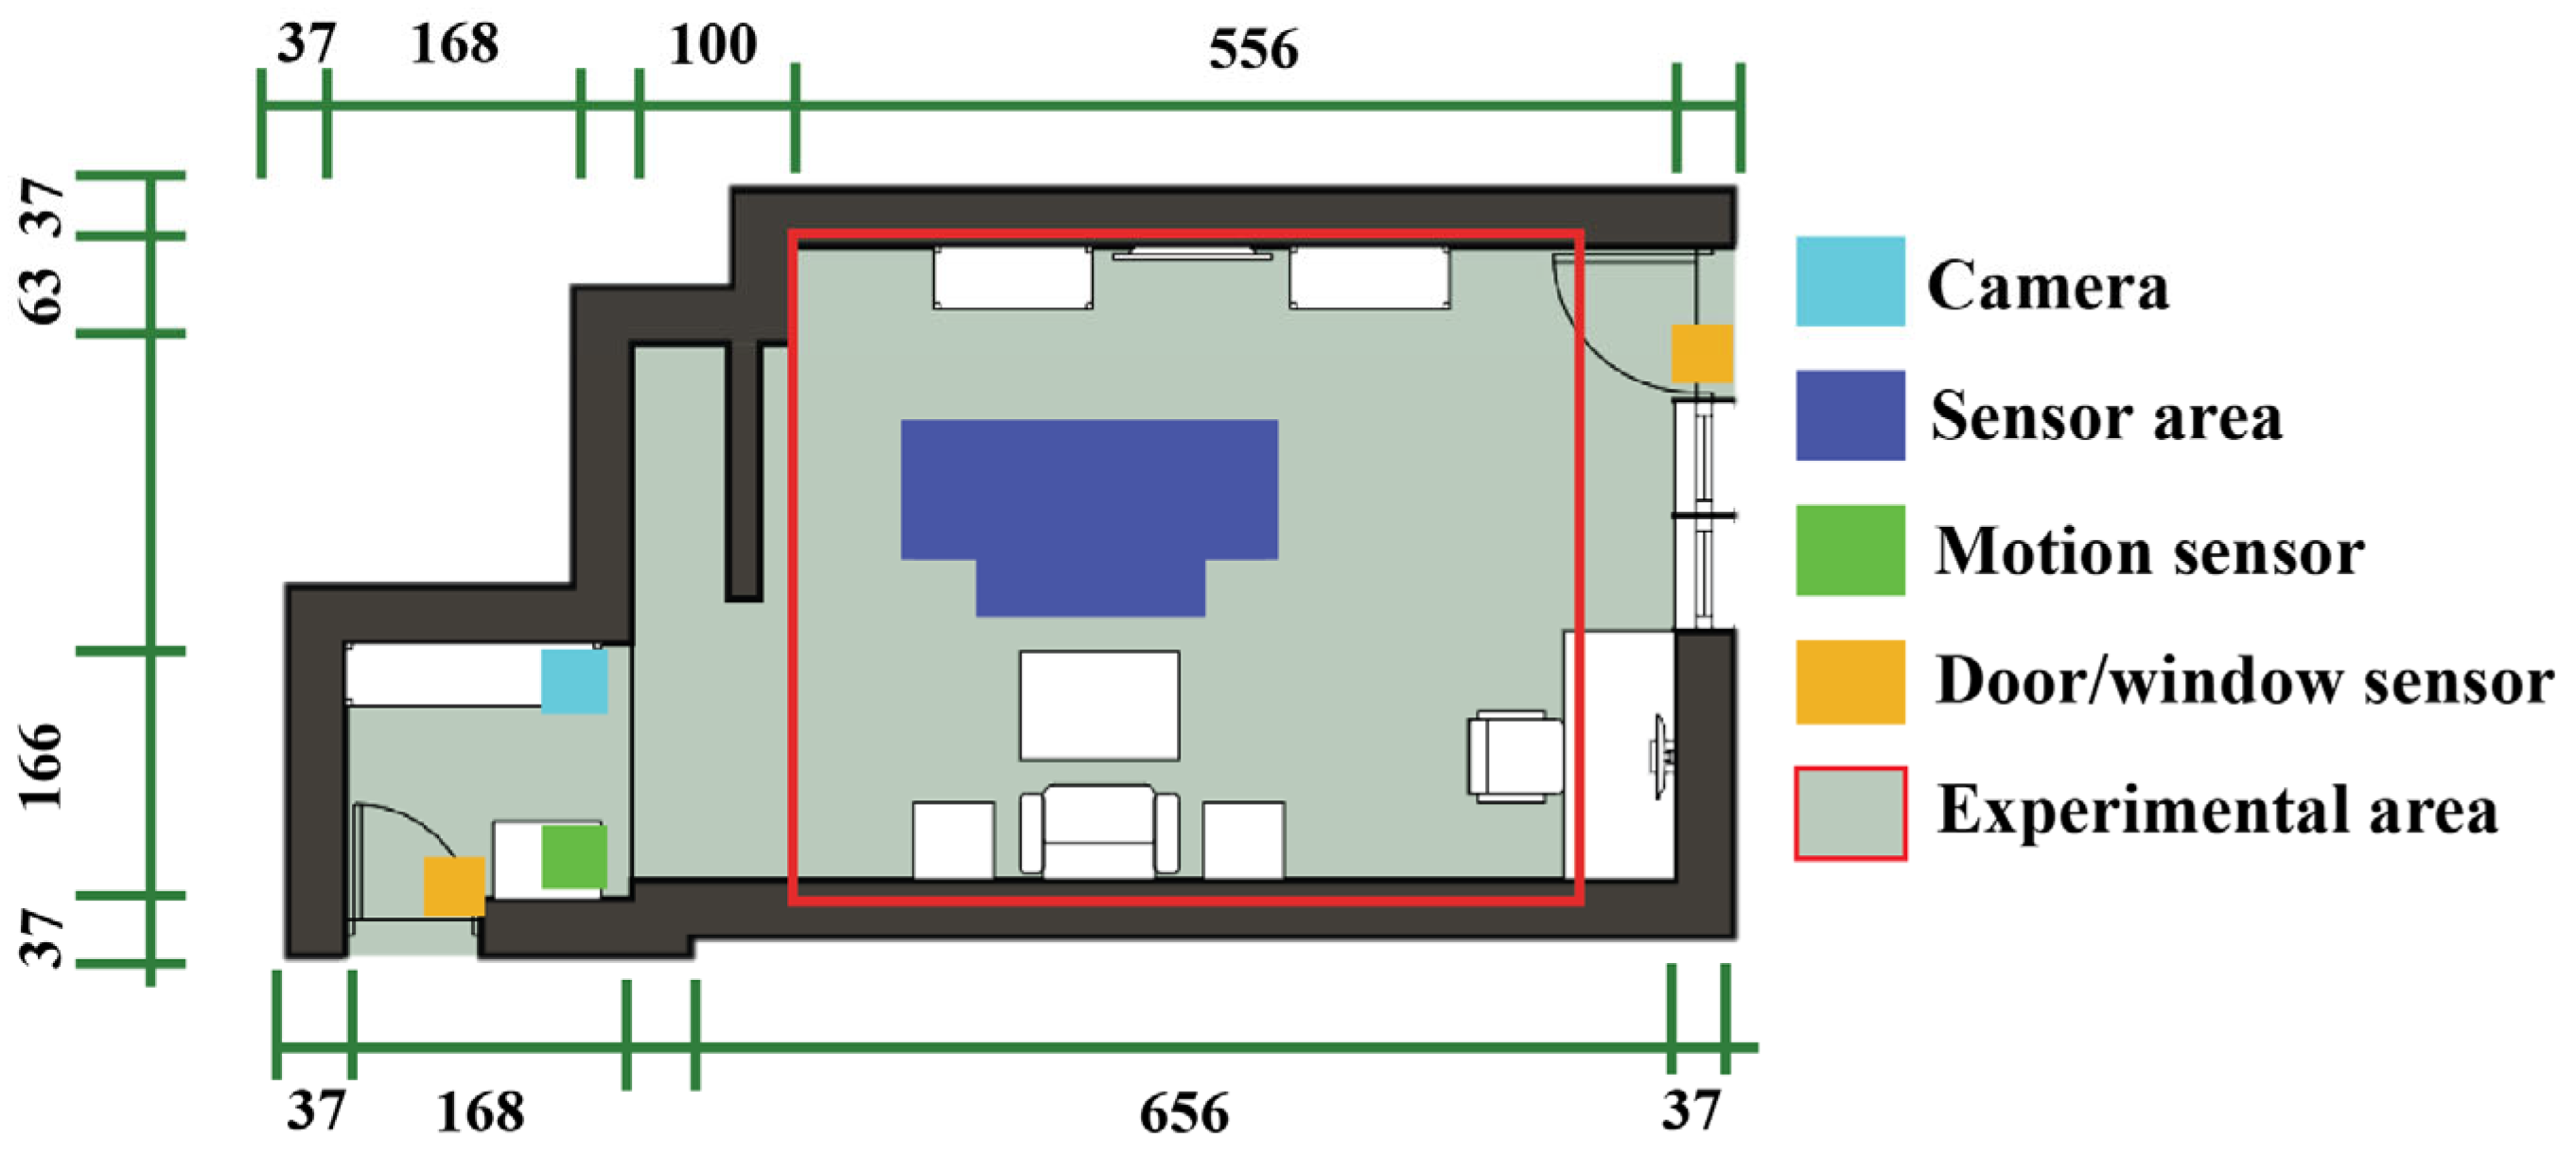
2.1. Experimental Setup and Instrumentation

BC concentrations were measured over a 24-day period, from 11 October to 3 November 2024, in a residential setting in Zagreb, Croatia (Figure 1). A BC monitor was used indoors to continuously capture high-resolution measurements of total black carbon, with source apportionment distinguishing between biomass burning and fossil fuel combustion, reported in nanograms per cubic meter (ng/m3). BC was measured using a dual-spot aethalometer (AE33, Magee Scientific, Portland, OR, USA), which records aerosol light absorption at seven wavelengths (370–950 nm). The instrument operated at a 1 min time resolution and a flow rate of 5 L/min, with online correction for filter loading via dual-spot technology. BC concentrations were calculated from attenuation at 880 nm using a mass absorption cross-section (MAC) of 7.77 m2/g and a multiple scattering parameter of 1.39 [34].
To understand the drivers of BC variability, additional environmental and behavioral data were collected in parallel, which are described in an indoor and ambient air pollution dataset using a multi-instrument approach and total event monitoring [35]. Human presence was monitored using a motion sensor and a camera, while the states of windows and doors were recorded using Xiaomi smart sensors (Beijing, China) installed at key access points. These contextual data allowed for the detection of main indoor emission events such as candle burning or occupancy-related ventilation. All indoor activities and experimental interventions were timestamped and recorded in a structured file, enabling precise temporal alignment between observed BC peaks and potential emission or ventilation events.
In addition to continuous monitoring, the study employed a structured experimental design to simulate everyday household activities known to influence indoor air quality. A total of 25 distinct events were conducted during the 24-day campaign, including activities such as candle burning, cooking (gas burner), diffuser use, vacuum cleaning, human presence, physical exercise, and heating via electric or central systems. Ventilation scenarios were also tested through controlled opening of doors to the garden and hallway, simulating infiltration of outdoor air under different conditions. Each event was carefully timestamped and annotated, recording the exact start and end times, event type, and conditions (e.g., doors open or closed). This enabled the alignment of high-resolution BC concentration data with specific indoor activities and environmental changes. The baseline period before each event was left undisturbed, and in most cases, a 15 min stabilization period preceded each new intervention to ensure comparability across experiments.
This setup enabled the differentiation between background indoor concentrations and activity-induced peaks, allowing for the assessment of event-driven variability in BC concentrations with minute-level precision. The reproducible structure of these interventions also facilitates statistical comparison between before, during, and after periods, supporting robust analysis of the impact of specific behaviors on indoor BC levels.

2.2. Statistical Analysis

To enable temporal alignment and comparison, data from motion detection, sensors, traffic recordings, and environmental monitoring were resampled or transformed into minute-level binary flags or averaged where appropriate. For each identified indoor activity or intervention (e.g., candle burning, cooking, diffuser use), BC concentrations were segmented into three time periods: before, during, and after the event. The event windows were defined based on a structured JSON log, with 10 min windows typically used for the before and after periods. Events were treated as independent, non-overlapping interventions. A short period on 30 October (11:20–11:22) was excluded from the analysis due to abnormally high BC readings (>8000 ng/m3) in the absence of any logged activity. This was considered a measurement artifact, likely linked to instrument initialization. To assess whether BC concentrations differed significantly across these periods, two complementary statistical tests were applied. One-way analysis of variance (ANOVA) was used to test for differences in mean BC concentrations between the three periods, assuming normality and equal variance. The Kruskal–Wallis H test, a non-parametric alternative, was used to validate results without assuming normal distribution of the data. p-values from both tests were reported for each event, and statistical significance was evaluated at α = 0.05. Events with significant p-values in either test were considered to have a measurable effect on BC concentrations.
In addition to event-based analysis, summary statistics (mean, minimum, maximum) of BC concentrations were calculated daily, and BC levels were also compared between daytime, nighttime, and late night periods to examine diurnal trends. Time of day segments were defined as follows: day: 07:00–22:59; night: 23:00–02:59; late night: 03:00–06:59. All analyses were conducted using Python (v3.10) with the pandas (v2.2.2), numpy (v1.26.4), scipy (v1.13.1), and matplotlib (v3.9.2) libraries. Generative AI tools were used during the preparation of this manuscript to support the review and structuring of Python code used in the analysis. Specifically, ChatGPT (Open-AI, GPT-4) was employed to improve clarity of language, check code logic, and suggest efficient implementation approaches. All outputs were critically evaluated, edited, and verified by the authors to ensure accuracy and scientific validity.

3. Results and Discussion

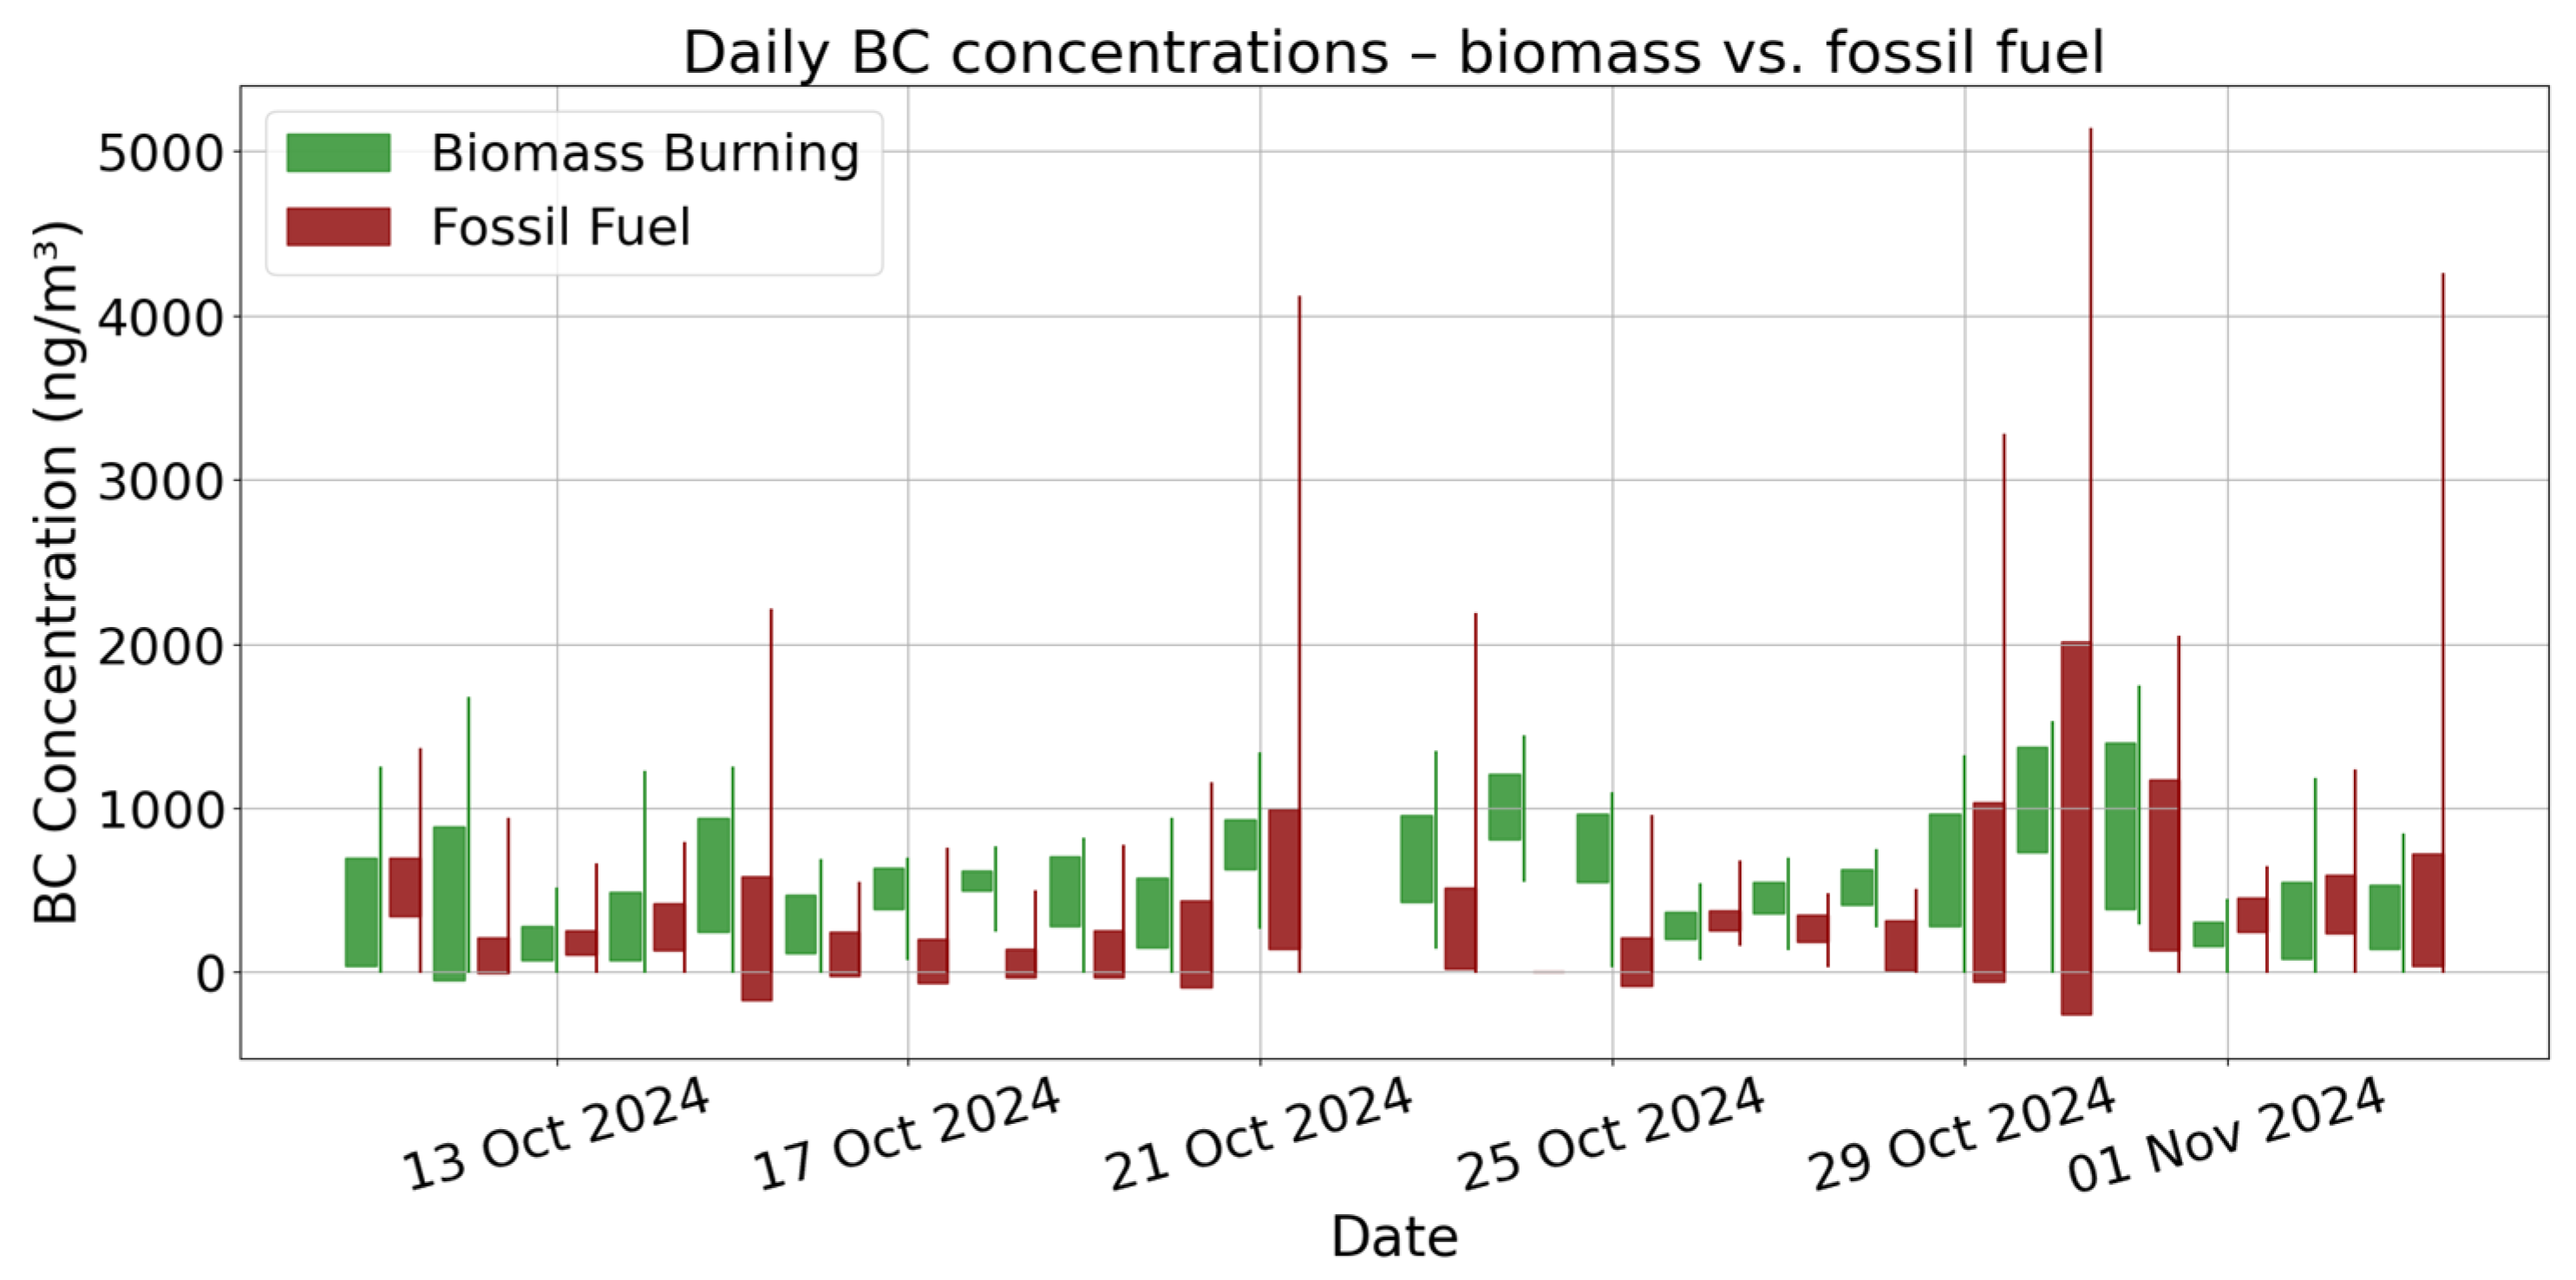
3.1. General Black Carbon Concentration Levels and Temporal Variability

During the 24-day monitoring campaign, indoor black carbon (BC) concentrations demonstrated notable day-to-day and hourly variability. Summary statistics of daily BC concentrations, including daily mean, minimum, and maximum values, are presented in Table 1.
Daily mean concentrations of total BC (biomass + fossil fuel) ranged from 356.62 ng/m3 on 13 October to a maximum of 1933.37 ng/m3 on 30 October. The highest single-minute BC concentration recorded was 5430 ng/m3, observed during a peak event on 21 October. Several days exceeded a mean around 1000 ng/m3, including 21 October (1347.43 ng/m3), 24 October (1009.46 ng/m3), 29 October (1111.63 ng/m3), 30 October (1943.82 ng/m3), and 31 October (1547.11 ng/m3), suggesting the occurrence of major indoor or nearby outdoor emission events. The highest biomass burning BC mean was observed on 30 October (1053.09 ng/m3), while the highest fossil fuel BC mean value occurred on the same day (880.28 ng/m3), suggesting that this day likely involved both indoor and infiltrated outdoor combustion sources.
Temporal variability and relative contributions of biomass and fossil fuel combustion to indoor BC levels are presented in Figure 2. Biomass-related BC exhibits more sustained elevations over more extended periods while, in contrast, fossil fuel BC shows sharper, transient peaks. Notably, several major BC peaks in the final third of the campaign are dominated by fossil fuel signals, explaining the importance of outdoor influences. When analyzed by time of day (Table 2), BC levels were typically higher during late night and nighttime periods. Total BC levels were highest at night (898.71 ng/m3), followed by late night (786.25 ng/m3), and lowest during the day (775.72 ng/m3). Biomass burning BC showed a clear increase outside of daytime, with the highest mean during the night (698.43 ng/m3) and late night (662.22 ng/m3), compared to 441.73 ng/m3 during the day. In contrast, fossil fuel BC exhibited a different relation, with higher daytime concentrations (333.60 ng/m3) and lower levels during late night (124.02 ng/m3). These results suggest that indoor sources such as biomass-related activities may dominate during periods of reduced ventilation and activity (night and late night), while fossil fuel-related BC may be more influenced by daytime outdoor infiltration or human-related activity patterns. These diurnal patterns, combined with sharp episodic spikes, explain the importance of high-resolution measurements to capture both background levels and short-term fluctuations.

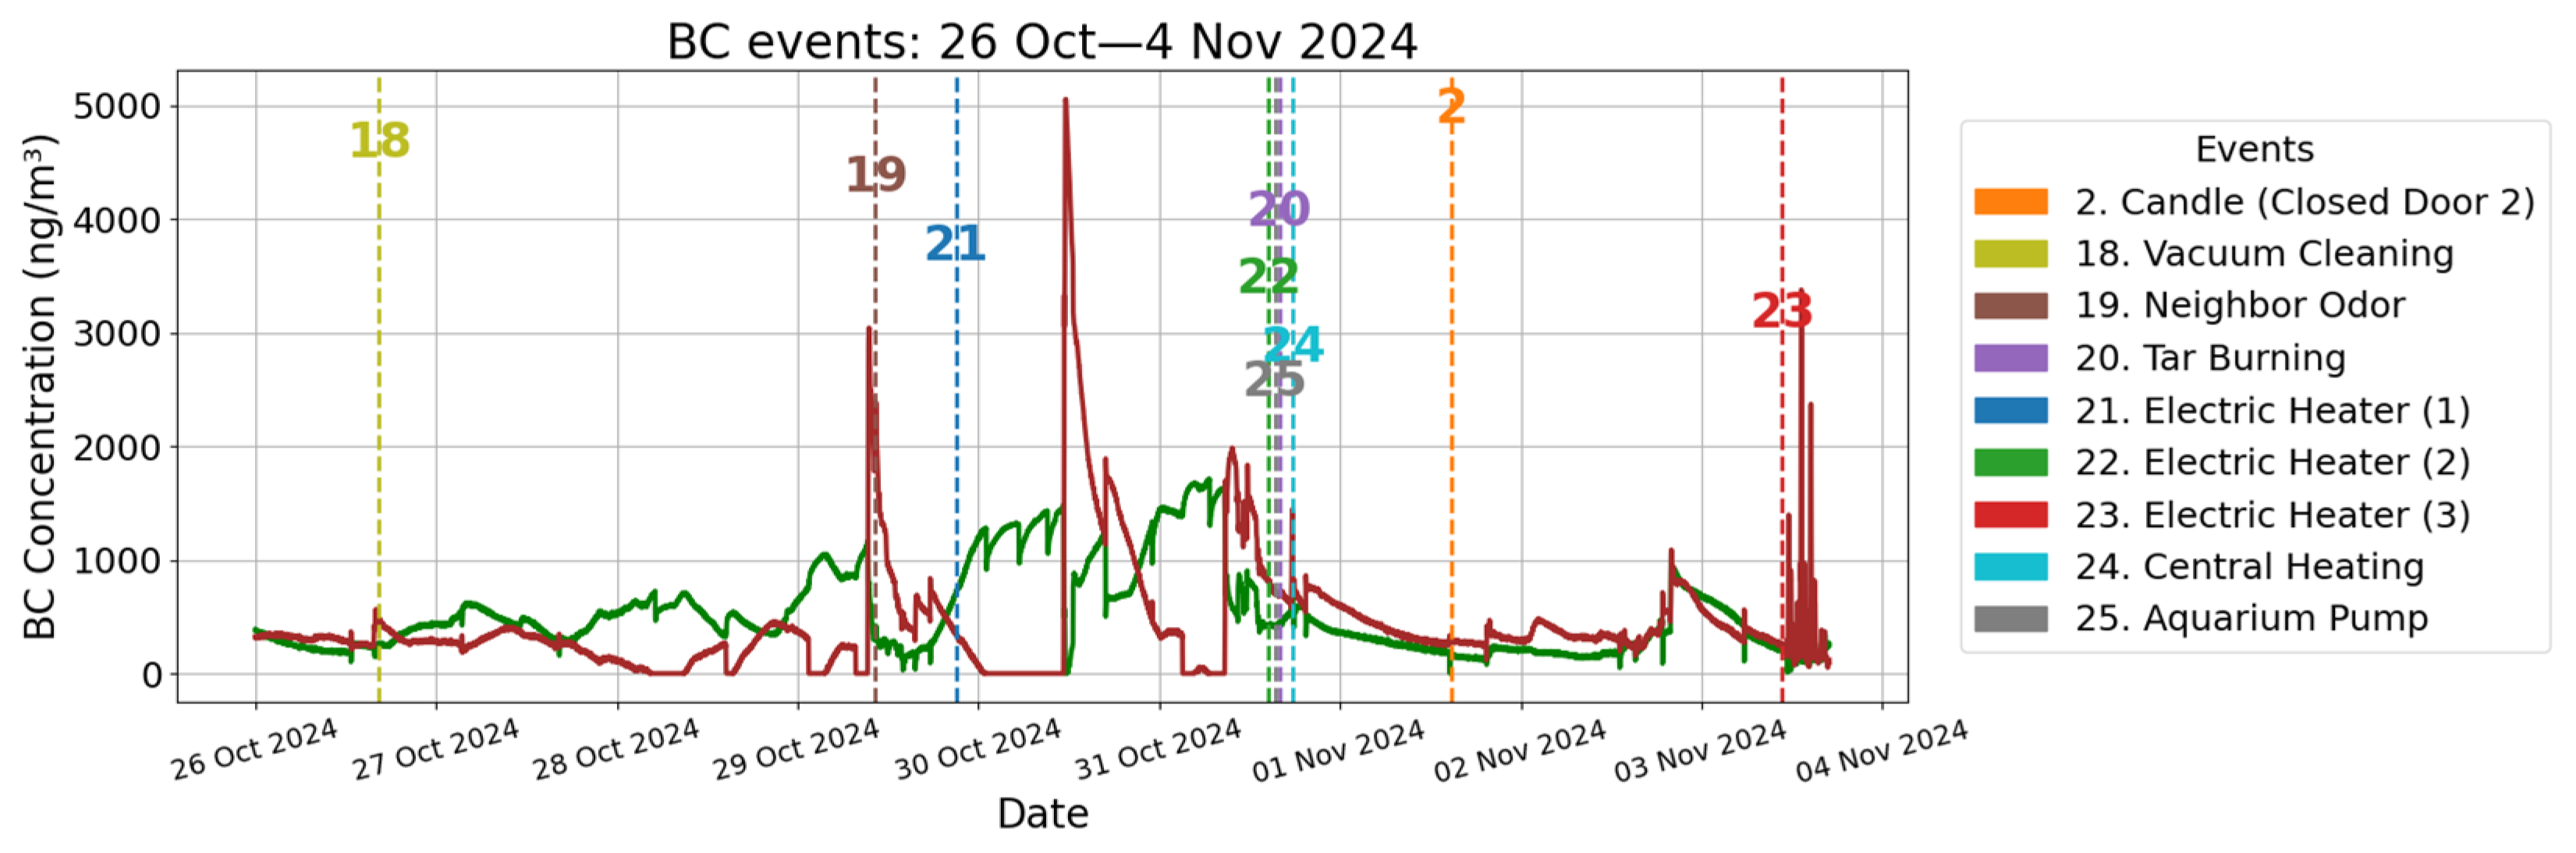
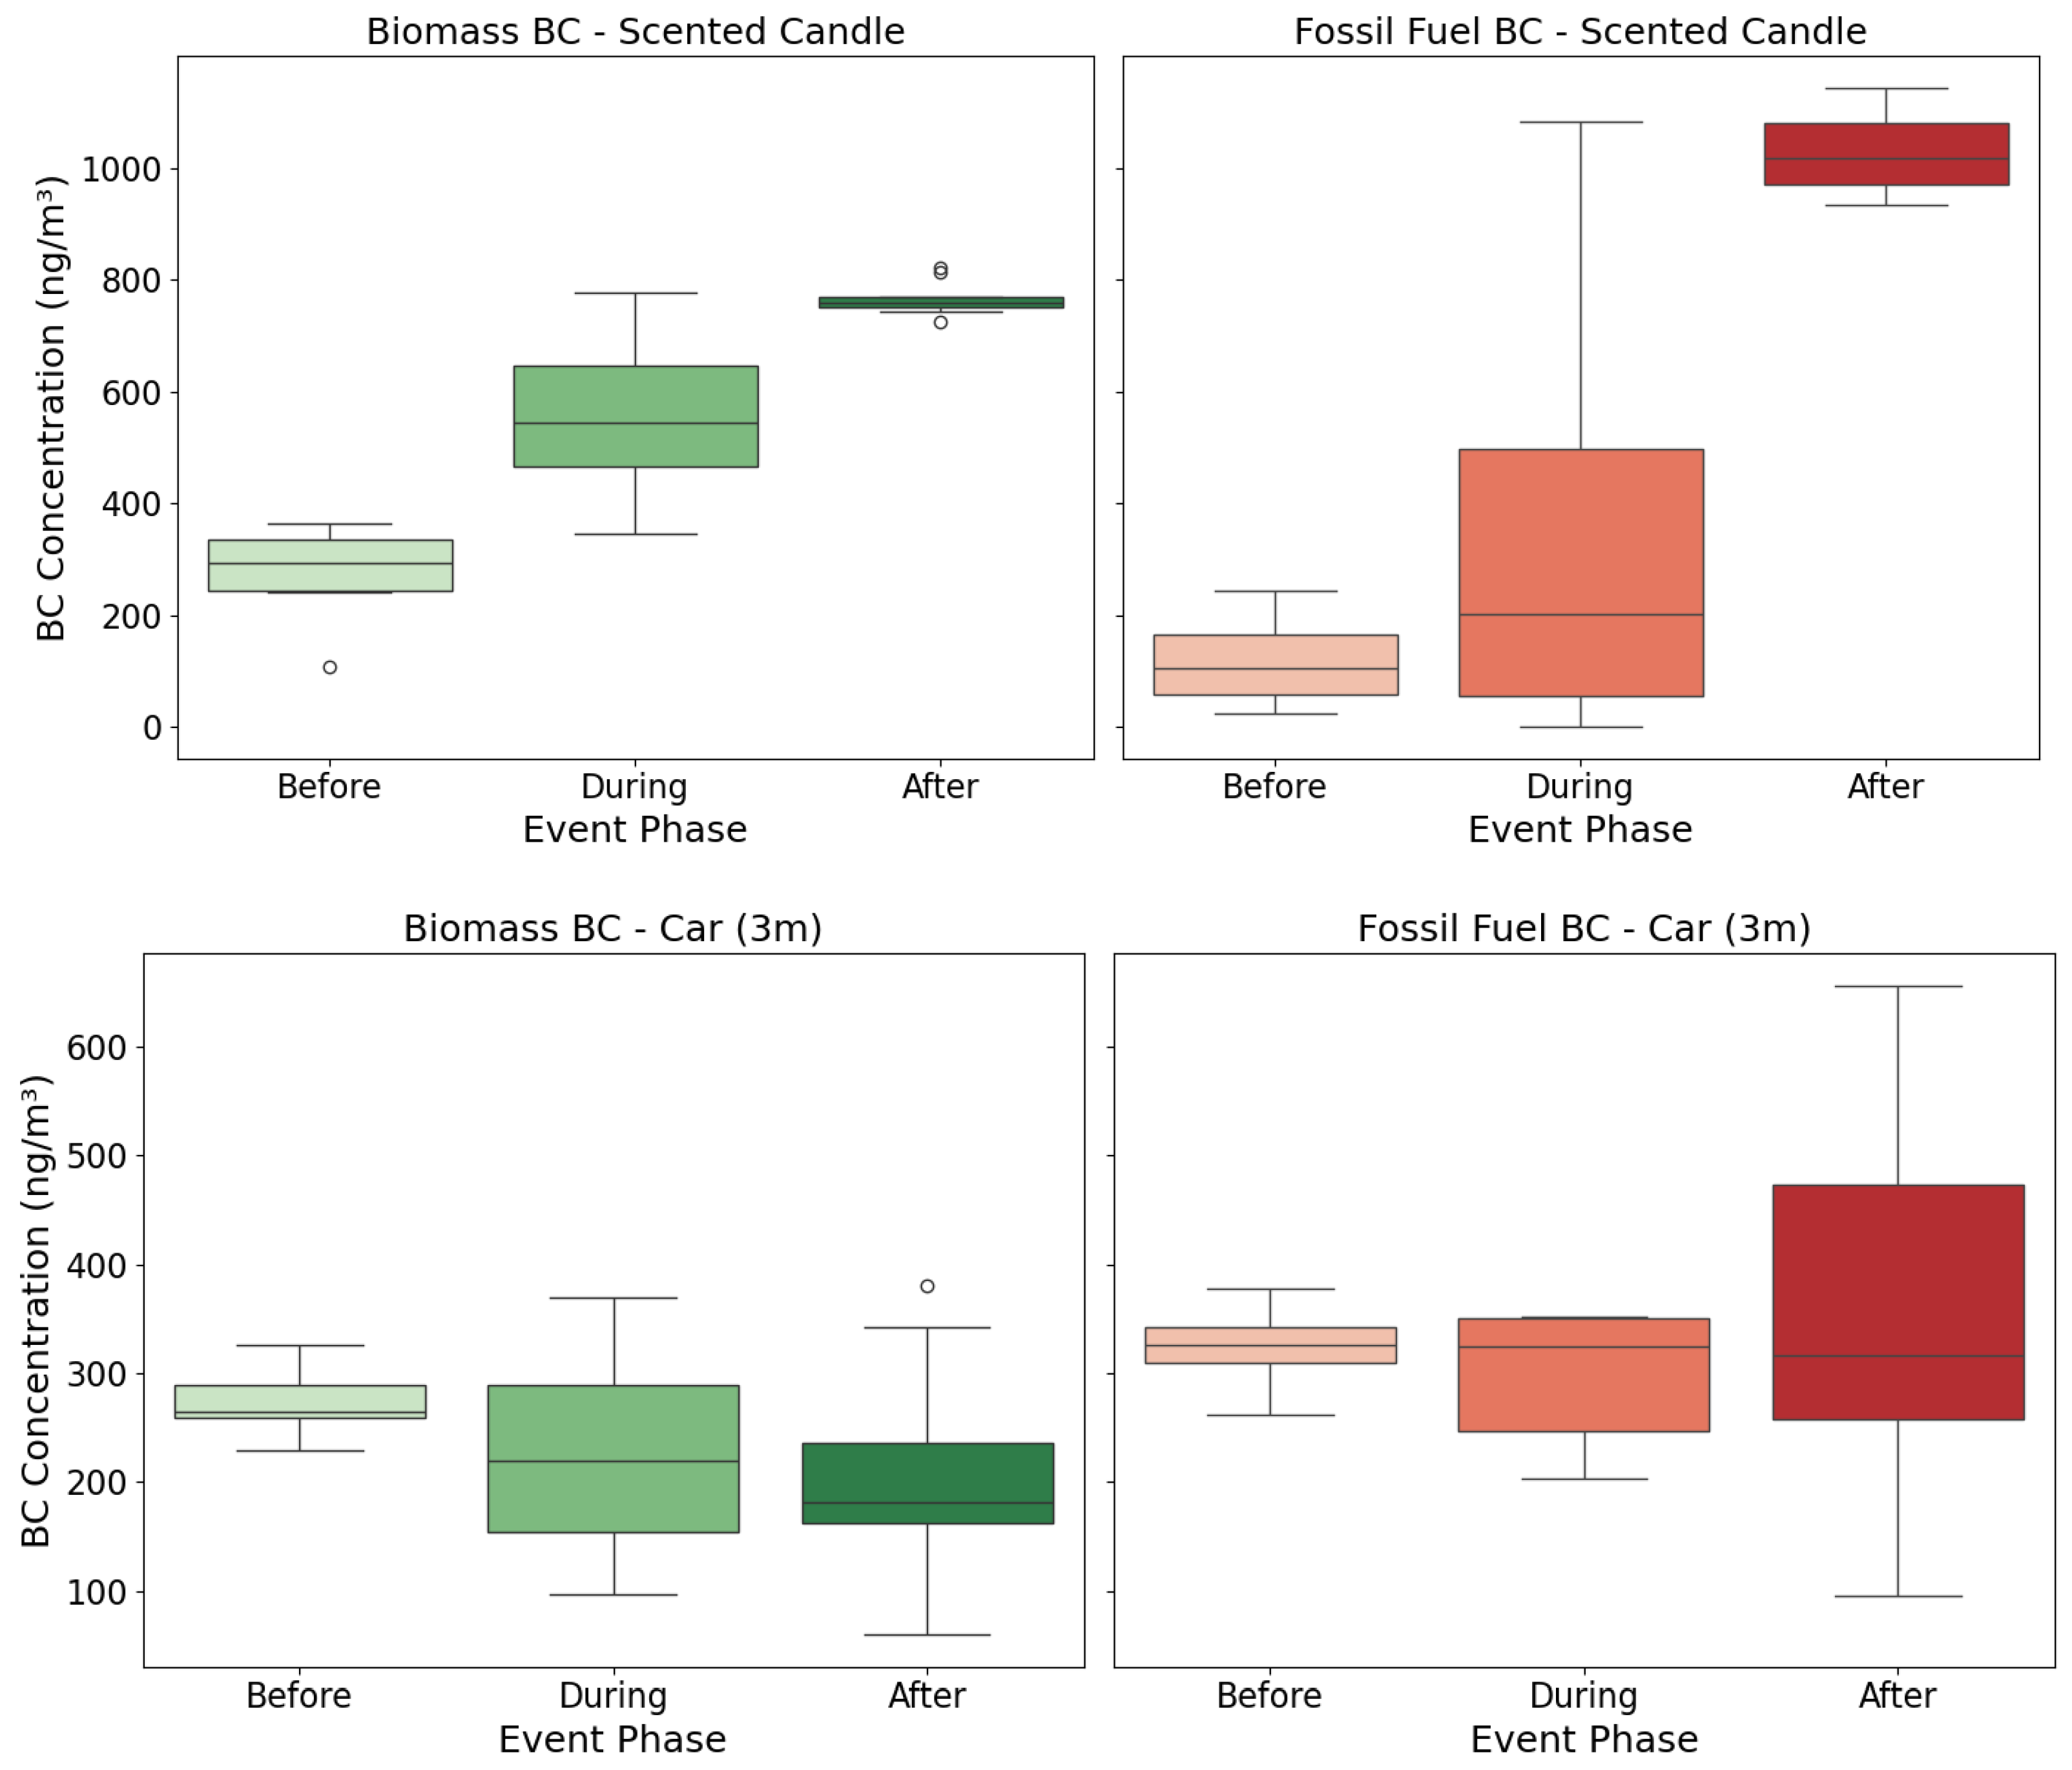
3.2. Impact of Indoor Activities on Black Carbon Concentrations

To assess how everyday household activities influence indoor BC concentrations, 25 controlled experiments were conducted over the monitoring period. Each experiment simulated a specific real-life scenario including combustion sources (e.g., candles, gas stove), human activity, ventilation, and external sources (e.g., traffic, burning).
Figure 3 shows the complete 24-day time series BC concentrations, with vertical dashed lines marking the timing of 25 experimental and real-life indoor events. The selected events encompass a diverse range of emission sources and activities, including combustion (e.g., scented candles, gas burners, radiator heating), human presence, ventilation behavior, and other everyday household actions (e.g., vacuum cleaning, aquarium pumps). Each event is labeled numerically on the plot and cross-referenced with the legend on the right.
Visual examination of the BC concentration time series reveals that several pronounced peaks are closely aligned with specific combustion-related activities, particularly the burning of a scented candle, operation of an electric heater, and activation of the central heating radiator. These events are among the highest peaks observed in the dataset, clearly indicating their substantial contribution to short-term increases in indoor BC concentrations. The elevated levels during and following these activities are consistent with known emission profiles of incomplete combustion and heat-generating devices, which are familiar sources of indoor BC. Events 11 (door Open—garden) and 13 (Doors Open—Garden + Hallway) were followed by moderate increases in BC from biomass burning, suggesting that these ventilation actions may have facilitated the infiltration of outdoor air polluted by nearby residential combustion and local traffic sources. In contrast, event 12 (Door Open—Hallway) did not lead to a noticeable BC increase, likely because the hallway served as an indoor buffer zone rather than an outdoor air pathway. Event 4 (Candle Burning—Open Door), occurring on 21 October, resulted in a pronounced spike in biomass-related BC, reflecting the strong impact of indoor combustion when doors are open and smoke can circulate more freely. These results illustrate how both external infiltration and indoor activities contribute to temporal variability in indoor BC, with indoor sources exerting a more immediate and substantial impact. Physical activity (events 9 and 10) had no discernible effect on BC levels, indicating that exercise alone does not generate or resuspend measurable BC particles. In contrast, events related to combustion and vehicle activity triggered apparent concentration shifts. Cars idling near the building (events 14 and 15—3 m and 5 m distance) corresponded with sharp increases in fossil fuel-related BC, confirming traffic emissions as an important external source of infiltration. Gas burner use caused noticeable spikes in fossil fuel BC, even under differing ventilation conditions. The scented candle event (event 3) induced increases in both biomass and fossil-related BC, possibly due to incomplete combustion or the candle’s complex chemical composition. Vacuum cleaning (event 18) led to only a modest increase in biomass BC, suggesting limited resuspension of particulate matter. In contrast, the neighbor’s odor event (unplanned event 19) produced one of the sharpest peaks in fossil fuel BC across the monitoring period, indicating strong infiltration through an opened door from nearby outdoor combustion. A similarly high peak was observed the following day (30 October), although no specific event was detected at that time; the similarity in intensity and profile suggests that it may have originated from a comparable nearby combustion source. All three electric heater events showed small but noticeable increases, particularly in fossil fuel BC, likely due to trace emissions or associated ventilation patterns.
The position of event timing with the fossil fuel and biomass burning component of the BC trends in this figure provides an overview of how real-life activities and environmental conditions impact indoor air pollution in residential settings. It visually supports the hypothesis that combustion-related behaviors are among the most significant drivers of indoor BC, while other activities may have negligible or context-dependent influence. This graphical representation serves as a foundational reference for the more rigorous quantitative comparisons presented in subsequent sections, including event-level statistical testing and concentration profiling. For each event, BC concentrations (biomass burning and fossil fuel) were analyzed before, during, and after the intervention, and evaluated using one-way ANOVA and Kruskal–Wallis tests to assess statistical significance (Table 3). Due to the distances in the events’ timing, all are considered independent of each other.
Events involving combustion or open ventilation pathways (e.g., scented candle, gas burner, or doors open to the garden or hallway) often showed highly significant changes in biomass BC concentrations, with p-values below 0.001 in both ANOVA and Kruskal–Wallis tests. Notably, human presence and physical activity (e.g., rowing) also influenced biomass BC, suggesting resuspension or indirect infiltration effects. In contrast, fossil fuel BC responses were more pronounced during short-term combustion sources such as the gas burner (open and closed door), neighbor burning odor, and electric heater usage, several of which exhibited highly significant increases (p < 0.001). Interestingly, while some events like the scented candle or diffusers triggered significant responses in both BC types, others were more selective; for instance, exercise and open door ventilation primarily influenced biomass BC, whereas fossil BC was minimally affected. Conversely, vacuum cleaning, typically considered a resuspension source, had no measurable impact on biomass BC but showed a significant increase in fossil BC. These results show the emission profiles and source sensitivities of the two BC subtypes and underscore the importance of disaggregated analysis for accurate source attribution and exposure assessment in indoor air quality research.
To better understand how specific household and environmental activities affect indoor BC concentrations, we analyzed two illustrative events using a pre/post-experimental design. For each, BC values were grouped into 15 min intervals before, during, and after the event. These groups were compared using boxplots (Figure 4) and the results were discussed in the context of ventilation, proximity to emission sources, and combustion type.
During the scented candle event, biomass-derived BC exhibited a consistent increase from the event period and further into the post-event phase, indicating that scented candles are a substantial source of biomass BC indoors. Interestingly, fossil fuel BC also increased, particularly after the event, suggesting either secondary emissions or inadequate post-combustion ventilation. In contrast, the car (3 m) event showed minimal change in biomass BC, consistent with expectations, but a notable rise in fossil fuel BC was observed after the event, reflecting short-term infiltration of combustion-related particles from the idling vehicle. The distributions of BC concentrations during the events were often more variable than those before or after. This increased variability likely reflects a combination of transient emission spikes, differences in source intensity, and dynamic airflow conditions (e.g., door/window positioning, or air mixing). For instance, the wide interquartile ranges and presence of outliers during the scented candle event suggest unstable dispersion of combustion particles and localized accumulation. In contrast, post-event concentrations for the car exposure case were consistently elevated, potentially due to delayed infiltration from outdoors or recirculation patterns near the sensor. These findings explain the value of separating BC by source to better understand indoor exposure dynamics and to connect specific activities contributing to biomass and fossil fuel PM.
Although the World Health Organization has not established a specific air quality guideline value for BC, it strongly recommends keeping BC concentrations as low as possible due to its carcinogenic properties and its role as a short-lived climate pollutant. According to the WHO Global Air Quality Guidelines, annual mean ambient BC concentrations in urban background settings typically range from 1.0 to 2.0 µg/m3, and significant health effects have been observed in epidemiological studies at mean BC levels as low as 1.08–1.15 µg/m3 [4]. In this study, several daily indoor mean concentrations approached or exceeded these levels, with the highest daily mean biomass BC reaching 1053.1 ng/m3 (1.05 µg/m3) and fossil fuel BC reaching 880.3 ng/m3 (0.88 µg/m3). Furthermore, peak 1 min values exceeded 5 µg/m3, highlighting potential short-term exposure spikes far above levels associated with adverse health outcomes in the literature. These findings revealed the health significance of indoor BC emissions, even in residential settings, and support strategies for reducing indoor exposure to combustion-related particles in line with WHO’s risk reduction approach.

4. Conclusions

This study provides a detailed, high-resolution assessment of indoor BC concentrations (biomass burning and fossil fuel components) in a residential setting over a 24-day period, capturing real-world variability driven by occupant behavior, combustion-related activities, and ventilation dynamics. By synchronizing minute-level BC measurements with a comprehensive log of timestamped experimental and natural events, including candle burning, cooking, heating, human presence, window/door usage, and outdoor traffic, we were able to isolate the specific influence of each source on indoor BC levels. Temporal analysis revealed daily and hourly variability in total BC, driven by both recurring indoor activities and episodic emission events. Through visual alignment of experimental activities with BC trends and statistical testing, we demonstrate that real-life indoor behaviors and environmental interactions have an influence on BC subtypes. Combustion-related activities, such as candle burning, gas burner use, and nearby combustion sources, were among the most influential, often causing statistically significant spikes in both biomass burning and fossil fuel BC concentrations. Ventilation-related events (e.g., door opening) typically elevated biomass BC, indicating the infiltration of outdoor air. At the same time, short-term mechanical sources like electric heaters and vehicle proximity were more associated with fossil-derived BC increases. In contrast, activities such as human presence or exercise had minor or inconsistent impacts, emphasizing the importance of source type and proximity.
Disaggregating BC into biomass burning and fossil fuel components revealed behavioral differences that would be masked when using total BC alone, enabling a more precise understanding of indoor exposure dynamics. The combined use of time-aligned visualization and event-level statistical testing proved effective in identifying which activities pose the greatest risk to indoor air quality. In summary, the study reveals the central role of combustion sources in indoor BC levels and establishes a framework for event-based pollutant profiling using synchronized sensor networks. While this study offers detailed insights, its findings are based on a single household, which may limit generalizability to other settings. However, due to the demanding nature of high-resolution, multi-sensor monitoring, this approach serves as a methodological foundation. Also, the current study provides detailed short-term information about BC behavior but does not show long-term seasonal variability. Future work should address this by extending monitoring across multiple seasons, diverse building types, and additional pollutants to assess how changes in heating practices, ventilation habits, and outdoor conditions influence indoor BC composition and concentrations.

Author Contributions

Conceptualization, N.R., M.L. and F.M.; Data Curation, S.F., A.C.K. and V.P.; Formal Analysis, N.R.; Investigation, V.P. and S.F.; Methodology, N.R. and M.L.; Resources, M.L., F.M. and S.F.; Supervision, M.L. and F.M.; Visualization, N.R.; Writing—Original Draft, N.R.; Writing—Review and Editing, M.L., S.F. and F.M. All authors have read and agreed to the published version of the manuscript.

Funding

This study was funded by the Horizon Europe programme under the EDIAQI project, Grant ID: 101057497. N.R. is supported by Next Generation EU under the EnvironPollutHealth project, Program Contract of 8 December 2023, Class: 643-02/23-01/00016, Reg. no. 533-03-23-0006. This work was also supported by the IP-2024-05-6224 project funded by the Croatian Science Foundation: “A burning issue of air pollution in the Adriatic coastal zone: insights into the ageing of aerosol properties and impacts on human and environmental health”.

Institutional Review Board Statement

Not applicable.

Informed Consent Statement

Not applicable.

Data Availability Statement

The dataset supporting the findings of this study is publicly available at https://doi.org/10.5281/zenodo.15224267.

Acknowledgments

We gratefully acknowledge the use of facilities and equipment at the Institute for Medical Research and Occupational Health, made possible through the European Regional Development Fund project KK.01.1.1.02.0007: Research and Education Centre of Environmental Health and Radiation Protection—Reconstruction and Expansion of the Institute for Medical Research and Occupational Health. During the preparation of this manuscript, the author(s) used ChatGPT (OpenAI, GPT-4) to assist in reviewing and refining written content, as well as for support in developing and debugging code. The author(s) have reviewed and edited all outputs and take full responsibility for the accuracy and integrity of the final manuscript.

Conflicts of Interest

Author V.P. was employed by the company Ascalia d.o.o., The remaining authors declare that the research was conducted in the absence of any commercial or financial relation-ships that could be construed as a potential conflict of interest.

References

  1. Cakaj, A.; Lisiak-Zielińska, M.; Khaniabadi, Y.O.; Sicard, P. Premature Deaths Related to Urban Air Pollution in Poland. Atmos. Environ. 2023, 301, 119723. [Google Scholar] [CrossRef]
  2. Khomenko, S.; Cirach, M.; Pereira-Barboza, E.; Mueller, N.; Barrera-Gómez, J.; Rojas-Rueda, D.; De Hoogh, K.; Hoek, G.; Nieuwenhuijsen, M. Premature Mortality Due to Air Pollution in European Cities: A Health Impact Assessment. Lancet Planet. Health 2021, 5, e121–e134. [Google Scholar] [CrossRef]
  3. Lelieveld, J.; Evans, J.S.; Fnais, M.; Giannadaki, D.; Pozzer, A. The Contribution of Outdoor Air Pollution Sources to Premature Mortality on a Global Scale. Nature 2015, 525, 367–371. [Google Scholar] [CrossRef] [PubMed]
  4. World Health Organization. WHO Global Air Quality Guidelines: Particulate Matter (PM2.5 and PM10), Ozone, Nitrogen Dioxide, Sulfur Dioxide and Carbon Monoxide; WHO European Centre for Environment and Health: Bonn, Germany, 2021; ISBN 9789240034228. [Google Scholar]
  5. Alahmad, B.; Khraishah, H.; Althalji, K.; Borchert, W.; Al-Mulla, F.; Koutrakis, P. Connections Between Air Pollution, Climate Change, and Cardiovascular Health. Can. J. Cardiol. 2023, 39, 1182–1190. [Google Scholar] [CrossRef] [PubMed]
  6. Anderson, J.O.; Thundiyil, J.G.; Stolbach, A. Clearing the Air: A Review of the Effects of Particulate Matter Air Pollution on Human Health. J. Med. Toxicol. 2012, 8, 166–175. [Google Scholar] [CrossRef]
  7. Fordyce, T.A.; Leonhard, M.J.; Chang, E.T. A Critical Review of Developmental Exposure to Particulate Matter, Autism Spectrum Disorder, and Attention Deficit Hyperactivity Disorder. J. Environ. Sci. Health Part A 2018, 53, 174–204. [Google Scholar] [CrossRef]
  8. Idani, E.; Geravandi, S.; Akhzari, M.; Goudarzi, G.; Alavi, N.; Yari, A.R.; Mehrpour, M.; Khavasi, M.; Bahmaei, J.; Bostan, H.; et al. Characteristics, Sources, and Health Risks of Atmospheric PM10 -Bound Heavy Metals in a Populated Middle Eastern City. Toxin Rev. 2020, 39, 266–274. [Google Scholar] [CrossRef]
  9. Lin, L.-Z.; Zhan, X.-L.; Jin, C.-Y.; Liang, J.-H.; Jing, J.; Dong, G.-H. The Epidemiological Evidence Linking Exposure to Ambient Particulate Matter with Neurodevelopmental Disorders: A Systematic Review and Meta-Analysis. Environ. Res. 2022, 209, 112876. [Google Scholar] [CrossRef]
  10. Shang, M.; Tang, M.; Xue, Y. Neurodevelopmental Toxicity Induced by Airborne Particulate Matter. J. Appl. Toxicol. 2023, 43, 167–185. [Google Scholar] [CrossRef]
  11. Anenberg, S.C.; Schwartz, J.; Shindell, D.; Amann, M.; Faluvegi, G.; Klimont, Z.; Janssens-Maenhout, G.; Pozzoli, L.; Van Dingenen, R.; Vignati, E.; et al. Global Air Quality and Health Co-Benefits of Mitigating Near-Term Climate Change through Methane and Black Carbon Emission Controls. Environ. Health Perspect. 2012, 120, 831–839. [Google Scholar] [CrossRef]
  12. Grahame, T.J.; Klemm, R.; Schlesinger, R.B. Public Health and Components of Particulate Matter: The Changing Assessment of Black Carbon. J. Air Waste Manag. Assoc. 2014, 64, 620–660. [Google Scholar] [CrossRef]
  13. Jansen, K.L.; Larson, T.V.; Koenig, J.Q.; Mar, T.F.; Fields, C.; Stewart, J.; Lippmann, M. Associations between Health Effects and Particulate Matter and Black Carbon in Subjects with Respiratory Disease. Environ. Health Perspect. 2005, 113, 1741–1746. [Google Scholar] [CrossRef] [PubMed]
  14. Janssen, N.A.H.; Hoek, G.; Simic-Lawson, M.; Fischer, P.; Van Bree, L.; Ten Brink, H.; Keuken, M.; Atkinson, R.W.; Anderson, H.R.; Brunekreef, B.; et al. Black Carbon as an Additional Indicator of the Adverse Health Effects of Airborne Particles Compared with PM10 and PM2.5. Environ. Health Perspect. 2011, 119, 1691–1699. [Google Scholar] [CrossRef] [PubMed]
  15. Zhang, Z.; Cheng, Y.; Liang, L.; Liu, J. The Measurement of Atmospheric Black Carbon: A Review. Toxics 2023, 11, 975. [Google Scholar] [CrossRef]
  16. Lei, W.; Li, X.; Yin, Z.; Zhang, L.; Zhao, W. Pollution Characteristics and Source Apportionment of Black Carbon Aerosols During Spring in Beijing. Toxics 2024, 12, 202. [Google Scholar] [CrossRef] [PubMed]
  17. Shrestha, G.; Traina, S.J.; Swanston, C.W. Black Carbon’s Properties and Role in the Environment: A Comprehensive Review. Sustainability 2010, 2, 294–320. [Google Scholar] [CrossRef]
  18. Kirrane, E.F.; Luben, T.J.; Benson, A.; Owens, E.O.; Sacks, J.D.; Dutton, S.J.; Madden, M.; Nichols, J.L. A Systematic Review of Cardiovascular Responses Associated with Ambient Black Carbon and Fine Particulate Matter. Environ. Int. 2019, 127, 305–316. [Google Scholar] [CrossRef]
  19. Luben, T.J.; Nichols, J.L.; Dutton, S.J.; Kirrane, E.; Owens, E.O.; Datko-Williams, L.; Madden, M.; Sacks, J.D. A Systematic Review of Cardiovascular Emergency Department Visits, Hospital Admissions and Mortality Associated with Ambient Black Carbon. Environ. Int. 2017, 107, 154–162. [Google Scholar] [CrossRef]
  20. Bauer, K.; Bosker, T.; Dirks, K.N.; Behrens, P. The Impact of Seating Location on Black Carbon Exposure in Public Transit Buses: Implications for Vulnerable Groups. Transp. Res. Part D Transp. Environ. 2018, 62, 577–583. [Google Scholar] [CrossRef]
  21. Cunha-Lopes, I.; Martins, V.; Faria, T.; Correia, C.; Almeida, S.M. Children’s Exposure to Sized-Fractioned Particulate Matter and Black Carbon in an Urban Environment. Build. Environ. 2019, 155, 187–194. [Google Scholar] [CrossRef]
  22. Suglia, S.F.; Gryparis, A.; Wright, R.O.; Schwartz, J.; Wright, R.J. Association of Black Carbon with Cognition among Children in a Prospective Birth Cohort Study. Am. J. Epidemiol. 2007, 167, 280–286. [Google Scholar] [CrossRef] [PubMed]
  23. Lovrić, M.; Račić, N.; Pehnec, G.; Horvat, T.; Lovrić Štefiček, M.J.; Jakovljević, I. Indoor Polycyclic Aromatic Hydrocarbons—Relationship to Ambient Air, Risk Estimation, and Source Apportionment Based on Household Measurements. Atmosphere 2024, 15, 1525. [Google Scholar] [CrossRef]
  24. Lovrić, M.; Gajski, G.; Fernández-Agüera, J.; Pöhlker, M.; Gursch, H.; The EDIAQI Consortium; Borg, A.; Switters, J.; Mureddu, F. Evidence Driven Indoor Air Quality Improvement: An Innovative and Interdisciplinary Approach to Improving Indoor Air Quality. BioFactors 2025, 51, e2126. [Google Scholar] [CrossRef]
  25. Briggs, N.L.; Long, C.M. Critical Review of Black Carbon and Elemental Carbon Source Apportionment in Europe and the United States. Atmos. Environ. 2016, 144, 409–427. [Google Scholar] [CrossRef]
  26. LaRosa, L.E.; Buckley, T.J.; Wallace, L.A. Real-Time Indoor and Outdoor Measurements of Black Carbon in an Occupied House: An Examination of Sources. J. Air Waste Manag. Assoc. 2002, 52, 41–49. [Google Scholar] [CrossRef] [PubMed]
  27. Rönkkö, T.; Saarikoski, S.; Kuittinen, N.; Karjalainen, P.; Keskinen, H.; Järvinen, A.; Mylläri, F.; Aakko-Saksa, P.; Timonen, H. Review of Black Carbon Emission Factors from Different Anthropogenic Sources. Environ. Res. Lett. 2023, 18, 033004. [Google Scholar] [CrossRef]
  28. Healy, R.M.; Sofowote, U.; Su, Y.; Debosz, J.; Noble, M.; Jeong, C.-H.; Wang, J.M.; Hilker, N.; Evans, G.J.; Doerksen, G.; et al. Ambient Measurements and Source Apportionment of Fossil Fuel and Biomass Burning Black Carbon in Ontario. Atmos. Environ. 2017, 161, 34–47. [Google Scholar] [CrossRef]
  29. Saarikoski, S.; Niemi, J.V.; Aurela, M.; Pirjola, L.; Kousa, A.; Rönkkö, T.; Timonen, H. Sources of Black Carbon at Residential and Traffic Environments Obtained by Two Source Apportionment Methods. Atmos. Chem. Phys. 2021, 21, 14851–14869. [Google Scholar] [CrossRef]
  30. Singh, S.; Tiwari, S.; Hopke, P.K.; Zhou, C.; Turner, J.R.; Panicker, A.S.; Singh, P.K. Ambient Black Carbon Particulate Matter in the Coal Region of Dhanbad, India. Sci. Total Environ. 2018, 615, 955–963. [Google Scholar] [CrossRef]
  31. Cyrys, J.; Pitz, M.; Bischof, W.; Wichmann, H.; Heinrich, J. Relationship Between Indoor and Outdoor Levels of Fine Particle Mass, Particle Number Concentrations and Black Smoke under Different Ventilation Conditions. J. Expo. Sci. Environ. Epidemiol. 2004, 14, 275–283. [Google Scholar] [CrossRef]
  32. Isiugo, K.; Jandarov, R.; Cox, J.; Chillrud, S.; Grinshpun, S.A.; Hyttinen, M.; Yermakov, M.; Wang, J.; Ross, J.; Reponen, T. Predicting Indoor Concentrations of Black Carbon in Residential Environments. Atmos. Environ. 2019, 201, 223–230. [Google Scholar] [CrossRef] [PubMed]
  33. Zhao, J.; Fung, P.L.; Zaidan, M.A.; Wehner, B.; Weinhold, K.; Wiedensohler, A.; Hussein, T. Indoor Black Carbon Concentrations and Their Sources in Residential Environments: Validation of an Input-Adaptive Proxy Model. Aerosol Air Qual. Res. 2024, 24, 230228. [Google Scholar] [CrossRef]
  34. Drinovec, L.; Močnik, G.; Zotter, P.; Prévôt, A.S.H.; Ruckstuhl, C.; Coz, E.; Rupakheti, M.; Sciare, J.; Müller, T.; Wiedensohler, A.; et al. The “Dual-Spot” Aethalometer: An Improved Measurement of Aerosol Black Carbon with Real-Time Loading Compensation. Atmos. Meas. Tech. 2015, 8, 1965–1979. [Google Scholar] [CrossRef]
  35. Lovrić, M.; Petrić, V.; Strbad, D.; Terzić, T.; Frka, S.; Cvitešić Kušan, A.; Fermoso, J.; Düsing, S.; Dawn Alas, H.; Dobrić Ladavac, M.; et al. Indoor and Ambient Air Pollution Dataset Using a Multi-Instrument Approach and Total Event Monitoring; EU Open Research Repository: Brussel, Belgium, 2025. [Google Scholar] [CrossRef]
Figure 1. Experimental room layout and sensor placement in residential monitoring setup (measured in cm).
Toxics 13 00536 g001
Figure 2. Time series of BC concentrations from biomass burning and fossil fuel combustion over 24-day indoor monitoring period. Each bar represents daily mean ± standard deviation and full min–max range of indoor BC levels in residential setting in Zagreb, Croatia.
Toxics 13 00536 g002
Figure 3. Temporal BC concentration (biomass burning—green; fossil fuel—red) with 25 experimental events.
Toxics 13 00536 g003aToxics 13 00536 g003b
Figure 4. Changes in indoor biomass BC (green) and fossil fuel BC (red) concentrations before (lighter shades), during, and after (darker shades) selected combustion and infiltration events. Outliers are shown as hollow circles.
Toxics 13 00536 g004
Table 1. General statistics for monitored period, daily values; total BC (TBC), biomass burning (BB), fossil fuel (FF), nan indicates missing value.
DateMean (TBC)Min (TBC)Max (TBC)Mean (BB)Mean (FF)
11 October 2024884.43941753363.83517.42
12 October 2024518.8631784417.17101.04
13 October 2024356.62481037174.72181.89
14 October 2024558.02841228281.01276.82
15 October 2024799.07603047592.16206.49
16 October 2024398.84152692288.84109.8
17 October 2024576.4478994509.5366.91
18 October 2024612.88337801559.6853.19
19 October 2024604.58195812491.2113.38
20 October 2024532.97841904360.89171.57
21 October 20241347.435585430779.39568.04
22 October 2024nannannannannan
23 October 2024957.786962964691.57266.22
24 October 20241009.4656114331009.460
25 October 2024817.935111085754.9662.98
26 October 2024593.08407797280.28312.79
27 October 2024718.3430903450.99267.31
28 October 2024681.643341026520.16161.48
29 October 20241111.631573900623.39488.23
30 October 20241933.3788151331053.09880.28
31 October 20241547.119302833892.46654.65
1 November 2024579.33116994230.07349.1
2 November 2024729.32312151311.93416.95
3 November 2024716.84145083336.16379.34
Table 2. Statistics for the time of the day; total BC (TBC), biomass burning (BB), fossil fuel (FF).
MetricDayLate NightNight
BB BC Mean441.73662.22698.43
BB BC Min000
BB BC Max165417361666
FF BC Mean333.6124.02200.27
FF BC Min000
FF BC Max5133561.38929
TBC Mean775.72786.25898.71
TBC Min14152213
TBC Max543017661833
Table 3. Results of ANOVA and Kruskal–Wallis tests (with p < 0.05 marked in red) for BC from biomass burning (BB) and fossil fuel (FF).
EventANOVA, p (BB)Kruskal, p (BB)ANOVA, p (FF)Kruskal, p (FF)
Candle Burning (Closed Door 1)0.2800.2180.0730.057
Candle Burning (Closed Door 2)0.8520.8840.8850.721
Scented Candle0.0000.0000.0000.000
Candle Burning (Open Door)0.0010.0000.0280.002
Gas Burner (Closed Door)0.2220.3170.0180.023
Gas Burner (Open Door)0.0000.0000.0000.000
Human Presence (1)0.0070.0100.0000.001
Human Presence (2)0.0000.0000.0000.000
Exercise Rowing (Closed Door)0.0000.0000.6970.867
Exercise Rowing (Open Door)0.0000.0000.1920.142
Door Open to Garden0.0000.0000.5660.381
Door Open to Hallway0.0000.0000.3590.418
Doors Open (Garden + Hallway)0.0000.0000.1920.064
Car Running (3 m from door)0.1410.0850.0000.003
Car Running (5 m from door)0.0170.0370.9710.983
Diffuser (Water)0.0110.0230.0000.001
Diffuser (Oil)0.0010.0010.0000.000
Vacuum Cleaning (Windows Closed)0.8930.9220.0000.000
Neighbor Burning Odor0.0000.0090.0000.000
Tar Burning (Unplanned Event)0.8210.7370.2780.295
Electric Heater (1)0.0000.0000.0730.057
Electric Heater (2)0.9900.9390.8850.721
Electric Heater (3)0.1430.0610.0000.000
Central Heating (Radiator)0.0000.0000.0280.002
Aquarium Pump0.3830.6140.0180.023
Disclaimer/Publisher’s Note: The statements, opinions and data contained in all publications are solely those of the individual author(s) and contributor(s) and not of MDPI and/or the editor(s). MDPI and/or the editor(s) disclaim responsibility for any injury to people or property resulting from any ideas, methods, instructions or products referred to in the content.

