Article

Ozone Aggravated the Toxicity of Fine Particulate Matter by Impairing Membrane Stability and Facilitating Particle Internalization

1
Institutes of Physical Science and Information Technology, Anhui University, Hefei 230601, China
2
Anhui Province Key Laboratory of Environmental Toxicology and Pollution Control Technology, High Magnetic Field Laboratory, HFIPS, Chinese Academy of Sciences, Hefei 230031, China
3
School of Public Health, Anhui University of Science and Technology, Hefei 231131, China
4
Science Island Branch, Graduate School of USTC, University of Science and Technology of China, Hefei 230026, China
*
Authors to whom correspondence should be addressed.
These authors contributed equally to this work.
Toxics 2025, 13(6), 446; https://doi.org/10.3390/toxics13060446
Submission received: 21 April 2025 / Revised: 22 May 2025 / Accepted: 26 May 2025 / Published: 28 May 2025
(This article belongs to the Section Air Pollution and Health)

Abstract

The combined pollution of fine particulate matter (PM2.5) and ozone (O3) is increasing synergistically on a global scale, posing a serious threat to human health. However, the joint toxicity and the underlying mechanisms associated with co-exposure to PM2.5 and O3 remain poorly understood. Through complementary in vivo animal models and in vitro cellular assays, the results demonstrate that although there was no synergistic cytotoxicity effect between PM2.5 and O3, the presence of O3 significantly enhanced the genotoxicity of PM2.5 by inducing severe DNA double-strand breaks. Furthermore, O3 exposure significantly exacerbated the bioaccumulation of PM2.5 by disturbing the cellular membrane integrity, thus leading to synergistic toxicity in bronchial cells and mouse lungs. Astaxanthin (AST) effectively antagonized the adverse effects of PM2.5 and O3 co-exposure by maintaining cell membrane integrity. These findings enhance our understanding of the pathophysiological mechanisms induced by co-exposure to PM2.5 and O3, and provide a promising therapeutic strategy for treating respiratory diseases caused by unavoidable exposure to these pollutants.

Graphical Abstract

1. Introduction

Air pollution has emerged as one of the most significant global public health challenges in the 21st century [1]. Although many countries have been striving to control the emissions of fine particulate matter (PM2.5), the concentration of ozone (O3) has gradually increased in recent years, raising the global co-exposure risks of PM2.5 and O3 [2]. For example, in several Chinese regions burdened by severe PM2.5 contamination, atmospheric monitoring data reveal a concomitant increase in O₃ concentration levels [3,4]. From 2018 to 2020, the average annual ozone concentrations in some regions far exceeded China’s Grade 1 standard for O3 (100 μg/m3) [5]. As a result, air pollution has gradually shifted from a traditional pattern dominated by a single pollutant to a composite pollution pattern [6].
The lung is the main target organ for PM2.5 and O3 exposure [7,8]. The combination of PM2.5 and O3 pollution has a synergistic effect on both respiratory disease [9] and the respiratory-related mortality rate [10,11]. Similarly, clinical trials and mouse model studies have demonstrated the synergistic effect in causing pulmonary inflammatory damage [12,13,14], oxidative stress [15], and metabolic disorders [16]. However, although the combined toxicity of PM2.5 and O3 has been investigated, a systematic understanding of the molecular mechanisms underlying their synergistic toxicity remains unestablished and needs to be deeply explored.
The biological membrane barrier structures within the lung tissue, such as the alveolar epithelial cell layer [17,18], the capillary endothelial cell layer [19], and the basement membrane [20], collectively constitute a critical defense mechanism against the infiltration of exogenous particulate matter. O3, as a strong oxidant, can damage the integrity of cell membranes by inducing lipid peroxidation reactions [21], leading to impaired cell membrane function [22]. The disruption of cell membranes facilitates the accumulation process of particulate matter in tissues, and it may further intensify its toxic effects. Therefore, from the perspective of biological barrier integrity, an in-depth interpretation of the mechanism underlying the combined toxicity of PM2.5 and O3 is of great significance for revealing the biological basis of their synergistic effects.
Maintaining the stability of the plasma membrane could be an effective target for antagonizing the toxic effects of PM2.5 and O3. Astaxanthin (AST) contains a special structure of 13 unsaturated conjugated double bonds and polar hydroxyl groups at both ends [23]. The unique chemical structure enables AST to be precisely embedded in the phospholipid bilayer, with an excellent effect of enhancing membrane stability [24,25]. Previous research has proven that AST can effectively mitigate cell damage and lung injury induced by PM2.5 [26,27], ionizing radiation [28], and heavy metals [29]. Therefore, AST demonstrates great potential in antagonizing the combined toxicity of PM2.5 and O3.
In this study, we first analyzed the joint toxicity of PM2.5 and O₃ and its related effects on Beas-2B cells and mouse lung tissues. The results show that, compared with single exposures to PM2.5 or O₃, O₃ pretreatment significantly enhanced the genotoxicity of PM2.5 by damaging the cellular membrane and increasing the intracellular deposition of PM2.5. Furthermore, by strengthening the cell membrane stability, we demonstrated that AST effectively mitigated the cellular and tissue damage caused by PM2.5 and O₃. These findings provide a new research perspective for the in-depth exploration of the combined toxicity mechanisms of air pollutants and their intervention strategies.

2. Materials and Methods

2.1. Materials

SRM 2975 was selected as the representative PM2.5 (NIST, Gaithersburg, MD, USA). O3 gas was produced by an O3 generator (TONGLINOZONE, Beijing, China) connected to an air generator. The ozone detector (2B Technologies, Boulder, CO, USA) was used to adjust the flow rate to stabilize the concentration in the ozone incubator at specific levels. AST was commercially sourced from Sigma Aldrich (Sigma Aldrich, St. Louis, MO, USA). The AST inclusion complex was prepared using the method in the published work [30].

2.2. Size Distribution and Colloidal Stability of PM2.5 Particles

PM2.5 was diluted to 25, 50, and 100 μg/mL with ultrapure water and Dulbecco’s modified Eagle medium (DMEM) complete medium. The suspension was sonicated and rapidly added to a cuvette for particle size and zeta potential measurements using the Malvern Dynamic Light Scattering instrument (Malvern Panalytical, Malvern, Worcestershire, UK).

2.3. Environmental Persistent Free Radicals (EPFRs) Detection

PM2.5 was suspended at 50 μg/mL in phosphate buffer saline (PBS) with or without 1 ppm O3 pre-treatment for 1 h. EPFRs were characterized using an electron spin resonance spectrometer (Bruker, Rheinstetten, Germany).

2.4. Cell Treatment and Exposure

The BEAS-2B cell line was purchased from the Conservation Genetics Kunming Cell Bank of the Chinese Academy of Sciences (Kunming, China). BEAS-2B cells were cultivated at 37 °C and 5% CO2 in DMEM (Hyclone, South Logan, UT, USA) supplemented with 10% fetal bovine serum (ExCell Bio, Shanghai, China).
In the experimental design of in vitro and in vivo combined toxicity studies, we pre-designed the exposure sequence based on the spatial and temporal distribution characteristics of atmospheric pollutants—O3 pre-exposure, followed by PM2.5 exposure. This design is based on the following scientific rationale. Specifically, the sources of PM2.5 include direct emissions and secondary production (e.g., photochemical oxidation), whose concentrations increase significantly under stable meteorological conditions (e.g., nighttime to early morning when the boundary layer is low) [31,32,33]. As a typical photochemical secondary pollutant, O3 concentrations peak during periods of intense sunlight, and its generation is dependent on the photochemical reaction of precursors [34].
The study comprised seven experimental groups, as follows: control (untreated); solvent control (vehicle only); AST (10 μM); PM2.5 (25, 50, 100 μg/mL, 24 h); O3 (0.2, 0.4, 0.6, 0.8, 1 ppm, 1 h in PBS followed by 24 h medium culture); PM2.5 + O3; PM2.5 + O3 + AST. For O3 exposure, cells were incubated in PBS to minimize medium ion interference, with subsequent replacement by fresh medium for continued culture. Co-exposure groups received sequential treatments—initial O3 preconditioning (1 ppm, 1 h), followed by PM2.5 (50 μg/mL) or AST (10 μM) administration for 24 h. The concentrations of PM2.5 (25, 50, and 100 μg/mL) and O3 (0.2, 0.4, 0.6, 0.8, and 1 ppm) used in this experiment were determined based on the existing references [35,36] as well as data from heavily contaminated areas [4], and taking into account the species differences between humans and rodents, whose tolerance to pollutants is four to five times higher than that of humans [37,38].

2.5. Cytotoxicity Testing

The CCK8 assay (APExBIO, Houston, TX, USA) was used to test the cell viability of BEAS-2B cells in response to different concentrations of O3. Briefly, cells (5 × 10³ cells/well) were plated into 96-well plates (NEST Biotechnology, Nanjing, China) and cultured for 24 h. After cell treatment, 10% CCK8 reagent was introduced to each well for a 4 h incubation and assayed at an absorbance wavelength of 450 nm.
The clonal survival assay was employed to detect the cytotoxicity of PM2.5 and co-exposure with O3 and AST. BEAS-2B cells were seeded in 60 mm transparent culture dishes (Jet Biofil, Guangzhou, China). After treatments, cells were passaged to new 60 mm culture dishes (600 cells per dish) and incubated for 7–10 days. After a clear cell population appeared, we discarded the old solution, washed it with PBS, and fixed it with a fixative reagent (methanol: glacial acetic acid = 9:1) for 20 min. Next, cells were dyed with crystal violet for 4 h and washed gently under running water. Finally, the clone points at the bottom were counted and statistically analyzed using optical microscopy (Olympus CK2, Tokyo, Japan).

2.6. Western Blotting

As mentioned in the previous study [39], proteins were extracted with RIPA buffer (Biosharp, Heifei, China) and quantified using a commercial kit (Thermo Fisher Scientific, Waltham, MA, USA). The proteins were electrophoresed on an SDS-PAGE gel (YaMei, Shanghai, China) and then transferred to a PVDF membrane (Roche, Basel, Switzerland). The membranes were then sealed with a protein-free rapid sealing buffer (YaMei, Shanghai, China). After sealing, the PVDF membrane was immersed in primary antibodies γ-H2AX (Millipore, Billerica, MA, USA) and β-actin (ZSGB-Bio, Beijing, China), and then incubated with secondary antibody (Promega Corporation, Madison, WI, USA). Protein bands were detected and quantified through chemiluminescent signal acquisition with the Tanon-5200 imaging system (Tanon, Shanghai, China), and the results were analyzed using ImageJ (Fiji/ImageJ 2.0, Dresden, Germany).

2.7. Membrane Potential Assay

BEAS-2B cells were cultured in opaque 96-well microplates (Labselect, Beijing, China) at a density of 5 × 10³ cells per well. When the cells reached 80% confluency (logarithmic growth phase), they were treated following predefined group assignments. Subsequently, each group was incubated with 10 μM DiBAC4 (3) under controlled conditions (37 °C, 5% CO2) for 30 min. Fluorescence signals were quantified at Ex/Em 493/516 nm using a SpectraMax i3 multi-functional detection platform (Molecular Devices, Sunnyvale, CA, USA).

2.8. Membrane Rupture Assay

Plasma membrane integrity was assessed by quantifying lactate dehydrogenase (LDH) release into the extracellular medium. After the cell treatment, cells were harvested in sterile centrifuge tubes containing complete culture medium and centrifuged to pellet cellular debris. The LDH release in the cell supernatant was detected using a commercial cytotoxicity assay kit (NJJCBIO, Nanjing, China). Absorbance values were recorded at 440 nm with a SpectraMax i3 multi-functional detection platform (Molecular Devices, Sunnyvale, CA, USA).

2.9. Ca2+ Flux Assay

Intracellular Ca2+ flux was detected by Fluo-3/AM fluorescent probe (Beijing Solarbio Science & Technology Co., Ltd., Beijing, China). The procedure for the Ca2+ flux assay was revised as follows: Cells were inoculated into black 96-well plates and processed after wall attachment. They were then incubated with 5 μM Fluo-3/AM for 30 min in the absence of light. Then, the cells were washed three times by HBSS and supplemented with 100 μL of HBSS to continue the transformation away from light for an additional 30 min, and the fluorescence intensity was detected by a SpectraMax i3 multi-functional detection platform (Molecular Devices, Sunnyvale, CA, USA) using an enzyme marker (Ex/Em = 488/530 nm).

2.10. Observation of the Morphology of PM2.5 and the Localization of PM2.5 in Cells by TEM

As mentioned in the previous study [40], PM2.5 was dispersed in ultrapure water and treated with ultrasonic waves to make it evenly dispersed. Then, 10 μL of the suspension was taken and dripped uniformly onto a copper mesh and left to adsorb for 2 min, before being allowed to dry. After drying, it was loaded into a feed bin and observed and photographed with a TEM (JEM2100 Plus, JEOL Ltd, Tokyo, Japan).
TEM observation in cells was performed as described [41]. After cell exposure, cells were rinsed with glutaraldehyde (TED PELLA, Inc., Redding, CA, USA) and collected. The collected samples were fixed, embedded, dehydrated, infiltrated, and then sectioned on a microtome (Leica UC-7, Wetzlar, Germany). High-resolution TEM imaging was performed on a JEM-1400 platform (JEOL Ltd., Tokyo, Japan) equipped with a Morada G3 digital acquisition unit, which was used to observe the cellular ultrastructural characteristics.

2.11. Animal Experimentation

In vivo experiments were conducted using male-specific pathogen-free C57BL/6J mice (Zhejiang Vital River, Zhejiang, China). The barrier maintains an ambient temperature of 22 ± 1 °C, a relative humidity of 50 ± 10%, and 12 h of alternating day and night light; the single-cage rearing density was no more than 5, guaranteeing the frequency of ≥50 cage air changes per hour; the noise level was maintained at less than 60 dB, the concentration of ammonia was strictly controlled within the threshold value of 14 ppm, and all the indexes complied with the national standards (GB 14925-2023) for environmental facilities with experimental animals [42]. Microbial control is achieved through SPF-level pathogen monitoring, contact sterilization and personnel decontamination. Laboratory animals have free access to sterilized feed and drinking water, and cage bedding is changed regularly to ensure hygiene. Before experimental procedures, mice were allowed a 7-day acclimation period to minimize environmental stress.
The mice were randomly assigned to seven groups, as follows (n = 5): control, solvent control, AST (2 mg/kg, tracheal instillation for 2 weeks, once a day), PM2.5 (5 mg/kg, tracheal instillation for 2 weeks, once a day), O3 (1 ppm for 3 h once a day for 2 weeks), PM2.5 + O3 (1 ppm for 3 h, and then intratracheally administered with 5 mg/kg PM2.5 in the mice once a day for 2 weeks), and PM2.5 + O3 + AST (mice were pre-exposed with 1 ppm O3 for 3 h, and we then simultaneously instilled 5 mg/kg of PM2.5 and 2 mg/kg of AST through the trachea once a day for two weeks). All the animal studies complied with the Animal Research: Reporting of In Vivo Experiments (ARRIVE) guidelines, the National Research Council’s Guide for the Care and Use of Laboratory Animals, and the Chinese Guideline for Ethical Review of Animal Welfare in Laboratory Animals. Ethical approval for this study was obtained from the Ethics Committee of the Institute of Health and Medicine, Hefei Comprehensive National Science Center (Approval Number: IHM-AP-2023-003, Date: 17 June 2023).

2.12. Histopathology Detection

The lung sections were stained following the previously outlined method [43]. HE staining was revised as follows: Mouse lung tissues were immersed in 4% paraformaldehyde fixative for at least 1 day at the end of the experiment. Subsequently, the tissues were embedded following a gradient ethanol multi-step dehydration process, xylene treatment, and paraffin dip waxing. Next, the tissues were cut into approximately 5 μm-thick sections using a sectioning machine and stained with hematoxylin and eosin (H&E). The staining process included the deparaffinization of the sections, gradient ethanol treatment, hematoxylin staining, differentiation in 1% hydrochloric acid alcohol solution, bluing in dilute lithium carbonate aqueous solution, eosin dye staining, and finally treating the sections with anhydrous ethanol and xylene. The sections were sealed with neutral resin, dried naturally, subjected to microscopic observation and photographed for recording.

2.13. Determination of Inflammatory Cytokines

After exposure, mice were euthanized, and their blood was collected and centrifuged to obtain serum (2000× g, 4 °C, 20 min). The concentrations of inflammatory factors IL-1β and TNF-α in the serum were measured using commercial kits (Cusabio, Wuhan, China). The assay was performed in strict accordance with the steps in the instructions [35].

2.14. Statistical Analysis

Statistical processing was conducted through GraphPad Prism 10 (Version 10.0.0, GraphPad Software Inc., San Diego, CA, USA), implementing parametric analysis via one-way ANOVA and two-way ANOVA with Tukey’s post hoc analysis. All the data are represented as mean ± standard deviation (SD) of at least three independent replicates. A p-value < 0.05 was regarded as indicating statistical significance.

3. Results and Discussion

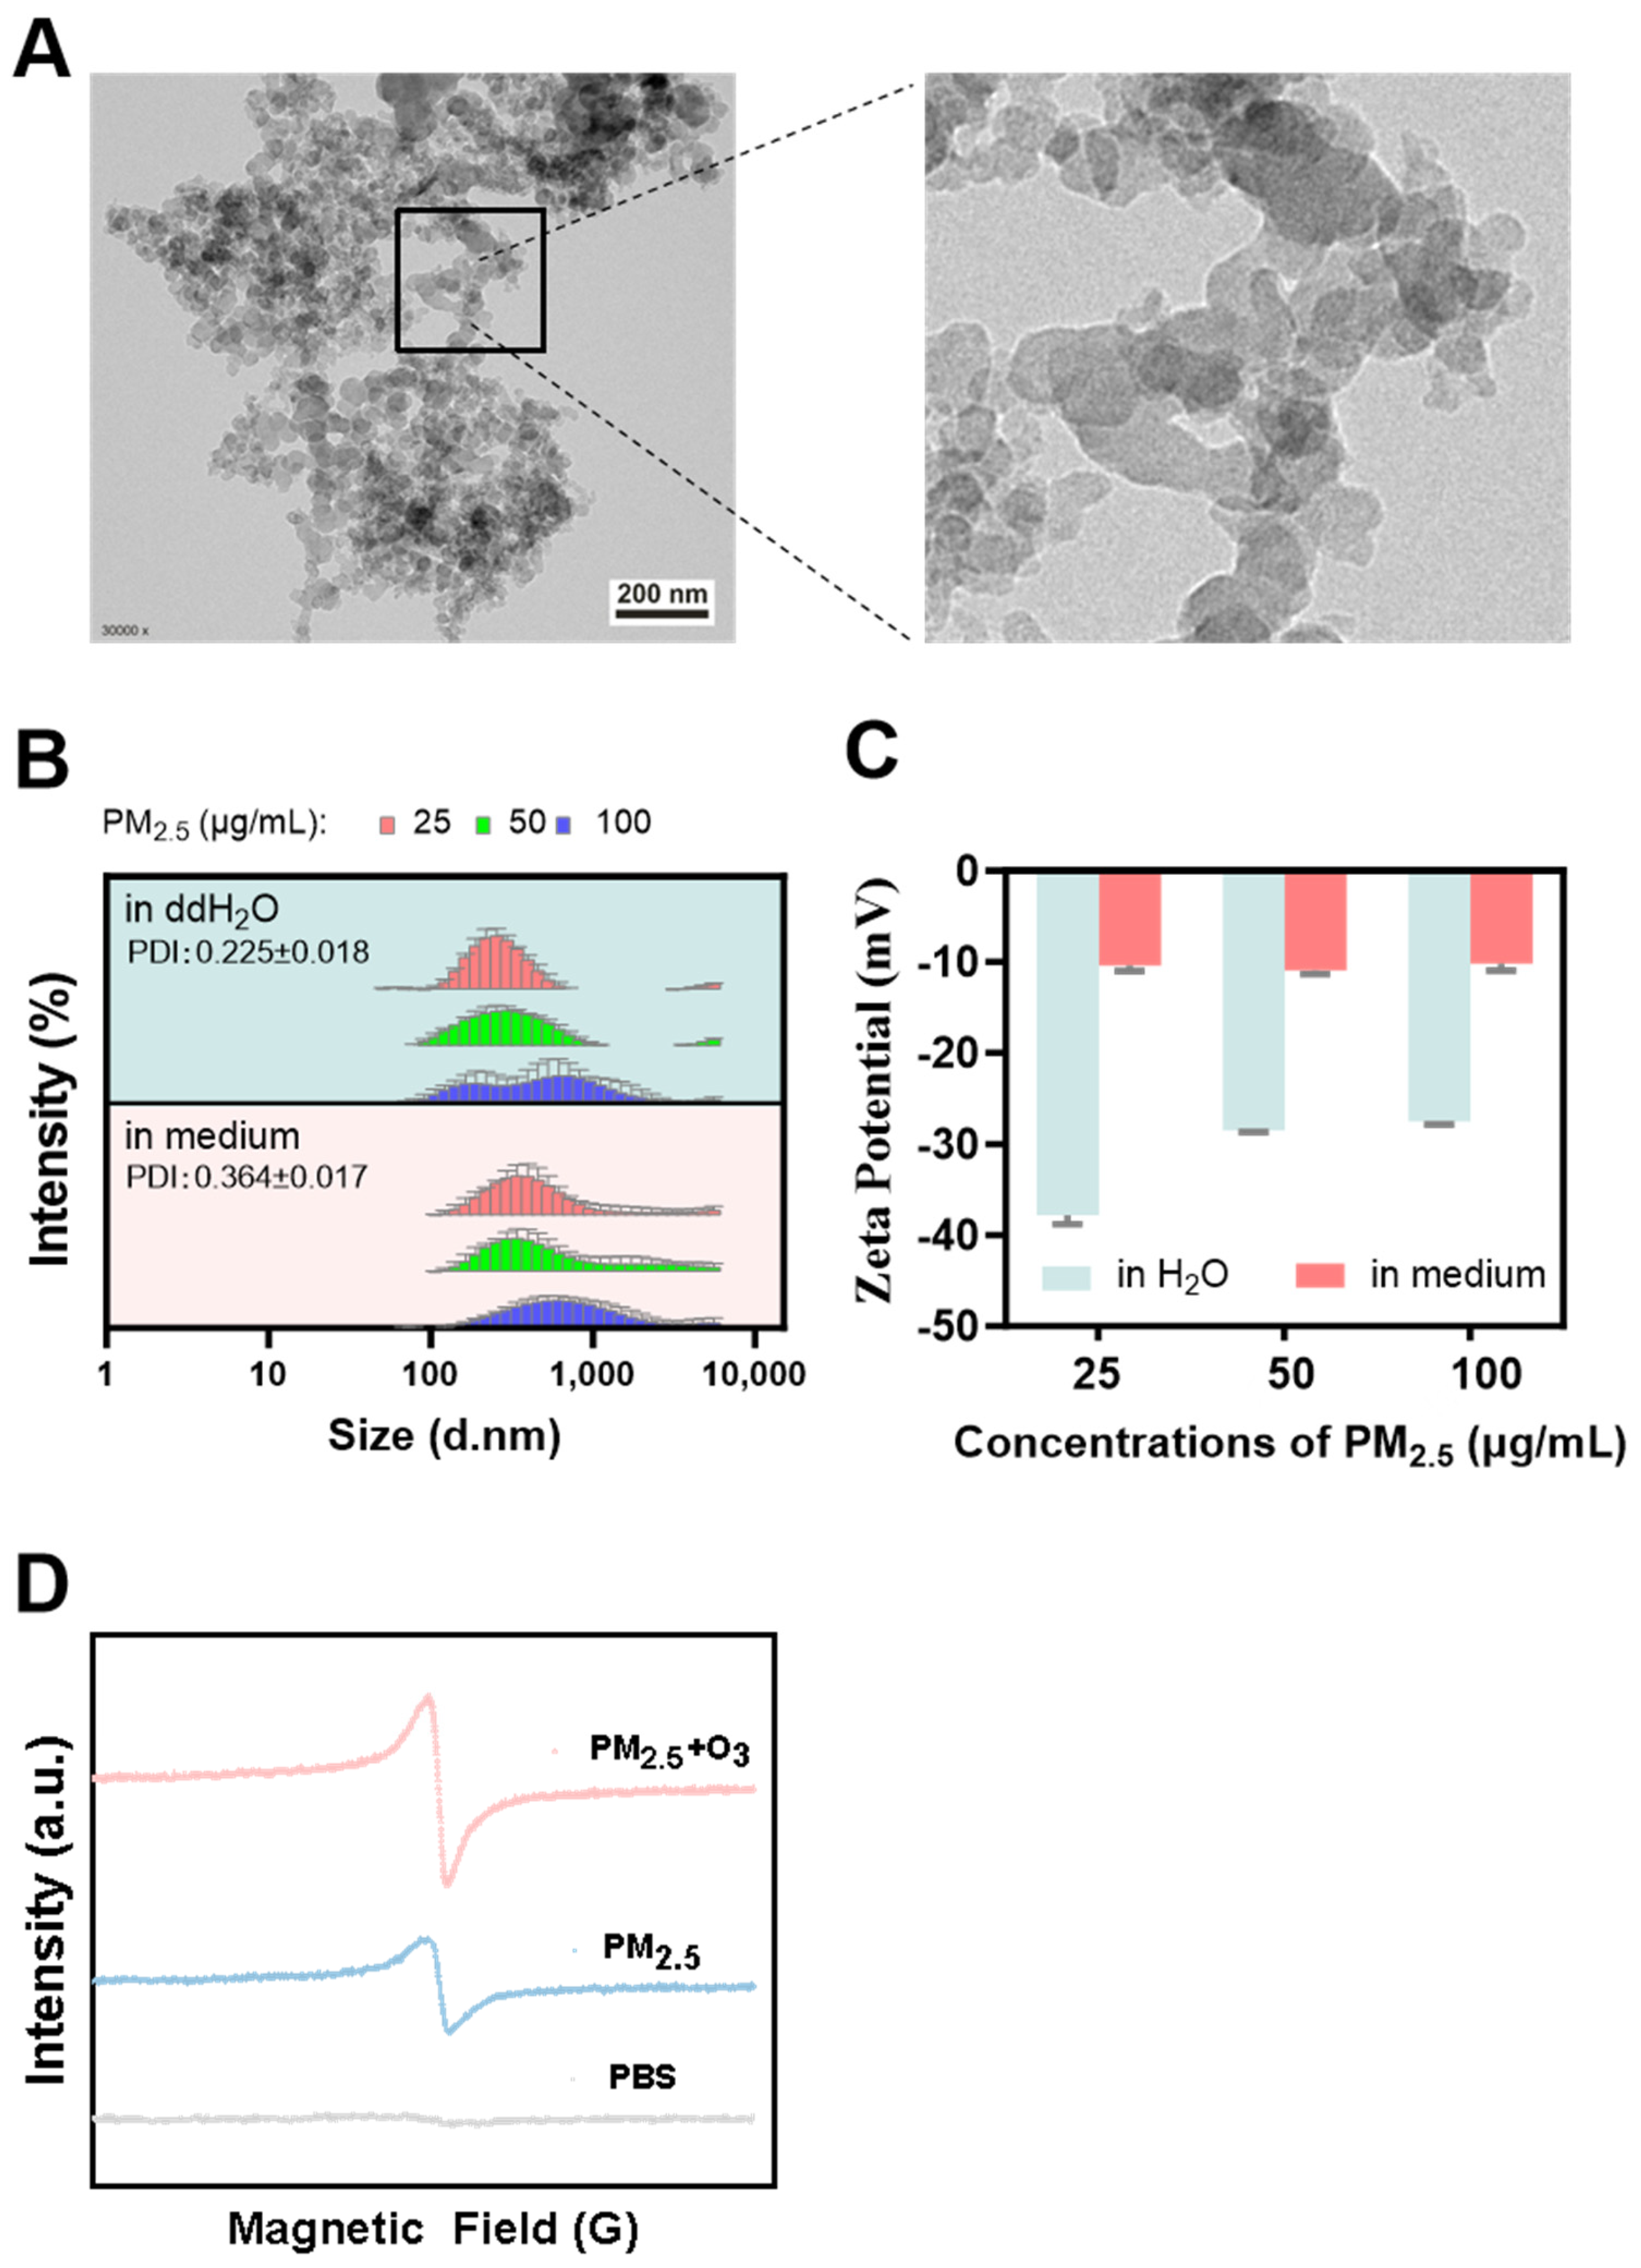
3.1. Characterization of PM2.5

Numerous studies have shown that PM’s physical and chemical properties directly affect its toxicological effects [44,45]. As shown in Figure 1A, TEM images revealed that the typical morphology of PM2.5 was soot particles with a size of less than 50 nm. Although larger agglomerates of several microns could be formed, most particles were less than 1 μm. Dynamic Light Scattering (DLS) was used to measure the hydrated particle size and zeta potential of PM2.5 dispersed in ultrapure water and cell culture medium [46]. As shown in Figure 1B, the average hydrated particle sizes of 25, 50, and 100 μg/mL PM2.5 in water were 258.1 ± 3.496 nm, 276.8 ± 7.225 nm, and 356.9 ± 8.143 nm, respectively. The average hydrated particle sizes of these concentrations of PM2.5 in culture medium were 352.2 ± 5.294 nm, 400.9 ± 10.43 nm, and 525.3 ±6.198 nm, respectively. The relatively larger particle size of PM2.5 in the culture medium might be attributed to the fact that, as a kind of nanoparticle, certain protein molecules in the medium could promote the aggregation of the particles [47]. Zeta (ζ) potential refers to the strength of repulsion or adsorption between particles, and is an essential indicator used for characterizing the stability of colloidal dispersions. As depicted in Figure 1C, the surface charges of PM2.5 were all negative, either in water or in cell culture medium, while the absolute values were higher in water than in culture medium, which also indicates the result that PM2.5 was more prone to agglomerate in the culture medium [48].
Compared to short-lived free radicals [49], EPFRs can stably exist within particles for extended periods, ranging from hours to days, and even months [50,51], thus posing more severe adverse effects on living organisms. Our results show that a significant EPFR signal was detected in PM2.5 with or without O3 co-treatment, and O3 elevated the mean concentration of EPFR in PM2.5. The signal intensity of the PM2.5 and O3 co-exposure group was approximately 1.76-times higher than that of the PM2.5 exposure group (Figure 1D). As a complex pollutant in the atmosphere, PM2.5 adsorbs many organic and inorganic substances on its surface, providing abundant reaction precursors for generating EPFRs [52]. O3 was reported to react with organic pollutants (e.g., polycyclic aromatic compounds) to promote the formation of EPFRs [53]. Our results suggest that the enhanced production of EPFRs on PM2.5 in the presence of O3 likely leads to severe oxidative damage to living organisms.

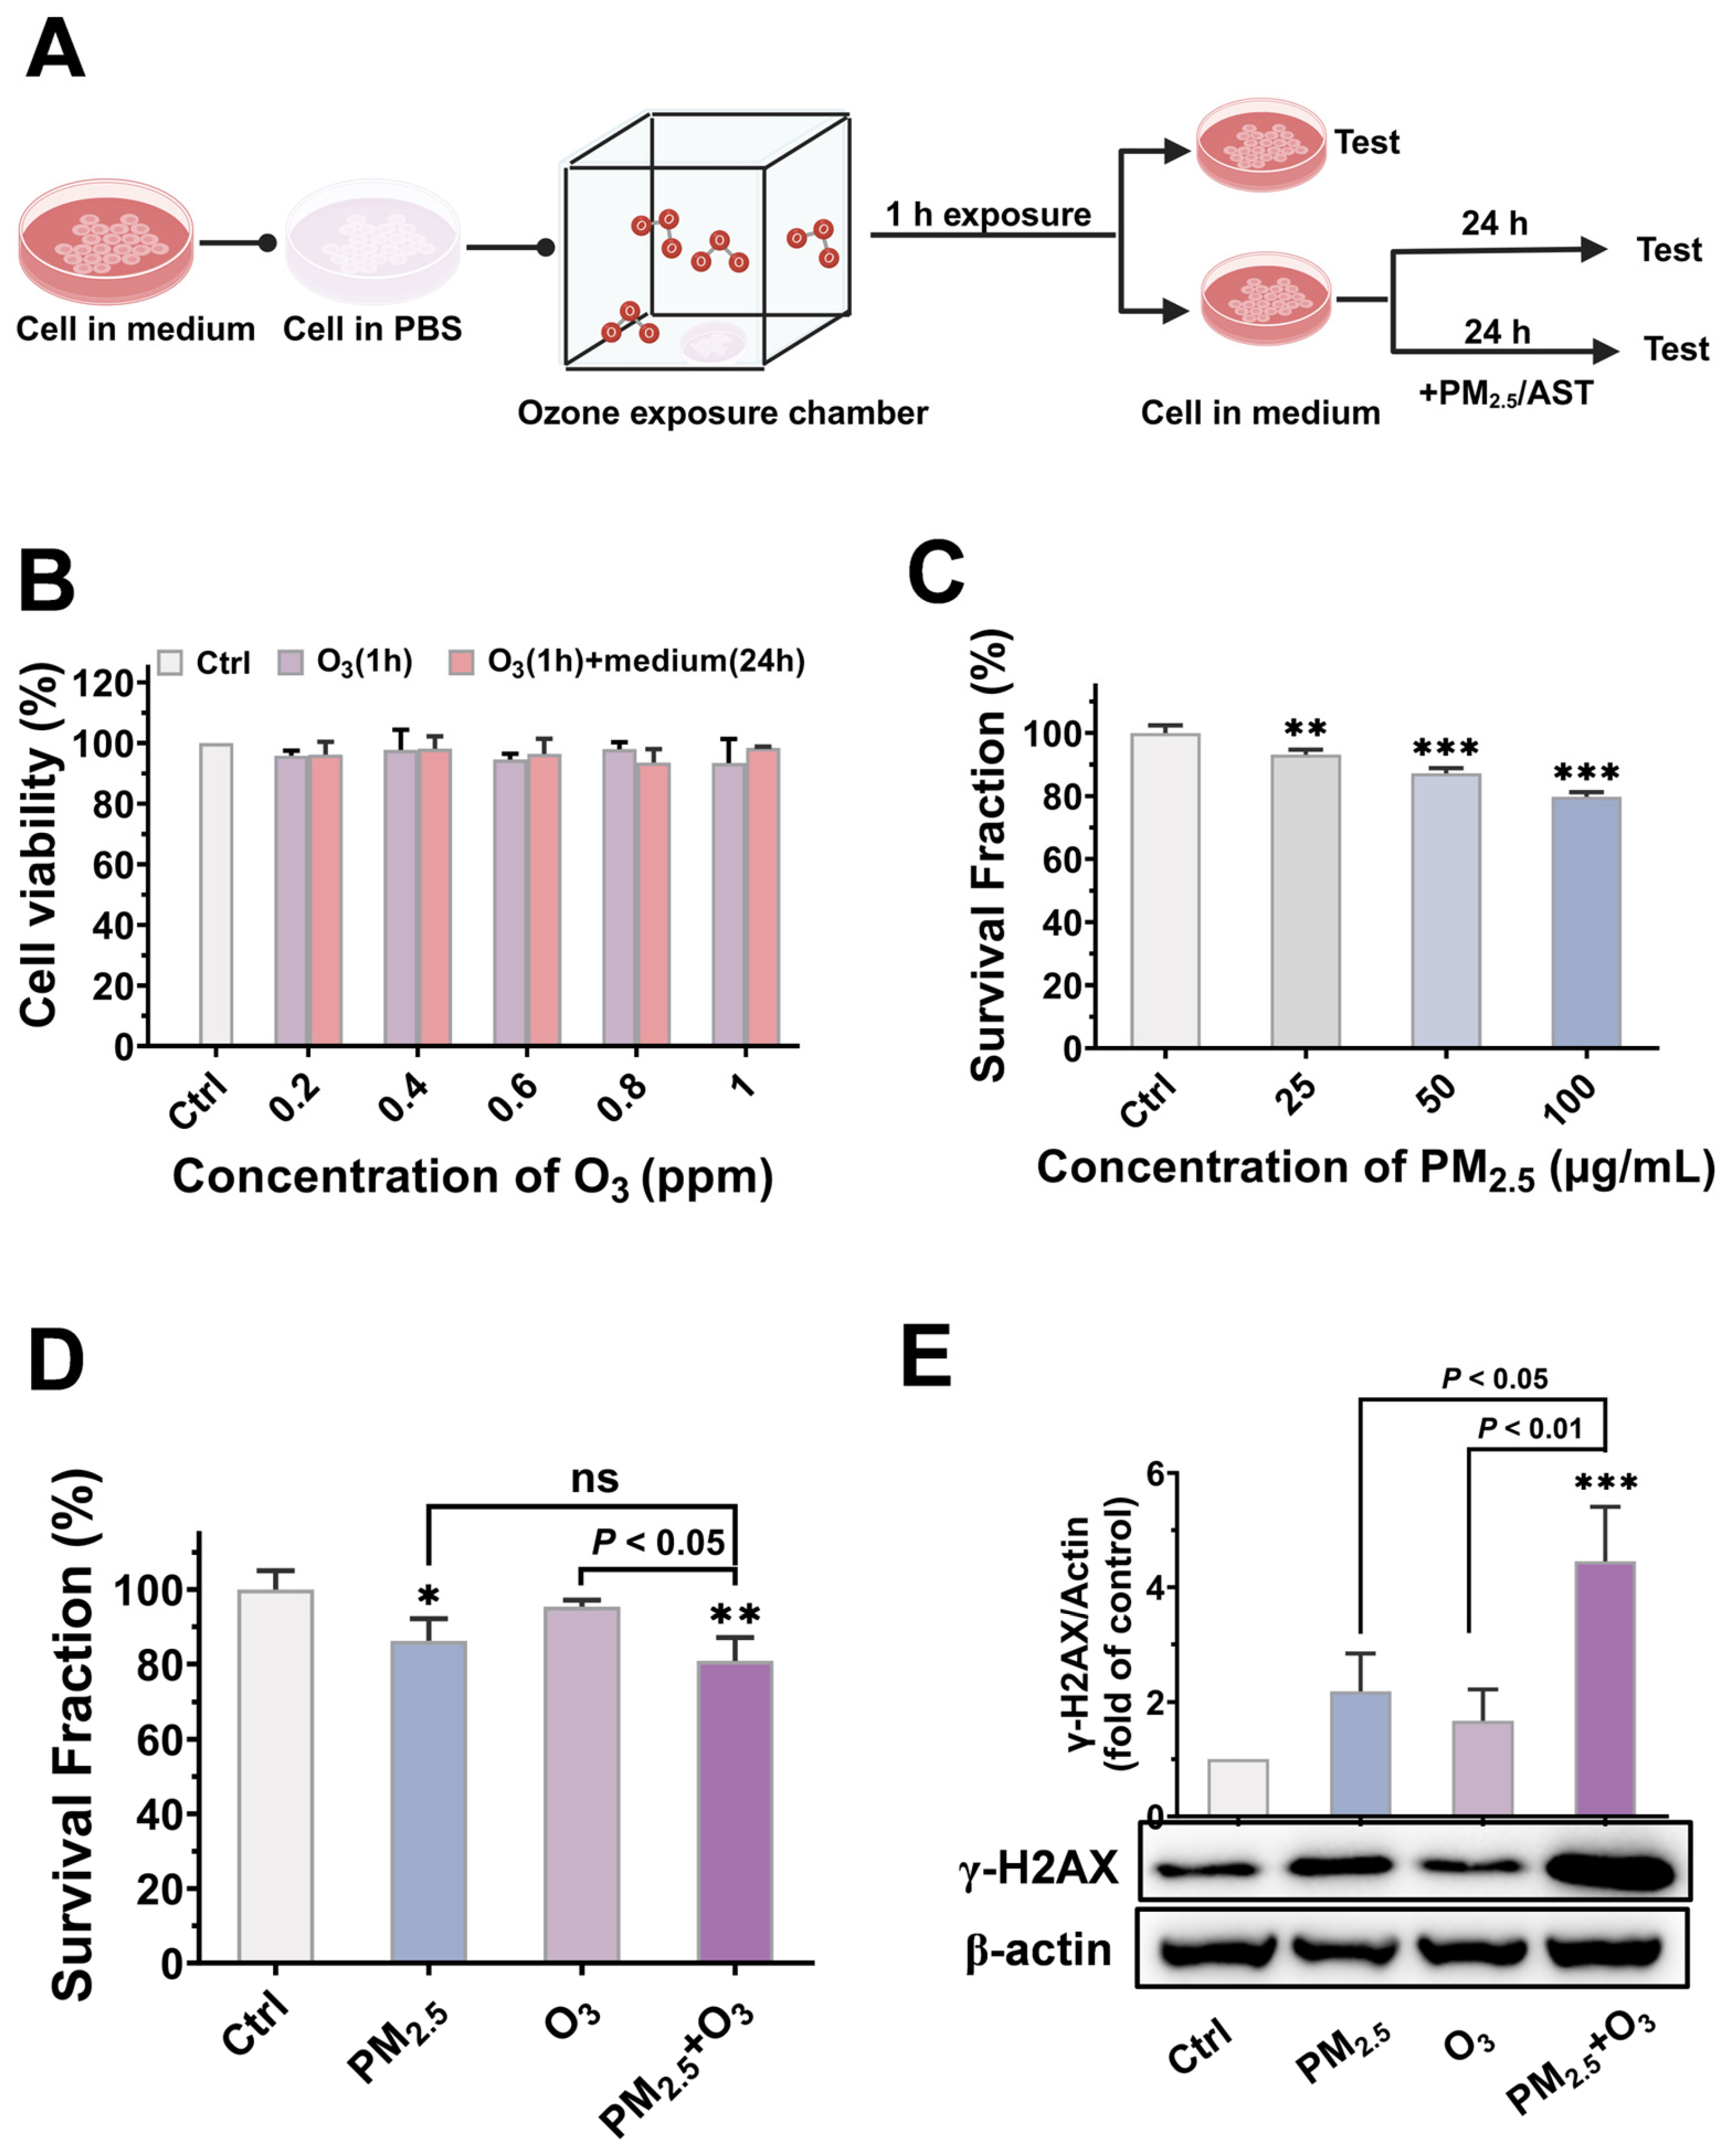
3.2. Cytotoxicity and Genotoxicity Induced by PM2.5 and O3

Earlier investigations predominantly focused on the negative consequences of single environmental contaminants. At the same time, limited research has investigated the joint toxicity of PM2.5 and O3 to bronchial cells. Therefore, the cytotoxicity of PM2.5 and O3 at graded concentrations was first tested in BEAS-2B cells to identify an appropriate concentration for the subsequent experiments. Considering that O3 exposure in daily life is typically short-term and has been shown to induce not only acute hazards but also progeny damage [54,55], the effects caused by O3 were detected either immediately following a 1 h treatment, or after a 1 h treatment followed by a 24 h recovery period in the cell culture medium; the experimental procedure is depicted in Figure 2A.
No significant differences were observed between non-exposed cells and cells exposed to O3 at varying concentrations or during different recovery phases (Figure 2B). Consequently, a concentration of 1 ppm was selected for O3 in the following experiments. To avoid the influence of material color on absorbance measurements, the clone survival method was employed to detect the cytotoxicity of PM2.5. The cell proliferation ability in cells treated with PM2.5 decreased gradually with the increase in exposure concentrations, indicating a dose-dependent cytotoxicity of PM2.5 (Figure 2C). A concentration of 50 μg/mL PM2.5 was used for the following study. Compared to PM2.5 treatment alone, a slight toxicity elevation could be found in cells co-treated with O3 and PM2.5 (the survival fraction decreased from 86.23 ± 5.95% to 80.86 ± 6.26%, p > 0.05) (Figure 2D), indicating that compared to PM2.5 treatment alone, there was no significant joint cytotoxicity when cells were co-exposed to O3 and PM2.5.
DNA double-strand breaks (DSBs) were chosen as a typical marker of genetic damage [56]. Although there was no obvious cytotoxicity when cells were treated with 1 h of exposure to O3 followed by 24 h of recovery, slight DNA damage could be observed in O3-treated cells, which could not be completely repaired. The Western blotting results also indicate that O3 preincubation enhanced the genotoxicity of PM2.5, as the protein expression of γ-H2AX was increased by approximately 100% (Figure 2E). PM2.5 has been recognized as a definitive human carcinogen [57], while O3 has been reported to attack DNA molecules [58]. The synergistic genotoxicity of PM2.5 and O3 has aroused significant health concerns in the context of current atmospheric composite pollution, highlighting the need for further elucidation of the underlying mechanisms involved.

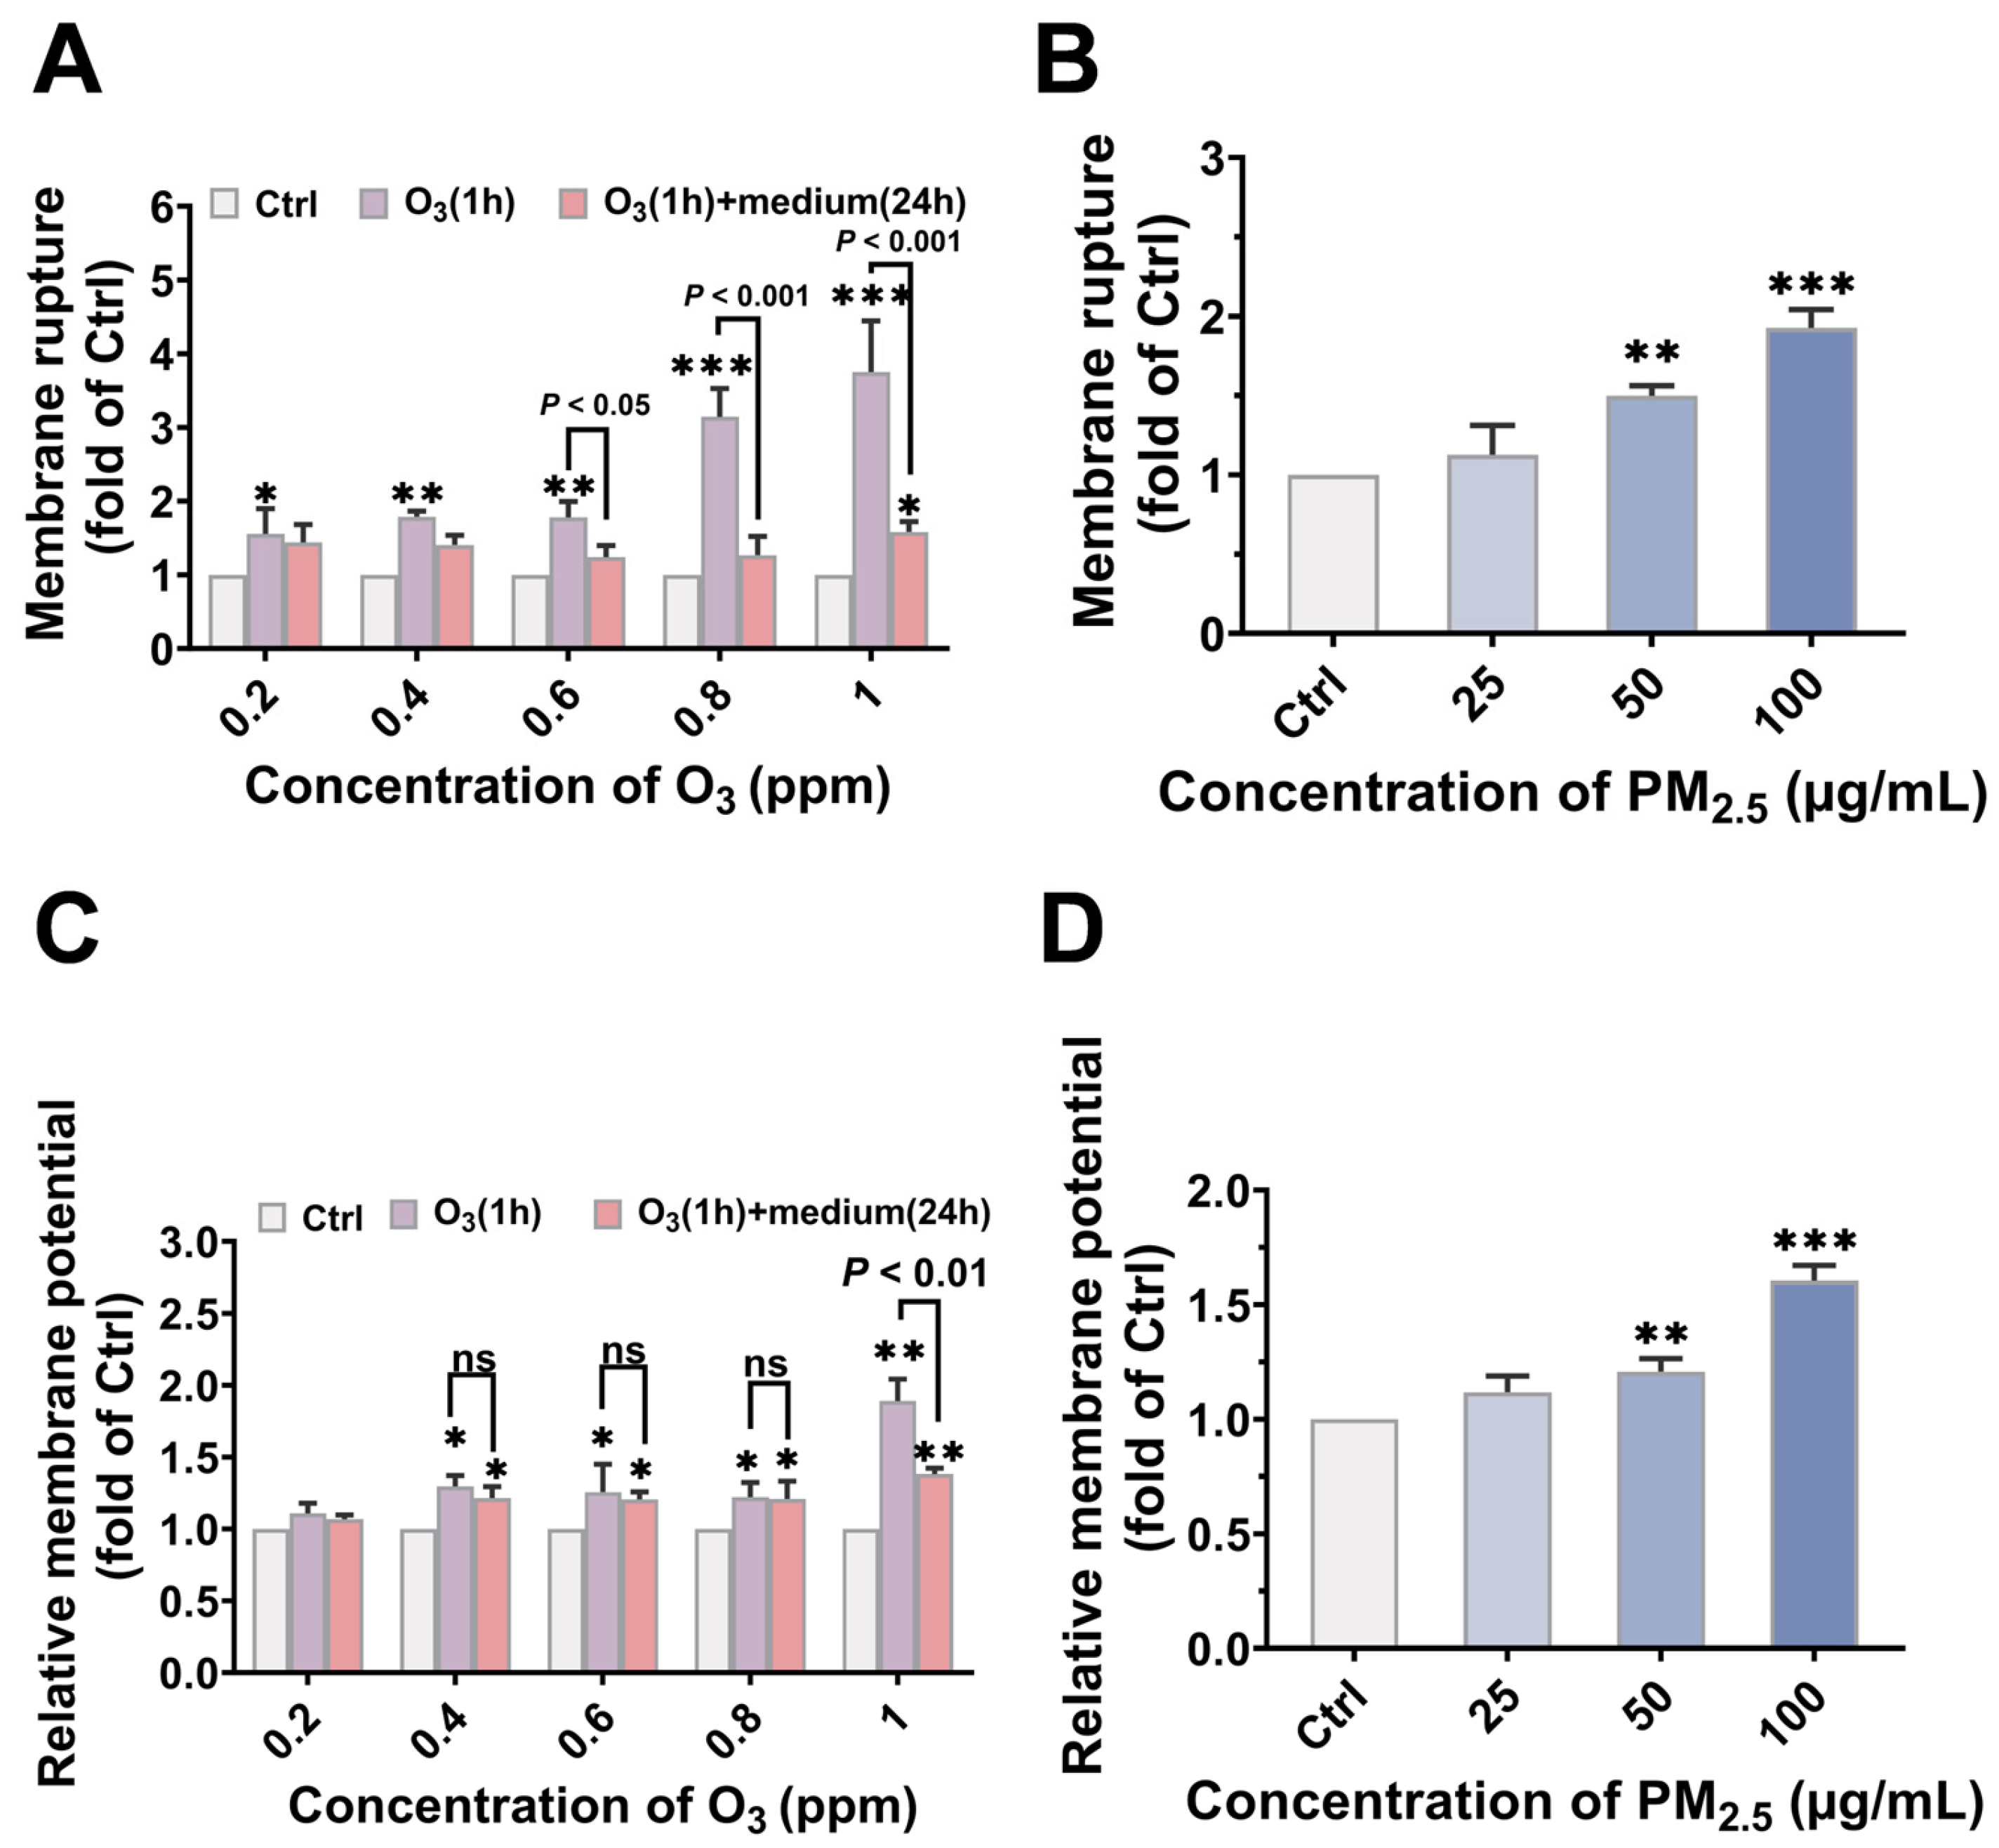
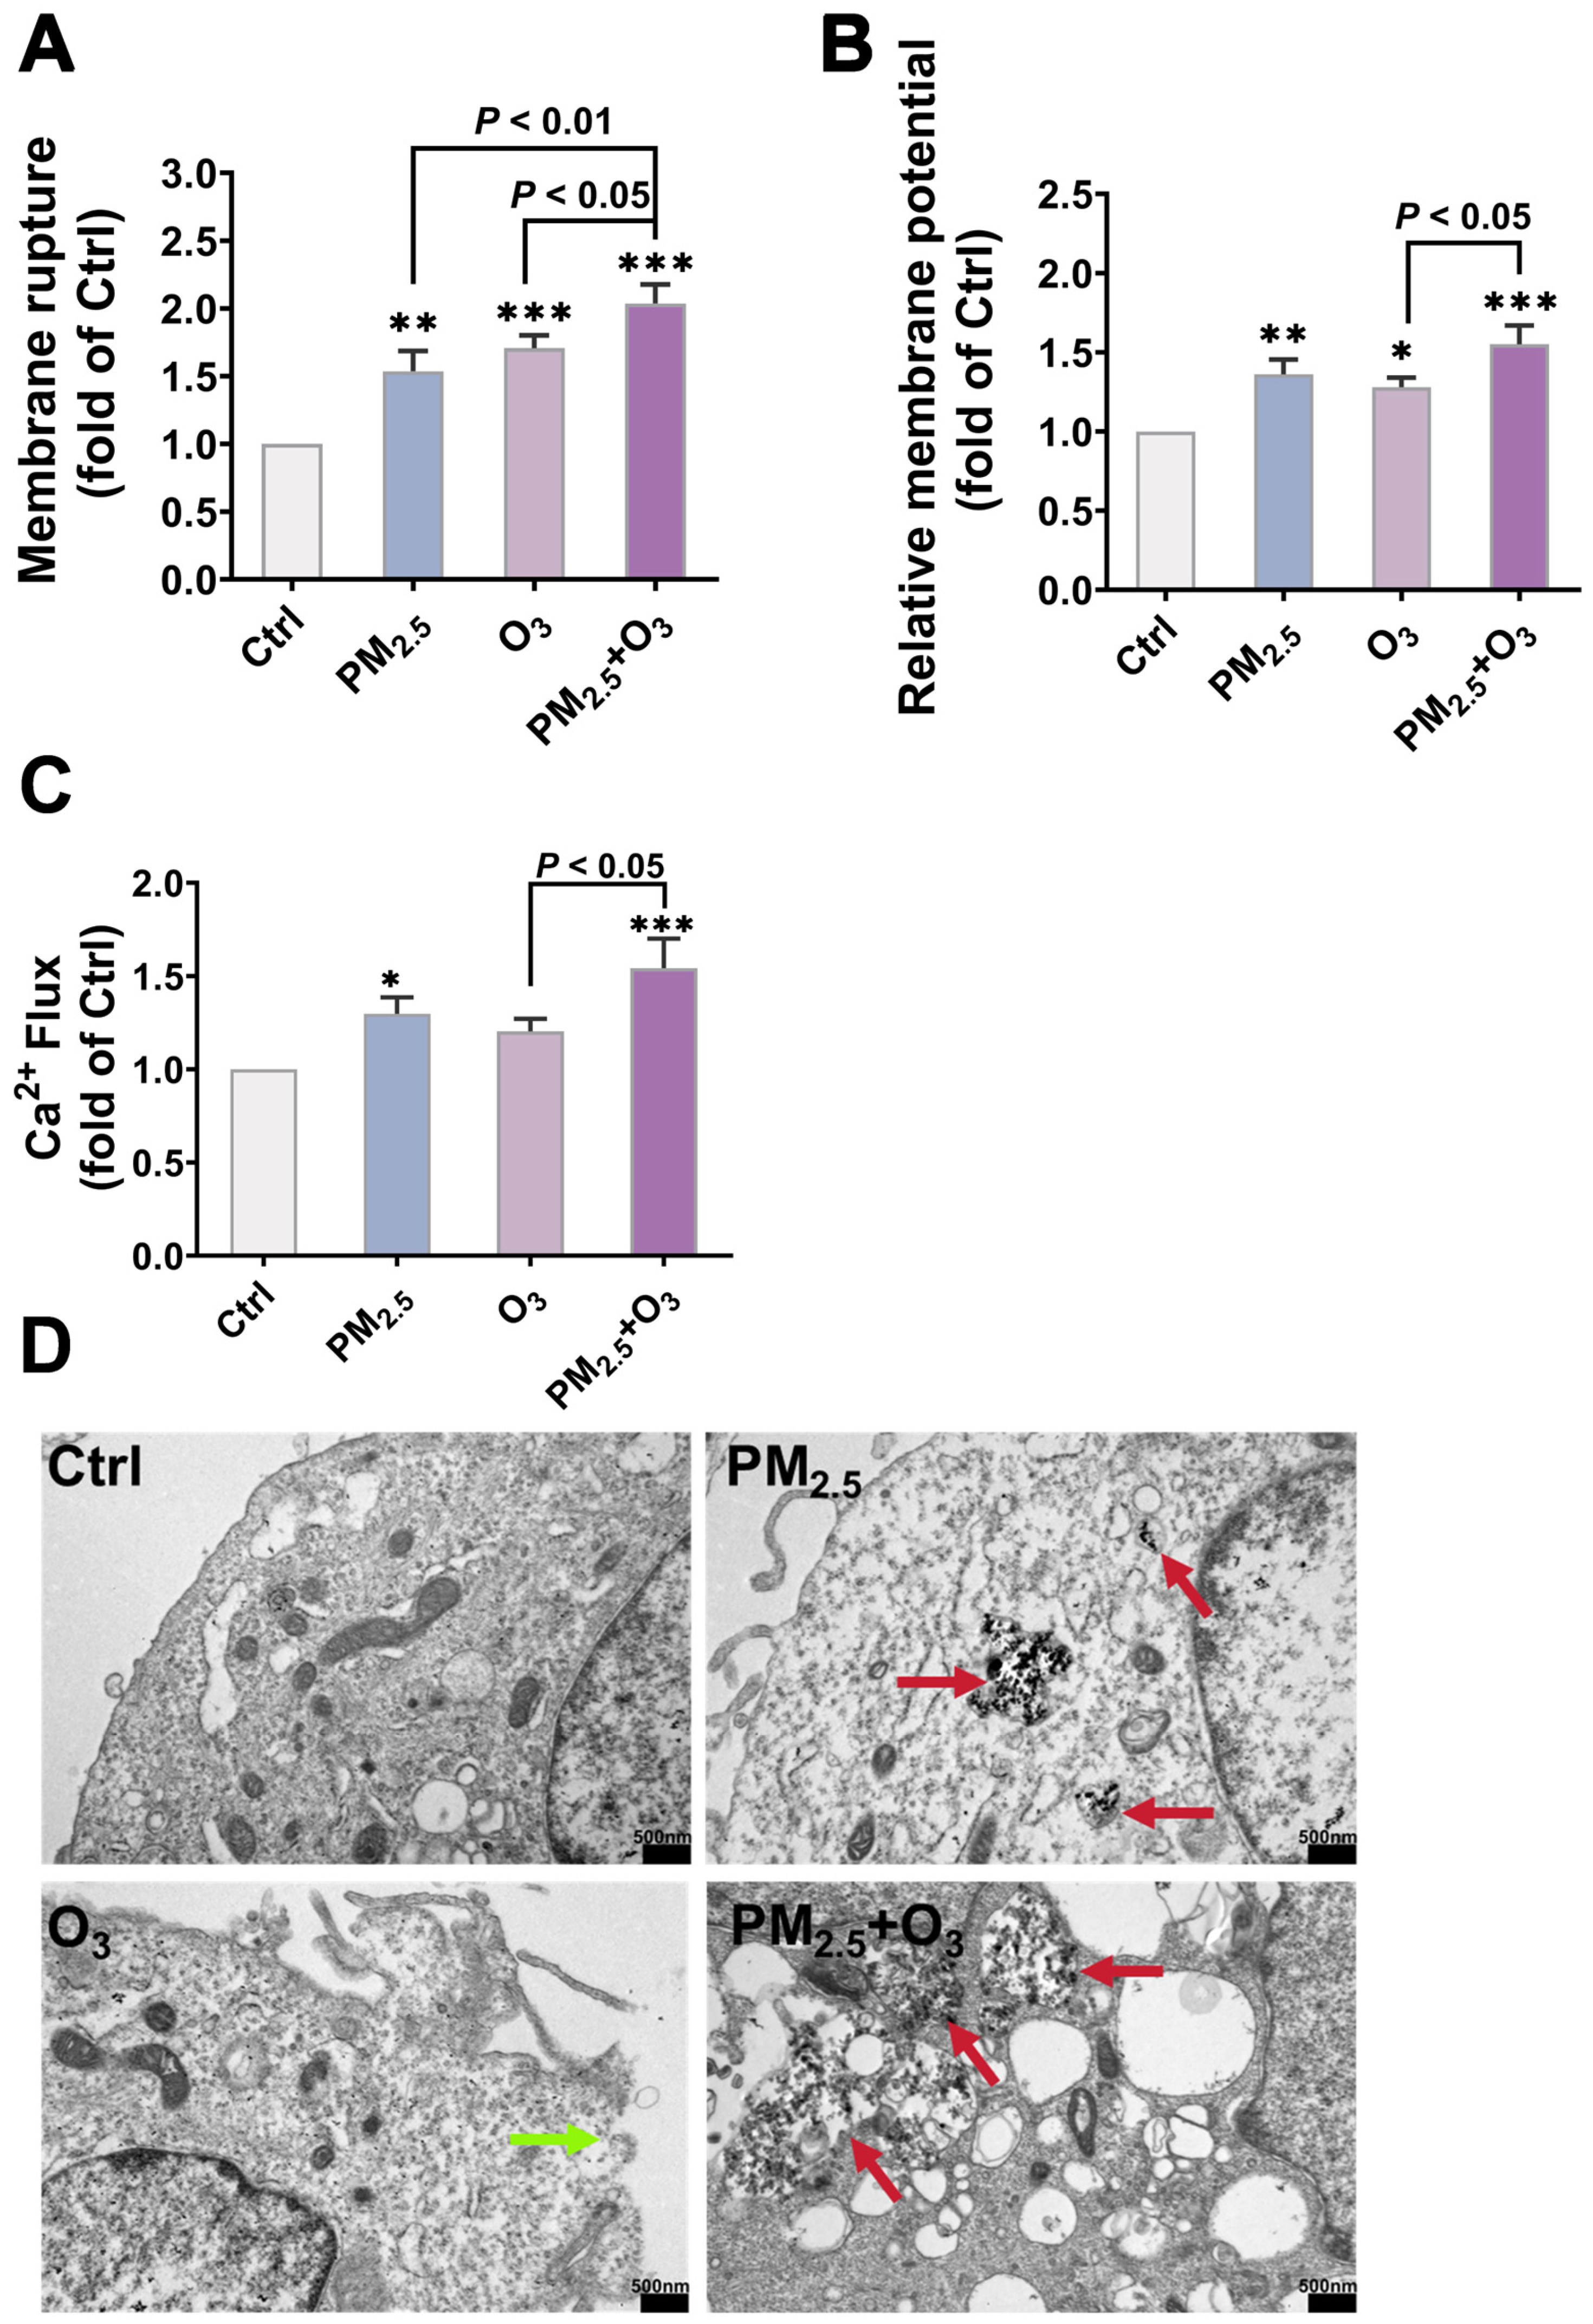
3.3. O3 Pre-Treatment Enhanced the Toxicity of PM2.5 via Destroying the Plasma Membrane Integrity and Facilitating the Bioaccumulation of PM2.5

Plasma membrane integrity, the first and primary protective barrier against contamination invasion, is critical for maintaining cellular stability [59]. PM2.5 and O3 have been reported to disrupt membrane stability [60,61]. Therefore, we next interpreted the mechanism involved in the joint toxicity of PM2.5 and O3 from the point of view of plasma membrane integrity. Membrane rupture and relative membrane potential were used to evaluate the cell membrane integrity. As shown in Figure 3, significant LDH release and membrane potential elevation were observed in both O3- and PM2.5-treated cells, indicating a dose-dependent effect on cell membrane damage. However, the disruption caused by 1 h O3 pre-treatment could be restored after 24 h of recovery. Specifically, LDH release increased with increasing O3 concentration, from 1.56 ± 0.34 times at 0.2 ppm to 3.75 ± 0.69 times at 1 ppm. In contrast, after 24 h of recovery, the level of LDH release induced by 1 ppm O3 decreased from 3.75 ± 0.69 to 1.58 ± 0.14 (p < 0.001) (Figure 3A), which was probably due to the self-repair ability of the cell membrane in response to O3 exposure through lipid metabolism, protein synthesis and cell membrane fusion [62].
Compared with the groups exposed to PM2.5 alone and O3 alone, the combined exposure to PM2.5 and O3 increased the release of LDH in the cell supernatant by 1.33 ± 0.04 times (p < 0.01) and 1.19 ± 0.03 times (p < 0.05), respectively (Figure 4A). Combined exposure also significantly increased the plasma membrane depolarization compared with the control, PM2.5 alone, and O3 alone groups (Figure 4B). Ca2+ is an important and ubiquitous second messenger that regulates various cellular processes and maintains cellular homeostasis [63,64]. The excessive influx and uptake of Ca2+ into the cytoplasm imply cellular stress, and can lead to cellular overload, resulting in cell death. As shown in Figure 4C, co-exposure resulted in a pronounced increase in intracellular Ca2+ levels, reaching 1.54 ± 0.09 times that of the control group (p < 0.001) and 1.28 ± 0.06 times that of the O3-only exposure group (p < 0.05).
The damage to the cellular membrane was further confirmed intuitively by TEM observation. As shown in Figure 4D, cells in the control group presented a typical normal structure of BEAS-2B cells with an intact plasma membrane and organelles in good condition. Significant membrane rupture on the cell surface was observed in the O3-exposed group (green arrow), indicating a disruptive role of O3 on cell membrane integrity. Furthermore, compared to the PM2.5-treatment group, a significantly greater number of particle aggregates (red arrows) were deposited in the cytoplasm of cells under combined exposure, suggesting that O3 pre-treatment disrupted the integrity of the cellular membrane and promoted the bioaccumulation of PM2.5, which probably contributed to the synergistic toxicity of combined exposure to PM2.5 and O3.
PM2.5 harbors complex toxic constituents [65,66], capable of inducing membrane destabilization via multi-modal pathways. Furthermore, EPFRs present in PM2.5 can act as electron donors to generate reactive oxygen species (ROS), which attack lipid molecules in the cell membrane, triggering lipid peroxidation and damaging the cell membrane [67]. O3 is a strong oxidant, and it can significantly damage the structure and the normal function of cell membranes [68]. Previous studies have proven the synergistic effects of PM2.5 and O3 co-exposure [69,70]. However, these studies have not yet fully revealed the specific mechanisms of damage to cell membranes caused by combined pollutants. In this study, we initiated an investigation from a novel perspective focused on membrane damage induced by PM2.5 and O3 co-exposure, achieving a multidimensional understanding of the combined toxic effects of PM2.5 and O3. In our study, on the one hand, we found that the presence of O3 increased the loading of EPFRs in PM2.5; this process may enhance the stability of free radicals within PM2.5 through heterogeneous reactions with surface organic matter, thereby extending their half-life [71]. On the other hand, the presence of O3 led to the breakage of the cell membrane and exacerbated the accumulation of PM2.5 in the cell. Therefore, decreased plasma membrane stability was considered to be an important mechanism involved in the combined toxicity of PM2.5 and O3 in our study. In the subsequent work, we will further focus on the mechanisms by which O3 enhances the loading of EPFRs in PM2.5, and the mechanisms of EPFRs in inducing cell membrane damage and joint toxicity.

3.4. AST Mitigated the Adverse Effects Caused by PM2.5 and O3 Co-Exposure

Previous studies have shown that AST has the function of maintaining membrane stability [72]. We thus hypothesized that AST could inhibit the toxicity of PM2.5 and O3 co-exposure by preserving membrane integrity. As shown in Figure 5A, the addition of AST significantly inhibited the DNA damage elicited by PM2.5 and O3 co-exposure, with the protein expression of γ-H2AX decreasing from 4.04 ± 0.68 times to 1.75 ± 0.62 times (p < 0.001). Furthermore, co-treatment with AST sharply inhibited the LDH release induced by PM2.5 and O3 co-treatment from 1.88 ± 0.09 times to 1.17 ± 0.08 times (p < 0.05), nearly to the base level of the control group (Supplemental Files, Figure S1). The elevated membrane potential (Figure 5B) and Ca2+ influx (Figure 5C) induced by PM2.5 and O3 co-treatment also declined after AST addition, indicating a protective role of AST in preserving cellular membrane integrity. The alteration of PM2.5 bioaccumulation was further verified by TEM detection. Cellular membrane rupture (green arrow) and massive PM2.5 aggregates (red arrows) could easily be observed in cells co-treated with PM2.5 and O3. Meanwhile, the microvilli on the cell membrane surface disappeared, and numerous intracellular vesicles formed within the cell. In contrast, AST co-treatment maintained the integrity of the cell membrane and inhibited the bioaccumulation of PM2.5 in the cytosol (Figure 5D). These data suggest that AST antagonized the toxicity of PM2.5 and O3 by maintaining cellular membrane integrity and reducing the bioaccumulation of PM2.5.
In vivo experiments also confirmed the remarkable antagonistic effect of AST. As one of the organs directly interacting with the external environment, the surface of the lung is lined with a complex layer of epithelial tissue that harbors immune cells, forming the first line of pulmonary defense [73]. They effectively prevent further lung damage by identifying and eliminating inhaled foreign substances, pathogens, and pollutants [74,75]. PM2.5 could penetrate the body’s multiple defense mechanisms, deposit in the alveoli, and accumulate in lung fluids [76]. Smaller particles can even penetrate the air–blood barrier, enter the circulation, and pose potential health risks to other organs in the body [77]. To further confirm the effect of AST against the negative impacts caused by PM2.5 and O3, we evaluated the effects in mice. Figure 5E shows the degree of damage in the lung tissues of mice. Histopathological analysis revealed a preserved alveolar architecture and intact interstitial matrices in control and AST-administered cohorts. Notably, the PM2.5 and O3 co-exposure group demonstrated synergistic pathological exacerbations, exhibiting intensified vascular endothelial swelling, increased alveolar type II epithelial cells, and inflammatory exudate in the alveoli. The existence of O3 significantly exacerbated the deposition of PM2.5 in the lung, as indicated by the red arrows. However, AST restored the structural damage of the lung and decreased the PM2.5 accumulation. Inflammation, as a vital response to external stimuli, has been identified as a primary systemic mechanism underlying the adverse effects caused by air pollutants. TNF-α and IL-1β (pro-inflammatory cytokines) levels in the mice serum exposed to PM2.5 and O3 were significantly increased compared with the control group (Supplemental Files, Figure S2). Previous findings have demonstrated that combined exposure to urban particulates and O3 exacerbated cellular damage and interstitial inflammation in rat lungs, suggesting that the two pollutants may have more potent toxic effects when present together [78]. However, in the AST administration group, the levels of TNF-α (p < 0.001) and IL-1β (p < 0.05) were decreased considerably. Although previous studies have reported the anti-inflammatory [79] and antioxidant properties of AST [80], few studies have focused on the inhibitory effect of AST on the combined toxicity of atmospheric complex pollutants, especially PM2.5 and O3. This study has identified that AST also had a good inhibitory effect on the toxicity of PM2.5 and O3 combined exposure, especially in inhibiting DNA damage, repairing membrane stability, and exerting anti-inflammatory effects.
Although experiments have demonstrated the damage caused by PM2.5 and O3 to cell membranes and the excellent antagonistic effect of AST on combined exposure, several areas still deserve in-depth exploration in existing research. Currently, most experiments are still limited to cell models and in vivo lung tissue, and systematic studies on the interactions of multiple organs are still relatively scarce. For example, pollutants can enter the blood, brain, placenta, etc., through the blood–air barrier, and further in-depth exploration is still needed.

4. Conclusions

In summary, the results of this study indicate that O3 exacerbated the toxic effects of PM2.5 by disrupting the stability of cell membranes, leading to the excessive deposition and retention of PM2.5 within cells and in the lungs. Regarding prevention and detoxification, we emphasize the significant role of AST in counteracting the toxic effects caused by PM2.5 and O3 co-exposure. Based on these preliminary studies, future research can further explore the impacts of complex atmospheric pollutants on the body under various conditions, providing a scientific basis for risk assessment and developing prevention and detoxification approaches for air pollution.

Supplementary Materials

The following supporting information can be downloaded at: https://www.mdpi.com/article/10.3390/toxics13060446/s1, Figure S1: LDH release; Figure S2: Levels of (A) IL-1β and (B) TNF-α in mouse serum treated by PM2.5, O3, and AST.

Author Contributions

Writing—original draft, visualization, methodology, investigation, formal analysis, data curation, conceptualization, J.H.; writing—original draft, visualization, methodology, investigation, formal analysis, conceptualization, T.W.; visualization, H.L.; visualization, Y.Z.; writing—review and editing, resources, funding acquisition, conceptualization, Y.L.; writing—review and editing, supervision, methodology, funding acquisition, formal analysis, A.X. All authors have read and agreed to the published version of the manuscript.

Funding

This work was supported by the National Key Research and Development Program of China, funding number: 2023YFC3708303.

Institutional Review Board Statement

All the animal studies were conducted in compliance with the Animal Research: Reporting of In Vivo Experiments (ARRIVE) guidelines, the National Research Council’s Guide for the Care and Use of Laboratory Animals, and the Chinese Guideline for Ethical Review of Animal Welfare in Laboratory Animals. Ethical approval for this study was obtained from the Ethics Committee of the Institute of Health and Medicine, Hefei Comprehensive National Science Center (Approval Number: IHM-AP-2023-003, Date: 17 June 2023).

Informed Consent Statement

Not applicable.

Data Availability Statement

All the datasets generated for this study are included in the article.

Acknowledgments

In this study, the design of the theme, selection of references, and analysis of the results were all independently completed by the authors. Artificial intelligence tools are only used for language polishing (including grammar correction and sentence structure optimization), and do not involve viewpoint generation or data interpretation. The final draft of the article passed the screening of the Turnitin AI detection system, and the generated detection report indicates that the study meets the relevant requirements of the journal for originality.

Conflicts of Interest

The authors declare that they have no known competing financial interests or personal relationships that could have appeared to influence the work reported in this paper.

References

  1. WHO. Ambient (Outdoor) Air Pollution; World Health Organization: Geneva, Switzerland, 2024; Available online: https://www.who.int/news-room/fact-sheets/detail/ambient-(outdoor)-air-quality-and-health (accessed on 16 November 2024).
  2. Santiago, J.V.; Hata, H.; Martinez-Noriega, E.J.; Inoue, K. Ozone trends and their sensitivity in global megacities under the warming climate. Nat. Commun. 2024, 15, 10236. [Google Scholar] [CrossRef] [PubMed]
  3. Xiao, Q.; Geng, G.; Xue, T.; Liu, S.; Cai, C.; He, K.; Zhang, Q. Tracking PM2.5 and O3 Pollution and the Related Health Burden in China 2013–2020. Environ. Sci. Technol. 2022, 56, 6922–6932. [Google Scholar] [CrossRef] [PubMed]
  4. Kong, L.; Song, M.; Li, X.; Liu, Y.; Lu, S.; Zeng, L.; Zhang, Y. Analysis of China’s PM2.5 and ozone coordinated control strategy based on the observation data from 2015 to 2020. J. Environ. Sci. 2024, 138, 385–394. [Google Scholar] [CrossRef]
  5. Wang, B.; Sun, M.; Si, L.; Niu, Z. Spatio-temporal variation of O3 concentration and exposure risk assessment in key regions of China, 2015–2021. Atmos. Pollut. Res. 2024, 15, 101941. [Google Scholar] [CrossRef]
  6. He, C.; Liu, J.; Zhou, Y.; Zhou, J.; Zhang, L.; Wang, Y.; Liu, L.; Peng, S. Synergistic PM2.5 and O3 control to address the emerging global PM2.5-O3 compound pollution challenges. Eco-Environ. Health 2024, 3, 325–337. [Google Scholar] [CrossRef]
  7. Holm, S.M.; Balmes, J.R. Systematic Review of Ozone Effects on Human Lung Function, 2013 Through 2020. Chest 2022, 161, 190–201. [Google Scholar] [CrossRef]
  8. He, C.; Liu, J.; Zhou, Y.; Zhou, J.; Zhang, L.; Wang, Y.; Liu, L.; Peng, S. PM2.5 promotes lung cancer progression through activation of the AhR-TMPRSS2-IL18 pathway. EMBO Mol. Med. 2023, 15, e17014. [Google Scholar]
  9. Tu, H.; Hu, Y.; Hu, K.; Dong, P.; Wen, Y.; Jiang, J.; Xu, X.; Huang, J.; Zhu, J.; He, C.; et al. Assessment of the Respiratory Disease Mortality Risk from Single and Composite Exposures to PM2.5 and Ozone—Guangzhou City, Guangdong Province, China, 2018–2021. China CDC Wkly. 2024, 6, 857–861. [Google Scholar] [CrossRef]
  10. Xu, C.; Yin, P.; Jiang, Y.; Lin, X.; Shi, S.; Li, X.; Chen, J.; Jiang, Y.; Meng, X.; Zhou, M. Interactive effects of ambient fine particulate matter and ozone on daily mortality in 372 cities: Two stage time series analysis. BMJ-Brit. Med. J. 2023, 383, e075203. [Google Scholar]
  11. Xu, C.; Yin, P.; Jiang, Y.; Lin, X.; Shi, S.; Li, X.; Chen, J.; Jiang, Y.; Meng, X.; Zhou, M. Joint Effect of Short-Term Exposure to Fine Particulate Matter and Ozone on Mortality: A Time Series Study in 272 Chinese Cities. Environ. Sci. Technol. 2024, 58, 12865–12874. [Google Scholar] [CrossRef]
  12. Farraj, A.K.; Walsh, L.; Haykal-Coates, N.; Malik, F.; McGee, J.; Winsett, D.; Duvall, R.; Kovalcik, K.; Cascio, W.E.; Higuchi, M.; et al. Cardiac effects of seasonal ambient particulate matter and ozone co-exposure in rats. Part. Fibre Toxicol. 2015, 12, 12. [Google Scholar] [CrossRef] [PubMed]
  13. Jiang, X.; Han, Y.; Qiu, X.; Wang, Y.; Liu, J.; Cheng, Z.; Tian, Y.; Xu, Y.; Chen, X.; Fan, Y.; et al. Ozone Enhances the Inflammation Effects of PM2.5 Components Based on an Exposomic Approach in a Panel Study. Environ. Sci. Technol. Lett. 2024, 11, 818–824. [Google Scholar] [CrossRef]
  14. Wong, E.M.; Walby, W.F.; Wilson, D.W.; Tablin, F.; Schelegle, E.S. Ultrafine Particulate Matter Combined With Ozone Exacerbates Lung Injury in Mature Adult Rats With Cardiovascular Disease. Toxicol. Sci. 2018, 163, 140–151. [Google Scholar] [CrossRef]
  15. An, J.; Zhou, Q.; Wu, M.; Wang, L.; Zhong, Y.; Feng, J.; Shang, Y.; Chen, Y. Interactions between oxidative stress, autophagy and apoptosis in A549 cells treated with aged black carbon. Toxicol. Vitro 2019, 54, 67–74. [Google Scholar] [CrossRef]
  16. Yang, L.; Xu, F.; Zhao, S.; Zeng, Y.; Wu, Q.; Zhang, L.; Shi, S.; Zhang, F.; Li, J.; An, Z.; et al. Airway microbiota dysbiosis and metabolic disorder in ozone and PM2.5 co-exposure induced lung inflammatory injury in mice. Ecotoxicol. Environ. Saf. 2025, 290, 117626. [Google Scholar] [CrossRef]
  17. Knudsen, L.; Ochs, M. The micromechanics of lung alveoli: Structure and function of surfactant and tissue components. Histochem. Cell Biol. 2018, 150, 661–676. [Google Scholar] [CrossRef]
  18. Toth, A.; Kannan, P.; Snowball, J.; Kofron, M.; Wayman, J.A.; Bridges, J.P.; Miraldi, E.R.; Swarr, D.; Zacharias, W.J. Alveolar epithelial progenitor cells require Nkx2-1 to maintain progenitor-specific epigenomic state during lung homeostasis and regeneration. Nat. Commun. 2023, 14, 8452. [Google Scholar] [CrossRef]
  19. Sandoo, A.; van Zanten, J.J.V.; Metsios, G.S.; Carroll, D.; Kitas, G.D. The Endothelium and Its Role in Regulating Vascular Tone. Open Cardiovasc. Med. J. 2010, 4, 302. [Google Scholar] [CrossRef]
  20. Juhl, P.; Breisnes, H.W.; Karsdal, M.A.; Sand, J.M.B. The basement membrane and its role in pulmonary disease. In Biochemistry of Collagens, Laminins and Elastin, 3rd ed.; Karsdal, M.A., Ed.; Academic Press: Amsterdam, The Netherlands, 2024; pp. 473–482. [Google Scholar]
  21. Chen, C.; Arjomandi, M.; Balmes, J.; Tager, I.; Holland, N. Effects of Chronic and Acute Ozone Exposure on Lipid Peroxidation and Antioxidant Capacity in Healthy Young Adults. Environ. Health Perspect. 2007, 115, 1732–1737. [Google Scholar] [CrossRef]
  22. Lunov, O.; Zablotskii, V.; Churpita, O.; Chánová, E.; Syková, E.; Dejneka, A.; Kubinová, Š. Cell death induced by ozone and various non-thermal plasmas: Therapeutic perspectives and limitations. Sci. Rep. 2014, 4, 7129. [Google Scholar] [CrossRef]
  23. Kumar, S.; Kumar, R.; Diksha; Kumari, A.; Panwar, A. A super antioxidant from microalgae and its therapeutic potential. J. Basic. Microbiol. 2022, 62, 1064–1082. [Google Scholar] [CrossRef] [PubMed]
  24. Du, H.-H.; Liang, R.; Han, R.-M.; Zhang, J.-P.; Skibsted, L.H. Astaxanthin Protecting Membrane Integrity against Photosensitized Oxidation through Synergism with Other Carotenoids. J. Agric. Food Chem. 2015, 63, 9124–9130. [Google Scholar] [CrossRef] [PubMed]
  25. Fakhri, S.; Abbaszadeh, F.; Dargahi, L.; Jorjani, M. Astaxanthin: A mechanistic review on its biological activities and health benefits. Pharmacol. Res. 2018, 136, 1–20. [Google Scholar] [CrossRef]
  26. Kim, R.-E.; Shin, C.Y.; Han, S.-H.; Kwon, K.J. Astaxanthin Suppresses PM2.5-Induced Neuroinflammation by Regulating Akt Phosphorylation in BV-2 Microglial Cells. Int. J. Mol. Sci. 2020, 21, 7227. [Google Scholar] [CrossRef]
  27. Yin, B.; Ren, J.; Cui, Q.; Liu, X.; Wang, Z.; Pei, H.; Zuo, J.; Zhang, Y.; Wen, R.; Sun, X.; et al. Astaxanthin alleviates fine particulate matter (PM2.5)-induced lung injury in rats by suppressing ferroptosis and apoptosis. Food Funct. 2023, 14, 10841–10854. [Google Scholar] [CrossRef]
  28. Çelik, D.A.; Toğay, V.A. In vivo protective efficacy of astaxanthin against ionizing radiation-induced DNA damage. Chem. Biol. Drug Des. 2023, 102, 882–888. [Google Scholar]
  29. Dai, S.; Wang, B.; Song, Y.; Xie, Z.; Li, C.; Li, S.; Huang, Y.; Jiang, M. Astaxanthin and its gold nanoparticles mitigate cadmium toxicity in rice by inhibiting cadmium translocation and uptake. Sci. Total Environ. 2021, 786, 147496. [Google Scholar] [CrossRef]
  30. Yuan, C.; Jin, Z.; Xu, X.; Zhuang, H.; Shen, W. Preparation and stability of the inclusion complex of astaxanthin with hydroxypropyl-β-cyclodextrin. Food Chem. 2008, 109, 264–268. [Google Scholar] [CrossRef]
  31. Feng, Z.; Wang, X.; Yu, M.; Yuan, Y.; Li, B. PM2.5 reduces the daytime/nighttime urban heat island intensity over mainland China. Sustain. Cities Soc. 2025, 118, 106001. [Google Scholar] [CrossRef]
  32. Deng, J.; Qiu, S.; Zhang, Y.; Cui, H.; Li, K.; Cheng, H.; Liu, Z.; Dou, X.; Qian, Y. Estimating Nighttime PM2.5 Concentration in Beijing Based on NPP/VIIRS Day/Night Band. Remote Sens. 2023, 15, 349. [Google Scholar] [CrossRef]
  33. Ding, Y.; Li, S.; Xing, J.; Li, X.; Ma, X.; Song, G.; Teng, M.; Yang, J.; Dong, J.; Meng, S. Retrieving hourly seamless PM2.5 concentration across China with physically informed spatiotemporal connection. Remote Sens. Environ. 2024, 301, 113901. [Google Scholar] [CrossRef]
  34. Li, Y.; Wu, Z.; Ji, Y.; Chen, T.; Li, H.; Gao, R.; Xue, L.; Wang, Y.; Zhao, Y.; Yang, X. Comparison of the ozone formation mechanisms and VOCs apportionment in different ozone pollution episodes in urban Beijing in 2019 and 2020: Insights for ozone pollution control strategies. Sci. Total Environ. 2024, 908, 168332. [Google Scholar] [CrossRef] [PubMed]
  35. Wei, M.; Bao, G.; Li, S.; Yang, Z.; Cheng, C.; Le, W. PM2.5 exposure triggers cell death through lysosomal membrane permeabilization and leads to ferroptosis insensitivity via the autophagy dysfunction/p62-KEAP1-NRF2 activation in neuronal cells. Ecotox. Environ. Saf. 2022, 248, 114333. [Google Scholar] [CrossRef] [PubMed]
  36. Tian, Y.; Xu, P.; Wu, X.; Gong, Z.; Yang, X.; Zhu, H.; Zhang, J.; Hu, Y.; Li, G.; Sang, N.; et al. Lung injuries induced by ozone exposure in female mice: Potential roles of the gut and lung microbes. Environ. Int. 2024, 183, 108422. [Google Scholar] [CrossRef]
  37. Hatch, G.E.; Slade, R.; Harris, L.P.; McDonnell, W.F.; Devlin, R.B.; Koren, H.S.; Costa, D.L.; McKee, J. Ozone dose and effect in humans and rats. A comparison using oxygen-18 labeling and bronchoalveolar lavage. Am. J. Resp. Crit Care 1994, 150, 676–683. [Google Scholar] [CrossRef]
  38. Greve, H.J.; Dunbar, A.L.; Lombo, C.G.; Ahmed, C.; Thang, M.; Messenger, E.J.; Mumaw, C.L.; Johnson, J.A.; Kodavanti, U.P.; Oblak, A.L.; et al. The bidirectional lung brain-axis of amyloid-β pathology: Ozone dysregulates the peri-plaque microenvironment. Brain 2023, 146, 991–1005. [Google Scholar] [CrossRef]
  39. Zhou, Y.; Liu, Y.; Wang, T.; Li, H.; He, J.; Xu, A. Role of iron homeostasis in the mutagenicity of disinfection by-products in mammalian cells. Ecotox. Environ. Saf. 2024, 285, 117122. [Google Scholar] [CrossRef]
  40. Ji, Z.; Dai, R.; Zhang, Z. Characterization of fine particulate matter in ambient air by combining TEM and multiple spectroscopic techniques--NMR, FTIR and Raman spectroscopy. Environ. Sci. Process Impacts 2015, 17, 552–560. [Google Scholar] [CrossRef]
  41. Liu, Q.; Weng, J.; Li, C.; Feng, Y.; Xie, M.; Wang, X.; Chang, Q.; Li, M.; Chung, K.F.; Adcock, I.M.; et al. Attenuation of PM2.5-induced alveolar epithelial cells and lung injury through regulation of mitochondrial fission and fusion. Part. Fibre Toxicol. 2023, 20, 28. [Google Scholar] [CrossRef]
  42. GB 14925-2023; Laboratory Animals—Environment and Housing Facilitie. Standards Press of China: Beijing, China, 2023.
  43. Slaoui, M.; Fiette, L. Histopathology Procedures: From Tissue Sampling to Histopathological Evaluation. In Drug Safety Evaluation. Methods in Molecular Biology; Gautier, J.C., Ed.; Humana Press: Totowa, NJ, USA, 2011; Volume 691. [Google Scholar]
  44. Wong, P.K.; Ghadikolaei, M.A.; Chen, S.H.; Fadairo, A.A.; Ng, K.W.; Lee, S.M.; Xu, J.C.; Lian, Z.D.; Li, L.; Wong, H.C.; et al. Physical, chemical, and cell toxicity properties of mature/aged particulate matter (PM) trapped in a diesel particulate filter (DPF) along with the results from freshly produced PM of a diesel engine. J. Hazard. Mater. 2022, 434, 128855. [Google Scholar] [CrossRef]
  45. Wong, P.K.; Chen, S.H.; Ghadikolaei, M.A.; Ng, K.W.; Lee, S.M.; Xu, J.C.; Lian, Z.D.; Li, L.; Li, S.; Ning, Z.; et al. Chemical and cell toxicity properties of particulate matter emitted from a diesel engine fueled with biodiesel and ethanol blends. Environ. Pollut. 2025, 379, 126484. [Google Scholar] [CrossRef] [PubMed]
  46. Rodriguez-Loya, J.; Lerma, M.; Gardea-Torresdey, J.L. Dynamic Light Scattering and Its Application to Control Nanoparticle Aggregation in Colloidal Systems: A Review. Micromachines 2024, 15, 24. [Google Scholar] [CrossRef] [PubMed]
  47. Saha, K.; Rahimi, M.; Yazdani, M.; Kim, S.T.; Moyano, D.F.; Hou, S.; Das, R.; Mout, R.; Rezaee, F.; Mahmoudi, M.; et al. Regulation of Macrophage Recognition through the Interplay of Nanoparticle Surface Functionality and Protein Corona. ACS Nano 2016, 10, 4421–4430. [Google Scholar] [CrossRef]
  48. Li, Y.; Wang, P.; Hu, C.; Wang, K.; Chang, Q.; Liu, L.; Han, Z.; Shao, Y.; Zhai, Y.; Zuo, Z.; et al. Protein corona of airborne nanoscale PM2.5 induces aberrant proliferation of human lung fibroblasts based on a 3D organotypic culture. Sci. Rep. 2018, 8, 1939. [Google Scholar] [CrossRef]
  49. Pan, B.; Li, H.; Lang, D.; Xing, B. Environmentally persistent free radicals: Occurrence, formation mechanisms and implications. Environ. Pollut. 2019, 248, 320–331. [Google Scholar] [CrossRef]
  50. Vejerano, E.P.; Rao, G.; Khachatryan, L.; Cormier, S.A.; Lomnicki, S. Environmentally Persistent Free Radicals: Insights on a New Class of Pollutants. Environ. Sci. Technol. 2018, 52, 2468–2481. [Google Scholar] [CrossRef]
  51. Wu, M.; Zhao, Z.; Zhang, P.; Wan, M.; Lei, J.; Pan, B.; Xing, B. Environmental persistent free radicals in diesel engine exhaust particles at different altitudes and engine speeds. Sci. Total Environ. 2021, 796, 148963. [Google Scholar] [CrossRef]
  52. Zhao, Z.; Li, H.; Wei, Y.; Fang, G.; Jiang, Q.; Pang, Y.; Huang, W.; Tang, M.; Jing, Y.; Feng, X.; et al. Airborne environmentally persistent free radicals (EPFRs) in PM2.5 from combustion sources: Abundance, cytotoxicity and potential exposure risks. Sci. Total Environ. 2024, 927, 172202. [Google Scholar] [CrossRef]
  53. Borrowman, C.K.; Zhou, S.; Burrow, T.E.; Abbatt, J.P.D. Formation of environmentally persistent free radicals from the heterogeneous reaction of ozone and polycyclic aromatic compounds. Phys. Chem. Chem. Phys. 2016, 18, 205–212. [Google Scholar] [CrossRef]
  54. Singh, S.A.; Suresh, S.; Vellapandian, C. Ozone-induced neurotoxicity: In vitro and in vivo evidence. Ageing Res. Rev. 2023, 91, 102045. [Google Scholar] [CrossRef]
  55. Stewart, E.J.; Dye, J.A.; Schladweiler, M.C.; Phillips, P.M.; McDaniel, K.L.; Richards, J.H.; Grindstaff, R.D.; Padgett, W.T. Prenatal ozone exposure programs a sexually dimorphic susceptibility to high-fat diet in adolescent Long Evans rats. FASEB J. 2022, 36, e22664. [Google Scholar] [CrossRef] [PubMed]
  56. Sebastian, R.; Sun, E.G.; Fedkenheuer, M.; Fu, H.; Jung, S.; Thakur, B.L.; Redon, C.E.; Pegoraro, G.; Tran, A.D.; Gross, J.M.; et al. Mechanism for local attenuation of DNA replication at double-strand breaks. Nature 2025, 639, 1084–1092. [Google Scholar] [CrossRef] [PubMed]
  57. IARC Working Group on the Evaluation of Carcinogenic Risks to Humans. Diesel and Gasoline Engine Exhausts and Some Nitroarenes; International Agency for Research on Cancer: Lyon, France, 2014. [Google Scholar]
  58. Cataldo, F. DNA degradation with ozone. Int. J. Biol. Macromol. 2006, 38, 248–254. [Google Scholar] [CrossRef] [PubMed]
  59. Ammendolia, D.A.; Bement, W.M.; Brumell, J.H. Plasma membrane integrity: Implications for health and disease. BMC Biol. 2021, 19, 71. [Google Scholar] [CrossRef]
  60. Zhang, Y.Q.; Wu, Q.P.; Zhang, J.M.; Yang, X.H. Effects of ozone on membrane permeability and ultrastructure in Pseudomonas aeruginosa. J. Appl. Microbiol. 2011, 111, 1006–1015. [Google Scholar] [CrossRef]
  61. Wang, Y. Ambient fine particulate matter provokes multiple modalities of cell death via perturbation of subcellular structures. Environ. Int. 2025, 195, 109193. [Google Scholar] [CrossRef]
  62. Tang, S.K.Y.; Marshall, W.F. Self-Repairing Cells. Science 2017, 356, 1022–1025. [Google Scholar] [CrossRef]
  63. Jairaman, A.; Prakriya, M. Calcium Signaling in Airway Epithelial Cells: Current Understanding and Implications for Inflammatory Airway Disease. Arterioscler. Thromb. Vasc. Biol. 2024, 44, 772–783. [Google Scholar] [CrossRef]
  64. Berridge, M.J.; Lipp, P.; Bootman, M.D. The versatility and universality of calcium signalling. Nat. Rev. Mol. Cell Biol. 2000, 1, 11–21. [Google Scholar] [CrossRef]
  65. Steiner, S.; Bisig, C.; Petri-Fink, A.; Rothen-Rutishauser, B. Diesel exhaust: Current knowledge of adverse effects and underlying cellular mechanisms. Arch. Toxicol. 2016, 90, 1541–1553. [Google Scholar] [CrossRef]
  66. Seriani, R.; Junqueira, M.S.; Carvalho-Sousa, C.E.; Arruda, A.C.; Martinez, D.; Alencar, A.M.; Garippo, A.L.; Brito, J.M.; Martins, M.A.; Saldiva, P.H.; et al. Enriched inorganic compounds in diesel exhaust particles induce mitogen-activated protein kinase activation, cytoskeleton instability, and cytotoxicity in human bronchial epithelial cells. Exp. Toxicol. Pathol. 2015, 67, 323–329. [Google Scholar] [CrossRef] [PubMed]
  67. Ayala, A.; Muñoz, M.F.; Argüelles, S. Lipid Peroxidation: Production, Metabolism, and Signaling Mechanisms of Malondialdehyde and 4-Hydroxy-2-Nonenal. Oxid. Med. Cell Longev. 2014, 2014, 360438. [Google Scholar] [CrossRef] [PubMed]
  68. Wiegman, C.H.; Li, F.; Ryffel, B.; Togbe, D.; Chung, K.F. Oxidative Stress in Ozone-Induced Chronic Lung Inflammation and Emphysema: A Facet of Chronic Obstructive Pulmonary Disease. Front. Immunol. 2020, 11, 1957. [Google Scholar] [CrossRef]
  69. Wang, G.; Jiang, R.; Zhao, Z.; Song, W. Effects of ozone and fine particulate matter (PM2.5) on rat system inflammation and cardiac function. Toxicol. Lett. 2013, 217, 23–33. [Google Scholar] [CrossRef]
  70. Yan, Z.; Jin, Y.; An, Z.; Liu, Y.; Samet, J.M.; Wu, W. Inflammatory cell signaling following exposures to particulate matter and ozone. Biochim. Biophys. Acta 2016, 1860, 2826–2834. [Google Scholar] [CrossRef]
  71. He, L.; Weschler, C.J.; Morrison, G.; Li, F.; Zhang, Y.; Bergin, M.H.; Black, M.; Zhang, J.J. Synergistic Effects of Ozone Reaction Products and Fine Particulate Matter on Respiratory Pathophysiology in Children with Asthma. ACS EST Air 2024, 1, 918–926. [Google Scholar] [CrossRef]
  72. Wang, T.; Liu, Y.; Zhou, Y.; Liu, Q.; Zhang, Q.; Sun, M.; Sun, M.; Li, H.; Xu, A.; Liu, Y. Astaxanthin protected against the adverse effects induced by diesel exhaust particulate matter via improving membrane stability and anti-oxidative property. J. Hazard. Mater. 2023, 456, 131684. [Google Scholar] [CrossRef]
  73. Rackley, C.R.; Stripp, B.R. Building and maintaining the epithelium of the lung. J. Clin. Investig. 2012, 122, 2724–2730. [Google Scholar] [CrossRef]
  74. Davis, J.D.; Wypych, T.P. Cellular and functional heterogeneity of the airway epithelium. Mucosal Immunol. 2021, 14, 978–990. [Google Scholar] [CrossRef]
  75. Whitsett, J.A.; Alenghat, T. Respiratory epithelial cells orchestrate pulmonary innate immunity. Nat. Immunol. 2015, 16, 27–35. [Google Scholar] [CrossRef]
  76. Kim, K.-H.; Kabir, E.; Kabir, S. A review on the human health impact of airborne particulate matter. Environ. Int. 2015, 74, 136–143. [Google Scholar] [CrossRef] [PubMed]
  77. Qi, Y.; Wei, S.; Xin, T.; Huang, C.; Pu, Y.; Ma, J.; Zhang, C.; Liu, Y.; Lynch, I.; Liu, S. Passage of exogeneous fine particles from the lung into the brain in humans and animals. Proc. Natl. Acad. Sci. USA 2022, 119, e2117083119. [Google Scholar] [CrossRef] [PubMed]
  78. Wang, G.; Zhao, J.; Jiang, R.; Song, W. Rat lung response to ozone and fine particulate matter (PM2.5) exposures. Environ. Toxicol. 2015, 30, 343–356. [Google Scholar] [CrossRef]
  79. Wu, Y.; Bashir, M.A.; Shao, C.; Wang, H.; Zhu, J.; Huang, Q. Astaxanthin targets IL-6 and alleviates the LPS-induced adverse inflammatory response of macrophages. Food Funct. 2024, 15, 4207–4222. [Google Scholar] [CrossRef]
  80. Pereira, C.P.M.; Souza, A.C.R.; Vasconcelos, A.R.; Prado, P.S.; Name, J.J. Antioxidant and anti-inflammatory mechanisms of action of astaxanthin in cardiovascular diseases (Review). Int. J. Mol. Med. 2021, 47, 37–48. [Google Scholar] [CrossRef]
Figure 1. Characterization of PM2.5 at varying concentrations and in different media. (A) TEM images of PM2.5. Scale bar = 200 nm. (B) The average hydrated particle sizes and (C) zeta potentials for 25, 50, and 100 μg/mL PM2.5 in different media. (D) EPR spectra of EPFRs in PM2.5 with or without O3 pre-treatment. Blue line: EPR spectra of 50 μg/mL PM2.5. Red line: EPR spectra of 50 μg/mL PM2.5 after 1 ppm O3 pre-treatment (1 h). Grey line: EPR spectra of PBS used as a control solution.
Toxics 13 00446 g001
Figure 2. Cytotoxicity and genotoxicity of PM2.5 and O3. (A) Experimental flowchart. (B) The dose-dependent changes in cellular viability induced by O3. Purple column: BEAS-2B cells were exposed to 0.2, 0.4, 0.6, 0.8, and 1 ppm O3 for 1 h. Pink column: cells were maintained in culture conditions for another 24 h after O3 exposure (1 h). (C) The survival fraction of BEAS-2B cells exposed to different concentrations of PM2.5 (25, 50, and 100 μg/mL) for 24 h. The combined effects of O3 and PM2.5 on (D) survival fraction and (E) γ-H2AX protein levels of BEAS-2B cells. Cells were treated with PM2.5 (24 h) or O3 (1 h in O3 + 24 h in culture condition) or combined-treated with 1 ppm O3 for 1 h, and this was immediately followed by 50 μg/mL PM2.5 exposure for another 24 h. *, p < 0.05; **, p < 0.01; ***, p < 0.001, compared to control group; ns, no significance.
Toxics 13 00446 g002
Figure 3. Membrane damage caused by PM2.5 and O3, respectively. The dose-dependent changes in (A) LDH release and (C) membrane potential induced by O3. Purple column: BEAS-2B cells were exposed to 0.2, 0.4, 0.6, 0.8, and 1 ppm O3 for 1 h. Pink column: cells were maintained in culture conditions for another 24 h after O3 exposure (1 h). The (B) LDH release and (D) membrane potential of BEAS-2B cells to 0, 25, 50, and 100 μg/mL of PM2.5 for 24 h. *, p < 0.05; **, p < 0.01; ***, p < 0.001, compared to control group; ns, no significance.
Toxics 13 00446 g003
Figure 4. Combined effects of O3 and PM2.5 on membrane damage and PM2.5 bioaccumulation. (A) LDH release, (B) membrane potential, and (C) Ca2+ flux. (D) Direct observation of cell membrane rupture (green arrows) and PM2.5 bioaccumulation (red arrows) in BEAS-2B cells. Scale bar = 500 nm. Cells were pre-treated with O3 (1 h in O3 + 24 h in culture conditions) or PM2.5 (24 h), or combined-treated with 1 ppm O3 for 1 h, followed by 50 μg/mL PM2.5 treatment for another 24 h. *, p < 0.05; **, p < 0.01; ***, p < 0.001, compared to the control group.
Toxics 13 00446 g004
Figure 5. Suppression of PM2.5- and O3-induced toxicity by AST in vitro and in vivo. (A) γ-H2AX protein levels, (B) membrane potential, and (C) Ca2+ flux in cells treated with AST (10 μM) and 50 μg/mL PM2.5 for 24 h after pre-treatment with 1 ppm O3 for 1 h. (D) Direct observation of the protective role of AST on cell membrane breakage (green arrow) and PM2.5 bioaccumulation (red arrows) induced by PM2.5 and O3 co-exposure. Scale bar = 500 nm. (E) H&E of lung tissues collected from PM2.5, O3, and AST-treated mice. Scale bar = 50 µm. Red arrows indicate PM2.5 particles. *, p < 0.05; **, p < 0.01; ***, p < 0.001, compared to control group.
Toxics 13 00446 g005
Disclaimer/Publisher’s Note: The statements, opinions and data contained in all publications are solely those of the individual author(s) and contributor(s) and not of MDPI and/or the editor(s). MDPI and/or the editor(s) disclaim responsibility for any injury to people or property resulting from any ideas, methods, instructions or products referred to in the content.

