
Size-Dependent Cytotoxicity and Multi-Omic Changes Induced by Amorphous Silicon Nanoparticles in HepG2 Cells

 ,
,  and
and 
Abstract

1. Introduction
2. Materials and Methods
2.1. Characterization of SiO2 NPs
2.2. Cell Culture and Exposure to SiO2 NPs
2.3. Cell Viability Assay
2.4. Proteomics
2.4.1. Protein Sample Preparation
2.4.2. High-pH Reverse-Phase Separation and Mass Spectrometry (HPLC-MS) Assay
2.4.3. Proteomic Data Analysis
2.5. Metabolomics
2.5.1. Metabolomic Sample Preparation
2.5.2. Gas Chromatography–Mass Spectrometry (GC-MS) Analysis
2.5.3. Metabolomic Data Analysis
2.6. Integrative Metabolomics and Proteomics Analysis
2.7. Statistical Analysis
3. Results
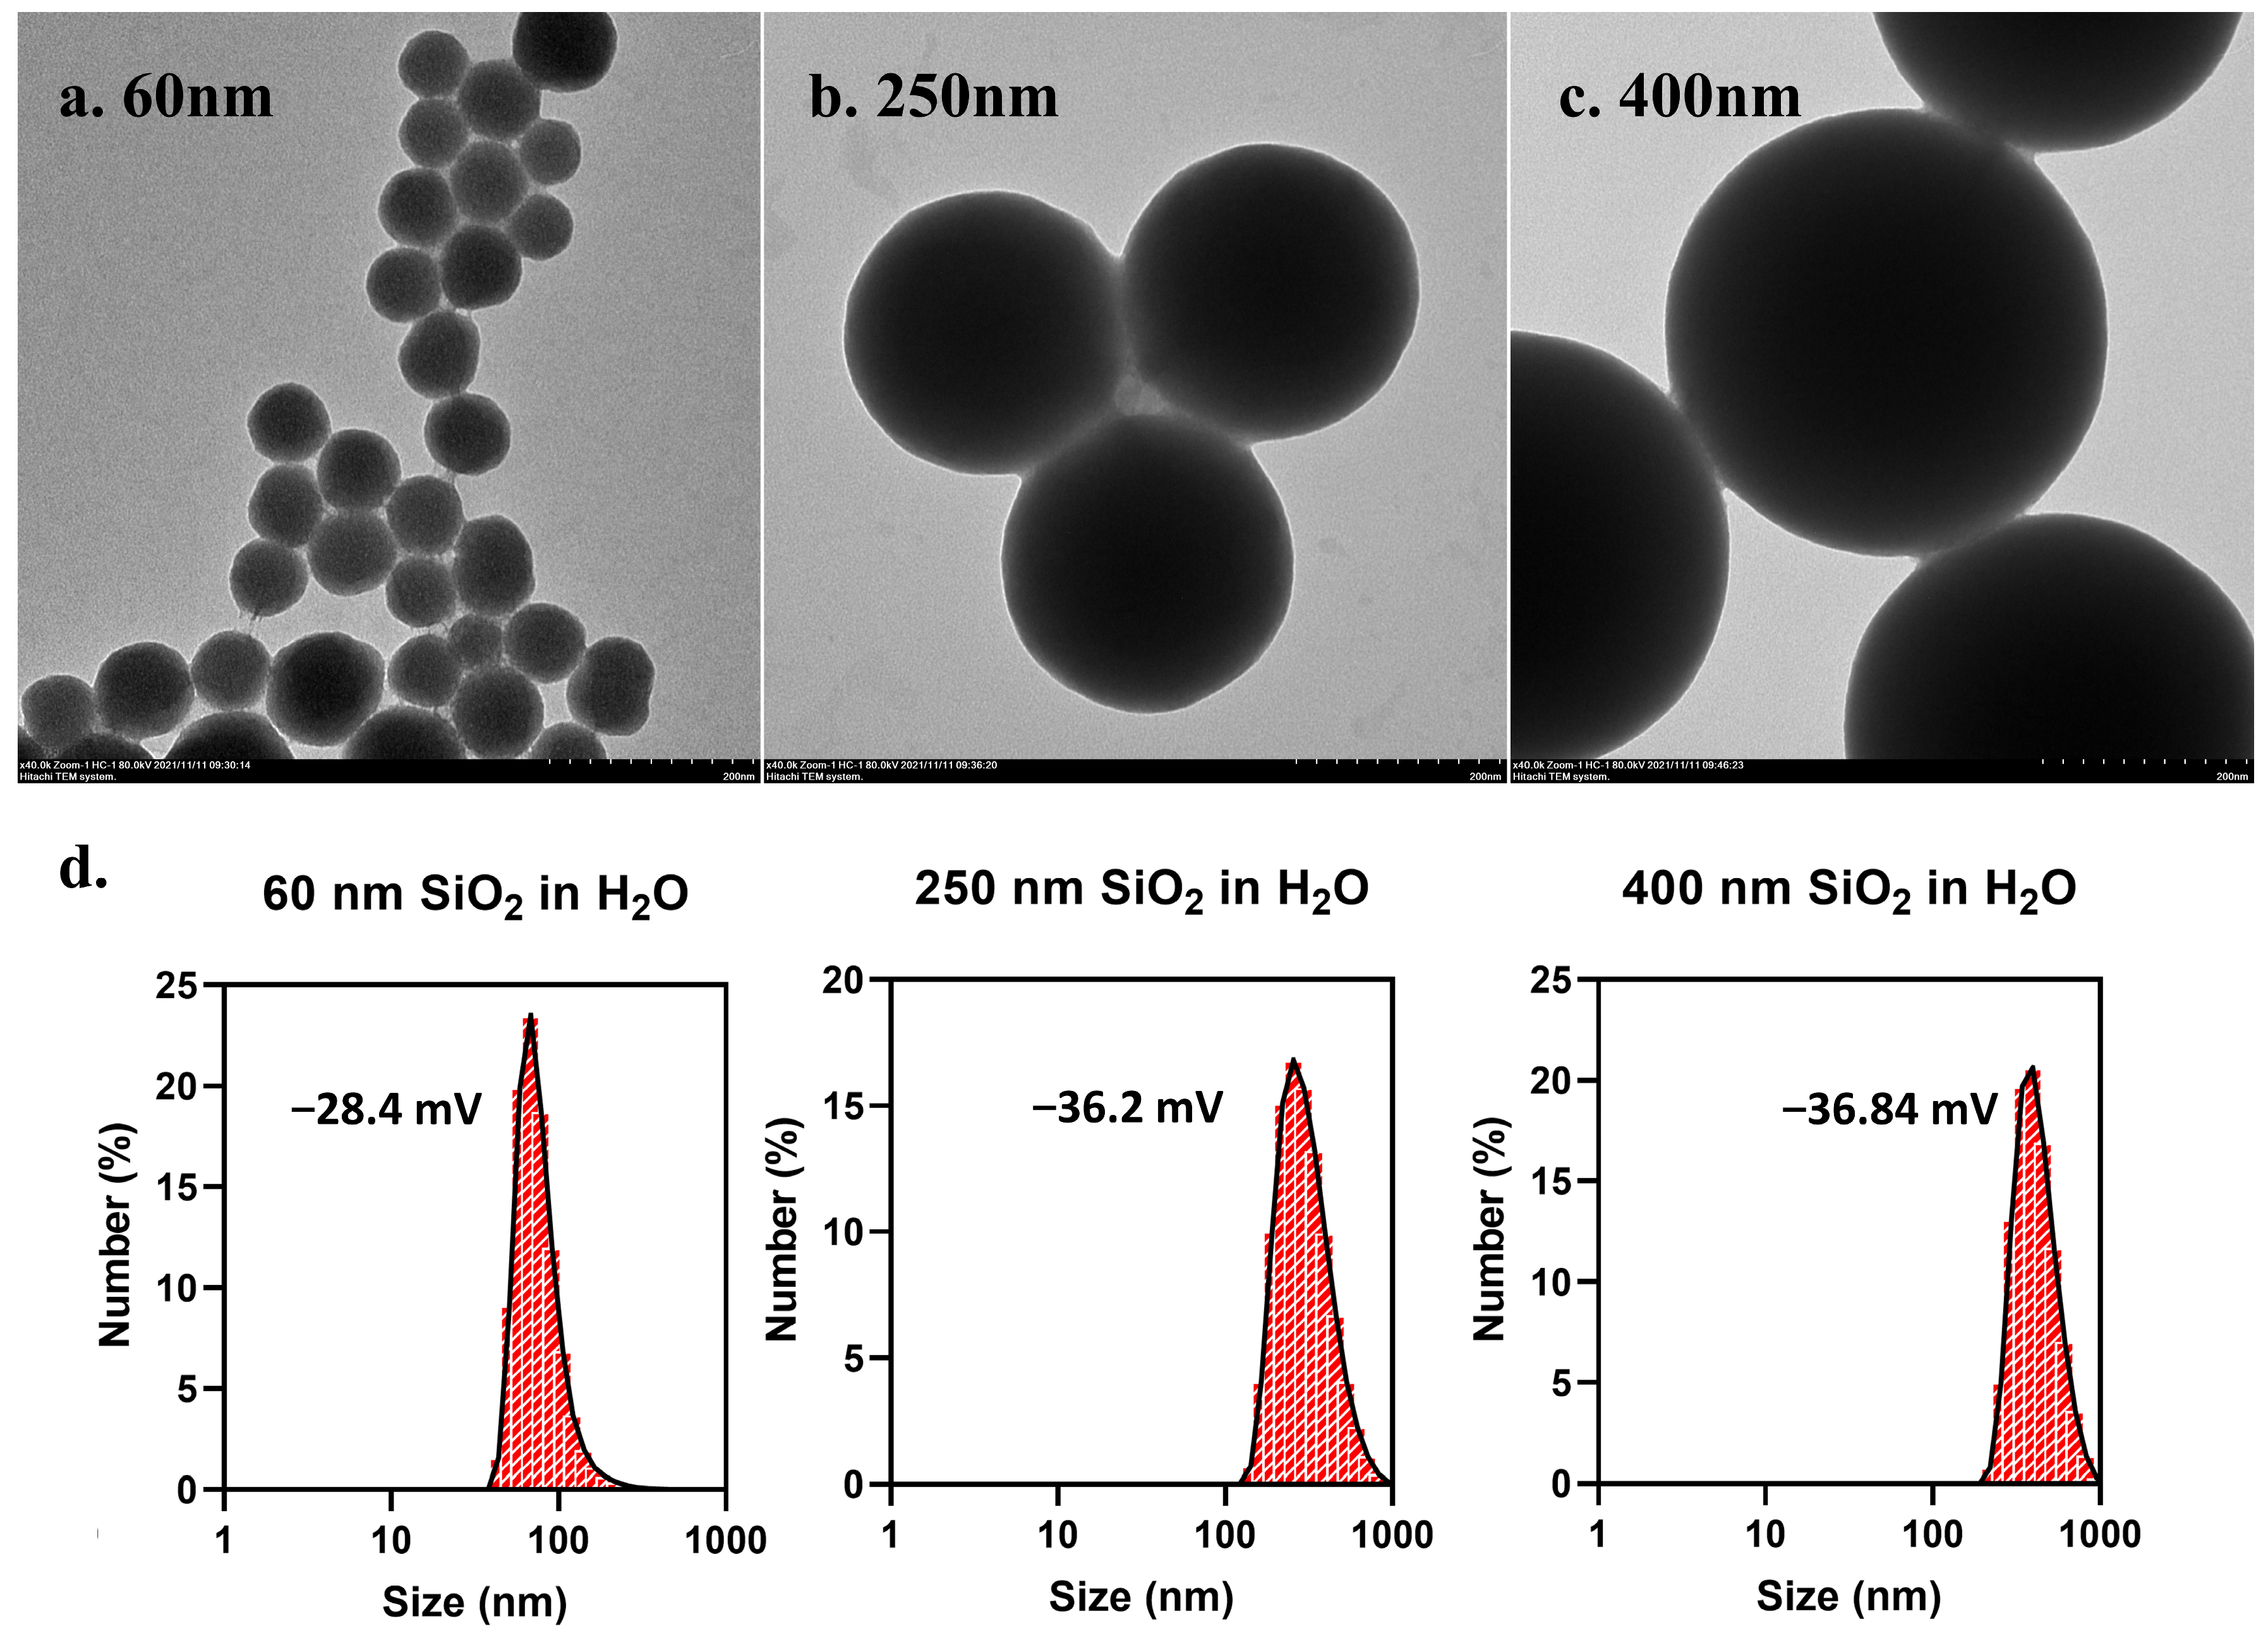
3.1. Characterization of SiO2 NPs
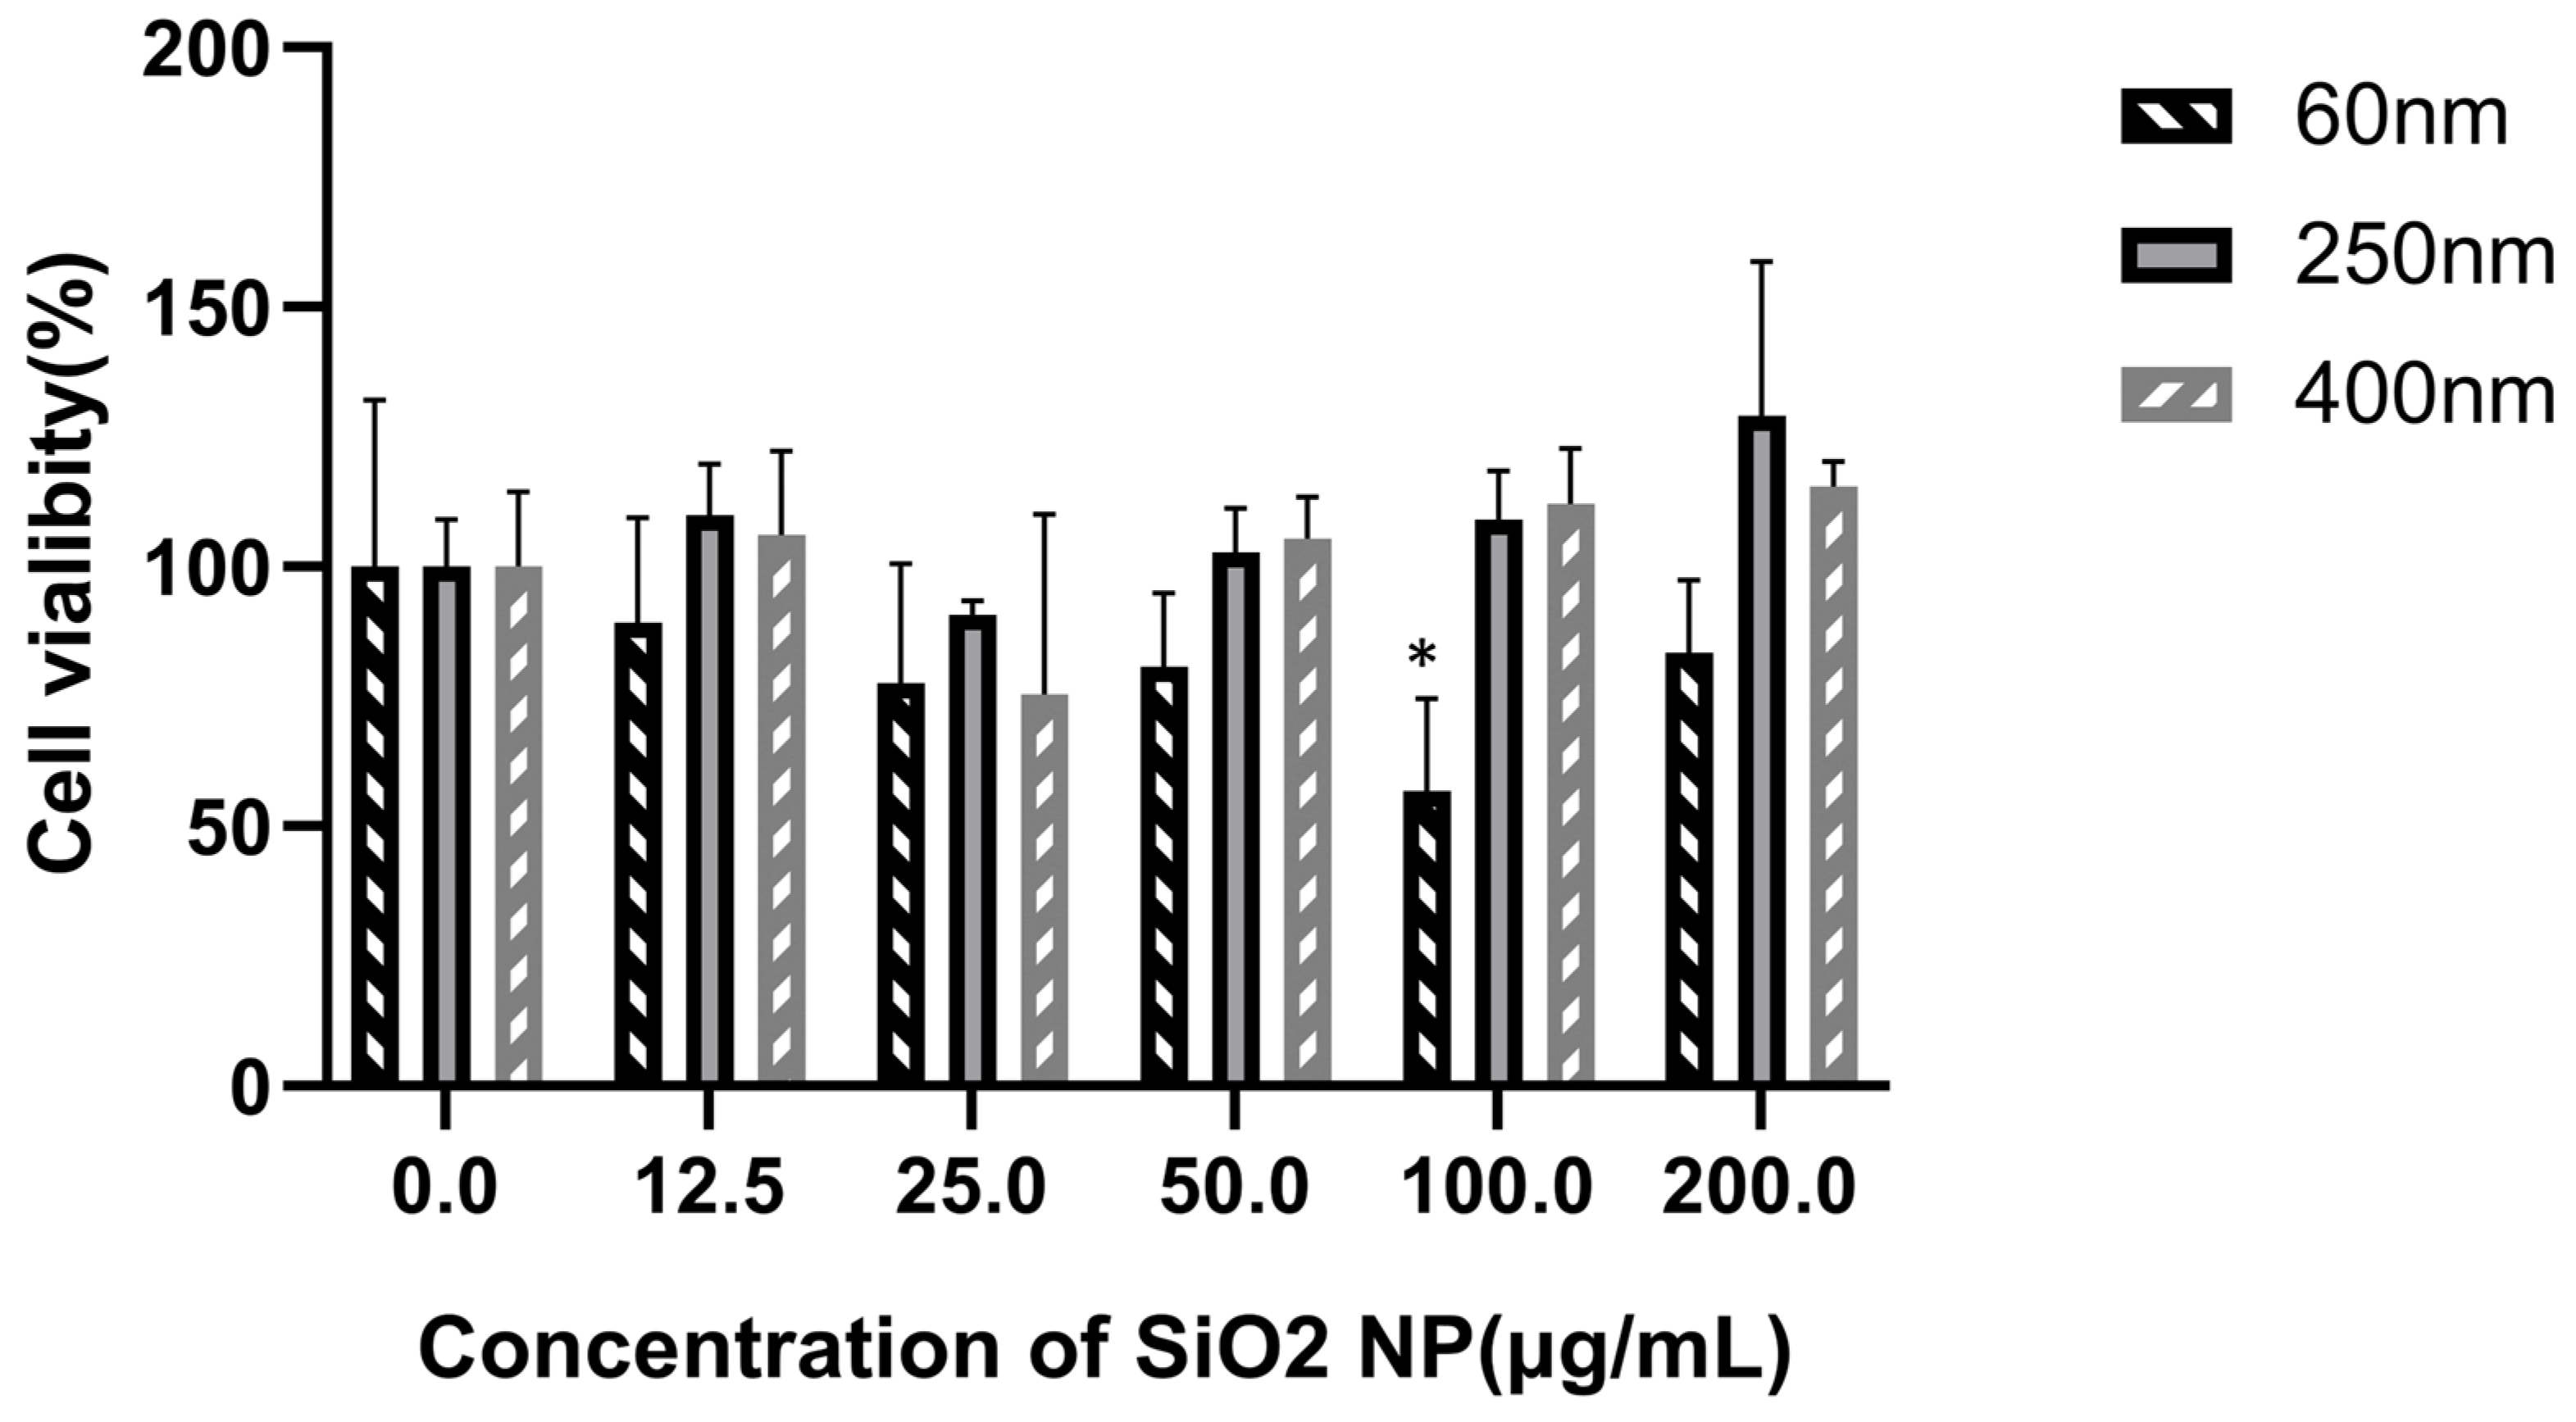
3.2. Cytotoxicity of SiO2 NPs in HepG2 Cells
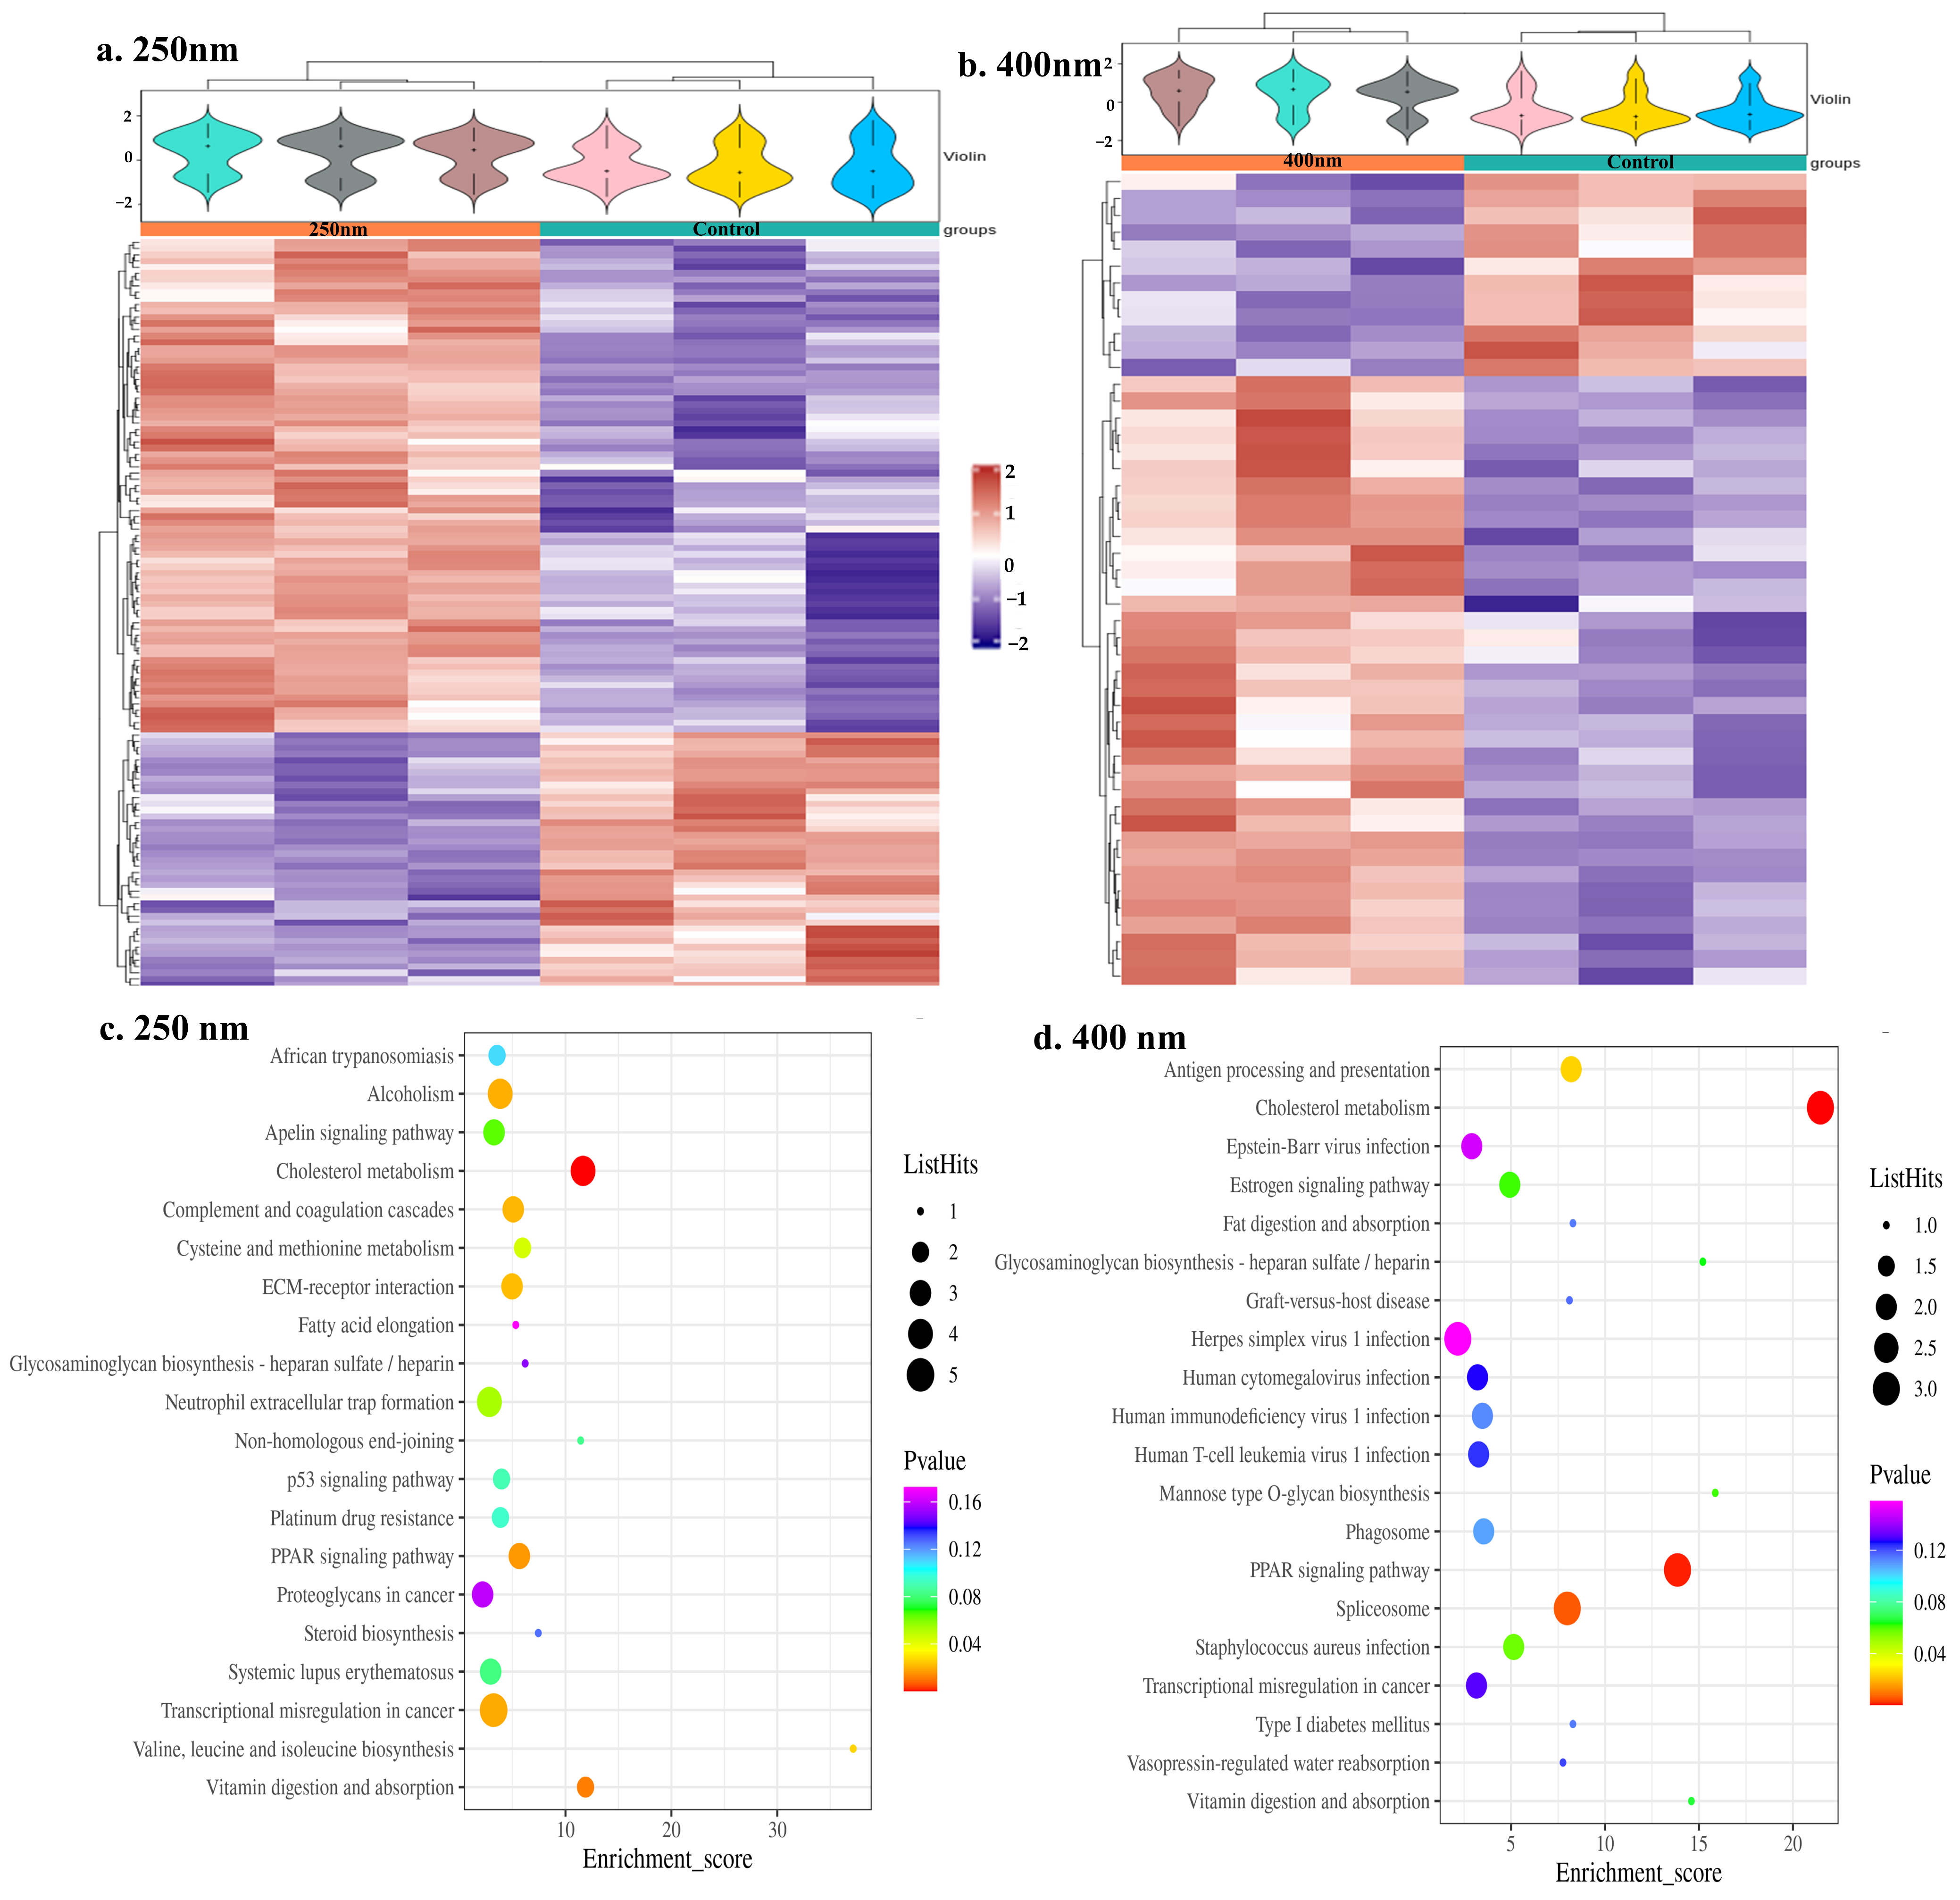
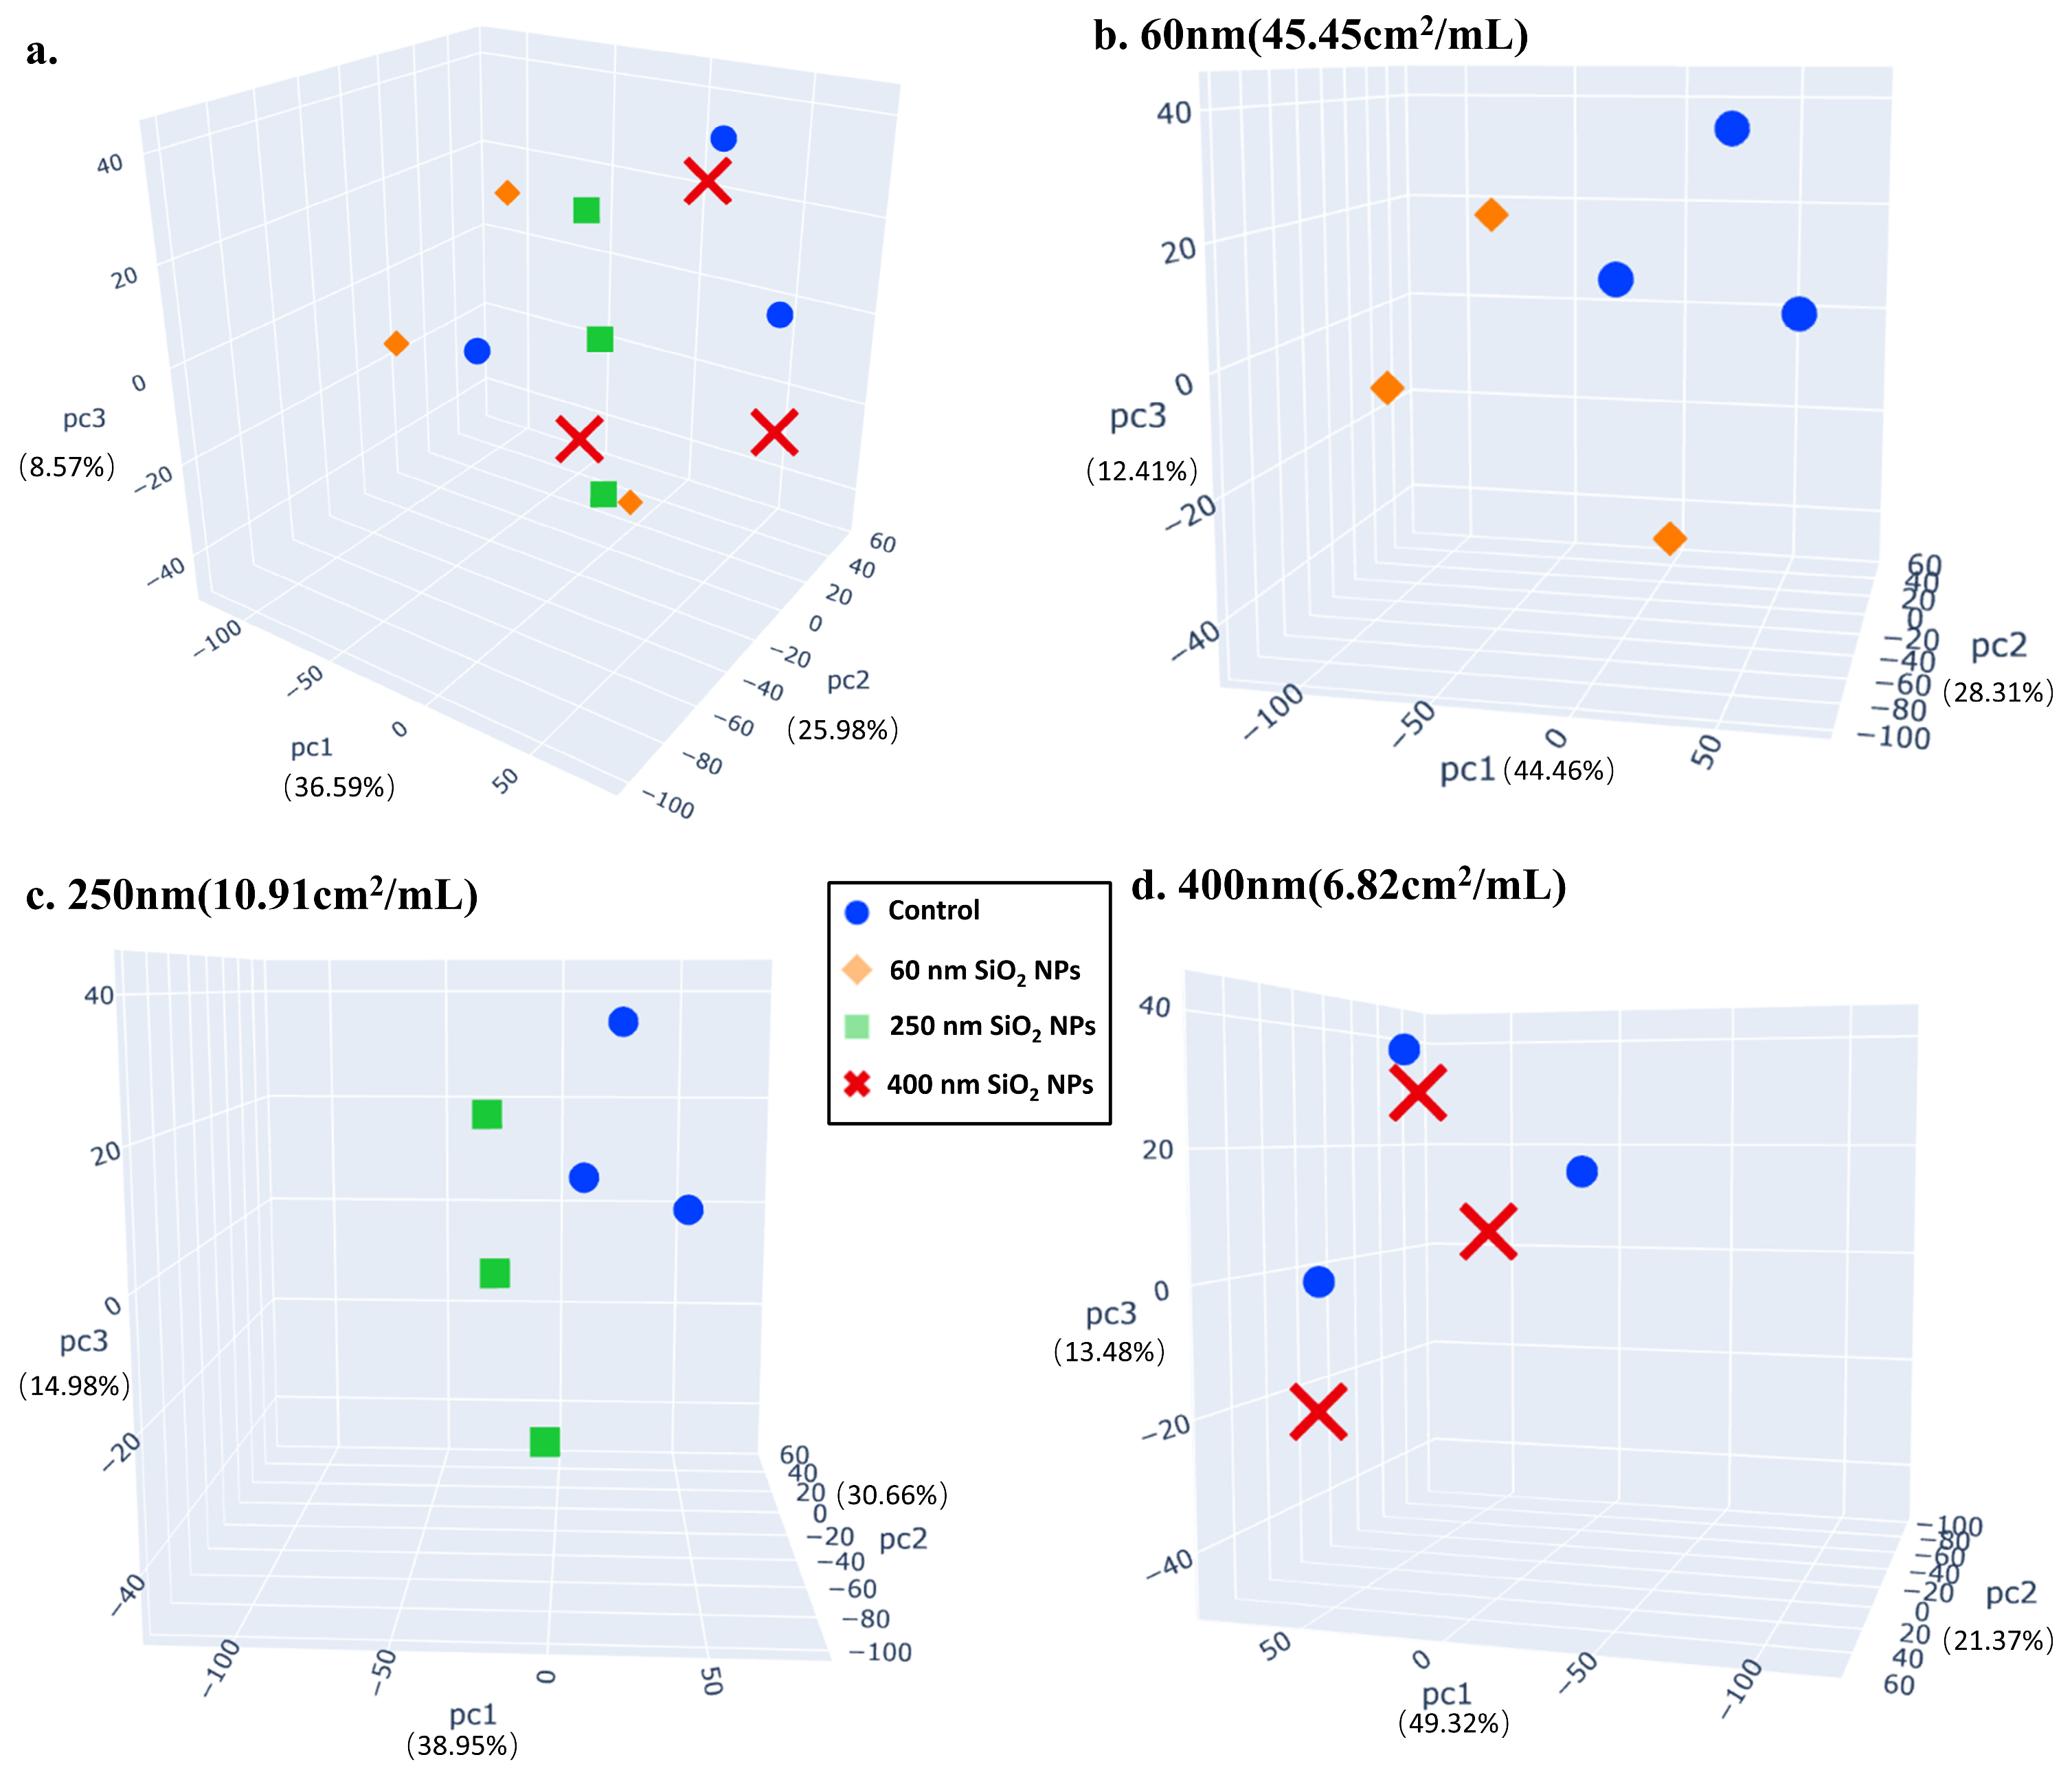
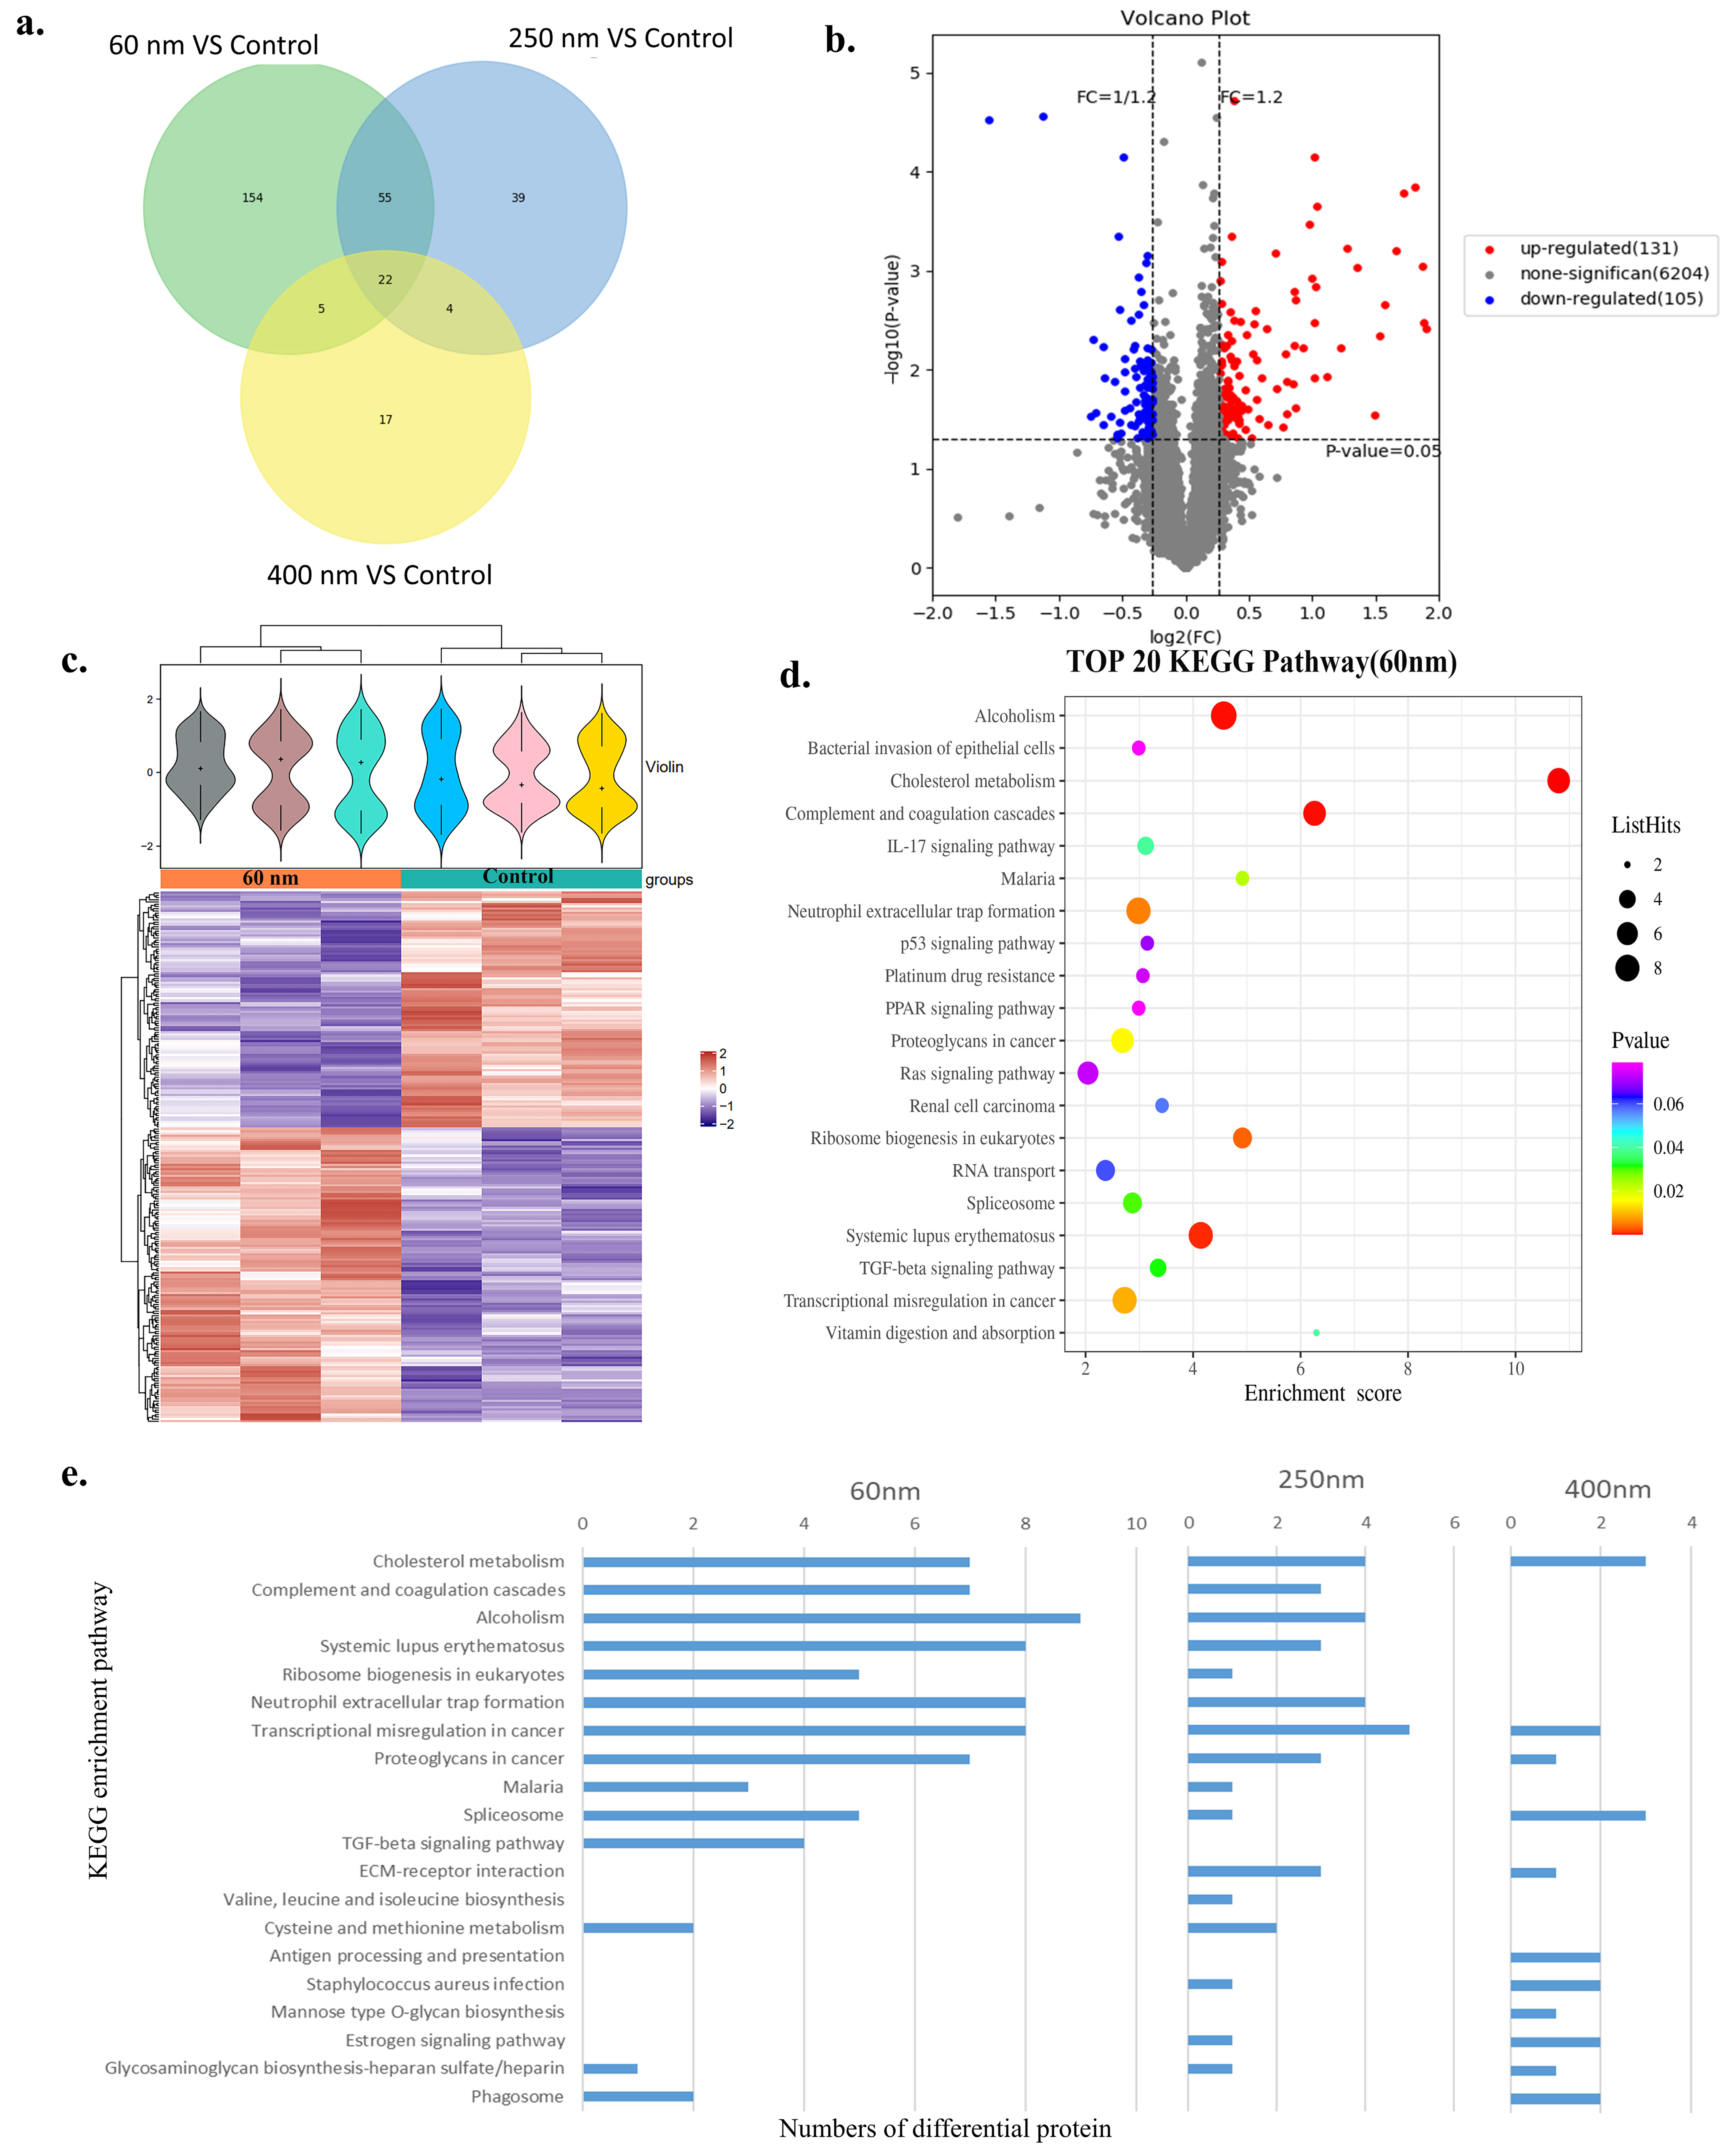
3.3. Proteomics
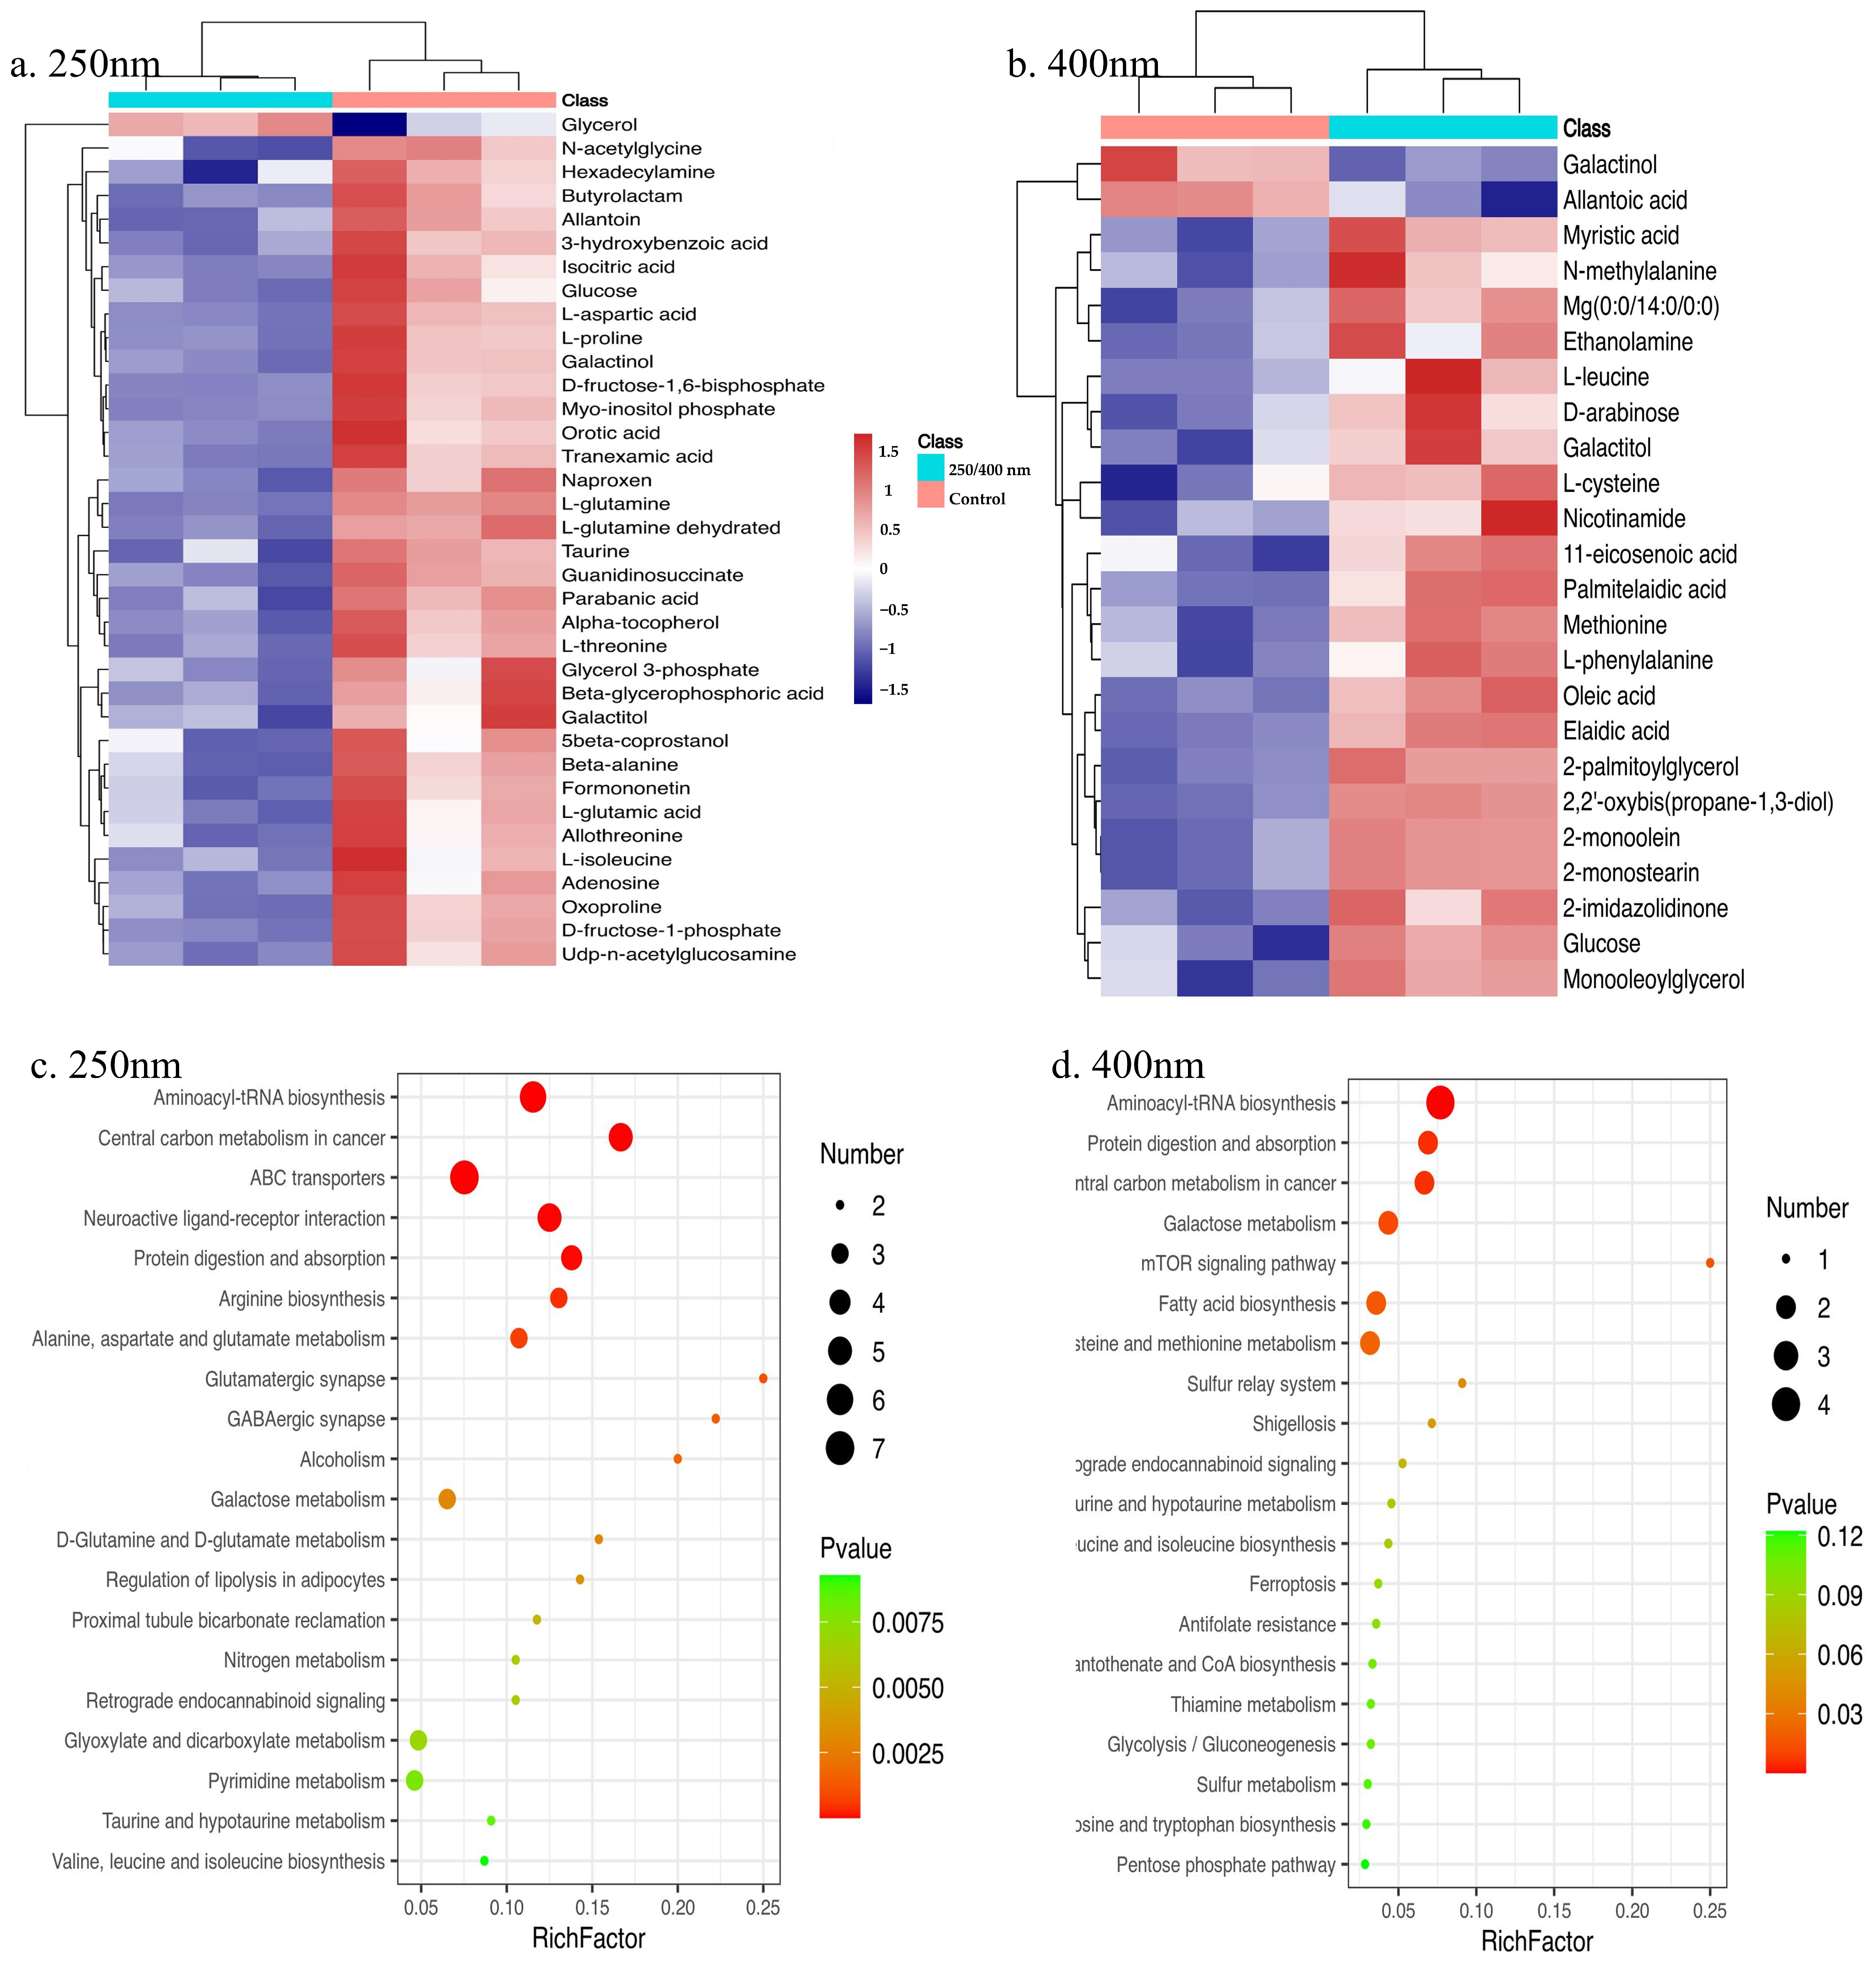
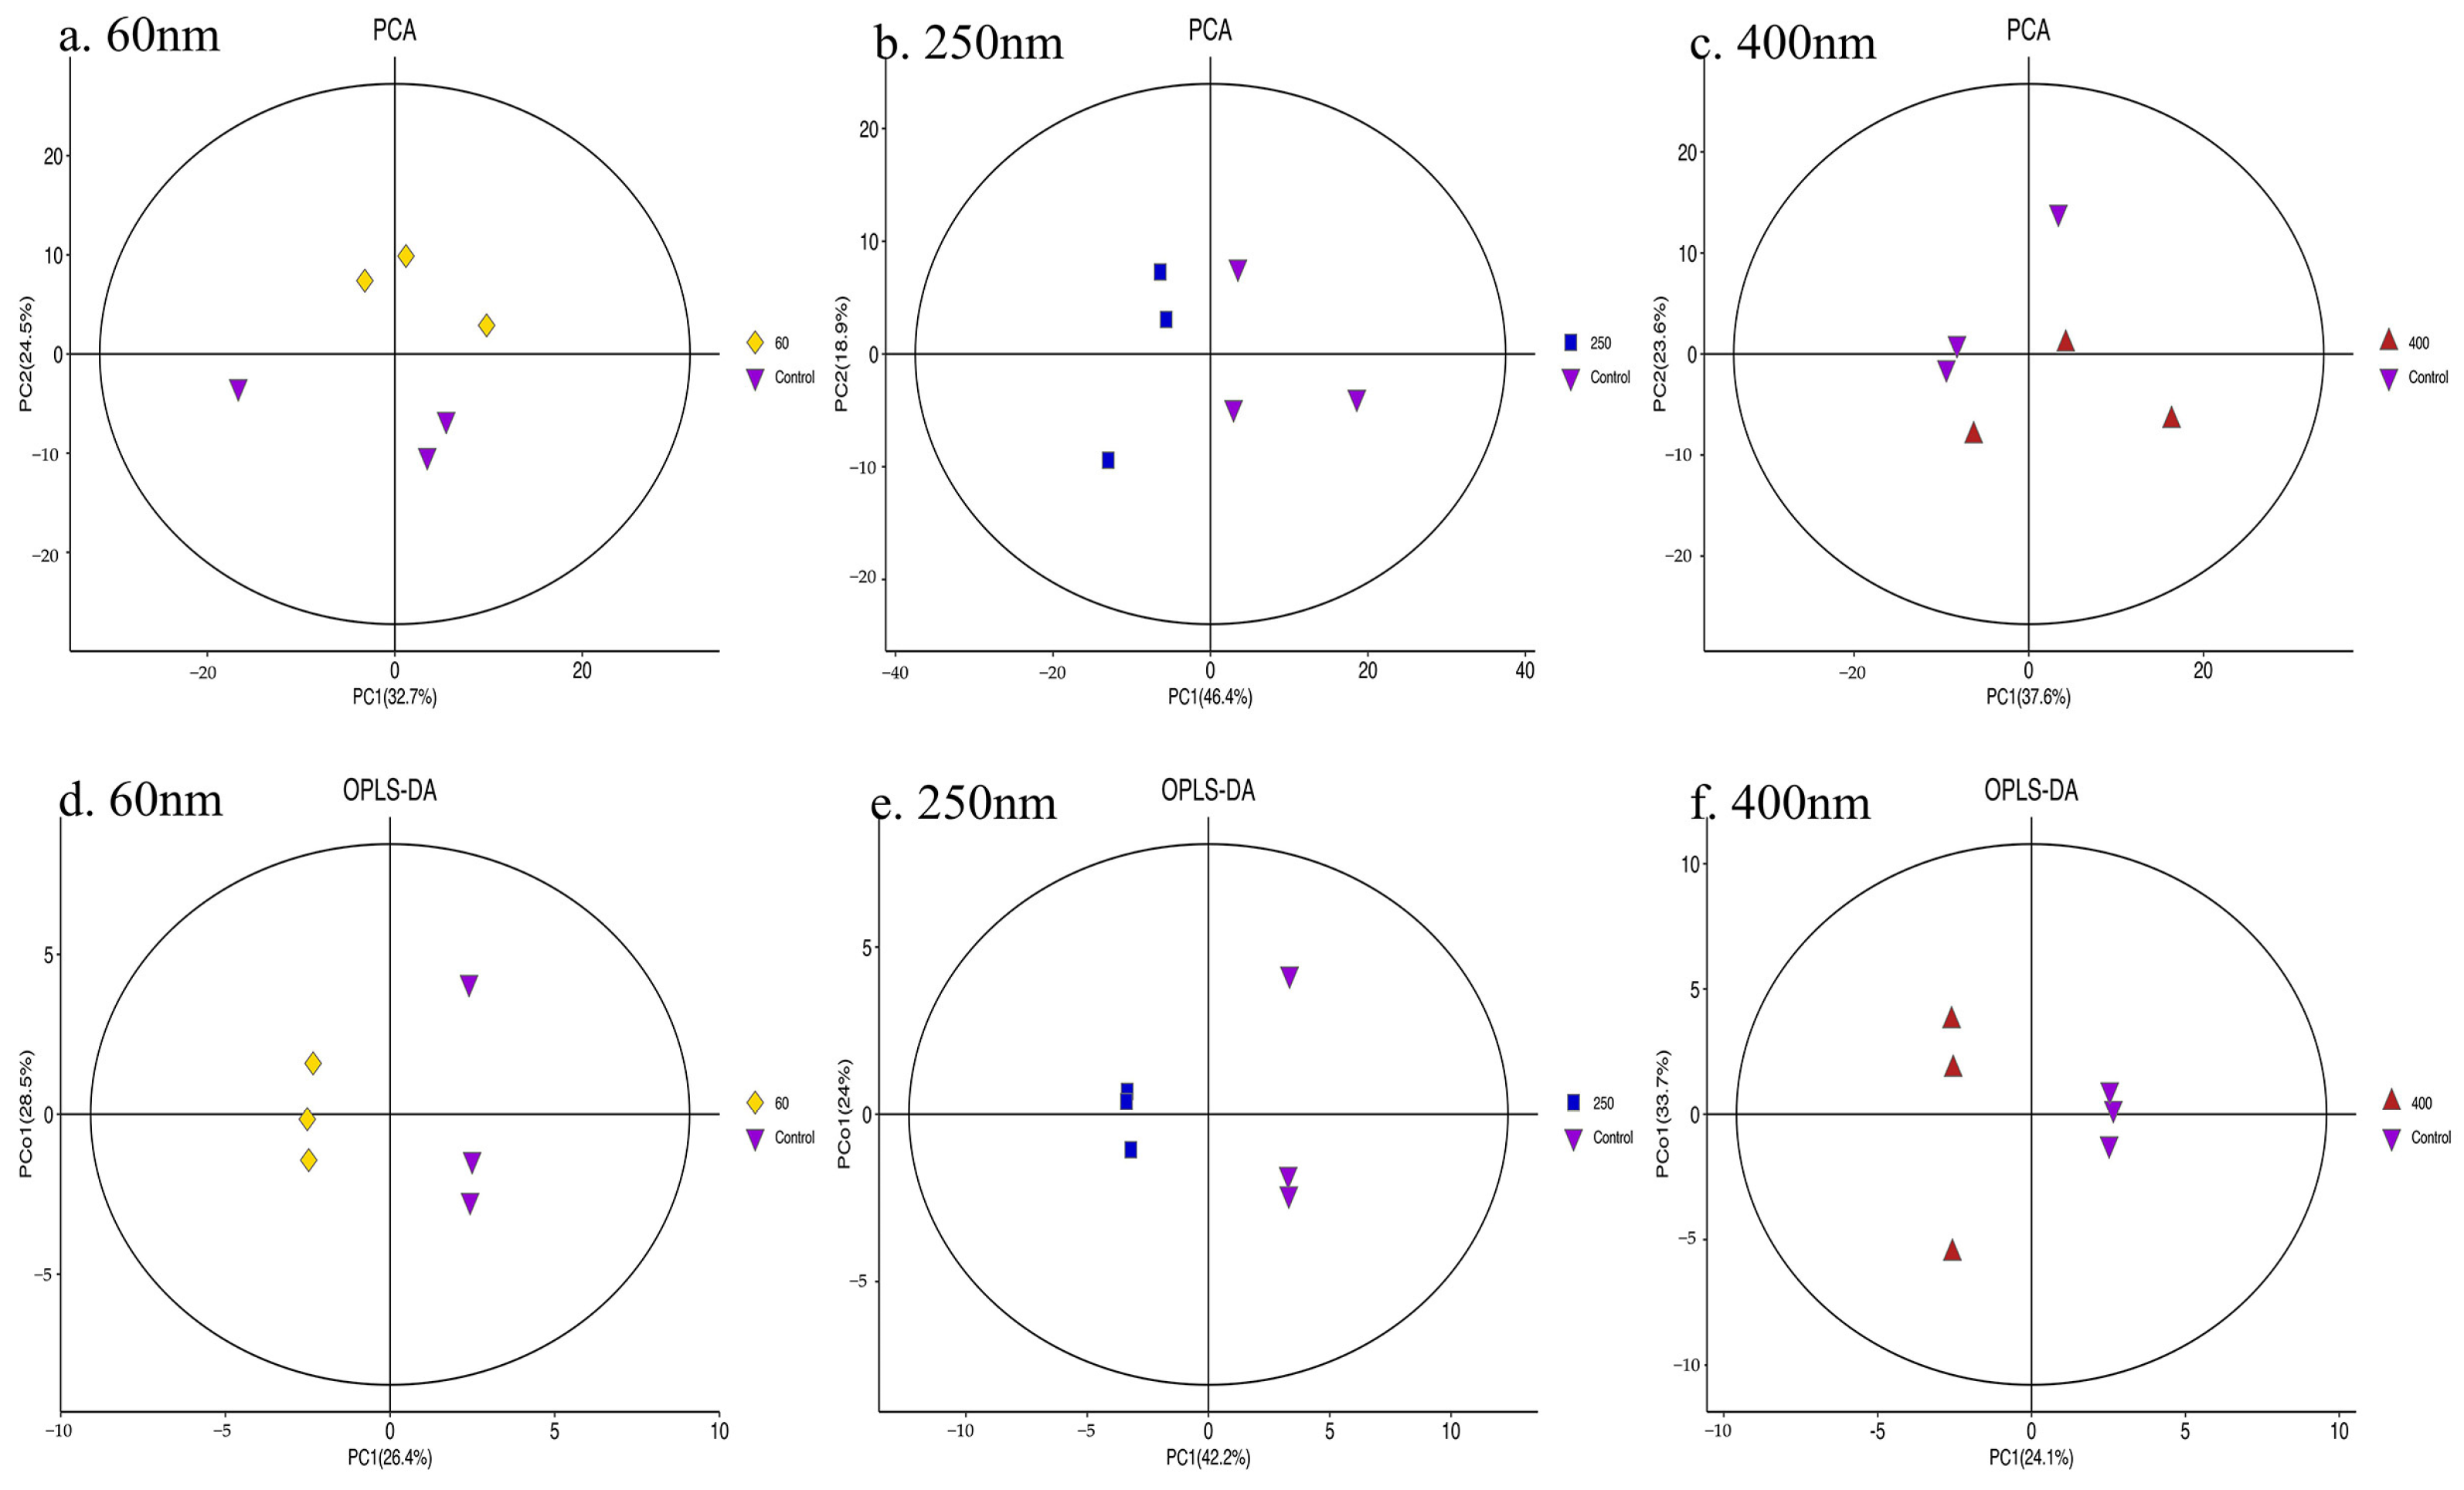
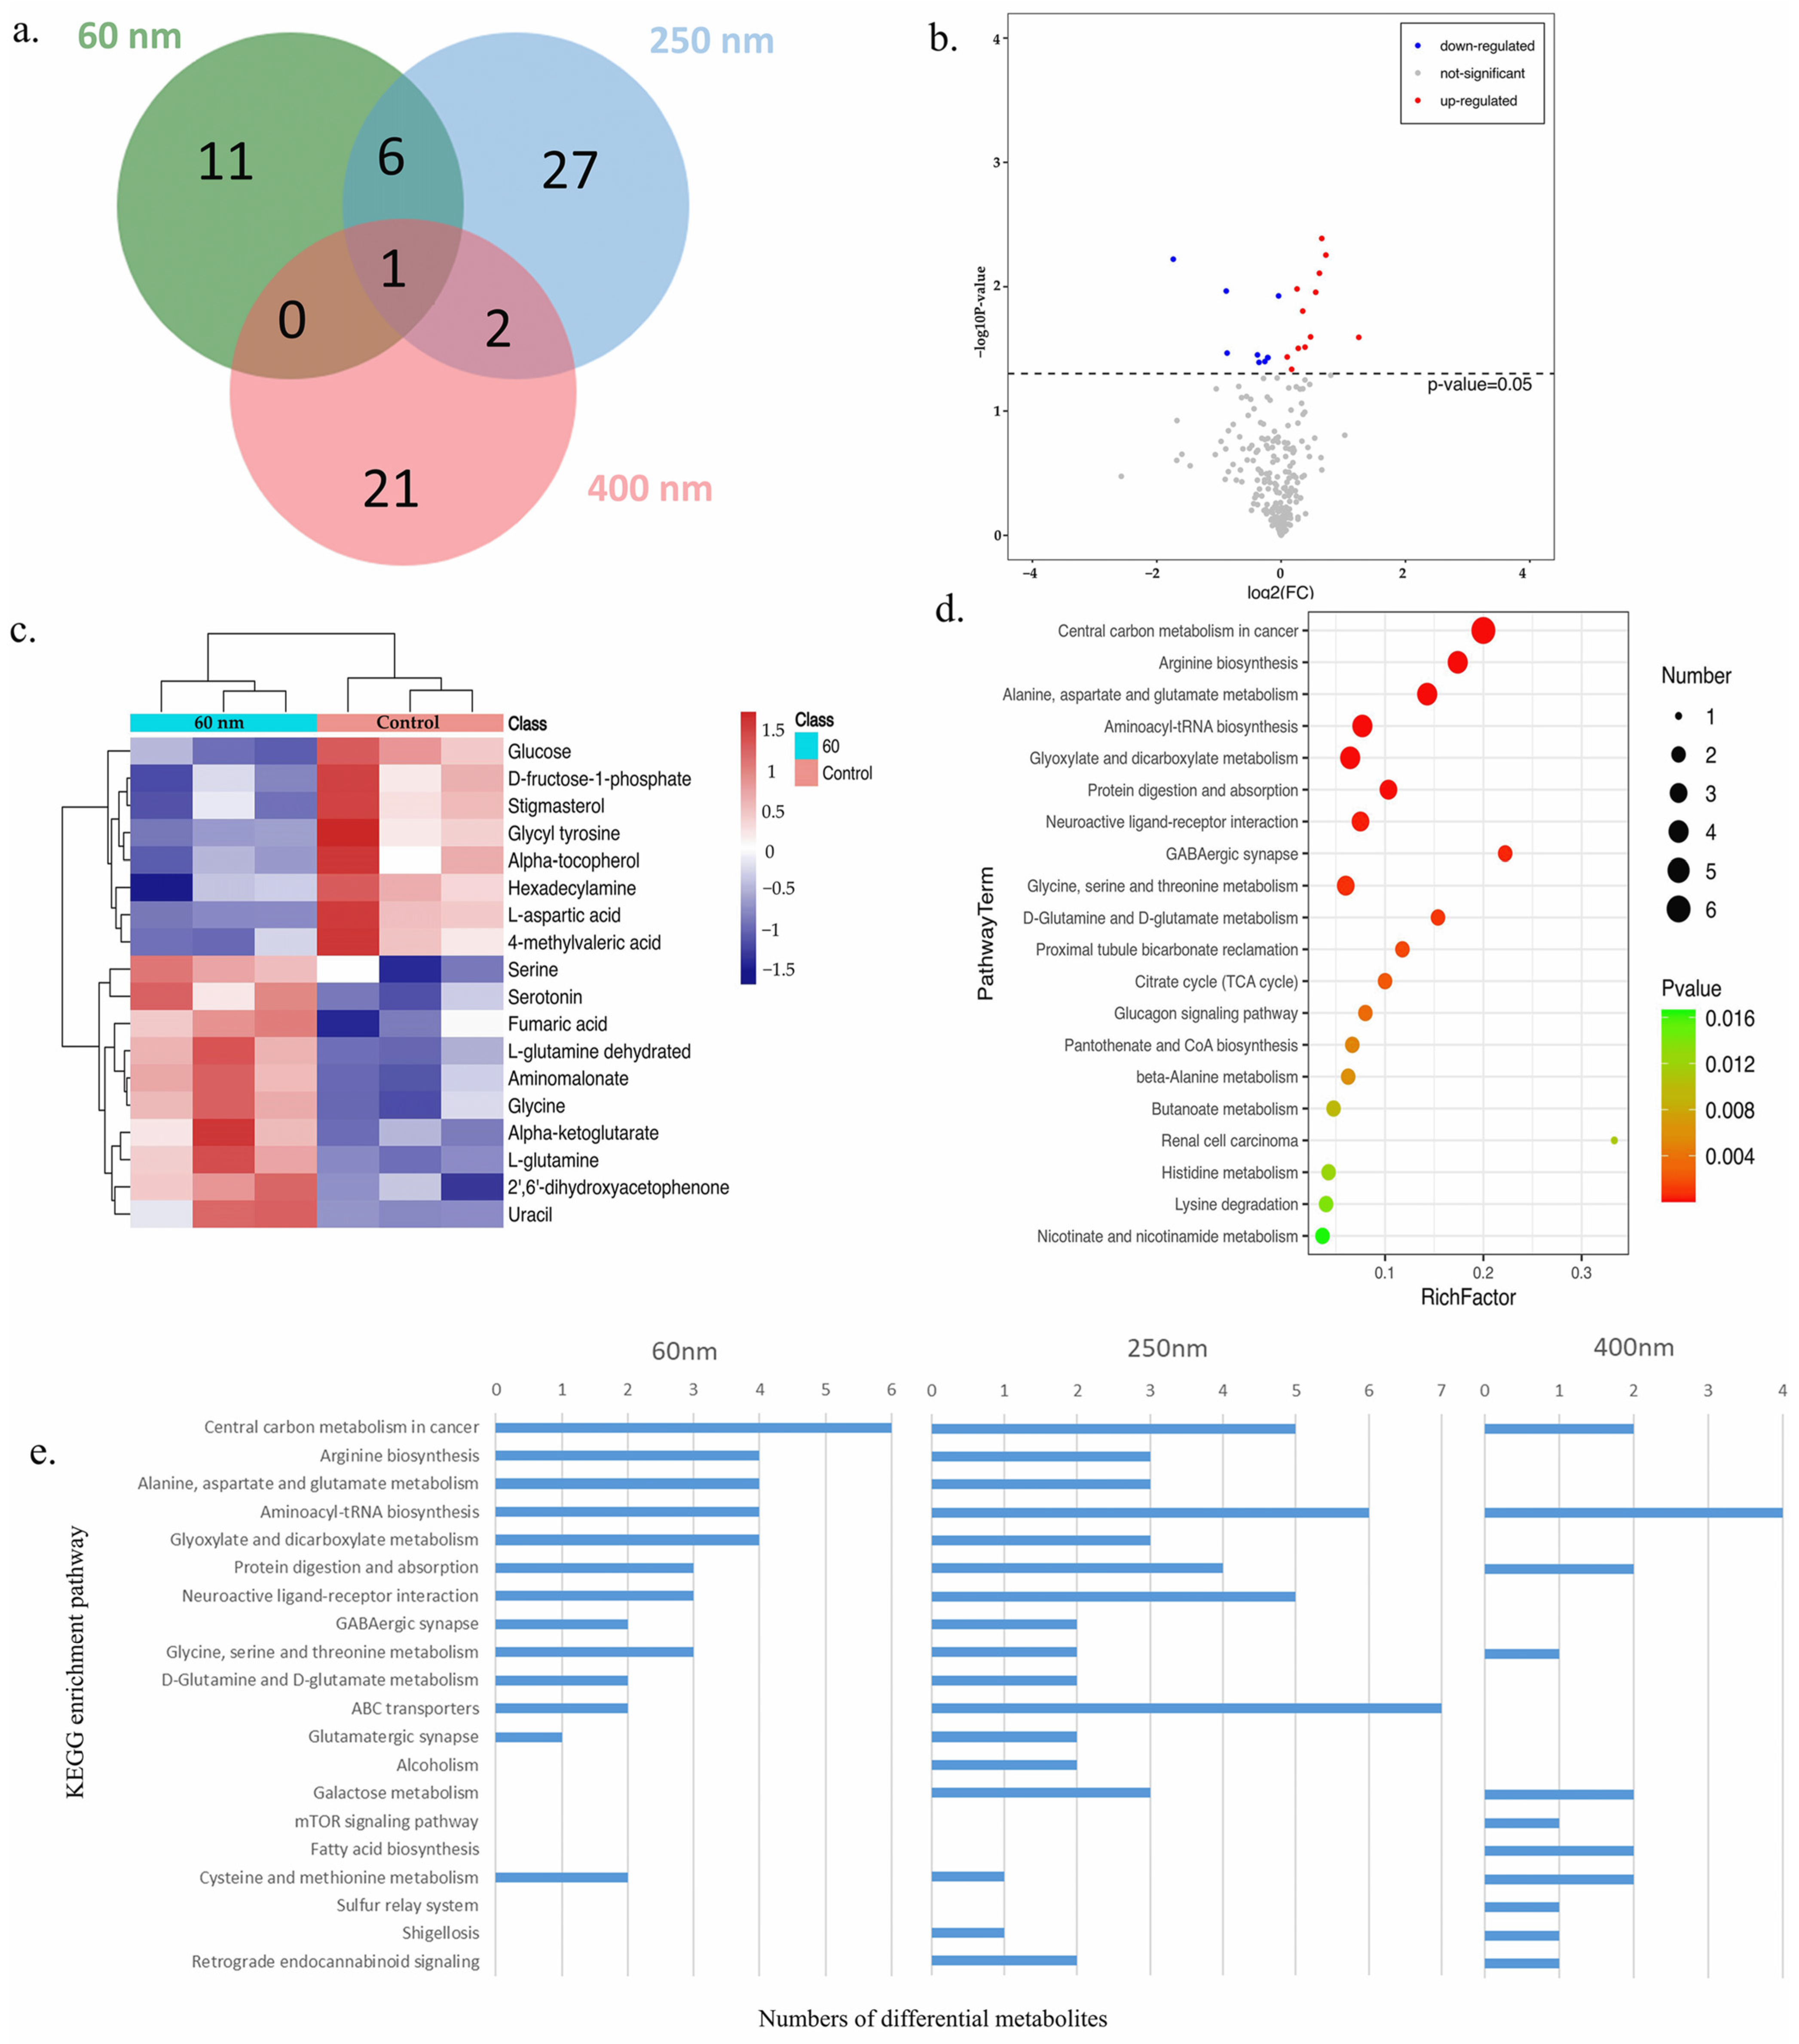
3.4. Metabolomics
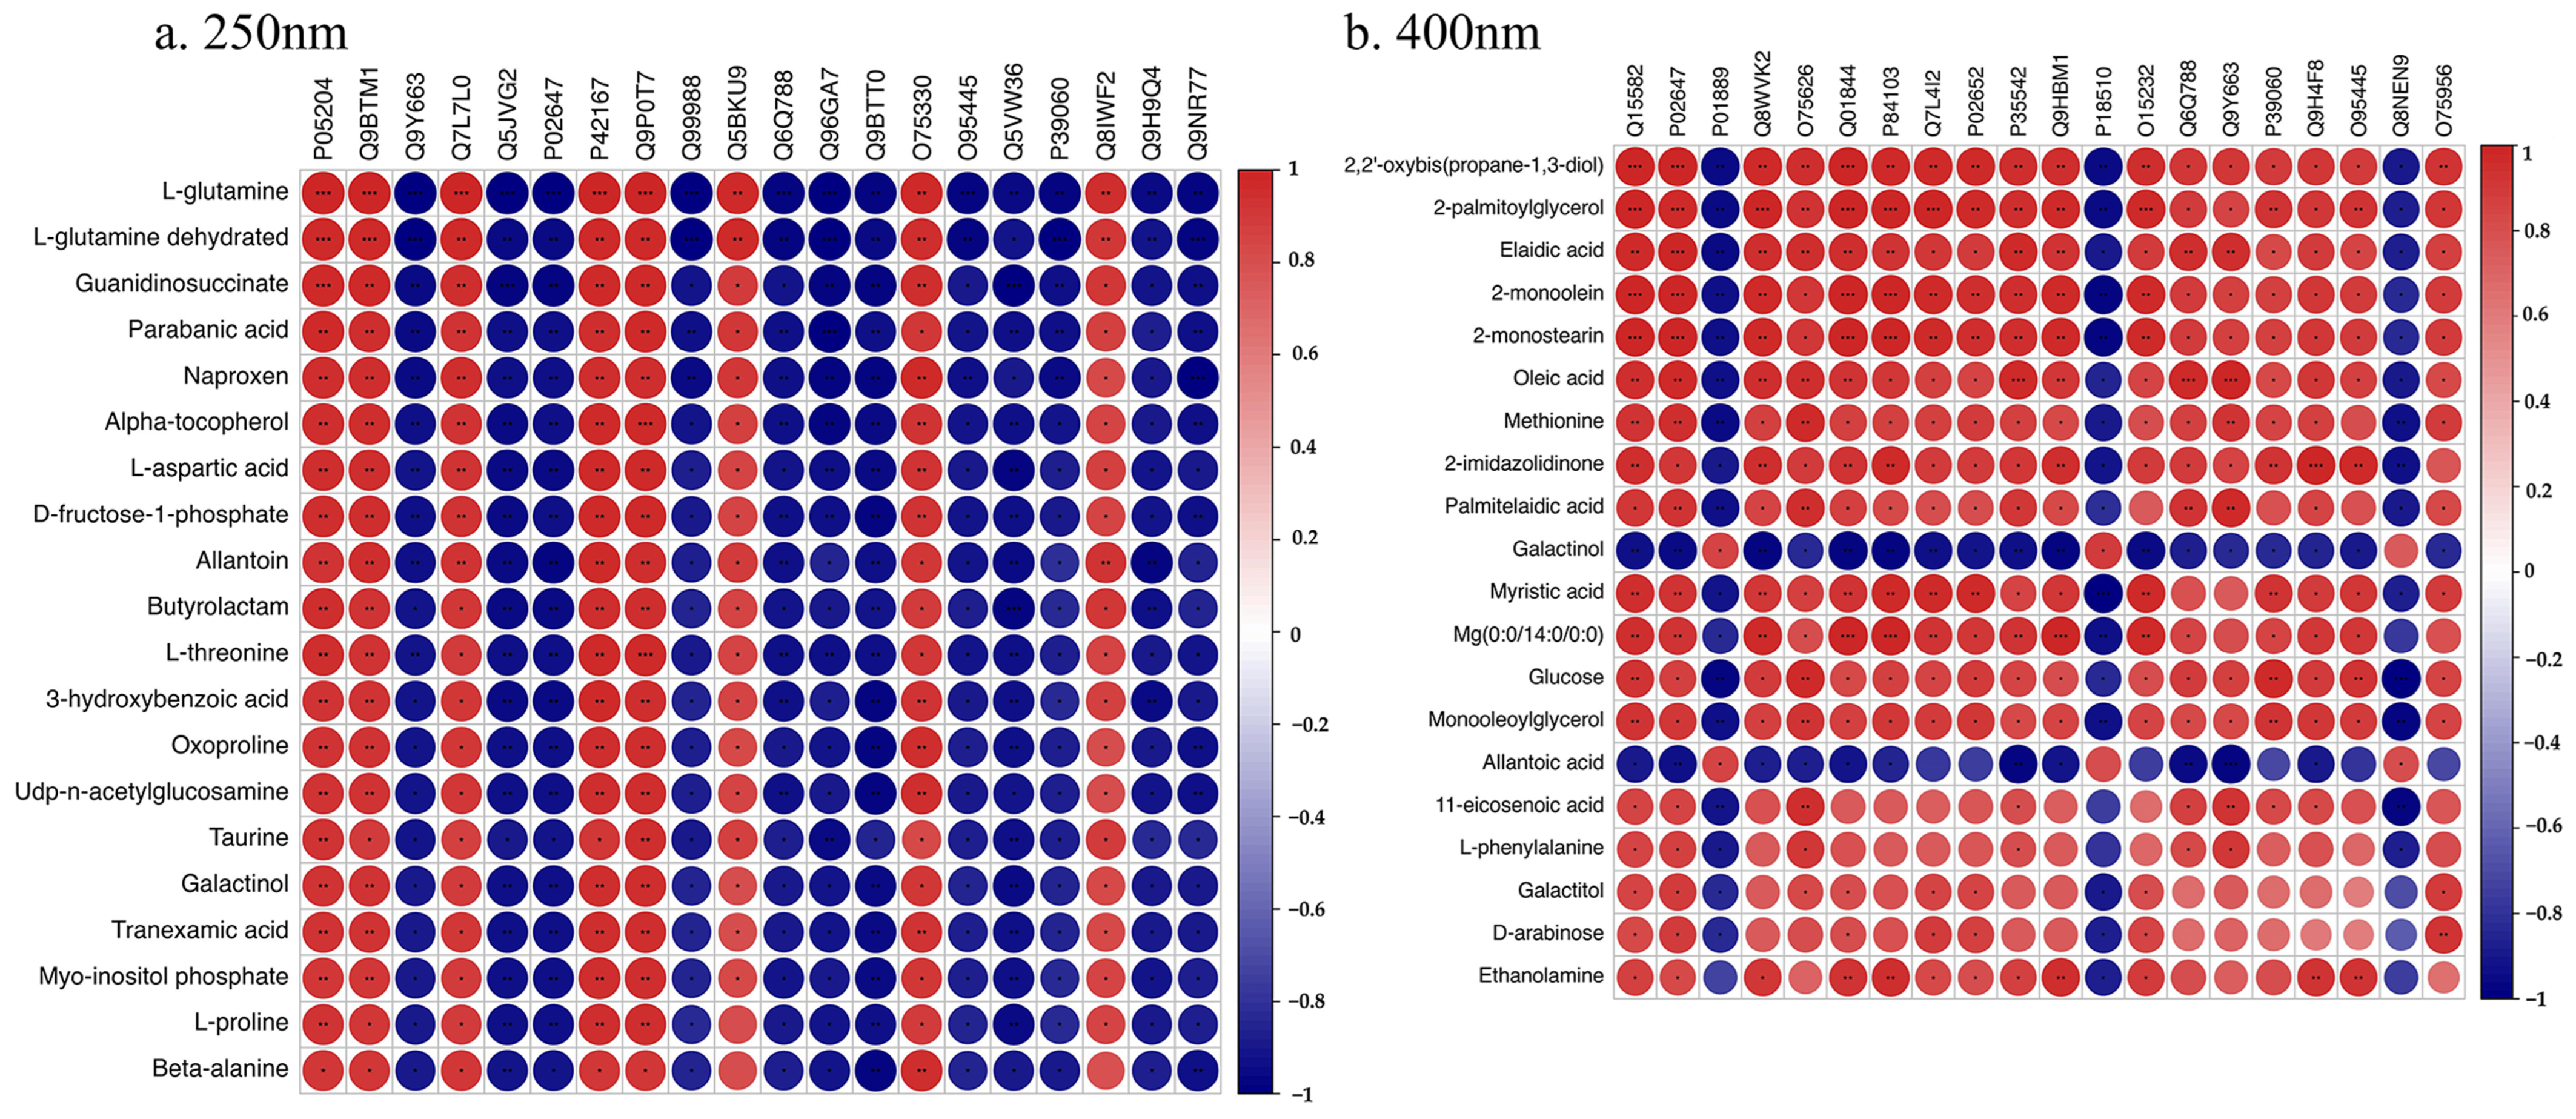
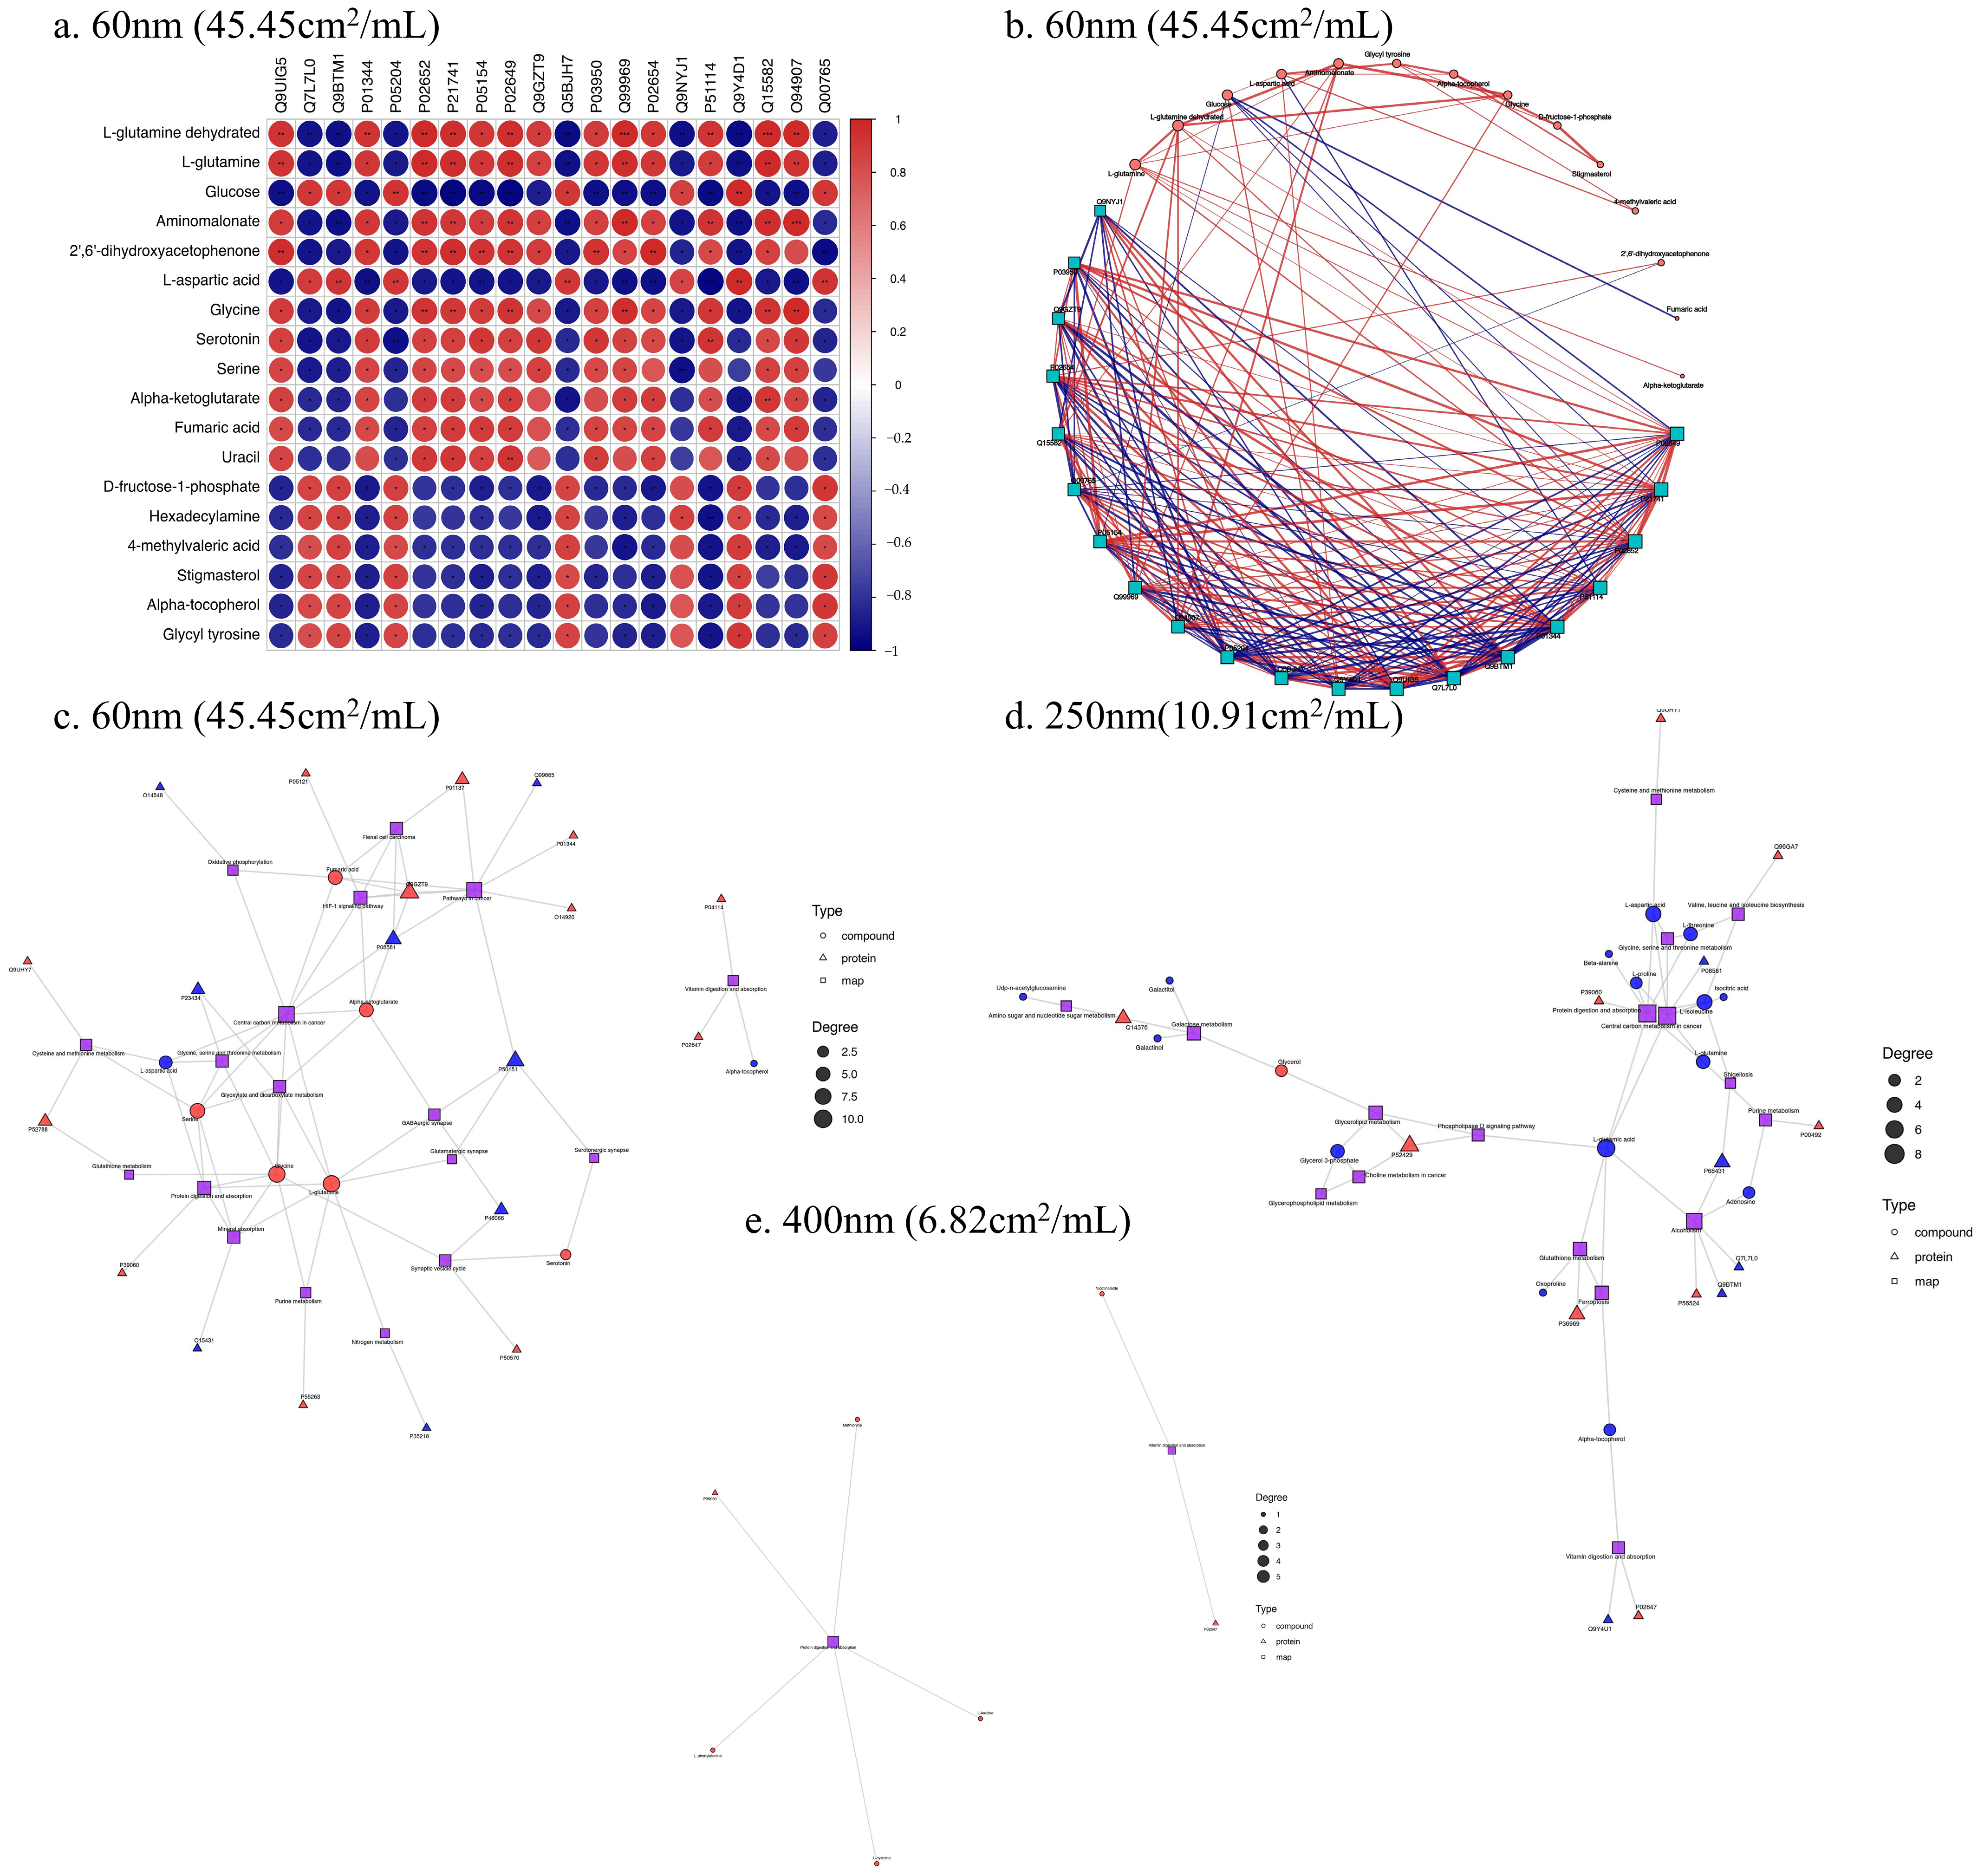
3.5. Correlation Analysis of Proteomics and Metabolomics
4. Discussion
5. Conclusions
Author Contributions
Funding
Institutional Review Board Statement
Informed Consent Statement
Data Availability Statement
Conflicts of Interest
Abbreviations
| SiO2 NPs | Silica nanoparticles |
| HepG2 | Human hepatoma cells |
| WHO | World Health Organization |
| CCK-8 | Cell Counting Kit-8 assay |
| OD | Optical density |
| HPLC-MS | High-pH reverse-phase separation and mass spectrometry |
| GC-MS | Gas chromatography–mass spectrometry |
| PCA | Principal component analysis |
| OPLS-DA | Orthogonal partial least squares analysis |
| KGML | KEGG markup language |
| SD | Standard deviation |
| TEM | Transmission electron microscopy |
| APOA2 | Apolipoprotein A-II |
| MDK | Midkine |
| APOE | Apolipoprotein E |
| EGLN1 | Egl nine homolog 1 |
Appendix A
References
- Arts, J.H.E.; Muijser, H.; Duistermaat, E.; Junker, K.; Kuper, C.F. Five-day inhalation toxicity study of three types of synthetic amorphous silicas in Wistar rats and post-exposure evaluations for up to 3months. Food Chem. Toxicol. 2007, 45, 1856–1867. [Google Scholar] [CrossRef] [PubMed]
- Vance, M.E.; Kuiken, T.; Vejerano, E.P.; McGinnis, S.P.; Hochella, M.F., Jr.; Rejeski, D.; Hull, M.S. Nanotechnology in the real world: Redeveloping the nanomaterial consumer products inventory. Beilstein. J. Nanotechnol. 2015, 6, 1769–1780. [Google Scholar] [CrossRef] [PubMed]
- Dekkers, S.; Krystek, P.; Peters, R.J.; Lankveld, D.P.; Bokkers, B.G.; van Hoeven-Arentzen, P.H.; Bouwmeester, H.; Oomen, A.G. Presence and risks of nanosilica in food products. Nanotoxicology 2011, 5, 393–405. [Google Scholar] [CrossRef]
- Jain, P.; Hassan, N.; Iqbal, Z.; Dilnawaz, F. Mesoporous Silica Nanoparticles: A Versatile Platform for Biomedical Applications. Recent. Pat. Drug Deliv. Formul. 2018, 12, 228–237. [Google Scholar] [CrossRef]
- Wang, Y.; Zhao, Q.; Han, N.; Bai, L.; Li, J.; Liu, J.; Che, E.; Hu, L.; Zhang, Q.; Jiang, T.; et al. Mesoporous silica nanoparticles in drug delivery and biomedical applications. Nanomedicine 2015, 11, 313–327. [Google Scholar] [CrossRef] [PubMed]
- Martin, C.A.; Lin, Z.; Kumar, A.; Dinneen, S.R.; Osgood, R.M., 3rd; Deravi, L.F. Biomimetic Colorants and Coatings Designed with Cephalopod-Inspired Nanocomposites. ACS Appl. Bio Mater. 2021, 4, 507–513. [Google Scholar] [CrossRef]
- Liu, S.; Han, M.Y. Silica-coated metal nanoparticles. Chem. Asian J. 2010, 5, 36–45. [Google Scholar] [CrossRef]
- SCCS; Hoet, P.H. Opinion of the Scientific Committee on Consumer Safety (SCCS)—Revision of the opinion on the safety of the use of Silica, Hydrated Silica, and Silica Surface Modified with Alkyl Silylates (nano form) in cosmetic products. Regul. Toxicol. Pharmacol. 2016, 74, 79–80. [Google Scholar] [CrossRef]
- Tassinari, R.; Martinelli, A.; Valeri, M.; Maranghi, F. Amorphous silica nanoparticles induced spleen and liver toxicity after acute intravenous exposure in male and female rats. Toxicol. Ind. Health 2021, 37, 328–335. [Google Scholar] [CrossRef]
- Bancos, S.; Stevens, D.L.; Tyner, K.M. Effect of silica and gold nanoparticles on macrophage proliferation, activation markers, cytokine production, and phagocytosis in vitro. Int. J. Nanomed. 2015, 10, 183–206. [Google Scholar] [CrossRef]
- Deng, Y.D.; Zhang, X.D.; Yang, X.S.; Huang, Z.L.; Wei, X.; Yang, X.F.; Liao, W.Z. Subacute toxicity of mesoporous silica nanoparticles to the intestinal tract and the underlying mechanism. J. Hazard. Mater. 2021, 409, 124502. [Google Scholar] [CrossRef] [PubMed]
- Inoue, M.; Sakamoto, K.; Suzuki, A.; Nakai, S.; Ando, A.; Shiraki, Y.; Nakahara, Y.; Omura, M.; Enomoto, A.; Nakase, I.; et al. Size and surface modification of silica nanoparticles affect the severity of lung toxicity by modulating endosomal ROS generation in macrophages. Part Fibre Toxicol. 2021, 18, 21. [Google Scholar] [CrossRef]
- Boey, A.; Ho, H.K. All Roads Lead to the Liver: Metal Nanoparticles and Their Implications for Liver Health. Small 2020, 16, 2000153. [Google Scholar] [CrossRef] [PubMed]
- Waegeneers, N.; Brasseur, A.; Van Doren, E.; Van der Heyden, S.; Serreyn, P.J.; Pussemier, L.; Mast, J.; Schneider, Y.J.; Ruttens, A.; Roels, S. Short-term biodistribution and clearance of intravenously administered silica nanoparticles. Toxicol. Rep. 2018, 5, 632–638. [Google Scholar] [CrossRef] [PubMed]
- Lipka, J.; Semmler-Behnke, M.; Sperling, R.A.; Wenk, A.; Takenaka, S.; Schleh, C.; Kissel, T.; Parak, W.J.; Kreyline, W.G. Biodistribution of PEG-modified gold nanoparticles following intratracheal instillation and intravenous injection. Biomaterials 2010, 31, 6574–6581. [Google Scholar] [CrossRef]
- Azouz, R.A.; Korany, R.M.S. Toxic Impacts of Amorphous Silica Nanoparticles on Liver and Kidney of Male Adult Rats: An In Vivo Study. Biol. Trace Elem. Res. 2021, 199, 2653–2662. [Google Scholar] [CrossRef]
- Javdani, H.; Etemad, L.; Moshiri, M.; Zarban, A.; Hanafi-Bojd, M.Y. Effect of tannic acid-templated mesoporous silica nanoparticles on iron-induced oxidative stress and liver toxicity in rats. Toxicol. Rep. 2021, 8, 1721–1728. [Google Scholar] [CrossRef]
- Smulders, S.; Ketkar-Atre, A.; Luyts, K.; Vriens, H.; Nobre, S.D.; Rivard, C.; Van Landuyt, K.; Baken, S.; Smolders, E.; Golanski, L.; et al. Body distribution of SiO2-Fe3O4 core-shell nanoparticles after intravenous injection and intratracheal instillation. Nanotoxicology 2016, 10, 567–574. [Google Scholar] [CrossRef]
- Yu, Y.; Duan, J.; Li, Y.; Li, Y.; Jing, L.; Yang, M.; Wang, J.; Sun, Z. Silica nanoparticles induce liver fibrosis via TGF-β(1)/Smad3 pathway in ICR mice. Int. J. Nanomed. 2017, 12, 6045–6057. [Google Scholar] [CrossRef]
- Mahmoud, A.M.; Desouky, E.M.; Hozayen, W.G.; Bin-Jumah, M.; El-Nahass, E.; Soliman, H.A.; Farghali, A.A. Mesoporous Silica Nanoparticles Trigger Liver and Kidney Injury and Fibrosis Via Altering TLR4/NF-kappa B, JAK2/STAT3 and Nrf2/HO-1 Signaling in Rats. Biomolecules 2019, 9, 528. [Google Scholar] [CrossRef]
- Liu, T.L.; Li, L.L.; Fu, C.H.; Liu, H.Y.; Chen, D.; Tang, F.Q. Pathological mechanisms of liver injury caused by continuous intraperitoneal injection of silica nanoparticles. Biomaterials 2012, 33, 2399–2407. [Google Scholar] [CrossRef] [PubMed]
- Isoda, K.; Tetsuka, E.; Shimizu, Y.; Saitoh, K.; Ishida, I.; Tezuka, M. Liver injury induced by thirty- and fifty-nanometer-diameter silica nanoparticles. Biol. Pharm. Bull. 2013, 36, 370–375. [Google Scholar] [CrossRef]
- Li, Y.; Sun, L.; Jin, M.; Du, Z.; Liu, X.; Guo, C.; Li, Y.; Huang, P.; Sun, Z. Size-dependent cytotoxicity of amorphous silica nanoparticles in human hepatoma HepG2 cells. Toxicol. Vitr. 2011, 25, 1343–1352. [Google Scholar] [CrossRef]
- Sun, L.; Li, Y.; Liu, X.; Jin, M.; Zhang, L.; Du, Z.; Guo, C.; Huang, P.; Sun, Z. Cytotoxicity and mitochondrial damage caused by silica nanoparticles. Toxicol. Vitr. 2011, 25, 1619–1629. [Google Scholar] [CrossRef]
- Lu, X.; Qian, J.; Zhou, H.; Gan, Q.; Tang, W.; Lu, J.; Yuan, Y.; Liu, C. In vitro cytotoxicity and induction of apoptosis by silica nanoparticles in human HepG2 hepatoma cells. Int. J. Nanomed. 2011, 6, 1889–1901. [Google Scholar] [CrossRef]
- Yang, H.; Wu, Q.Y.; Lao, C.S.; Li, M.Y.; Gao, Y.; Zheng, Y.; Shi, B. Cytotoxicity and DNA damage in mouse macrophages exposed to silica nanoparticles. Genet. Mol. Res. 2016, 15, 15039005. [Google Scholar] [CrossRef]
- Ahamed, M.; Akhtar, M.J.; Alhadlaq, H.A. Influence of silica nanoparticles on cadmium-induced cytotoxicity, oxidative stress, and apoptosis in human liver HepG2 cells. Environ. Toxicol. 2020, 35, 599–608. [Google Scholar] [CrossRef] [PubMed]
- de Oliveira, A.L.; Miranda, R.G.; Dorta, D.J. Recreational MDMA doses do not elicit hepatotoxicity in HepG2 spheroids under normo- and hyperthermia. Toxicology 2024, 503, 153761. [Google Scholar] [CrossRef]
- He, J.; Liu, H.; Li, Z.; Xu, M.; Zhang, Y.; Jiang, T.; Mo, L. Integrated transcriptomic and metabolomic analysis of the hepatotoxicity of dichloroacetonitrile. Sci. Total Environ. 2024, 927, 172237. [Google Scholar] [CrossRef]
- Lu, J.; Yang, Y.; Zhu, L.; Li, M.; Xu, W.; Zhang, C.; Cheng, J.; Tao, L.; Li, Z.; Zhang, Y. Exposure to environmental concentrations of natural pyrethrins induces hepatotoxicity: Assessment in HepG2 cell lines and zebrafish models. Chemosphere 2022, 288, 132565. [Google Scholar] [CrossRef]
- Lv, H.; Hong, L.; Tian, Y.; Yin, C.; Zhu, C.; Feng, H. Corilagin alleviates acetaminophen-induced hepatotoxicity via enhancing the AMPK/GSK3β-Nrf2 signaling pathway. Cell Commun. Signal 2019, 17, 2. [Google Scholar] [CrossRef] [PubMed]
- Yao, Q.Q.; Li, L.; Xu, M.C.; Hu, H.H.; Zhou, H.; Yu, L.S.; Zeng, S. The metabolism and hepatotoxicity of ginkgolic acid (17:1) in vitro. Chin. J. Nat. Med. 2018, 16, 829–837. [Google Scholar] [CrossRef] [PubMed]
- Johnson, C.H.; Ivanisevic, J.; Siuzdak, G. Metabolomics: Beyond biomarkers and towards mechanisms. Nat. Rev. Mol. Cell Biol. 2016, 17, 451–459. [Google Scholar] [CrossRef]
- Wei, S.; Wei, Y.; Gong, Y.; Chen, Y.; Cui, J.; Li, L.; Yan, H.; Yu, Y.; Lin, X.; Li, G.; et al. Metabolomics as a valid analytical technique in environmental exposure research: Application and progress. Metabolomics Off. J. Metabolomic Soc. 2022, 18, 35. [Google Scholar] [CrossRef]
- Matysiak, M.; Kapka-Skrzypczak, L.; Brzóska, K.; Gutleb, A.C.; Kruszewski, M. Proteomic approach to nanotoxicity. J. Proteom. 2016, 137, 35–44. [Google Scholar] [CrossRef]
- Gallud, A.; Delaval, M.; Kinaret, P.; Marwah, V.S.; Fortino, V.; Ytterberg, J.; Zubarev, R.; Skoog, T.; Kere, J.; Correia, M.; et al. Multiparametric Profiling of Engineered Nanomaterials: Unmasking the Surface Coating Effect. Adv. Sci. 2020, 7, 2002221. [Google Scholar] [CrossRef]
- Gioria, S.; Lobo Vicente, J.; Barboro, P.; La Spina, R.; Tomasi, G.; Urbán, P.; Kinsner-Ovaskainen, A.; François, R.; Chassaigne, H. A combined proteomics and metabolomics approach to assess the effects of gold nanoparticles in vitro. Nanotoxicology 2016, 10, 736–748. [Google Scholar] [CrossRef]
- Cui, L.; Wang, X.; Sun, B.B.; Xia, T.; Hu, S. Predictive Metabolomic Signatures for Safety Assessment of Metal Oxide Nanoparticles. Acs Nano 2019, 13, 13065–13082. [Google Scholar] [CrossRef]
- Vulimiri, S.V.; Sonawane, B.R.; Szabo, D.T. Systems biology application in toxicology. In Encyclopedia of Toxicology, 3rd ed.; Wexler, P., Ed.; Academic Press: Oxford, UK, 2014; pp. 454–458. [Google Scholar] [CrossRef]
- Fiehn, O. Metabolomics—The link between genotypes and phenotypes. Plant Mol. Biol. 2002, 48, 155–171. [Google Scholar]
- Kim, W.; Kim, W.K.; Lee, K.; Son, M.J.; Kwak, M.; Chang, W.S.; Min, J.K.; Song, N.W.; Lee, J.; Bae, K.H. A reliable approach for assessing size-dependent effects of silica nanoparticles on cellular internalization behavior and cytotoxic mechanisms. Int. J. Nanomed. 2019, 14, 7375–7387. [Google Scholar] [CrossRef]
- Nabeshi, H.; Yoshikawa, T.; Matsuyama, K.; Nakazato, Y.; Arimori, A.; Isobe, M.; Tochigi, S.; Kondoh, S.; Hirai, T.; Akase, T.; et al. Size-dependent cytotoxic effects of amorphous silica nanoparticles on Langerhans cells. Pharmazie 2010, 65, 199–201. [Google Scholar] [PubMed]
- Demir, E.; Aksakal, S.; Turna, F.; Kaya, B.; Marcos, R. In vivo genotoxic effects of four different nano-sizes forms of silica nanoparticles in Drosophila melanogaster. J. Hazard. Mater. 2015, 283, 260–266. [Google Scholar] [CrossRef] [PubMed]
- Bannuscher, A.; Karkossa, I.; Buhs, S.; Nollau, P.; Kettler, K.; Balas, M.; Dinischiotu, A.; Hellack, B.; Wiemann, M.; Luch, A.; et al. A multi-omics approach reveals mechanisms of nanomaterial toxicity and structure-activity relationships in alveolar macrophages. Nanotoxicology 2020, 14, 181–195. [Google Scholar] [CrossRef] [PubMed]
- Karkossa, I.; Bannuscher, A.; Hellack, B.; Bahl, A.; Buhs, S.; Nollau, P.; Luch, A.; Schubert, K.; von Bergen, M.; Haase, A. An in-depth multi-omics analysis in RLE-6TN rat alveolar epithelial cells allows for nanomaterial categorization. Part. Fibre Toxicol. 2019, 16, 38. [Google Scholar] [CrossRef]
- Oberdörster, G.; Oberdörster, E.; Oberdörster, J. Nanotoxicology: An emerging discipline evolving from studies of ultrafine particles. Environ. Health Perspect. 2005, 113, 823–839. [Google Scholar] [CrossRef]
- Waters, K.M.; Masiello, L.M.; Zangar, R.C.; Tarasevich, B.J.; Karin, N.J.; Quesenberry, R.D.; Bandyopadhyay, S.; Teeguarden, J.G.; Pounds, J.G.; Thrall, B.D. Macrophage responses to silica nanoparticles are highly conserved across particle sizes. Toxicol. Sci. Off. J. Soc. Toxicol. 2009, 107, 553–569. [Google Scholar] [CrossRef]
- Duan, J.; Liang, S.; Feng, L.; Yu, Y.; Sun, Z. Silica nanoparticles trigger hepatic lipid-metabolism disorder in vivo and in vitro. Int. J. Nanomed. 2018, 13, 7303–7318. [Google Scholar] [CrossRef]
- Chatterjee, N.; Yang, J.; Atluri, R.; Lee, W.; Hong, J.; Choi, J. Amorphous silica nanoparticle-induced perturbation of cholesterol homeostasis as a function of surface area highlights safe-by-design implementation: An integrated multi-OMICS analysis. RSC Adv. 2016, 6, 68606–68614. [Google Scholar] [CrossRef]
- Willeit, P.; Skroblin, P.; Kiechl, S.; Fernandez-Hernando, C.; Mayr, M. Liver microRNAs: Potential mediators and biomarkers for metabolic and cardiovascular disease? Eur. Heart J. 2016, 37, 3260–3266. [Google Scholar] [CrossRef]
- Sun, M.Q.; Zhang, J.Y.; Liang, S.; Du, Z.; Liu, J.Y.; Sun, Z.W.; Duan, J.C. Metabolomic characteristics of hepatotoxicity in rats induced by silica nanoparticles. Ecotox Environ. Safe 2021, 208, 111496. [Google Scholar] [CrossRef]
- Chatterjee, N.; Jeong, J.; Yoon, D.; Kim, S.; Choi, J. Global metabolomics approach in in vitro and in vivo models reveals hepatic glutathione depletion induced by amorphous silica nanoparticles. Chem.-Biol. Interact. 2018, 293, 100–106. [Google Scholar] [CrossRef]
- Petersen, M.C.; Vatner, D.F.; Shulman, G.I. Regulation of hepatic glucose metabolism in health and disease. Nat. Rev. Endocrinol. 2017, 13, 572–587. [Google Scholar] [CrossRef] [PubMed]
- Bonora, M.; Patergnani, S.; Rimessi, A.; De Marchi, E.; Suski, J.M.; Bononi, A.; Giorgi, C.; Marchi, S.; Missiroli, S.; Poletti, F.; et al. ATP synthesis and storage. Purinergic Signal 2012, 8, 343–357. [Google Scholar] [CrossRef]
- King, A.; Selak, M.A.; Gottlieb, E. Succinate dehydrogenase and fumarate hydratase: Linking mitochondrial dysfunction and cancer. Oncogene 2006, 25, 4675–4682. [Google Scholar] [CrossRef] [PubMed]
- Moffatt, B.A.; Ashihara, H. Purine and pyrimidine nucleotide synthesis and metabolism. Arab. Book 2002, 1, e0018. [Google Scholar] [CrossRef]
- DeBerardinis, R.J.; Mancuso, A.; Daikhin, E.; Nissim, I.; Yudkoff, M.; Wehrli, S.; Thompson, C.B. Beyond aerobic glycolysis: Transformed cells can engage in glutamine metabolism that exceeds the requirement for protein and nucleotide synthesis. Proc. Natl. Acad. Sci. USA 2007, 104, 19345–19350. [Google Scholar] [CrossRef] [PubMed]
- Ducker, G.S.; Rabinowitz, J.D. One-Carbon Metabolism in Health and Disease. Cell Metab. 2017, 25, 27–42. [Google Scholar] [CrossRef]
- Meiser, J.; Vazquez, A. Give it or take it: The flux of one-carbon in cancer cells. FEBS J. 2016, 283, 3695–3704. [Google Scholar] [CrossRef]
- Varahan, S.; Sinha, V.; Walvekar, A.; Krishna, S.; Laxman, S. Resource plasticity-driven carbon-nitrogen budgeting enables specialization and division of labor in a clonal community. eLife 2020, 9, e57609. [Google Scholar] [CrossRef]
- Zhu, Y.; Zhang, Y.; Li, Y.; Guo, C.; Fan, Z.; Li, Y.; Yang, M.; Zhou, X.; Sun, Z.; Wang, J. Integrative proteomics and metabolomics approach to elucidate metabolic dysfunction induced by silica nanoparticles in hepatocytes. J. Hazard. Mater. 2022, 434, 128820. [Google Scholar] [CrossRef]
- van Ravenzwaay, B.; Montoya, G.A.; Fabian, E.; Herold, M.; Krennrich, G.; Looser, R.; Mellert, W.; Peter, E.; Strauss, V.; Walk, T.; et al. The sensitivity of metabolomics versus classical regulatory toxicology from a NOAEL perspective. Toxicol. Lett. 2014, 227, 20–28. [Google Scholar] [CrossRef] [PubMed]
Disclaimer/Publisher’s Note: The statements, opinions and data contained in all publications are solely those of the individual author(s) and contributor(s) and not of MDPI and/or the editor(s). MDPI and/or the editor(s) disclaim responsibility for any injury to people or property resulting from any ideas, methods, instructions or products referred to in the content. |
© 2025 by the authors. Licensee MDPI, Basel, Switzerland. This article is an open access article distributed under the terms and conditions of the Creative Commons Attribution (CC BY) license (https://creativecommons.org/licenses/by/4.0/).
Share and Cite
Shi, J.; Zhang, H.; Zhang, Y.; Ma, Y.; Yu, N.; Liu, W.; Liu, Y.; Nie, J.; Chen, Z.; Jia, G. Size-Dependent Cytotoxicity and Multi-Omic Changes Induced by Amorphous Silicon Nanoparticles in HepG2 Cells. Toxics 2025, 13, 232. https://doi.org/10.3390/toxics13040232
Shi J, Zhang H, Zhang Y, Ma Y, Yu N, Liu W, Liu Y, Nie J, Chen Z, Jia G. Size-Dependent Cytotoxicity and Multi-Omic Changes Induced by Amorphous Silicon Nanoparticles in HepG2 Cells. Toxics. 2025; 13(4):232. https://doi.org/10.3390/toxics13040232
Chicago/Turabian StyleShi, Jiaqi, Huifang Zhang, Yi Zhang, Ying Ma, Nairui Yu, Wenhao Liu, Ying Liu, Jisheng Nie, Zhangjian Chen, and Guang Jia. 2025. "Size-Dependent Cytotoxicity and Multi-Omic Changes Induced by Amorphous Silicon Nanoparticles in HepG2 Cells" Toxics 13, no. 4: 232. https://doi.org/10.3390/toxics13040232
APA StyleShi, J., Zhang, H., Zhang, Y., Ma, Y., Yu, N., Liu, W., Liu, Y., Nie, J., Chen, Z., & Jia, G. (2025). Size-Dependent Cytotoxicity and Multi-Omic Changes Induced by Amorphous Silicon Nanoparticles in HepG2 Cells. Toxics, 13(4), 232. https://doi.org/10.3390/toxics13040232