Article

Deep Learning-Based Automatic Duckweed Counting Using StarDist and Its Application on Measuring Growth Inhibition Potential of Rare Earth Elements as Contaminants of Emerging Concerns

1
Department of Chemistry, Chung Yuan Christian University, Chung-Li 32023, Taiwan
2
Department of Bioscience Technology, Chung Yuan Christian University, Chung-Li 32023, Taiwan
3
Department of Biotechnology, College of Life Science, Kaohsiung Medical University, Kaohsiung City 80708, Taiwan
4
Drug Development & Value Creation Research Center, Kaohsiung Medical University, Kaohsiung City 80708, Taiwan
5
Department of Chemical Engineering & Institute of Biotechnology and Chemical Engineering, I-Shou University, Da-Shu, Kaohsiung City 84001, Taiwan
6
Faculty of Pharmacy, The Graduate School, University of Santo Tomas, Manila 1008, Philippines
7
Department of Biological Sciences and Technology, National University of Tainan, Tainan 70005, Taiwan
8
Center for Nanotechnology, Chung Yuan Christian University, Chung-Li 32023, Taiwan
9
Research Center for Aquatic Toxicology and Pharmacology, Chung Yuan Christian University, Chung-Li 32023, Taiwan
*
Authors to whom correspondence should be addressed.
Toxics 2023, 11(8), 680; https://doi.org/10.3390/toxics11080680
Submission received: 15 July 2023 / Revised: 3 August 2023 / Accepted: 6 August 2023 / Published: 8 August 2023

Abstract

:
In recent years, there have been efforts to utilize surface water as a power source, material, and food. However, these efforts are impeded due to the vast amounts of contaminants and emerging contaminants introduced by anthropogenic activities. Herbicides such as Glyphosate and Glufosinate are commonly known to contaminate surface water through agricultural industries. In contrast, some emerging contaminants, such as rare earth elements, have started to enter the surface water from the production and waste of electronic products. Duckweeds are angiosperms from the Lemnaceae family and have been used for toxicity tests in aquatic environments, mainly those from the genus Lemna, and have been approved by OECD. In this study, we used duckweed from the genus Wolffia, which is smaller and considered a good indicator of metal pollutants in the aquatic environment. The growth rate of duckweed is the most common endpoint in observing pollutant toxicity. In order to observe and mark the fronds automatically, we used StarDist, a machine learning-based tool. StarDist is available as a plugin in ImageJ, simplifying and assisting the counting process. Python also helps arrange, manage, and calculate the inhibition percentage after duckweeds are exposed to contaminants. The toxicity test results showed Dysprosium to be the most toxic, with an IC50 value of 14.6 ppm, and Samarium as the least toxic, with an IC50 value of 279.4 ppm. In summary, we can provide a workflow for automatic frond counting using StarDist integrated with ImageJ and Python to simplify the detection, counting, data management, and calculation process.

1. Introduction

In recent years there have been efforts to use oceans and seas as a source of energy, raw materials, and food. However, these areas are prone to contaminants exposure which attracted public attention. The most common source of these contaminants comes from anthropogenic activities. It can be introduced through rivers, direct discharges, or atmospheric deposition [1]. One of the most common pollutants is herbicides. Herbicides target duckweed species that have detrimental effects on crops specifically. In contrast, some of them are even used illegally to control algae in aquatic environments [2]. The reliance on herbicides induces the emergence of herbicide-resistant biotypes while polluting the environment and threatening the health of aquatic organisms [3]. The result of previous studies showed that exposure to both herbicides to zebrafish showed an increase in ROS levels, morphological alteration, and behavioral changes in both larvae and adult stages of zebrafish [4,5]. Recent studies classified rare earth elements (REE) as emerging contaminants (EC). They are metals found in group IIIB in the periodic table. It has similar physical and chemical properties; therefore, it is widely used in industrial products, mainly electricals (such as television, phone, and laptop). They have been introduced to marine systems but are often overlooked due to a poor understanding of their toxic effects and low detection limit. While the toxicity of REEs has been previously shown on zebrafish larvae, a limited understanding of each element was still present [6].
Lemnaceae comprises the world’s smallest angiosperms, duckweeds [7], and monocotyledonous water plants [8,9]. Lemnaceae includes five aquatic genera, Spirodela, Wolffia, Wolffiela, Lemna, and Landottia, primarily used for toxicity testing in aquatic waterbodies. The scientific literature reveals that most of all, i.e., 95% of toxicity tests are performed on species from the genus Lemna [10]. Duckweeds are the earth’s tiniest angiosperms [11].
The small size, rapid reproduction, fast growth [12], and high metal and nutrient accumulation have triggered metal tolerance for duckweed species. Furthermore, it has also been reported that metal tolerance varies with water environmental conditions (i.e., temperature, pH, metal concentration, and electrical conductivity) [7,13]. Duckweeds are regarded as ideal organisms for experimentation in many different disciplines of plant sciences, i.e., toxicology, physiology, and ecology [14]. Almost all genera have been stated to have phytoremediation potential [15]. The properties of small size, fast growth rate, rapid reproduction, easy maintenance in the lab environment, and visual observation make duckweed potential source for research in several different disciplines such as wastewater treatment, ecotoxicity analysis, generating clean, renewable, ecofriendly energy [13,16]. Duckweeds are used as test organisms in ecotoxicological testing for detecting metals in wastewater/surface waters because of their hyperaccumulation potential, fast vegetative propagation, and short lifespan [17]. In aquatic environments such as rivers, lakes, and groundwater, duckweed toxicity tests are highly versatile as they help detect complex effluents and single chemical compounds from industrial or community waste in the form of inorganic or organic compounds [18,19,20,21]. In addition, Lemna species are also used in large-scale experiments worldwide due to their relevance as primary producers and major food sources for water/aquatic species such as small invertebrates and fish and a swarm for other small organisms [10].
The Wolffia species has been used as a food source in Asian countries. Wolffia globosa is rootless duckweed and a good indicator of metal pollution in water bodies [22]. It has been recorded as the world’s fastest-growing plant, capable of doubling its number as early as 1–2 days in optimal conditions. These tiny plants can grow optimally at 20–30 °C while also growing in cold conditions at lower temperatures of 1–3 °C; however, serious implications have been observed at high temperature ranges from 35–40 °C. Moreover, duckweeds have been shown to withstand a varied range of pH 3.0–10.0 with optimum growth in medium with pH 5.0–7.0.
The current method for duckweed frond quantification mainly revolves around manual counting [23,24], the implementation of ImageJ [25], and paid software [26,27]. ImageJ helps with the quantification process as it is possible to measure the area covered by duckweed and the number of duckweeds. However, processing many images might be challenging without the use of macro or automation, and the result might differ from time to time, depending on person to person (Table 1). Additionally, the detection using ImageJ by itself might also be limited due to overlapping and tightly packed objects [28], which will happen in the case of duckweed as the fronds are close along with overlapping. Currently, there is also an available commercial platform called LemnaTec. This platform uses preprogrammed image segmentation methods to detect and measure duckweed sizes [26]. Haffner et al. proposed a visual system that includes a camera holder, a light holder, a camera, a light, a voltage source, and a computer for image acquisition. They developed an algorithm implemented in NI Vision Assistant software to count and measure the area of each duckweed [27]. However, as mentioned earlier, these programs are commercial, as there is a need to purchase/subscribe to their respective company; therefore, researchers who just started doing duckweed study might lean toward using ImageJ as free software.
There have been studies that used artificial intelligence/machine learning methods to overcome contaminated water through machine learning applications [33] and quantify cell growth for toxicity studies in other species/cell lines [34,35]. The use of a machine learning-based method might be a solution to the limitation of ImageJ limitation as free software. Therefore, we employed StarDist as a plugin in ImageJ automatically detect each duckweed frond and count those fronds to simplify the counting process. StarDist uses a neural network that predicts objects based on predetermined shapes, which is a star-convex polygon [36,37]. StarDist was initially developed for cell nuclei. However, applying this network to detect and measure duckweed might be possible due to having a similar circular shape to cell nuclei in 2D images. In this study, we applied the automated deep learning system StarDist to provide a new automatic counting workflow to observe duckweed growth.
Additionally, the duckweed was exposed to herbicide and REE as emerging contaminants to prove the compatibility of the toxicity test by measuring duckweed growth in response to the toxic effect of organic/inorganic chemical effluent present in the provided media. Currently, there are minimal studies on the effect of REE on duckweed, and most of them only observe the effect of one element. Therefore, we will test the toxicity effect of 14 different REEs on duckweed to provide a more comprehensive report on REE toxicity. In this study, we expect LREE to be more toxic than HREE, as reported by the previous study performed in a zebrafish model system [38].

2. Material and Methods

2.1. Duckweed Culture

The common watermeal (Wolffia globosa) stock was a gift from Lemnaceae Fermentation, Inc. (Taoyuan City, Taiwan). The stock was kept at the laboratory and cultured in Hyponex No.4 fertilizer (Hyponex Japan Co., Ltd., Osaka, Japan) with 1:10,000 dilution in water. The light illumination was kept at 400 lux. Common watermeal was transferred to 6-well microplates using plastic straw before toxic compounds exposure. The initial density of common watermeal was maintained at low coverage. Duckweeds were acclimated to laboratory conditions for at least four days before the toxicity test.

2.2. Preparation of Stock Solution

Two kinds of Glyphosate and Glufosinate herbicides were used as known plant growth inhibitors. These herbicides were diluted to a stock concentration of 10,000 ppm. Additionally, duckweeds were also exposed to several different rare earth elements (REE), including Lanthanum (La), Cerium (Ce), Praseodymium (Pr), Neodymium (Nd), Samarium (Sm), Europium (Eu), Gadolinium (Gd), Terbium (Tb), Dysprosium (Dy), Holmium (Ho), Erbium (Er), Thulium (Tm), Ytterbium (Yb), and Lutetium (Lu). REEs are purchased in chloride salt form from Aladdin (Shanghai, China). The stock solutions of REE were prepared by diluting REE solids in ddH2O to 10,000 ppm. These stock solutions are diluted to several different concentrations for exposure.

2.3. Toxicity Test and Image Acquisition

Ten (10) mL of herbicides at 100 ppb, one ppm, ten ppm, 25 ppm, 50 ppm, and 100 ppm, 200 ppm were added to an empty well of a 6-well microplate. These concentrations were based on previous studies in other duckweed species (Lemna sp.) [39,40]. Meanwhile, preliminary IC50 tests were performed on REE groups at 100 ppb, one ppm, ten ppm, 100 ppm, and 1000 ppm. Afterward, several concentrations were added to supplement the data at three different concentrations depending on the preliminary test result. A total of 30–40 duckweed fronds were added to each well for a toxicity test. The number of duckweed was kept low to avoid overcrowding the wells and limiting duckweed growth. Duckweed images were taken using Zebrabox (ViewPoint 3.22.3.85, Viewpoint Life Sciences, Inc., Civrieux, France) at HD quality (1024 × 768 pixels), starting 0 h after exposure and seven days after exposure. IC50 value was calculated using GraphPad Prism 8 version 8.0.2 (GraphPad Software, Inc., San Diego, CA, USA).

2.4. Image Training by StarDist

Five different images of duckweed cultured on a 6-well microplate were taken in addition to daily recording. A small part of these recordings was cropped with a minimum of 256 × 256 pixels for StarDist neural network training using FIJI build of ImageJ (Available for download at: https://imagej.net/software/fiji/, accessed on 18 February 2022). Afterward, each duckweed frond was manually annotated using QuPath v0.3.0 (Available for download at: https://qupath.github.io/, accessed on 18 February 2022). Annotated images were exported to a new folder, and the StarDist neural network was trained in Anaconda (Available for download at: https://www.anaconda.com/products/individual, accessed on 18 February 2022) based on the guidelines provided in StarDist’s GitHub page (https://github.com/stardist/stardist, accessed on 18 February 2022). The trained neural network will be exported into a zip file for image prediction in ImageJ (Supplementary Materials).

2.5. Duckweed Detection and Counting

Firstly, we convert the video recording we have using VirtualDub2 software (build 44282) to .avi format due to ImageJ video format limitation (Available for download at: http://virtualdub2.com/, accessed on 18 February 2023). Afterward, we can open the videos in ImageJ and take five images from each video for counting. Then, we can apply a trained neural network using the StarDist plugin, which can be installed according to the StarDist page on the ImageJ website (https://imagej.net/plugins/stardist, accessed on 18 February 2022). Based on the training result, we set the Probability Threshold at 0.82. StarDist will detect and mark all objects recognized as duckweed and add them to ImageJ ROI Manager. Finally, we can run the measure command in the ROI Manager to obtain each image’s total duckweed count according to StarDist selection, then export the result to individual Microsoft Excel files depending on their treatments. We packaged the workflow for duckweed detection and counting in an ImageJ macro script (Supplementary Materials).

2.6. Mass Data Processing Using Python-Based Scripts

In order to calculate the W. globosa growth rate, we compared the number of counted fronds of each time points to the first recording (day 0), which will show how much the fronds multiply by using this equation:
D X f m = D a y X   f r o n d s   m u l t i p l i c a t i o n = D a y X   f r o n d s   c o u n t D a y 0   f r o n d s   c o u n t
Then the result of each treatment group was compared to the control group to obtain the inhibition percentage of each treatment by using the equation:
% i n h i b i t i o n = C o n t r o l   D X f m T r e a t m e n t   D X f m   C o n t r o l   D X f m × 100 %
We provided a more extensive and detailed procedure of StarDist operation in Supplementary Materials (also see on-line tutorial at https://www.youtube.com/watch?v=l5ed5yfAmlU&list=PLRmQXf_nHOvP1YUV1xBtQHkDEcLt16rDP, accessed on 2 August 2023).

2.7. Statistical Tests

Statistical tests were performed using Graphpad Prism 8 (Graphpad Holdings, LCC, San Diego, CA, USA). The data were transformed to log10 values (10 to 1, 100 to 2, 1000 to 3, etc.) in order to stabilize the variance between concentration values. The data were then subjected to nonlinear curve fitting for log(inhibition) vs. normalized response—variable slope to calculate and present IC50 concentrations at different time points.

3. Results

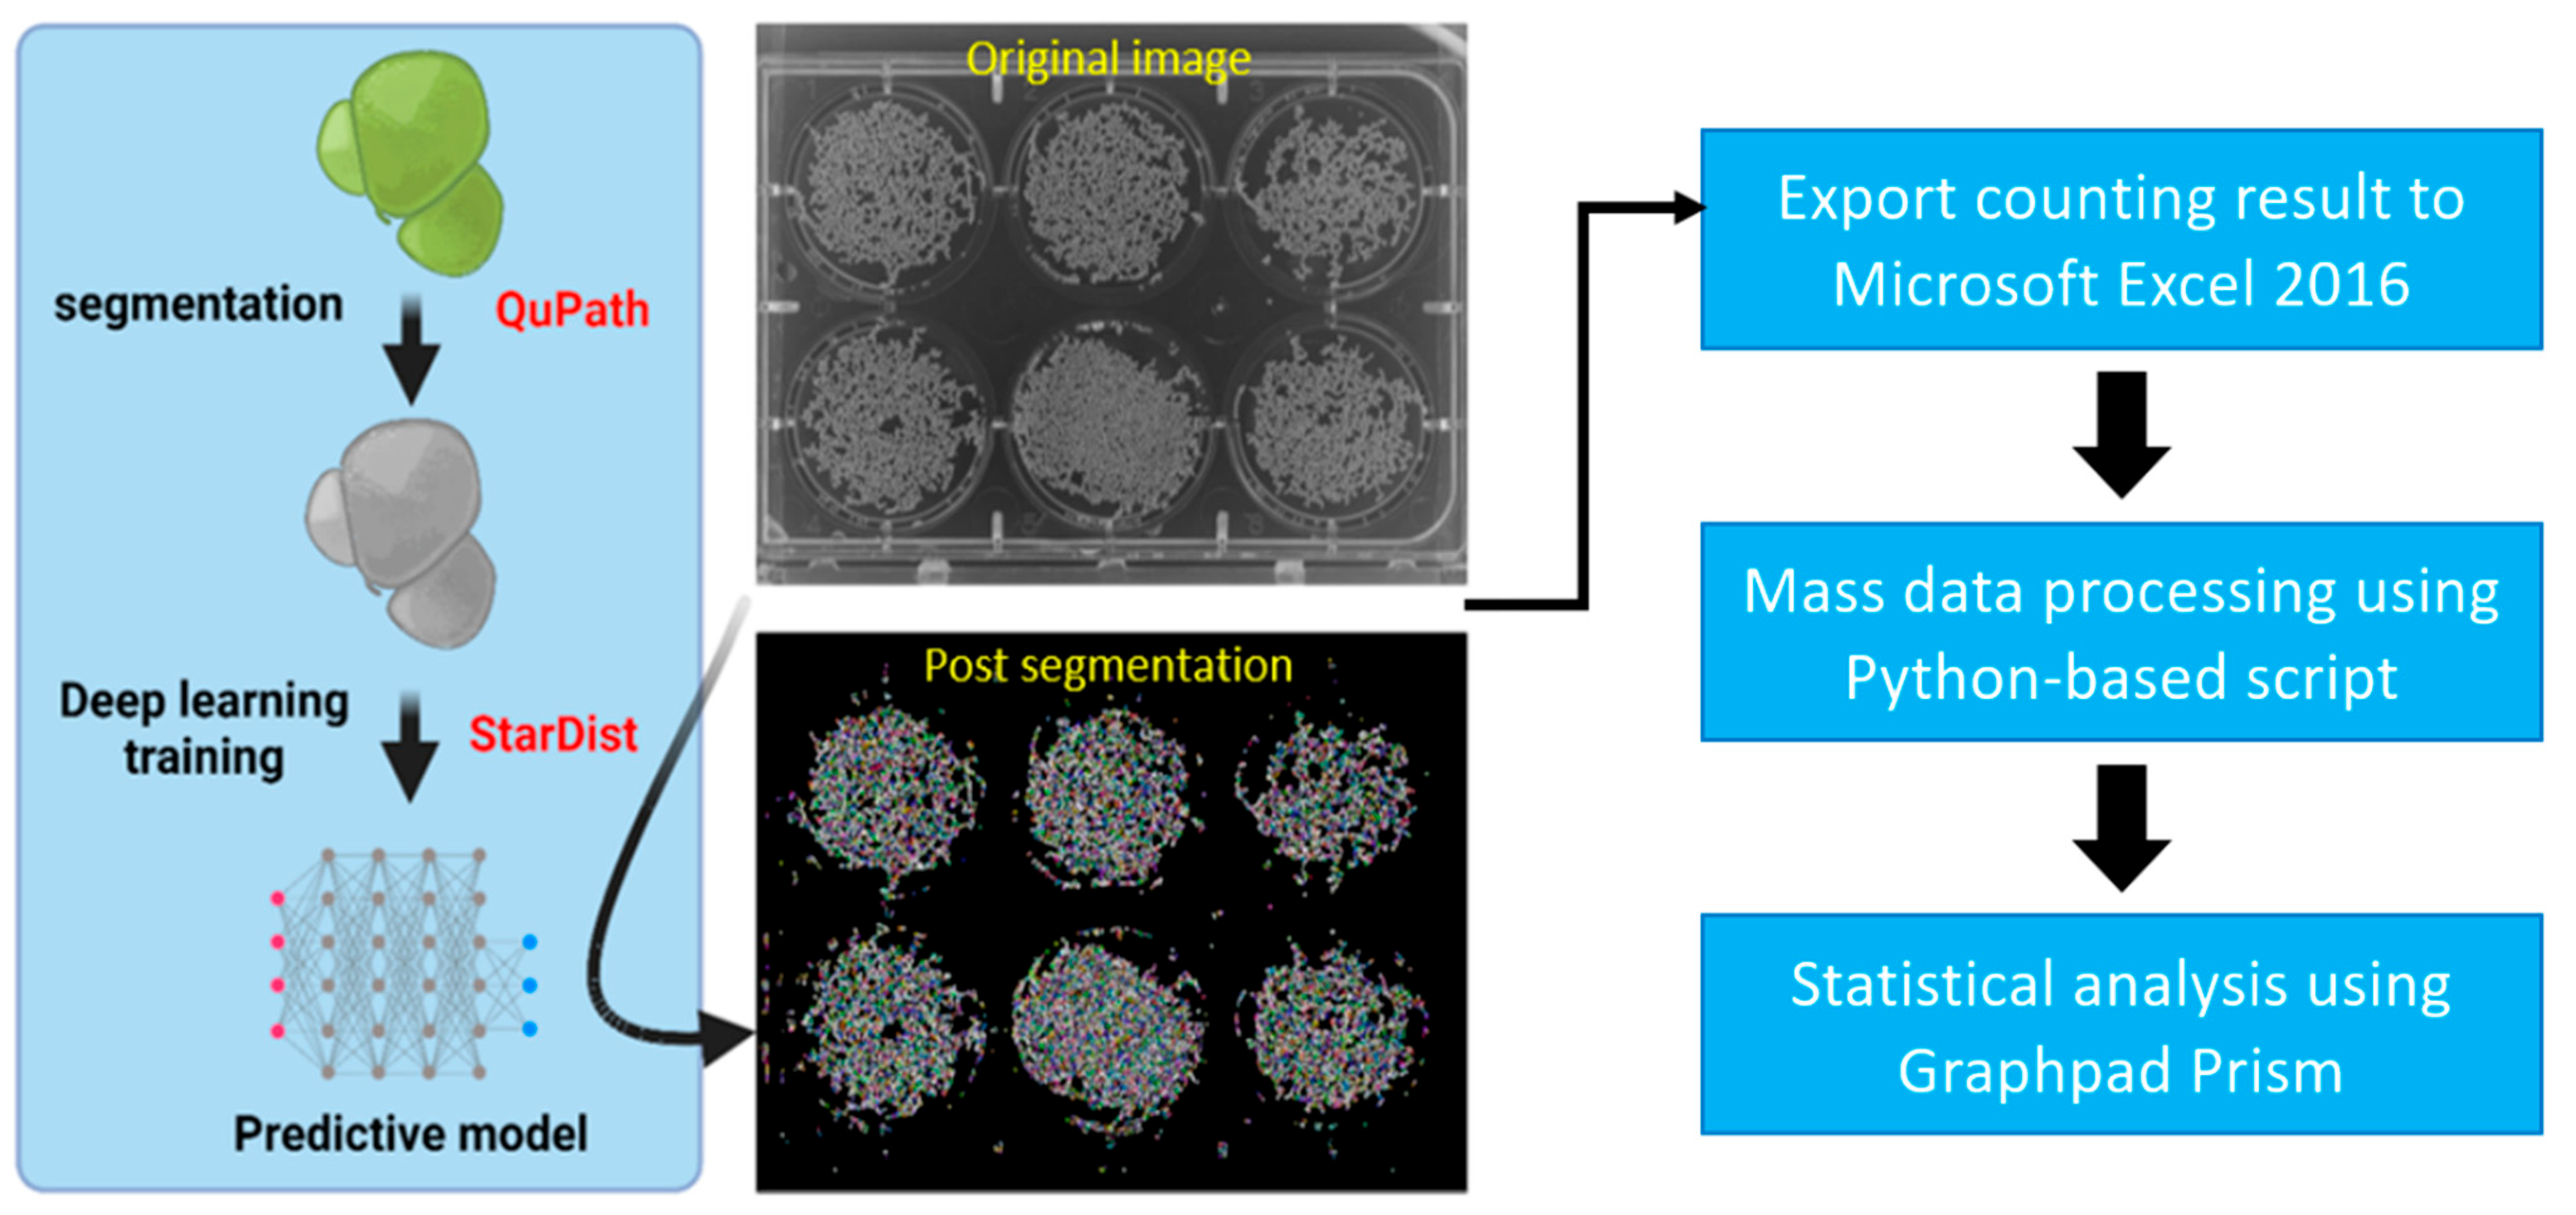
3.1. Overview of Experimental Workflow

In this study, we proposed a deep-learning-based method to develop a faster and more precise tool to assist researchers in counting duckweed fronds, mainly for toxicity tests. The deep learning method we used in this study is StarDist, a neural network initially made to detect star-convex polygons which should be suitable to duckweed fronds shape as they are mostly circular or oval shaped. The Duckweed species we used to test this method is Wolffia globosa, commonly known as common watermeal. This species was used as a model organism due to its exceptional growth rate and ease of maintenance.
First, we prepared a training dataset for the predictive model. This process started by manually segmenting prerecorded common watermeal images in QuPath. The manual segmentation result was exported as masked images through a macro provided by the StarDist developer team. Then, the images were used to train the neural network using the StarDist framework in Anaconda. The result of the training was exported in a compressed file for future prediction. The StarDist plugin in ImageJ applies the predictive model to one 6-well plate of W. globosa to count their fronds and export the result into an Excel file. The process was repeated until all the videos had their fronds counted. Afterward, we applied a Python-based script to merge and manage all the Excel files, classifying the data based on their treatment and time points. Then, the inhibition percentage of each treatment group was calculated by comparing the treatment group’s fronds growth to the control. Finally, we used a nonlinear regression tool in GraphPad Prism to observe the inhibition effects of compounds of interest on common watermeal (analysis pipeline summarized in Figure 1).

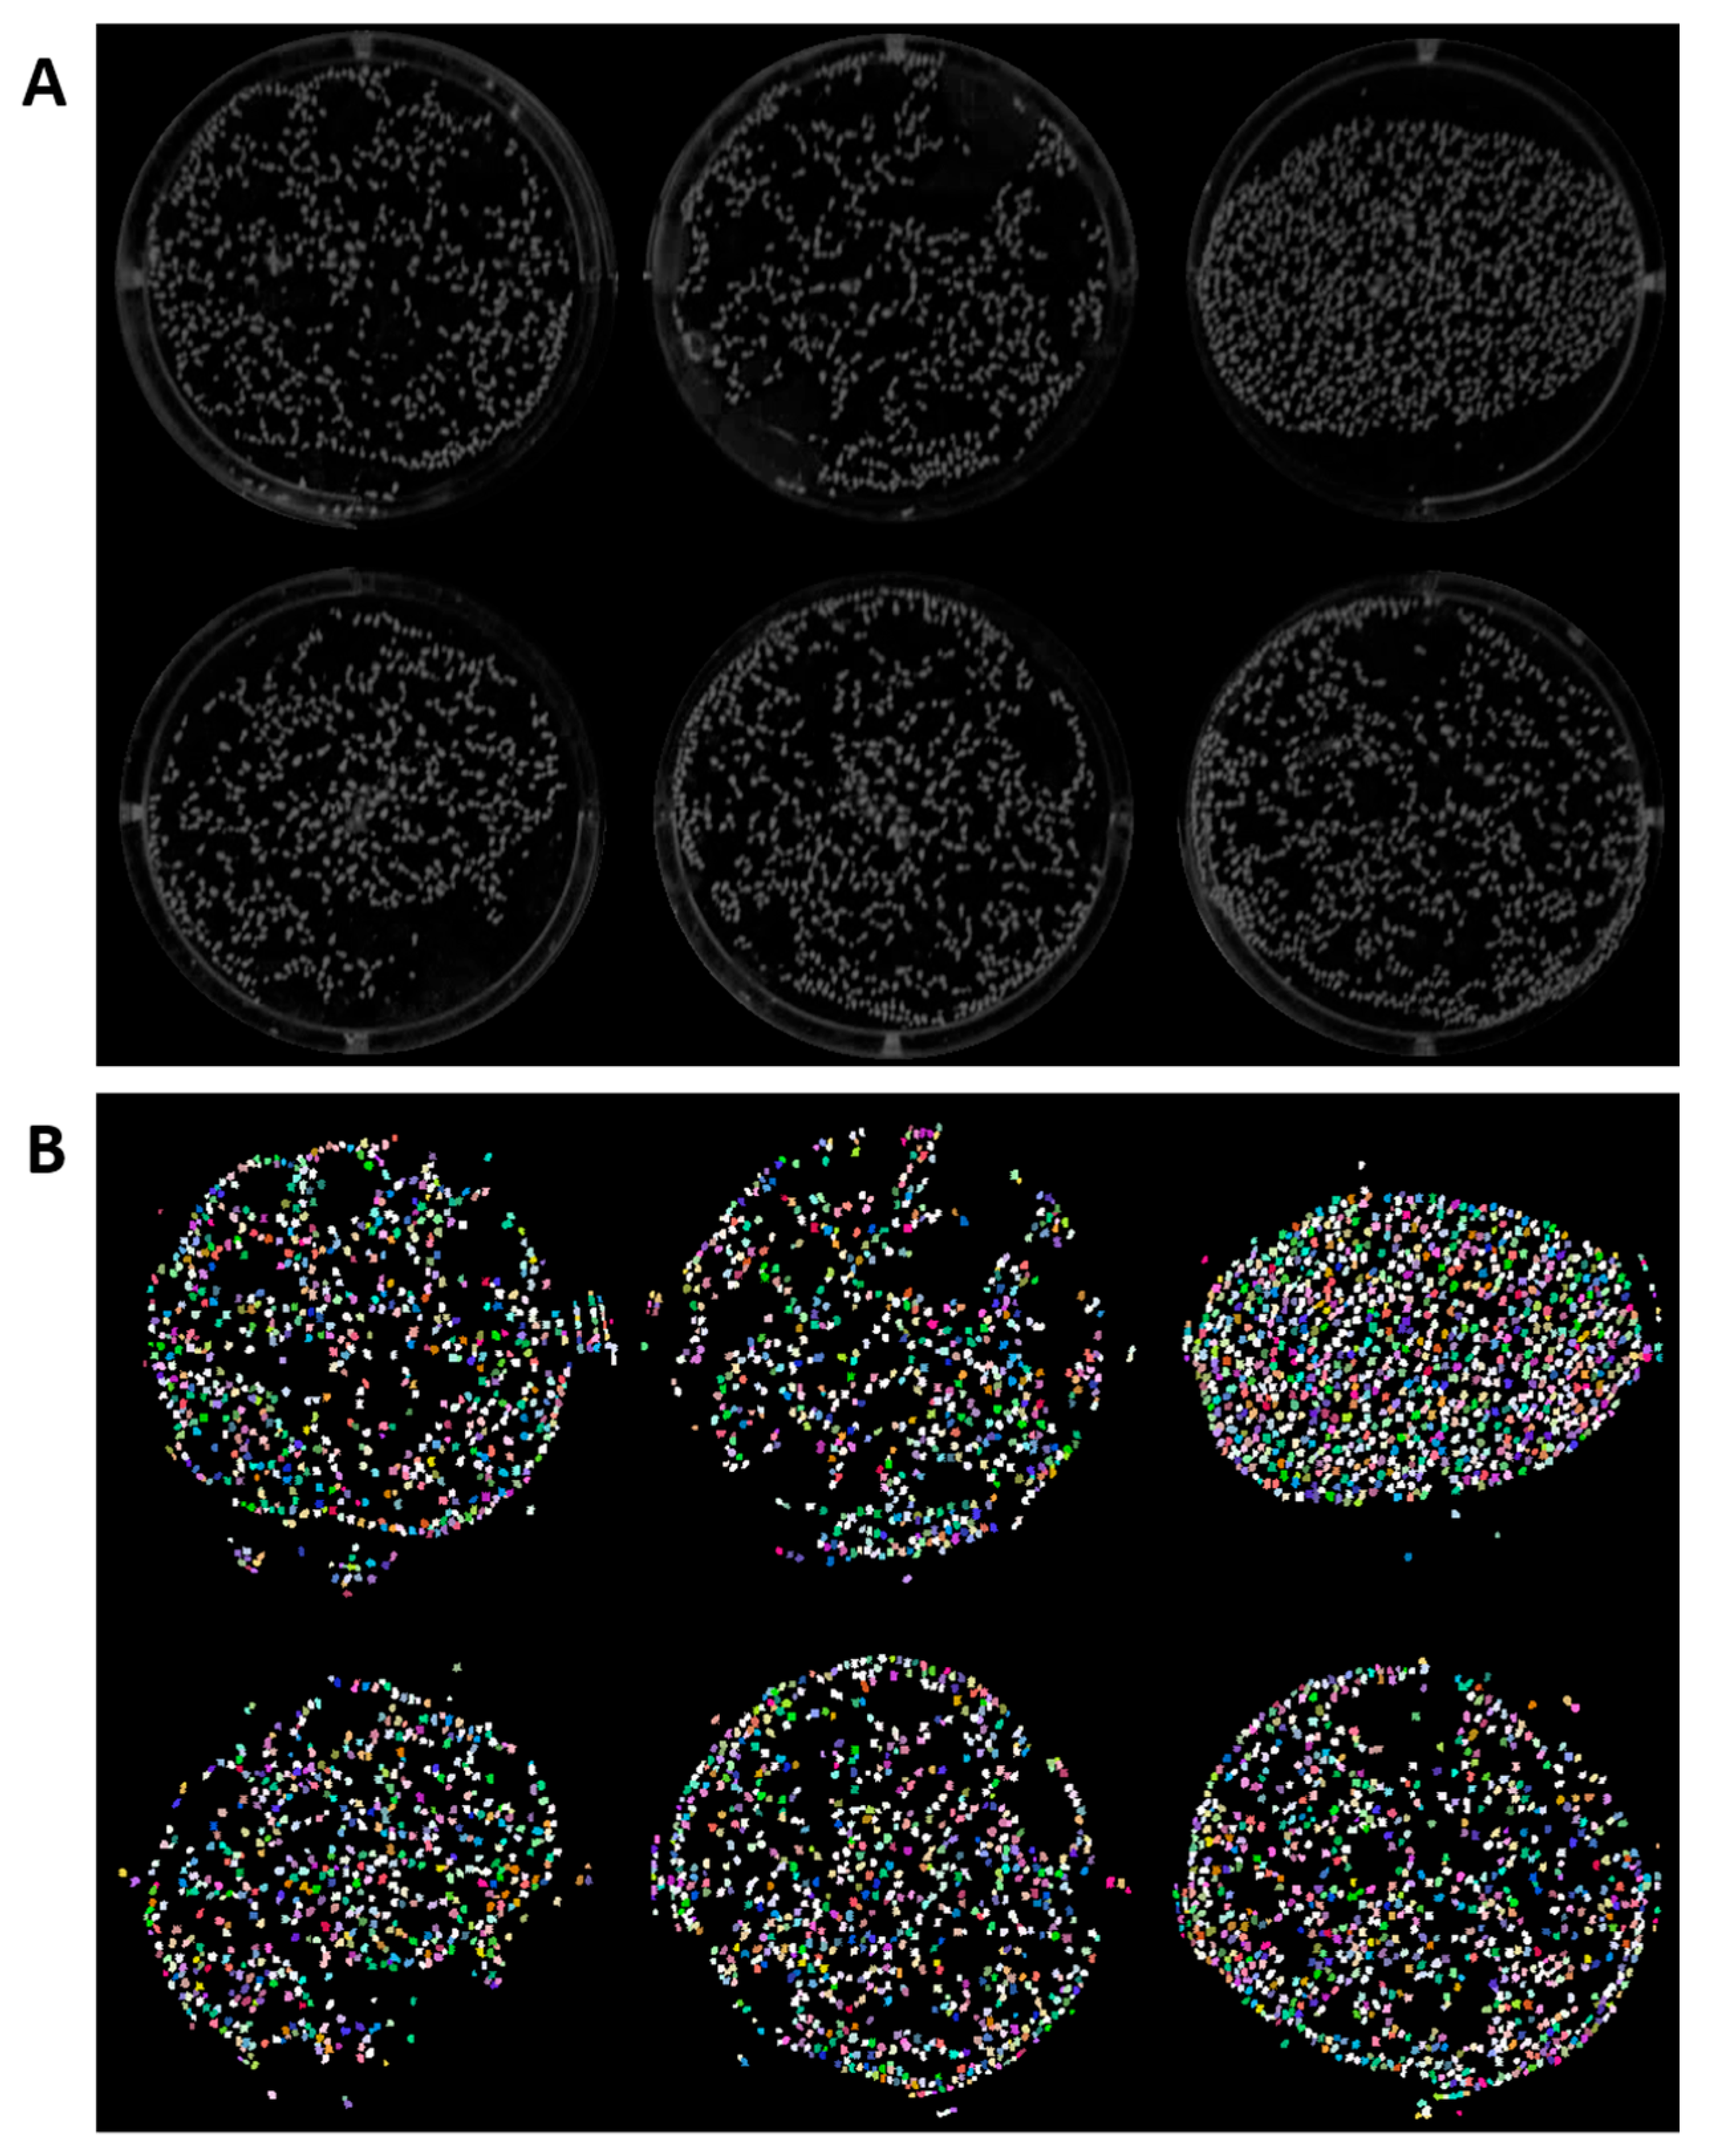
3.2. Segmentation Performance for Common Watermeal (Wolffia globosa)

The segmentation result of duckweed fronds using a trained predictive model and StarDist recommended threshold setting (overlap/NMS threshold = 0.4) is presented in Figure 2. The result showed proper segmentation of duckweed fronds. However, there are several parts showing misdetections. The light reflection on plastic microplates mostly causes these misdetections. In order to reduce this misdetection, wells were individually cropped, reducing misdetection incidence compared to using full microplate images.

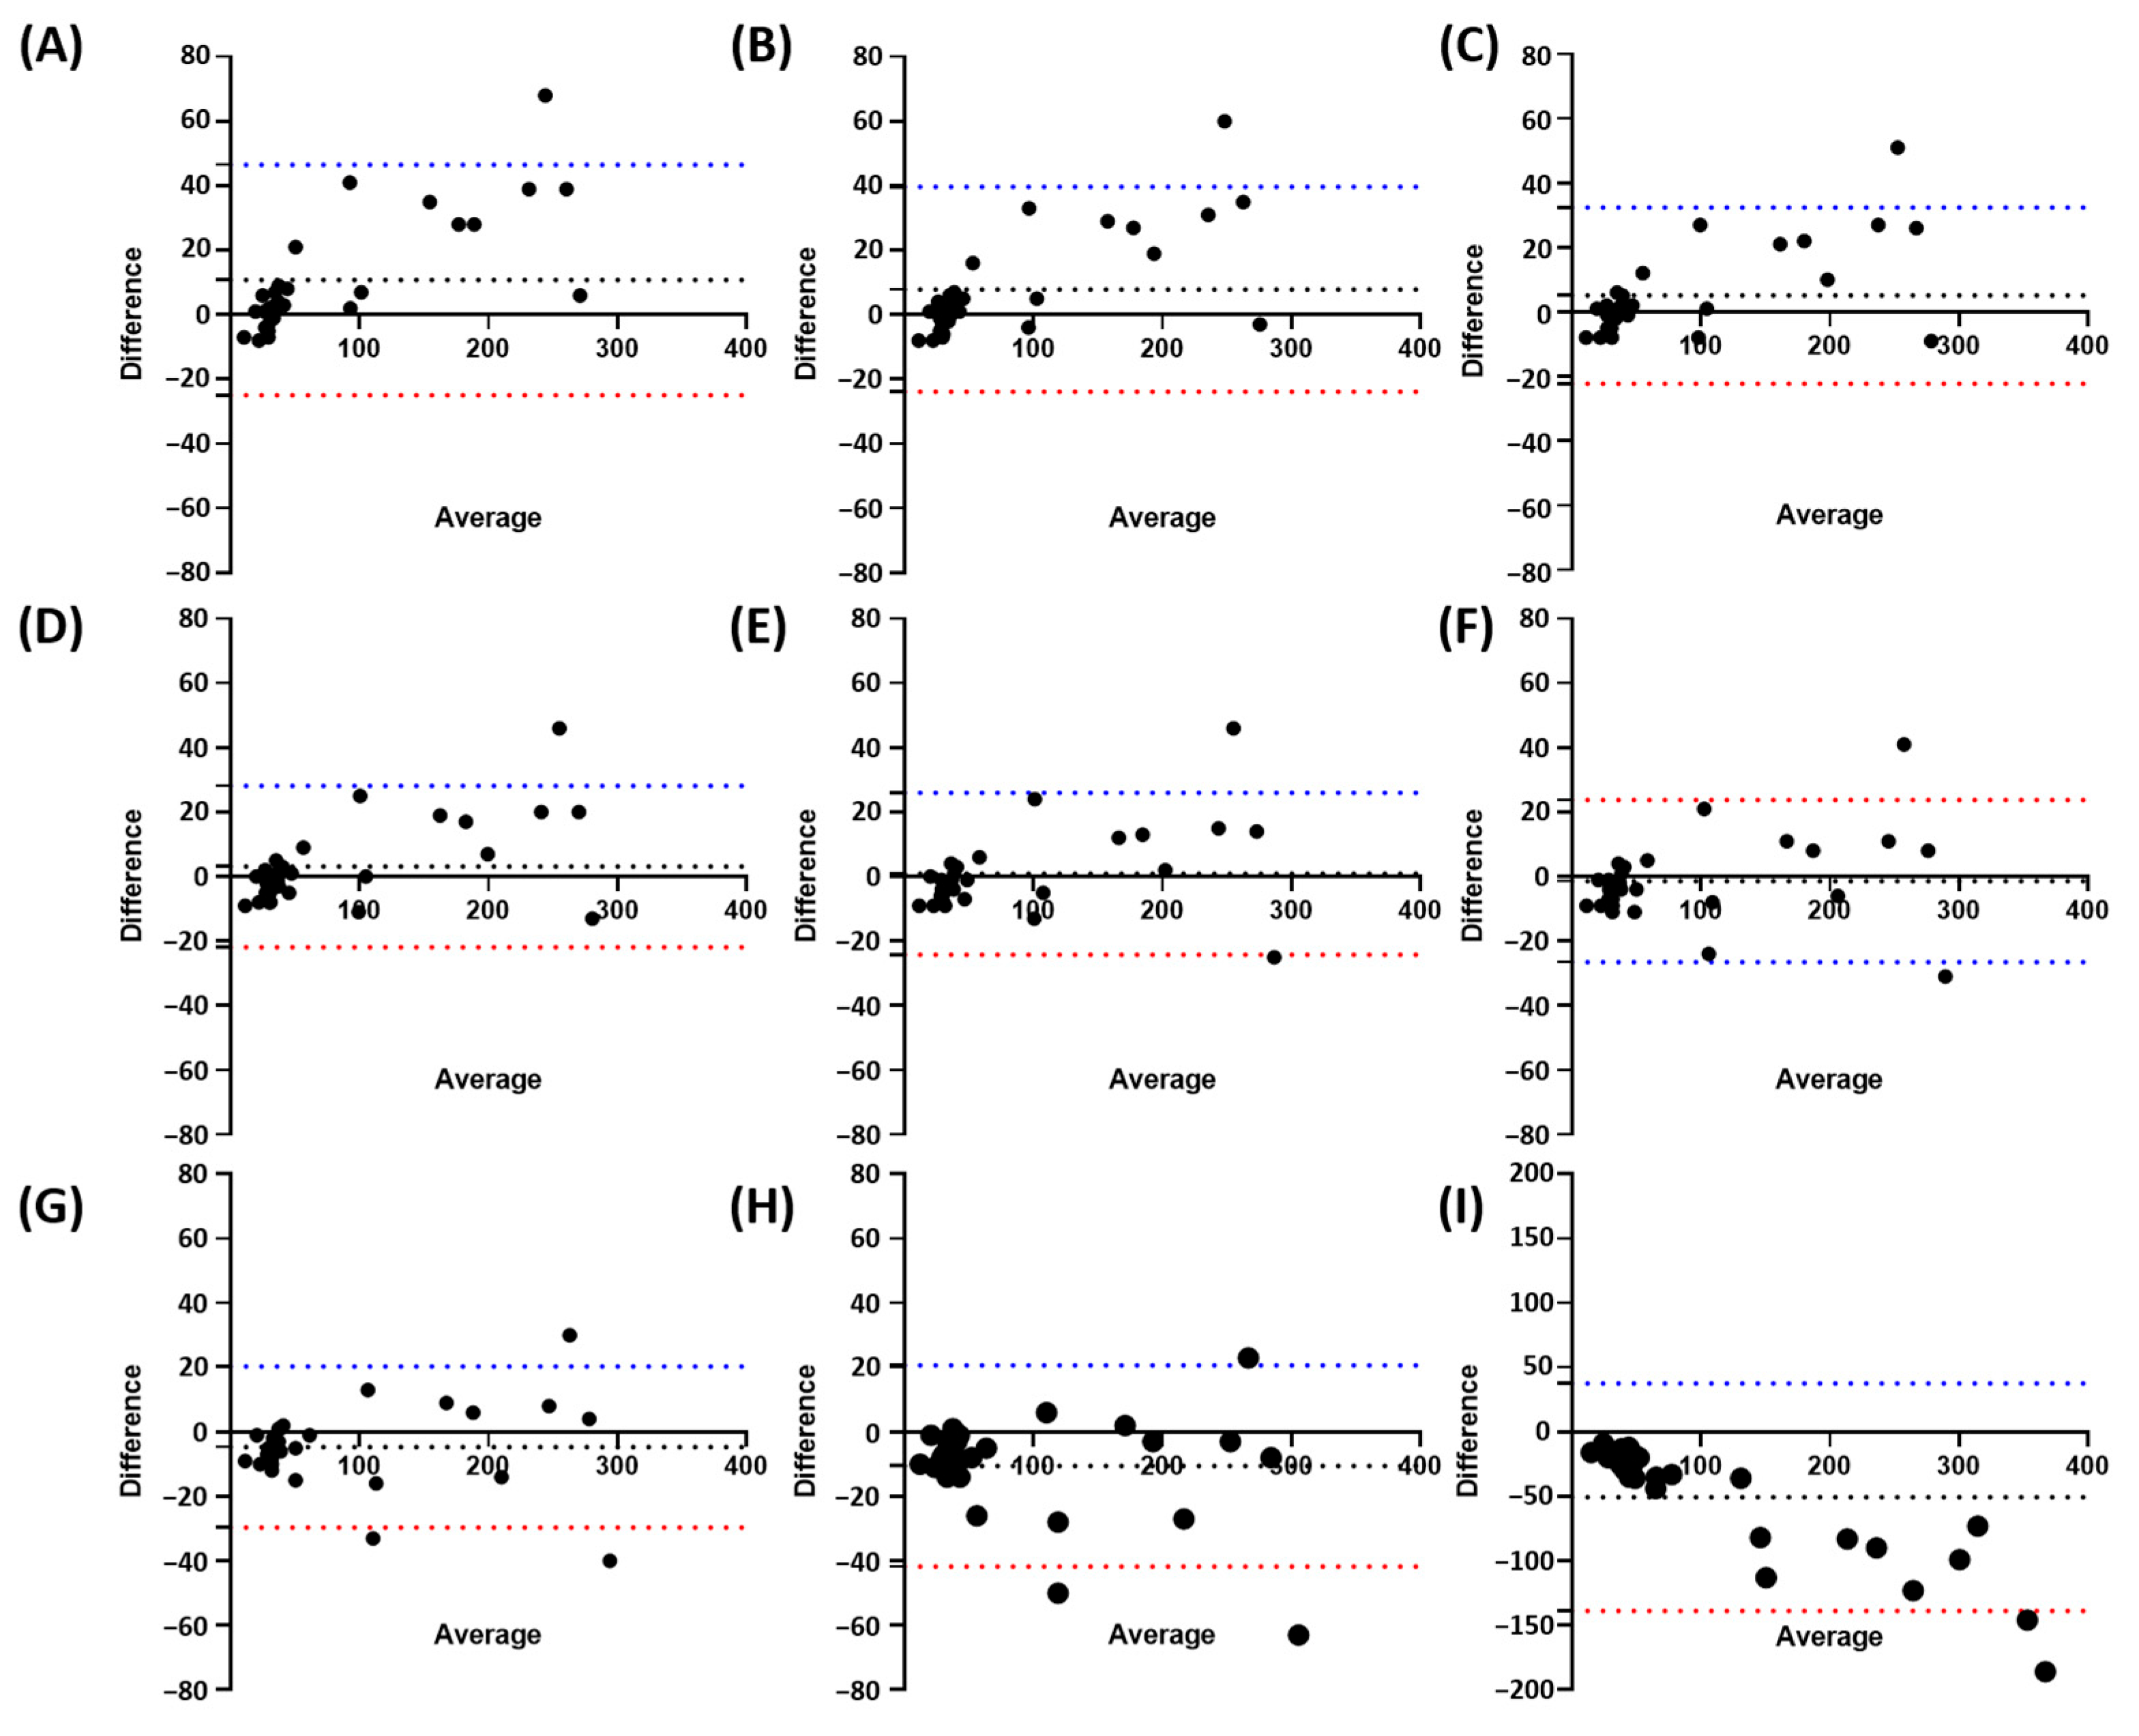
3.3. Determining the Optimal Overlap/Non-Maximum Suppression (NMS) Threshold for Wolffia globosa Detection Using StarDist 2D

In order to improve StarDist’s performance for detecting W. globosa, we experimented with the variables available in StarDist. StarDist used two different kinds of threshold variables to segment objects, probability threshold and overlap/NMS threshold. Probability thresholds are used to classify the objects by scoring them based on their pixel value, while overlap/NMS thresholds are used to prune redundant objects by considering the object intersection area, ensuring the accuracy of the detected object to be ideally the same as the true object. Overlap/NMS threshold is important for W. globosa detection. The fronds are located close to each other, which means there is a high chance of overlapping, and new budding fronds might be detected as overlapping with their mother fronds because they are connected. Therefore, we tested the overlap value ranging from 0.1–0.9 to find the most suitable overlap/NMS threshold for duckweed detection.
In order to test it, we randomly selected 30 W. globosa images from different time points. We manually counted those images while applying the StarDist model we previously trained with different overlap/NMS threshold values. From the Bland–Altman plots of the nine different overlap/NMS threshold values, the mean difference was 10.83 for 0.1, 7.90 for 0.2, 5.07 for 0.3, 3.13 for 0.4, 0.90 for 0.5, −1.37 for 0.6, −4.67 for 0.7, −10.57 for 0.8, and −50.57 for 0.9 (Figure 3). These values showed the mean counting difference between the manual counting method used as a standard and the StarDist counting method with different overlap/NMS threshold values. Therefore, the result suggests 0.5 as the most suitable threshold value due to having the lowest mean differences, thus showing the closest counting performance to the manual counting method. However, the Bland–Altman plots result of Figure 3 suggests that higher fronds count leads to lower accuracy, as most of the dots are located further from the mean difference line on a higher frond count.

3.4. Optimized StarDist Model for Duckweed Growth Inhibition Assay

The performance of StarDist was tested on duckweed growth inhibition assay using two different herbicides, namely Glyphosate and Glufosinate, along with 14 kinds of REE. We used overlap threshold = 0.5 as it showed the most similar result to manual counting. The result of StarDist was exported into Excel (.xlsx) files. Each Excel file contains the result of one plate and a one-time point. Then, we employed a Python-based script to merge the data from the control and different treatments group into one Excel file to calculate the growth as described above. The script will produce a final Excel file showing each treatment’s growth inhibition rate for each time point. Finally, the data were inputted into GraphPad Prism to generate IC50 graphs and calculate IC50 values.
The result of Glyphosate exposure had IC50 values of 36.4 ppm on Day 7. Meanwhile, Glufosinate had an IC50 of 33.9 ppm on Day 7 (Figure 4). We also observed the bleaching of Wolffia fronds after exposure to Glyphosate and Glufosinate (Figure 5). The bleaching happened as soon as the first day after exposure to the high herbicide concentration.

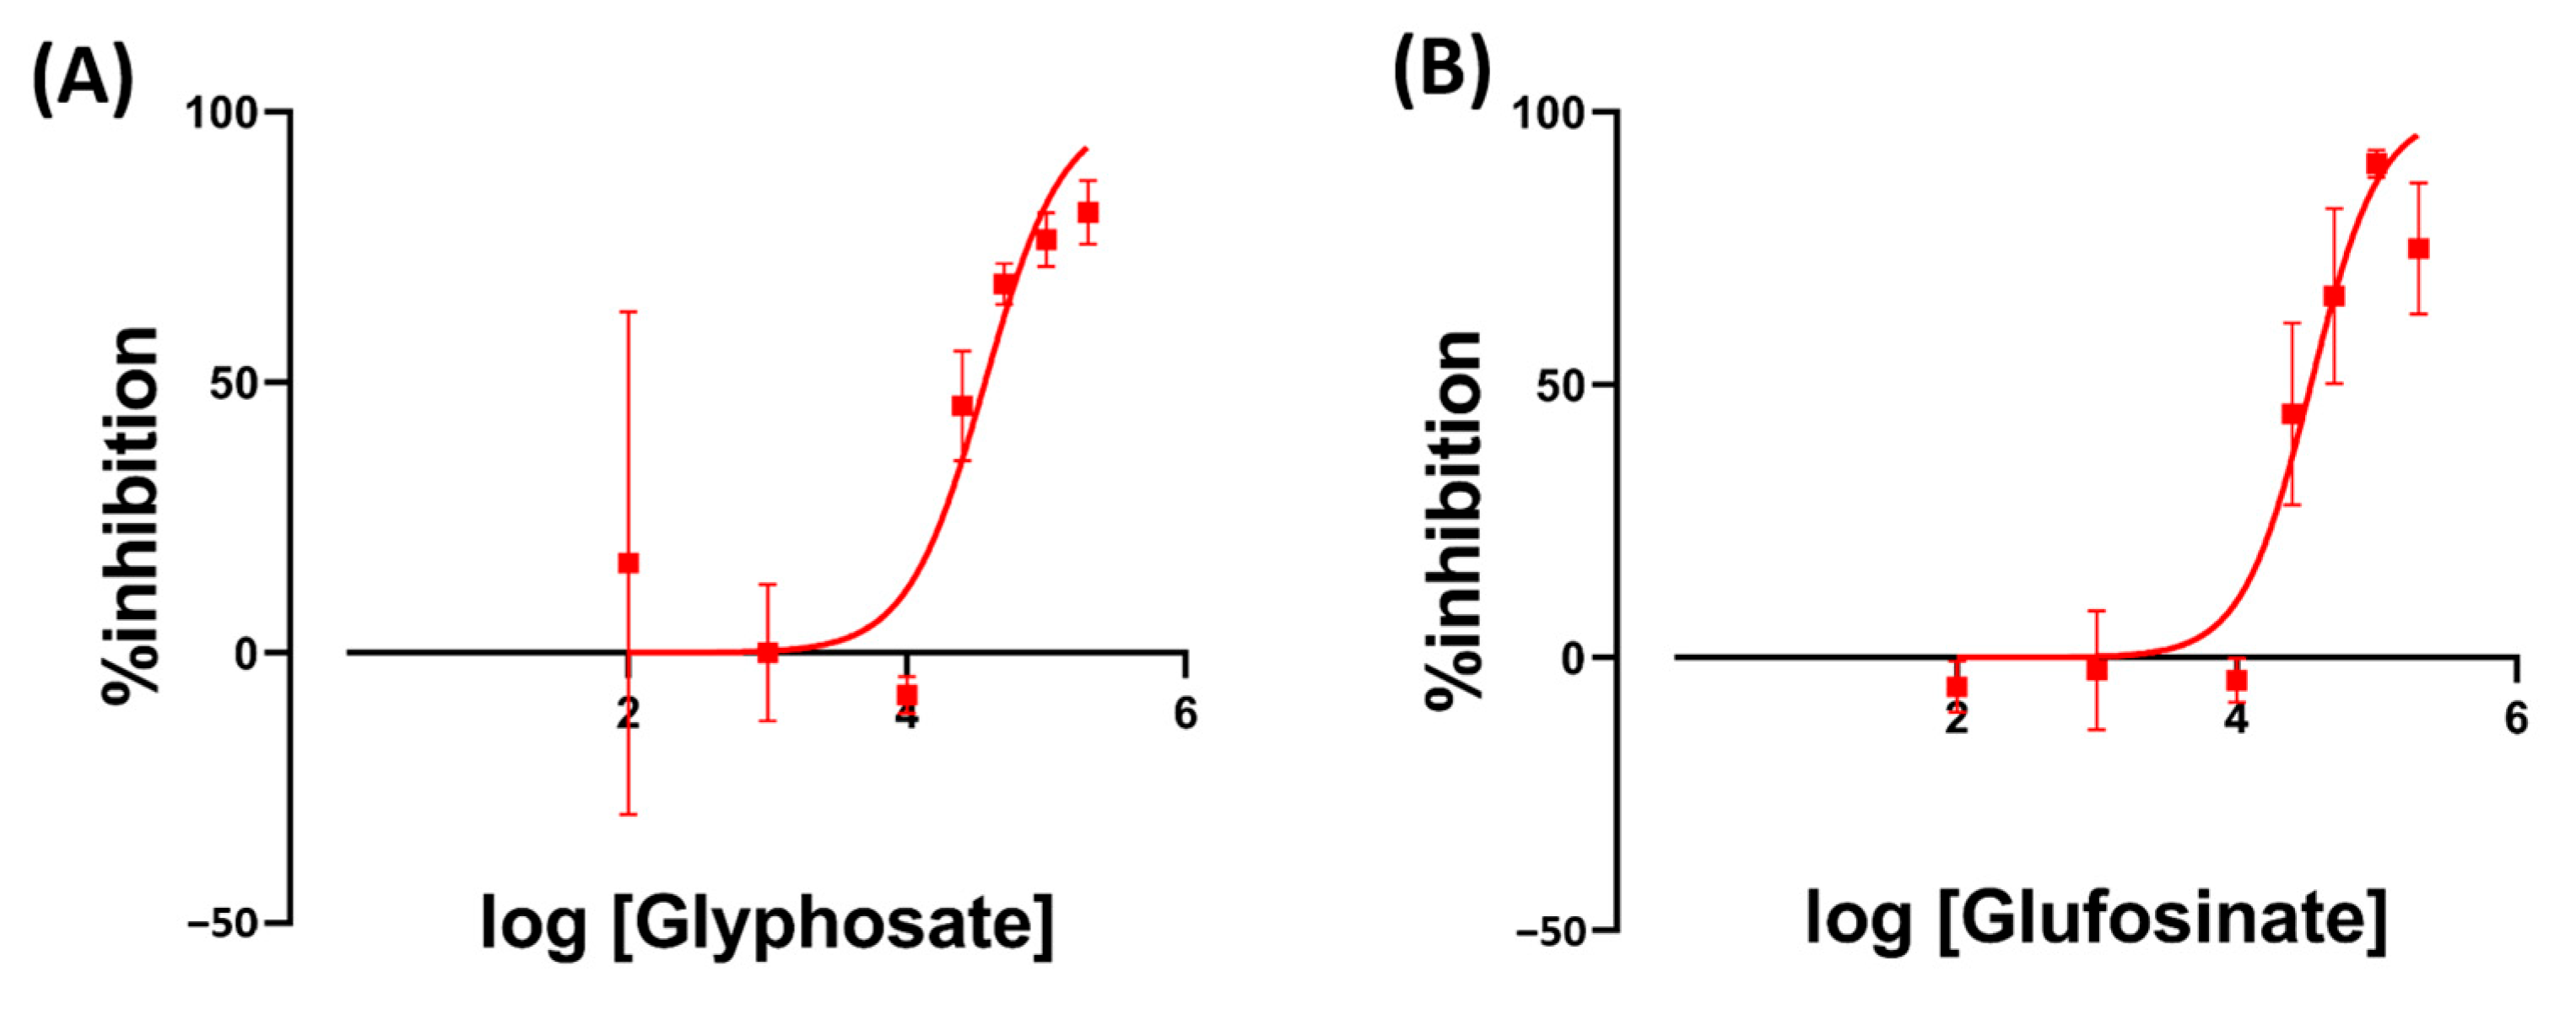
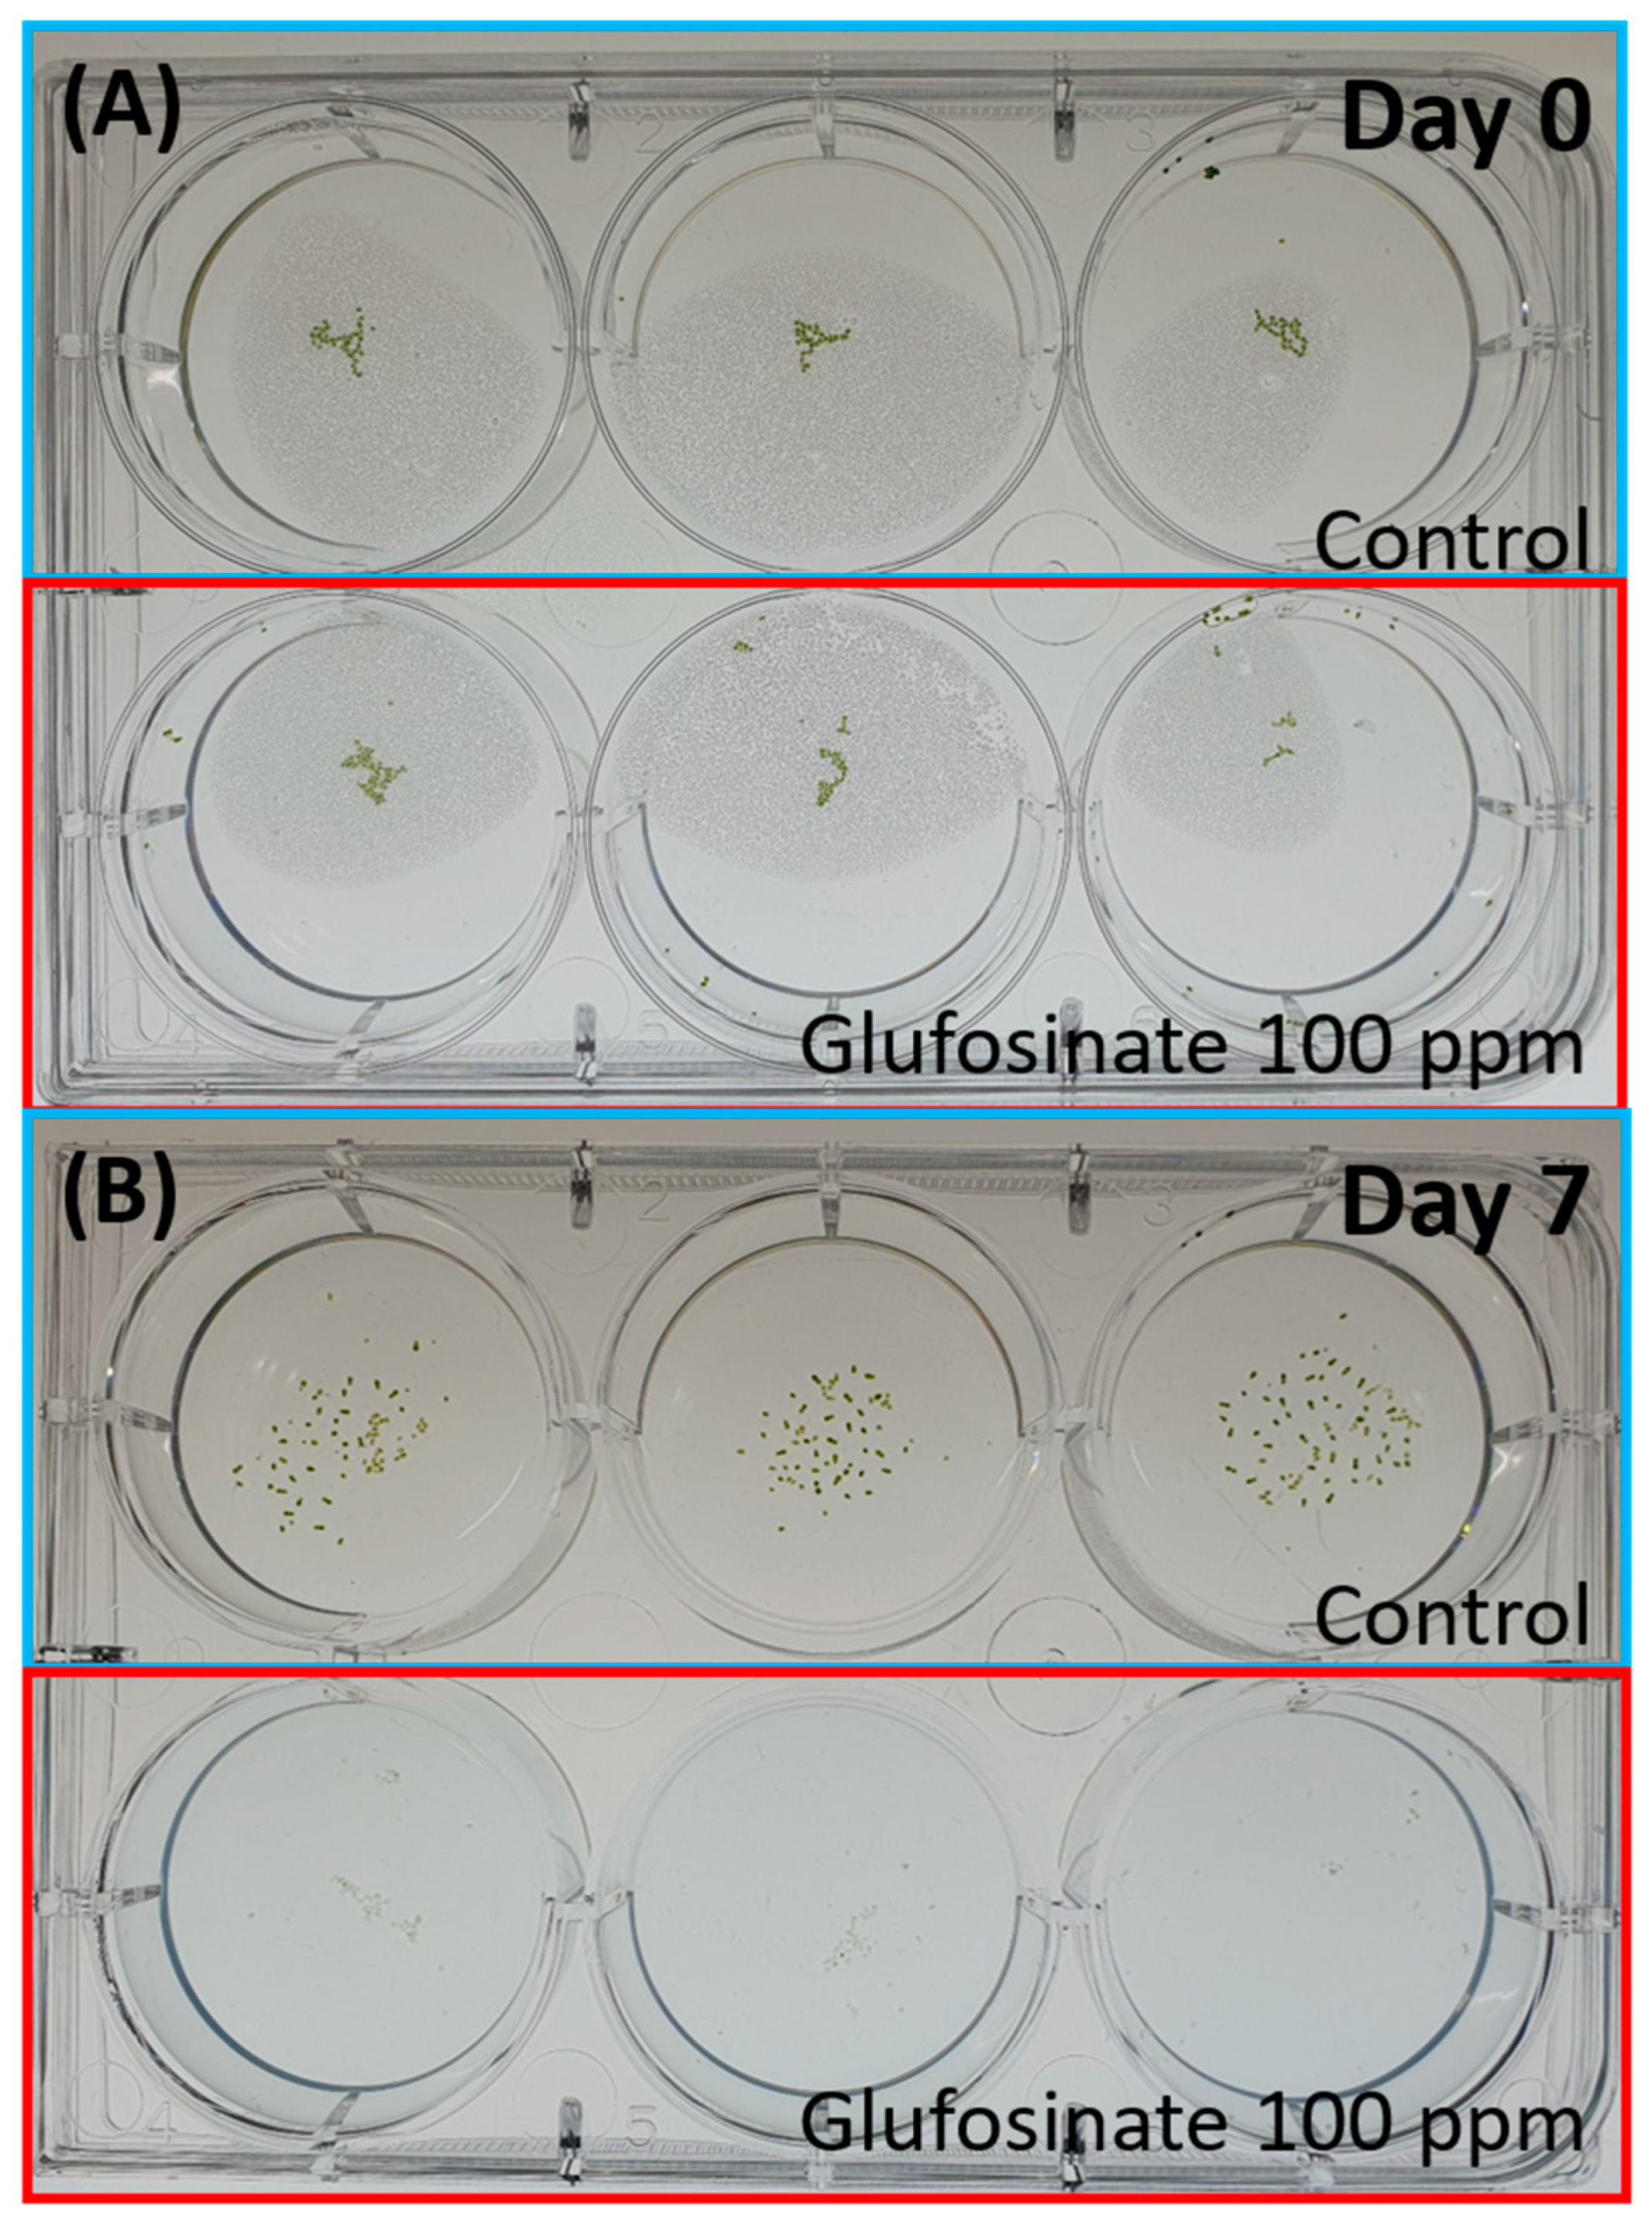
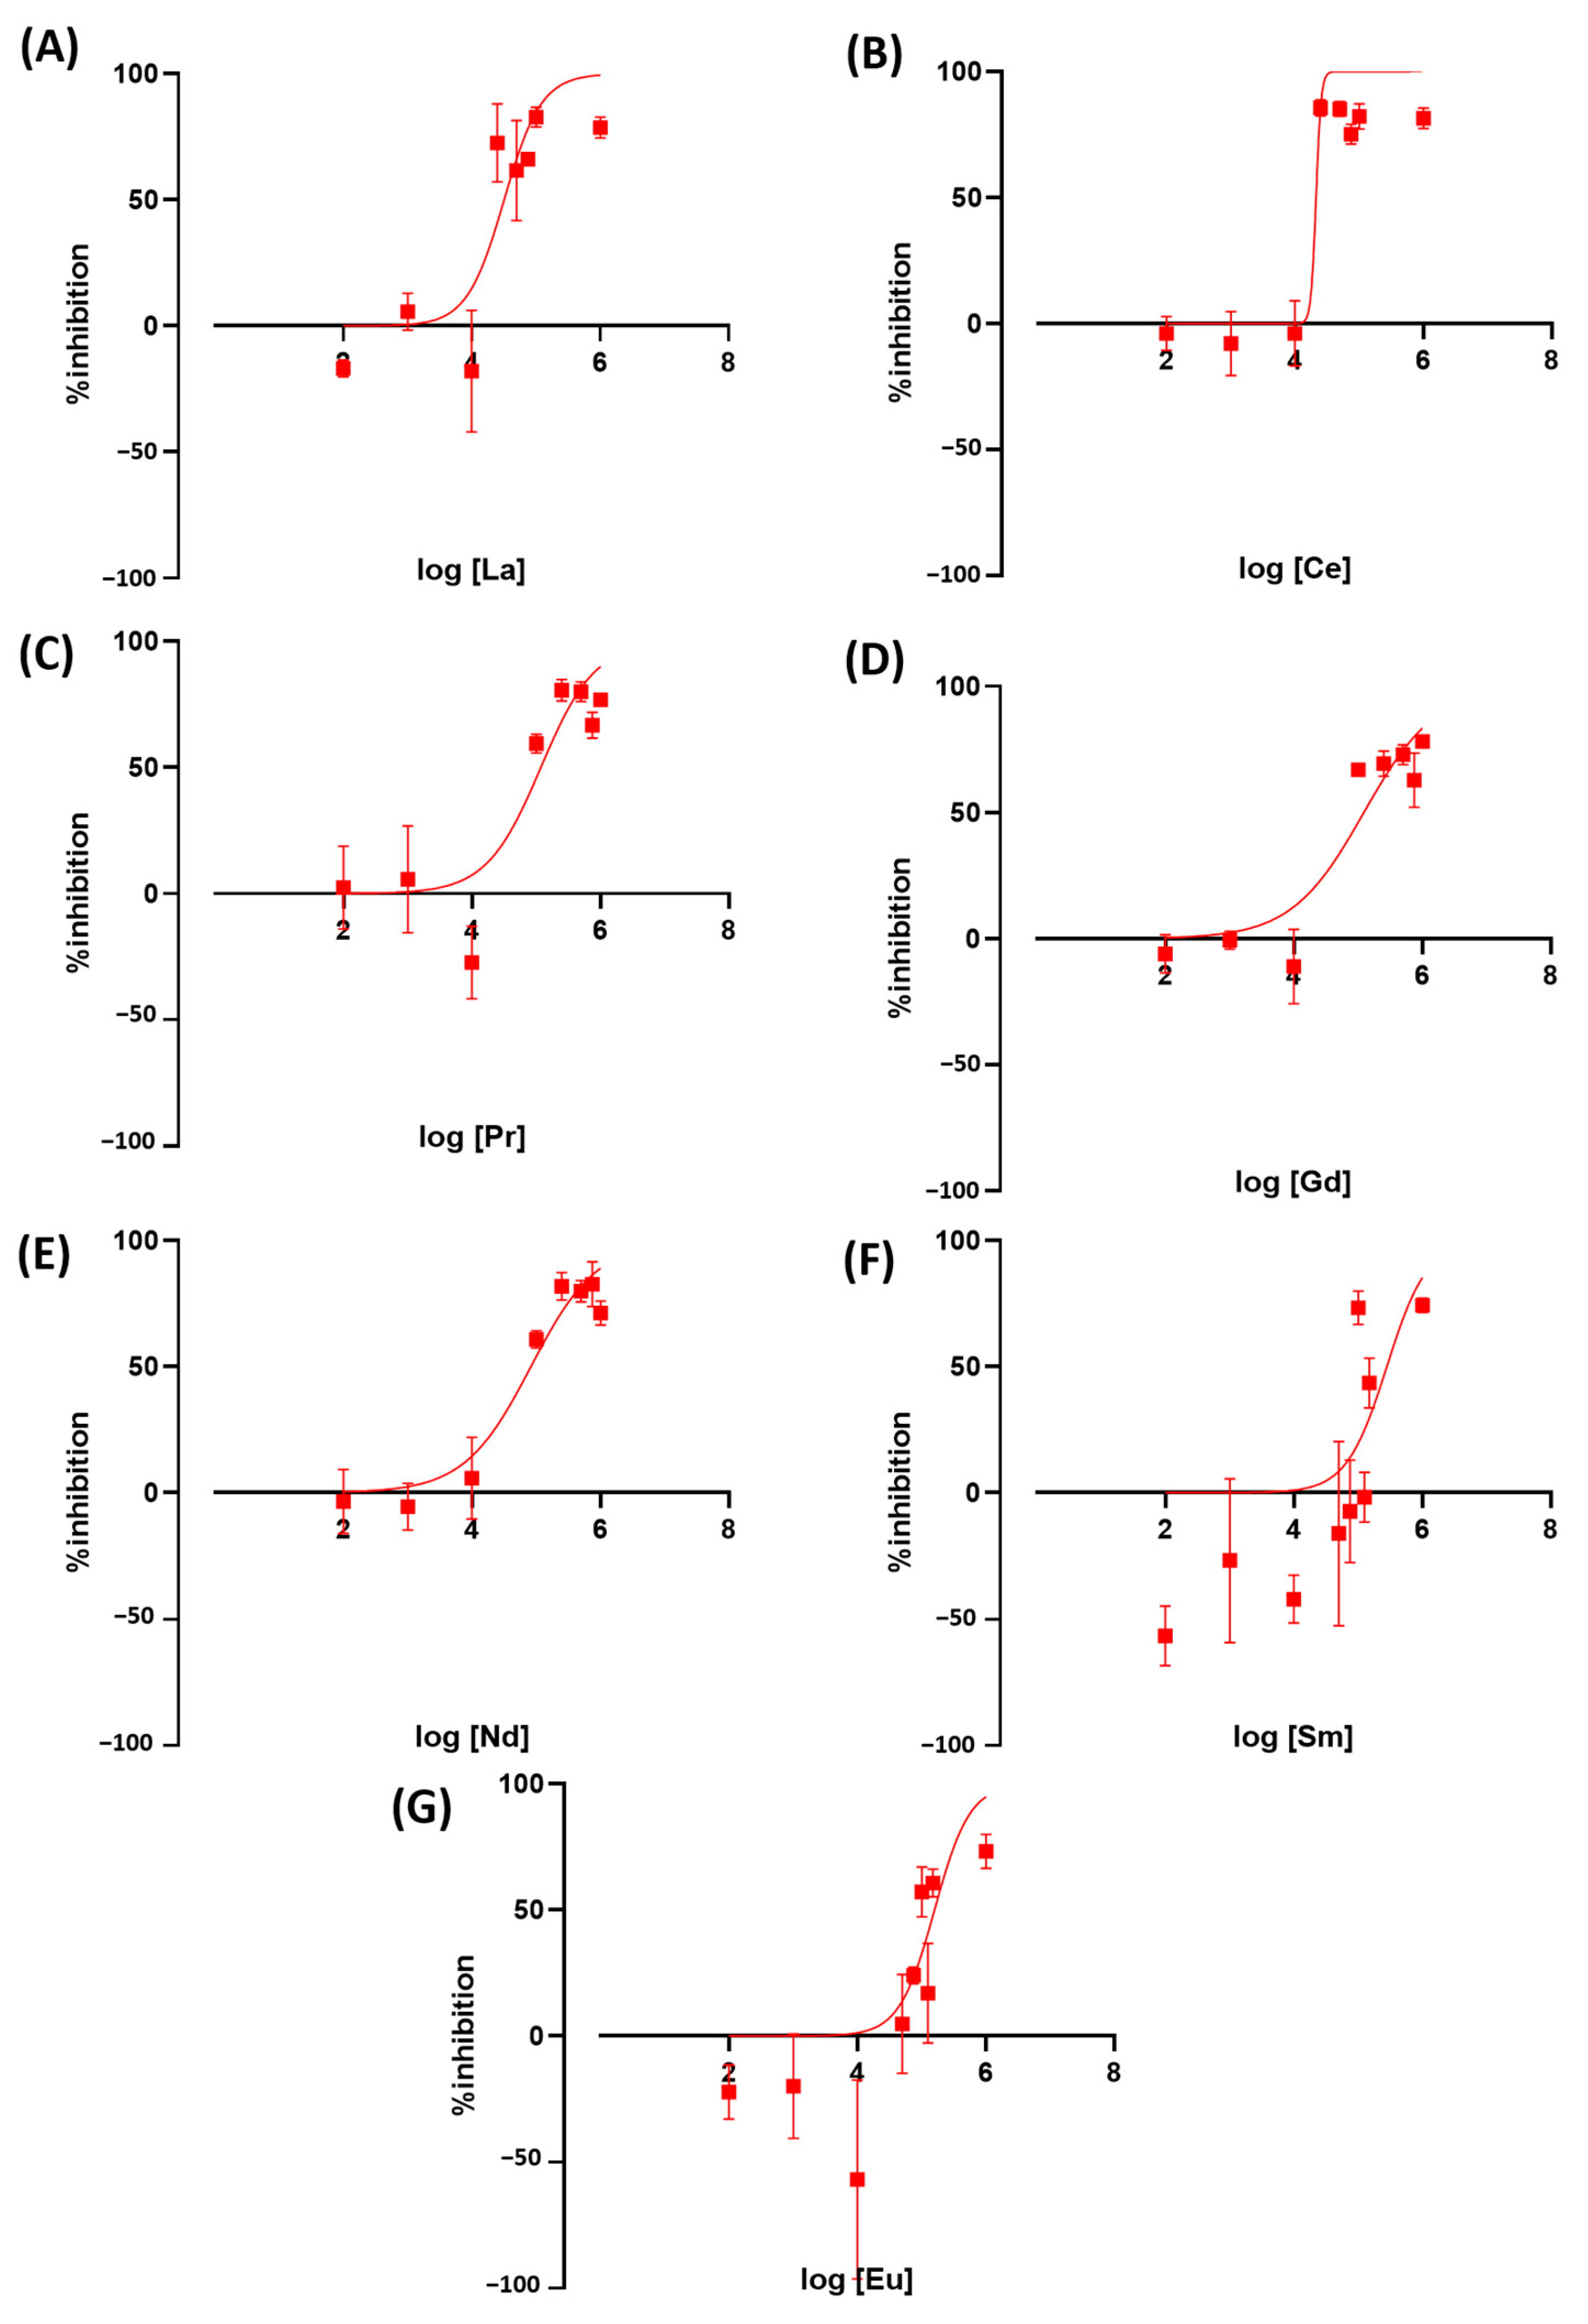
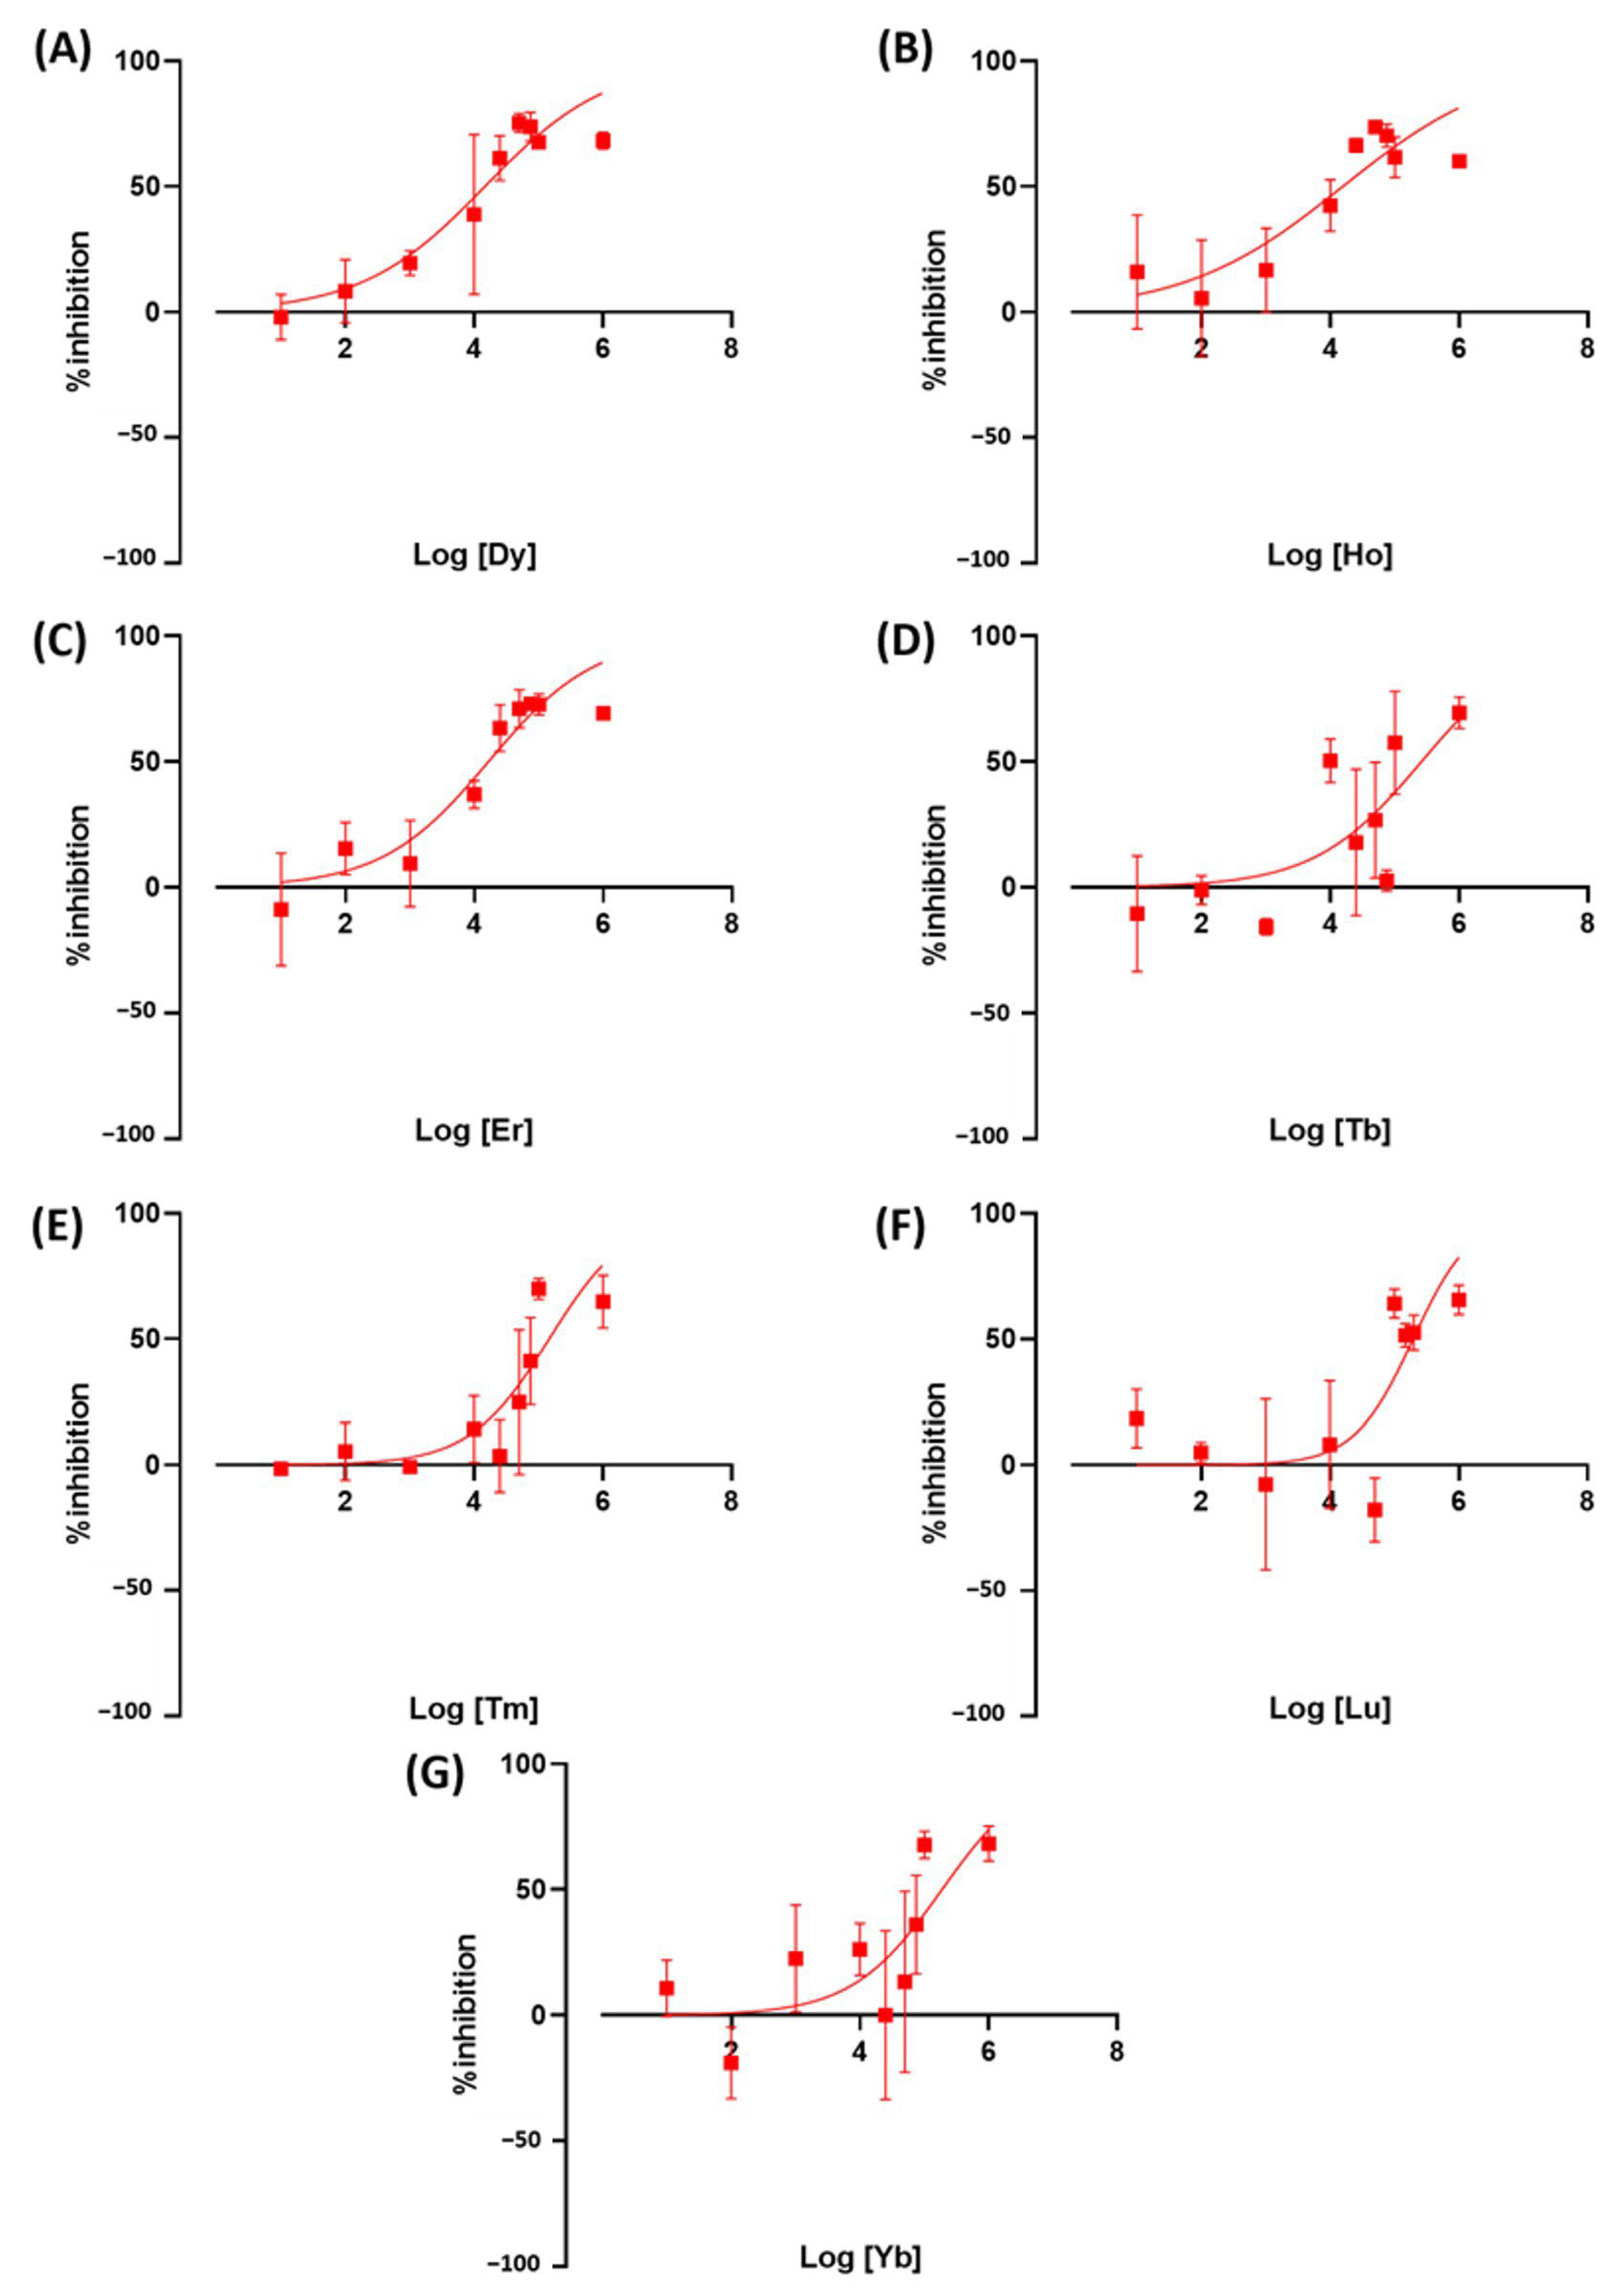
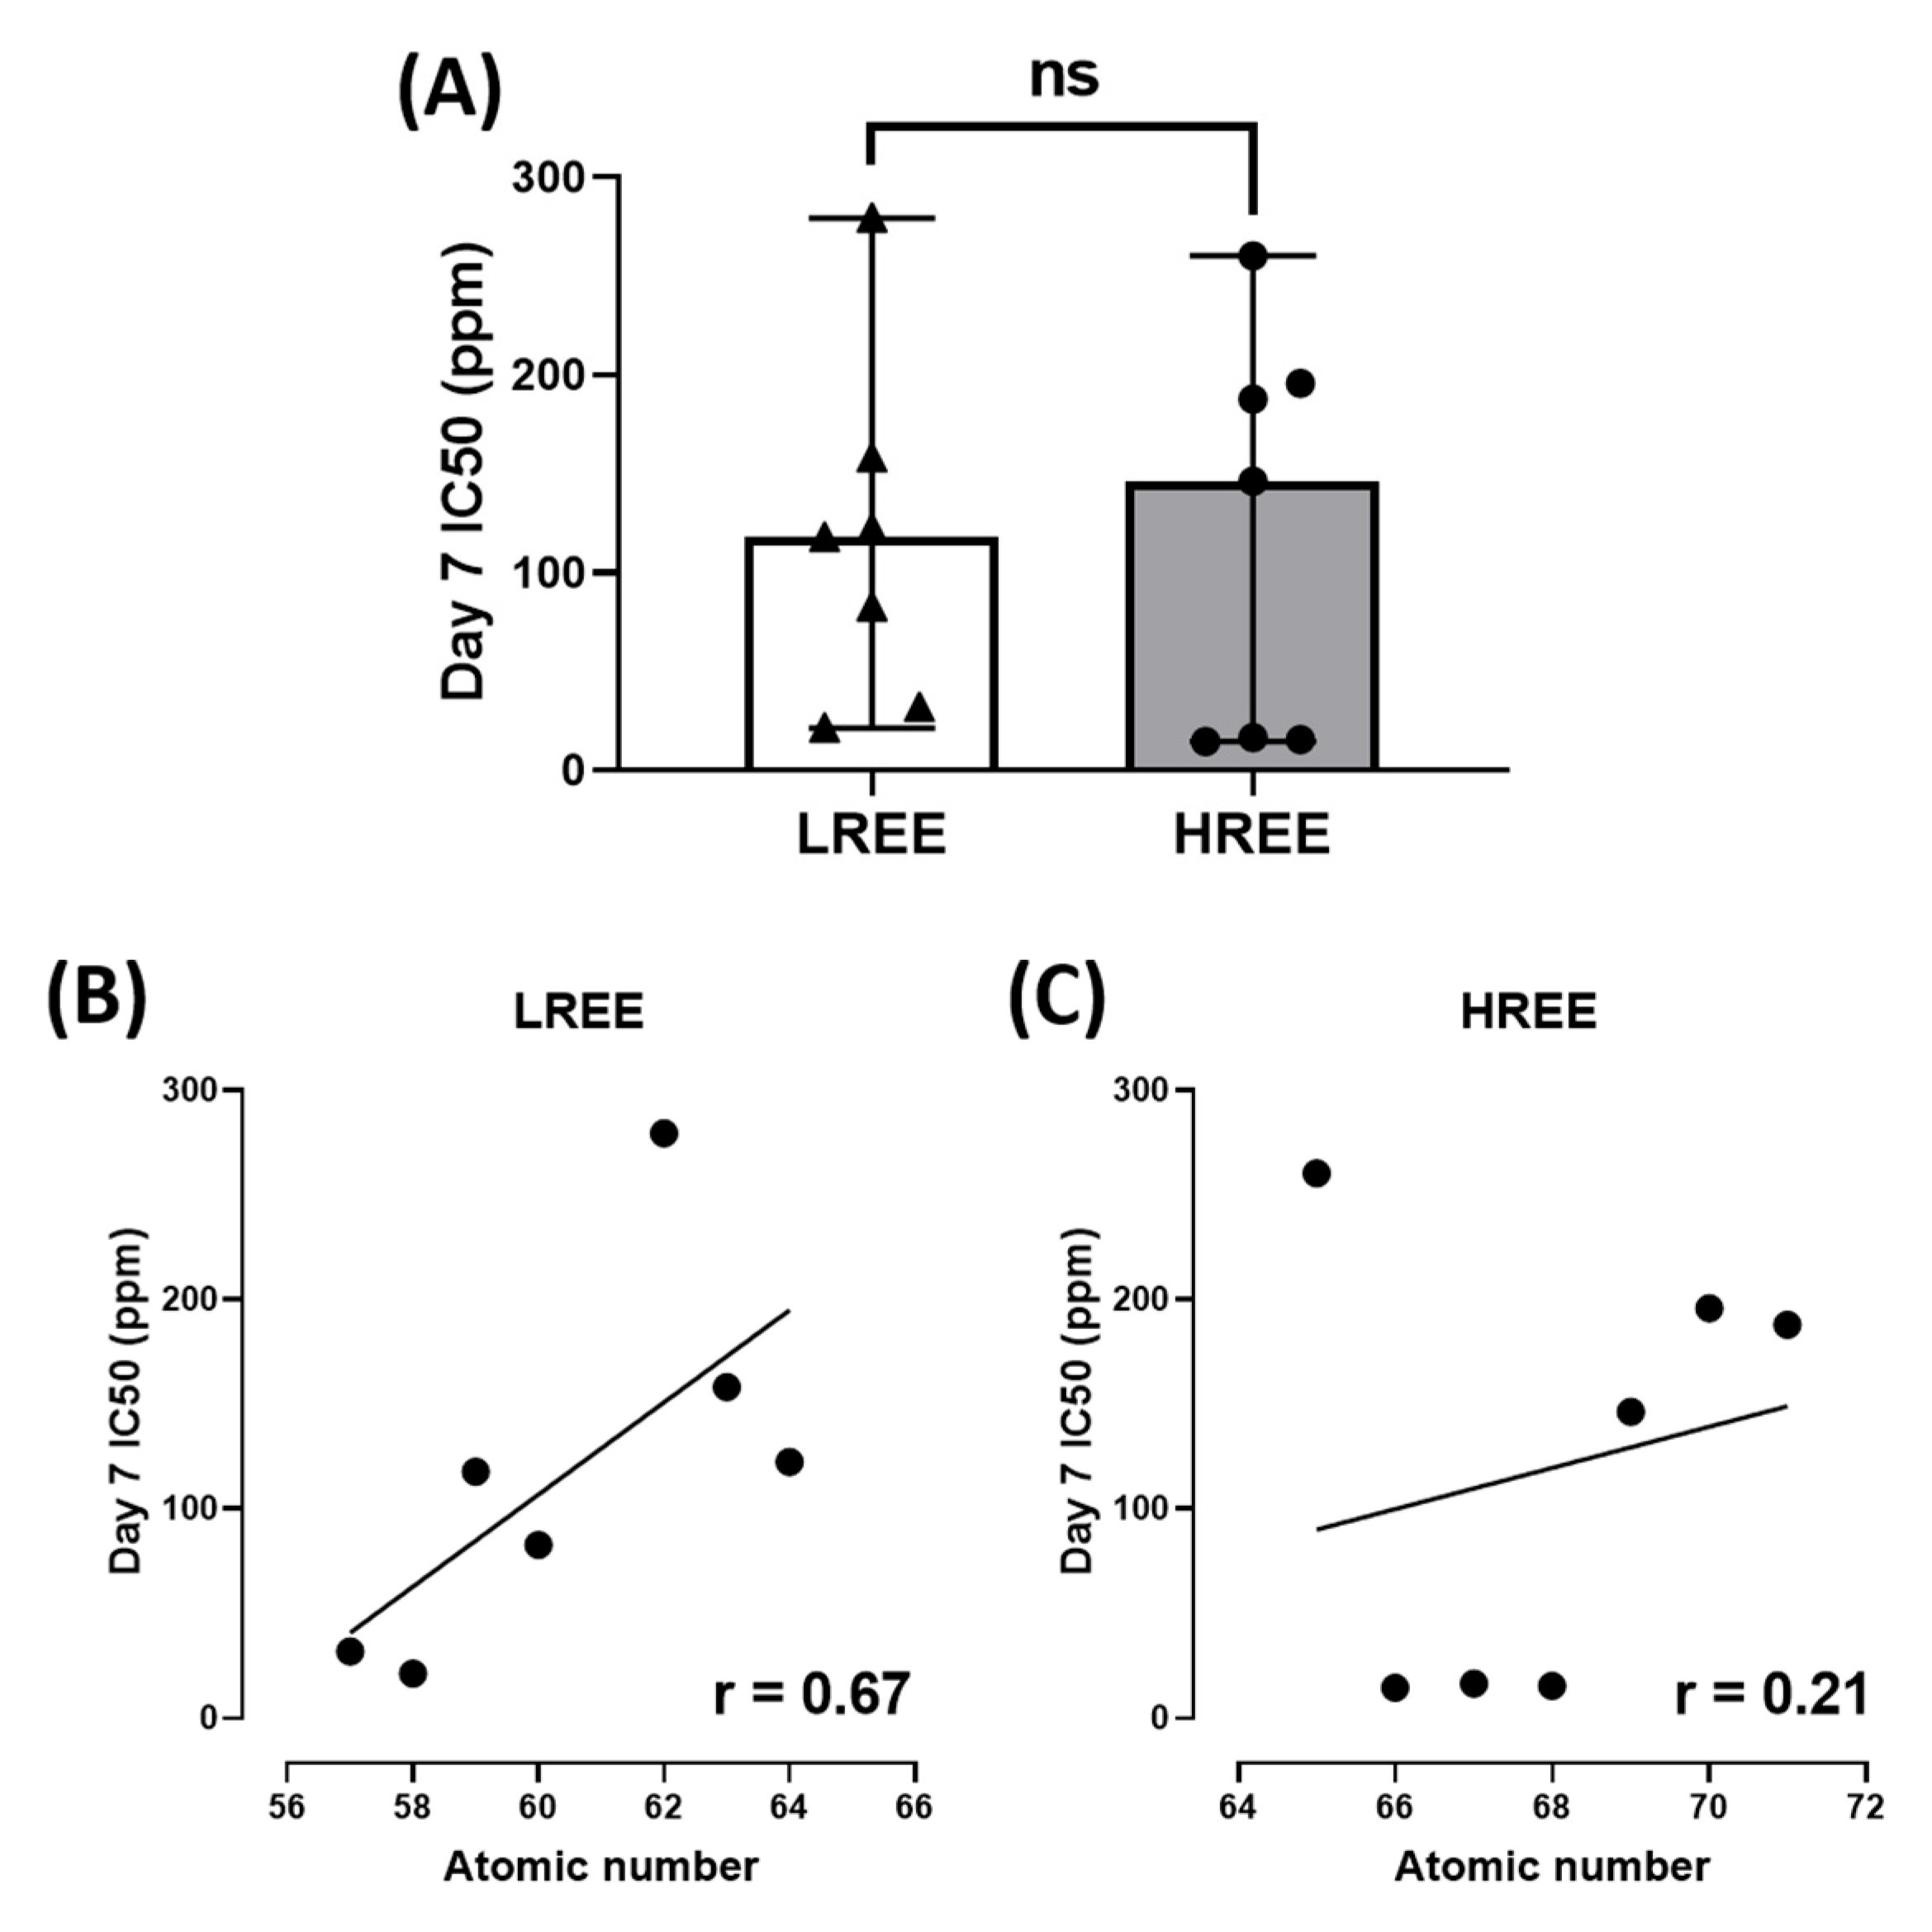
3.5. Exposure to Rare Earth Elements Alters Wolffia globosa Growth Rate

We tested the toxicity of rare earth elements on duckweed as a newly emerging contaminant. Exposure to REE resulted in an altered Wolffia growth rate. Ce was the most toxic LREE at IC50 = 21.3 ppm, followed by La at 31.9 ppm. Both metals are comparable to or more toxic than the herbicides we used as a positive control in this study. The other metals, Pr, Gd, Nd, Sm, and Eu, showed to be less toxic with IC50 values at 117.8, 122.4, 82.68, 279.4, and 158.2 ppm, respectively (Figure 6). These results showed that there is a very high variation in toxicity between LREE. HREE results showed Dy, Ho, and Er to be more toxic than other REEs and herbicides used in this study. The IC50 value of these REEs is 14.6, 15.5, and 16.5, respectively. The other HREE showed similar toxicity to less toxic LREEs. Tb, Tm, Lu, and Yb have IC50 values of 260.3, 146.3, 195.7, and 187.9 (Figure 7).
In addition, we also observed the overall toxicity between groups and their IC50 with their respective atomic number. The overall toxicity between LREE and HREE is similar (Figure 8A). The linear regression analysis suggests that Day 7 IC50 of LREE has a moderate correlation to their atomic number with r = 0.67 compared to HREE, which has a very weak correlation with r = 0.21. We also tested the relation between Day 7 IC50 of LREE and HREE to Lanthanides (Ln) Milliken as well as Aromatic Cavg charges. The Ln Milliken and Aromatic Cavg charge values were obtained from the previous study (Table 2) [38]. The result showed no correlation between the Ln Milliken charge to the Day 7 IC50 value for both LREE (r = 0.13) and HREE (r = −0.05). On the other hand, the Aromatic Cavg charge result showed a moderate negative correlation for LREE (r = −0.51) and a weak positive correlation for HREE (r = 0.40) (Figure 9).

4. Discussion

In this study, we utilized StarDist for Wolffia globosa frond counting. The idea of using StarDist came from our previous study to count Tetrahymena cells with a circular shape [35]. The result of Wolffia detection using StarDist showed promising results, as presented in Figure 2, with several misdetections due to light reflections on some parts of the microplate and reflection of Wolffia. However, the number of misdetections is small compared to the number of Wolffia fronds, which means the counting result might not be affected significantly. Therefore, the counting result can be used reliably. We also implemented a Python-based script in our workflow to automate the Excel calculation process, which reduces the workload by around ~50% compared to manual operation.
In order to further test the performance of the proposed Wolffia counting method using StarDist, herbicides such as Glyphosate and Glufosinate were used. Glyphosate is an herbicide commonly used in aquatic environments. Its active compound, glyphosate, inhibits 3-enolpyruvylshikimic acid 5-phosphate synthase (EPSPS), an essential enzyme in Aromatic amino acids and compounds biosynthesis [41]. Glufosinate is a broad-spectrum herbicide used to target glyphosate-resistant weeds. Exposure to Glufosinate increases reactive oxygen species levels in plants due to the disruption of photorespiration and light reactions of photosynthesis. In addition, it also inhibits glutamine synthetase (GS), which has a vital role in ammonia detoxification and amino acid metabolism in plants [42]. Exposing Wolffia to herbicides resulted in growth inhibition and bleaching of Wolffia fronds. A similar result was also observed in Lemna minor, another species of duckweed that the OECD has recognized as a plant model for water toxicity tests. The study showed dry weight loss and chlorophyll in L. minor fronds after seven-day exposure to glyphosate [43]. A similar result was also reported in several other plants [44,45,46]. In order to identify fronds chlorosis, we performed a manual observation of the plants before recording. This is due to the limitation of the recording contraption, which only records the video in black and white.
The result of REE exposure showed varied results. Several REEs showed higher toxicity compared to those of herbicides, namely Dysprosium, Holmium, and Erbium are the most toxic REEs on duckweed, followed by Cerium, then Lanthanum, which has comparable toxicity to the herbicides (Table 2). Most REE toxicity has not been specified. However, previous studies suggest the toxicity was due to the release of free metal ions [47], which might cause chlorosis [48].
There needs to be more information regarding REEs toxicity in aquatic animal models except for La, Ce, and Gd [49]. Previous studies reported REEs as an analog to calcium. The abundance of REEs or calcium inhibits potassium uptake for a short time, which causes chlorosis. This property causes REEs to replace Ca from many enzymes, which interfere with the physiological functions of Ca. In addition to being a competitor in enzymatic functions, La3+, the most common REE to be investigated, was known to be a potent Ca2+ transport inhibitor, causing deficiency due to a dysfunctional cytoplasm membrane.
The result of our study also indicates a different toxicity profile compared to a previous comprehensive study of REE on zebrafish embryos. While a previous study on zebrafish embryos suggested LREE to be more toxic than HREE [38], there seems to be no statistical difference between the toxicity of LREE and HREE on W. globosa (Figure 8A). There is a moderate correlation between their atomic number to Day 7 IC50 for LREE (r = 0.67) and a very weak correlation for HREE (r = 0.21) (Figure 8B,C). However, there is no correlation between the Ln Milliken charge to both LREE (r = 0.13) and HREE (r = −0.05). Aromatic Cavg charge showed a moderate negative correlation to Day 7 IC50 for LREE (r = −0.51) and a weak correlation for HREE (r = 0.40) (Figure 9). These results further support the dissimilarity between the results of the previous study on zebrafish embryos and this study on W. globosa. The order of toxicity from the most toxic to least toxic on W. globosa is Dysprosium > Erbium > Holmium > Cerium > Lanthanum > Glufosinate > Glyphosate > Neodymium > Praseodymium > Gadolinium > Thulium > Europium > Ytterbium > Lutetium > Terbium > Samarium. This result showed the potential of W. globosa to have a high tolerance to REE, which was also observed in heavy metals and their high potential in absorbing those metals [22].

5. Conclusions

In conclusion, we can provide a counting tool for duckweed fronds using StarDist with respectable performance. We also tested the performance of our tool on the inhibitory property of chemicals of emerging concerns which are rare earth elements. The result of rare earth elements exposure showed Dysprosium, Erbium, Holmium, Lanthanum, and Cerium to be the more toxic of the 14 rare earth elements that we tested with IC50 values at 14.6, 15.5, 16.5, 21.3, and 31.9 ppm respectively, which showed higher toxicity compared to two kinds of herbicides, Glufosinate and Glyphosate with IC50 values of 34.0 and 36.4 ppm respectively. In addition to the IC50 test result, there also seems to only be a weak to medium correlation between the atomic number, Ln Milliken charge, and Cavg charge to the IC50 values that we had obtained. Through this result, we hope to increase the limited knowledge and awareness of REE toxicity. Therefore, through this study, we hope we can provide a free-to-use and automatic alternative tool for future aquatic toxicology studies using Wolffia globosa frond-counting while highlighting REE toxicity on aquatic plant models.

Supplementary Materials

The following supporting information can be downloaded at: https://www.mdpi.com/article/10.3390/toxics11080680/s1, File S1: InhibitionAnalyzer1.5.zip, File S2: TF_SavedModel_small_duckweed_LoRes.zip, File S3: StarDist SOP.pptx.

Author Contributions

Conceptualization, K.A.K. and C.-D.H.; Methodology, K.A.K.; Software, A.F. and C.T.L.; Formal analysis, Y.-T.L.; Investigation, Y.-T.L., N.M., C.-H.H., T.-S.C. and C.-D.H.; Resources, C.-D.H.; Data curation, A.F., M.J.M.R. and C.-C.T.; Writing—original draft preparation, K.A.K. and C.-D.H.; Writing—review and editing, C.-C.T., M.J.M.R.; Supervision, T.-S.C. and C.-D.H.; Project administration, T.-S.C. and C.-D.H. All authors have read and agreed to the published version of the manuscript.

Funding

This research receives no external funding.

Data Availability Statement

Data will be made available on request.

Acknowledgments

We appreciate Lemnaceae Fermentation, Inc. on providing biological samples.

Conflicts of Interest

The authors declare that they have no known competing financial interests or personal relationships that could have appeared to influence the work reported in this paper.

References

  1. Vandermeersch, G.; Lourenço, H.M.; Alvarez-Muñoz, D.; Cunha, S.; Diogène, J.; Cano-Sancho, G.; Sloth, J.J.; Kwadijk, C.; Barcelo, D.; Allegaert, W. Environmental contaminants of emerging concern in seafood–European database on contaminant levels. Environ. Res. 2015, 143, 29–45. [Google Scholar] [CrossRef] [PubMed]
  2. Espinoza-Montero, P.J.; Vega-Verduga, C.; Alulema-Pullupaxi, P.; Fernández, L.; Paz, J.L. Technologies Employed in the Treatment of Water Contaminated with Glyphosate: A Review. Molecules 2020, 25, 5550. [Google Scholar] [CrossRef] [PubMed]
  3. Geng, Y.; Jiang, L.; Zhang, D.; Liu, B.; Zhang, J.; Cheng, H.; Wang, L.; Peng, Y.; Wang, Y.; Zhao, Y. Glyphosate, aminomethylphosphonic acid, and glufosinate ammonium in agricultural groundwater and surface water in China from 2017 to 2018: Occurrence, main drivers, and environmental risk assessment. Sci. Total Environ. 2021, 769, 144396. [Google Scholar] [CrossRef] [PubMed]
  4. Bridi, D.; Altenhofen, S.; Gonzalez, J.B.; Reolon, G.K.; Bonan, C.D. Glyphosate and Roundup® alter morphology and behavior in zebrafish. Toxicology 2017, 392, 32–39. [Google Scholar] [CrossRef]
  5. Xiong, G.; Deng, Y.; Li, J.; Cao, Z.; Liao, X.; Liu, Y.; Lu, H. Immunotoxicity and transcriptome analysis of zebrafish embryos in response to glufosinate-ammonium exposure. Chemosphere 2019, 236, 124423. [Google Scholar] [CrossRef]
  6. Malhotra, N.; Hsu, H.-S.; Liang, S.-T.; Roldan, M.J.M.; Lee, J.-S.; Ger, T.-R.; Hsiao, C.-D. An updated review of toxicity effect of the rare earth elements (REEs) on aquatic organisms. Animals 2020, 10, 1663. [Google Scholar] [CrossRef]
  7. Ali, Z.; Waheed, H.; Kazi, A.G.; Hayat, A.; Ahmad, M. Duckweed: An efficient hyperaccumulator of heavy metals in water bodies. In Plant Metal Interaction; Elsevier: Amsterdam, The Netherlands, 2016; pp. 411–429. [Google Scholar]
  8. Landolt, E. Biosystematic Investigations in the Family of Duckweeds (Lemnaceae); Veröffentlichungen des Geobotanischen Institutes der ETH, Stiftung Rübel: Zürich, Switzerland, 1980. [Google Scholar]
  9. Sree, K.S.; Bog, M.; Appenroth, K.J. Taxonomy of duckweeds (Lemnaceae), potential new crop plants. Emir. J. Food Agric. 2016, 28, 291–302. [Google Scholar] [CrossRef] [Green Version]
  10. Baudo, R.; Foudoulakis, M.; Arapis, G.; Perdaen, K.; Lanneau, W.; Paxinou, A.-C.; Kouvdou, S.; Persoone, G. History and sensitivity comparison of the Spirodela polyrhiza microbiotest and Lemna toxicity tests. Knowl. Manag. Aquat. Ecosyst. 2015, 416, 23. [Google Scholar] [CrossRef] [Green Version]
  11. Xu, Y.; Ma, S.; Huang, M.; Peng, M.; Bog, M.; Sree, K.S.; Appenroth, K.-J.; Zhang, J. Species distribution, genetic diversity and barcoding in the duckweed family (Lemnaceae). Hydrobiologia 2015, 743, 75–87. [Google Scholar] [CrossRef]
  12. Hillman, W.S.; Culley, D.D. The uses of duckweed: The rapid growth, nutritional value, and high biomass productivity of these floating plants suggest their use in water treatment, as feed crops, and in energy-efficient farming. Am. Sci. 1978, 66, 442–451. [Google Scholar]
  13. Tang, J.; Zhang, Y.; Cui, Y.; Ma, J. Effects of a rhizobacterium on the growth of and chromium remediation by Lemna minor. Environ. Sci. Pollut. Res. 2015, 22, 9686–9693. [Google Scholar] [CrossRef]
  14. Hillman, W.S. The Lemnaceae, or duckweeds. Bot. Rev. 1961, 27, 221–287. [Google Scholar] [CrossRef]
  15. Shoji, R. Effect of dissolved organic matter source on phytotoxicity to Lemna aequinoctialis. Aquat. Toxicol. 2008, 87, 210–214. [Google Scholar] [CrossRef]
  16. Blinová, L.; Bartošová, A.; Sirotiak, M. Unconventional type of biomass suitable for the production of biofuels. Adv. Mater. Res. 2014, 860, 514–517. [Google Scholar] [CrossRef]
  17. Radić, S.; Babić, M.; Škobić, D.; Roje, V.; Pevalek-Kozlina, B. Ecotoxicological effects of aluminum and zinc on growth and antioxidants in Lemna minor L. Ecotoxicol. Environ. Saf. 2010, 73, 336–342. [Google Scholar] [CrossRef]
  18. Wang, W.; Williams, J.M. Screening and biomonitoring of industrial effluents using phytotoxicity tests. Environ. Toxicol. Chem. Int. J. 1988, 7, 645–652. [Google Scholar] [CrossRef]
  19. Wang, W.; Williams, J.M. The use of phytotoxicity tests (common duckweed, cabbage, and millet) for determining effluent toxicity. Environ. Monit. Assess. 1990, 14, 45–58. [Google Scholar] [CrossRef]
  20. Hartman, W.A.; Martin, D.B. Effect of suspended bentonite clay on the acute toxicity of glyphosate to Daphnia pulex and Lemna minor. Bull. Environ. Contam. Toxicol. 1984, 33, 355–361. [Google Scholar] [CrossRef]
  21. Fekete, A.; Riemer, D.; Motto, H. A bioassay using common duckweed to evaluate the release of available phosphorus from pond sediments. J. Aquat. Plant Manag. 1976, 14, 19–25. [Google Scholar]
  22. Grag, P.; Chandra, P. The duckweed Wolffia globosa as an indicator of heavy metal pollution: Sensitivity to Cr and Cd. Environ. Monit. Assess. 1994, 29, 89–95. [Google Scholar] [CrossRef]
  23. Ifayefunmi, O.S.; Mirseabasov, O.A.; Synzynys, B.I. Indirect assessment of internal irradiation from tritium decay on Lemna minor duckweed. Nucl. Eng. Technol. 2021, 53, 1991–1999. [Google Scholar] [CrossRef]
  24. Cayuela, M.L.; Millner, P.; Slovin, J.; Roig, A. Duckweed (Lemna gibba) growth inhibition bioassay for evaluating the toxicity of olive mill wastes before and during composting. Chemosphere 2007, 68, 1985–1991. [Google Scholar] [CrossRef] [PubMed]
  25. Oláh, V.; Hepp, A.; Vaca, N.Y.G.; Tamás, M.; Mészáros, I. Retrospective analyses of archive phytotoxicity test data can help in assessing internal dynamics and stability of growth in laboratory duckweed cultures. Aquat. Toxicol. 2018, 201, 40–46. [Google Scholar] [CrossRef] [PubMed]
  26. Jansen, M.; Nagel, K. LemnaTec Scanalyzer a Versatile Tool for Duckweed Research and Testing. Duckweed Forum 2016, 4, 272–303. [Google Scholar]
  27. Haffner, O.; Kučera, E.; Drahoš, P.; Cigánek, J.; Kozáková, A.; Urminská, B. Lemna minor bioassay evaluation using computer image analysis. Water 2020, 12, 2207. [Google Scholar] [CrossRef]
  28. Sparavigna, A.C. On the Use of ImageJ Segmentation. Available online: https://zenodo.org/record/3629411 (accessed on 5 June 2023).
  29. Boonyapookana, B.; Upatham, E.S.; Kruatrachue, M.; Pokethitiyook, P.; Singhakaew, S. Phytoaccumulation and Phytotoxicity of Cadmium and Chromium in Duckweed Wolffia globosa. Int. J. Phytoremediation 2002, 4, 87–100. [Google Scholar] [CrossRef]
  30. Shi, J.; Abid, A.D.; Kennedy, I.M.; Hristova, K.R.; Silk, W.K. To duckweeds (Landoltia punctata), nanoparticulate copper oxide is more inhibitory than the soluble copper in the bulk solution. Environ. Pollut. 2011, 159, 1277–1282. [Google Scholar] [CrossRef] [Green Version]
  31. Tabou, T.T.; Baya, D.T.; Eyul’anki, D.M.; Vasel, J.L. Monitoring the influence of light intensity on the growth and mortality of duckweed (Lemna minor) through digital images processing. Biotechnol. Agron. Soc. Environ. 2014, 18, 37–48. [Google Scholar]
  32. Yamakawa, Y.; Jog, R.; Morikawa, M. Effects of co-inoculation of two different plant growth-promoting bacteria on duckweed. Plant Growth Regul. 2018, 86, 287–296. [Google Scholar] [CrossRef] [Green Version]
  33. Tsui, T.-H.; van Loosdrecht, M.C.M.; Dai, Y.; Tong, Y.W. Machine learning and circular bioeconomy: Building new resource efficiency from diverse waste streams. Bioresour. Technol. 2023, 369, 128445. [Google Scholar] [CrossRef]
  34. Smith, M.A.; Westerling-Bui, T.; Wilcox, A.; Schwartz, J. Screening for bone marrow cellularity changes in cynomolgus macaques in toxicology safety studies using artificial intelligence models. Toxicol. Pathol. 2021, 49, 905–911. [Google Scholar] [CrossRef]
  35. Kurnia, K.A.; Sampurna, B.P.; Audira, G.; Juniardi, S.; Vasquez, R.D.; Roldan, M.J.M.; Tsao, C.-C.; Hsiao, C.-D. Performance Comparison of Five Methods for Tetrahymena Number Counting on the ImageJ Platform: Assessing the Built-in Tool and Machine-Learning-Based Extension. Int. J. Mol. Sci. 2022, 23, 6009. [Google Scholar] [CrossRef]
  36. Schmidt, U.; Weigert, M.; Broaddus, C.; Gene, M. Cell Detection with Star-Convex Polygons. In Proceedings of the Medical Image Computing and Computer Assisted Intervention-{MICCAI} 2018—21st International Conference, Granada, Spain, 16–20 September 2018; pp. 265–273. [Google Scholar]
  37. Weigert, M.; Schmidt, U.; Haase, R.; Sugawara, K.; Myers, G. Star-convex Polyhedra for 3D Object Detection and Segmentation in Microscopy. In Proceedings of the IEEE Winter Conference on Applications of Computer Vision (WACV), Snowmass, CO, USA, 1–5 March 2020. [Google Scholar]
  38. Lin, Y.-T.; Liu, R.-X.; Audira, G.; Suryanto, M.E.; Roldan, M.J.M.; Lee, J.-S.; Ger, T.-R.; Hsiao, C.-D. Lanthanides Toxicity in Zebrafish Embryos Are Correlated to Their Atomic Number. Toxics 2022, 10, 336. [Google Scholar] [CrossRef]
  39. Kostopoulou, S.; Ntatsi, G.; Arapis, G.; Aliferis, K.A. Assessment of the effects of metribuzin, glyphosate, and their mixtures on the metabolism of the model plant Lemna minor L. applying metabolomics. Chemosphere 2020, 239, 124582. [Google Scholar] [CrossRef]
  40. Michel, A.; Johnson, R.D.; Duke, S.O.; Scheffler, B.E. Dose-response relationships between herbicides with different modes of action and growth of Lemna paucicostata: An improved ecotoxicological method. Environ. Toxicol. Chem. 2004, 23, 1074–1079. [Google Scholar] [CrossRef]
  41. Schönbrunn, E.; Eschenburg, S.; Shuttleworth, W.A.; Schloss, J.V.; Amrhein, N.; Evans, J.N.S.; Kabsch, W. Interaction of the herbicide glyphosate with its target enzyme 5-enolpyruvylshikimate 3-phosphate synthase in atomic detail. Proc. Natl. Acad. Sci. USA 2001, 98, 1376–1380. [Google Scholar] [CrossRef]
  42. Takano, H.K.; Dayan, F.E. Glufosinate-ammonium: A review of the current state of knowledge. Pest Manag. Sci. 2020, 76, 3911–3925. [Google Scholar] [CrossRef]
  43. Sikorski, Ł.; Baciak, M.; Bęś, A.; Adomas, B. The effects of glyphosate-based herbicide formulations on Lemna minor, a non-target species. Aquat. Toxicol. 2019, 209, 70–80. [Google Scholar] [CrossRef]
  44. Eker, S.; Ozturk, L.; Yazici, A.; Erenoglu, B.; Romheld, V.; Cakmak, I. Foliar-Applied Glyphosate Substantially Reduced Uptake and Transport of Iron and Manganese in Sunflower (Helianthus annuus L.) Plants. J. Agric. Food Chem. 2006, 54, 10019–10025. [Google Scholar] [CrossRef] [PubMed] [Green Version]
  45. Fuchs, M.A.; Geiger, D.R.; Reynolds, T.L.; Bourque, J.E. Mechanisms of glyphosate toxicity in velvetleaf (Abutilon theophrasti medikus). Pestic. Biochem. Physiol. 2002, 74, 27–39. [Google Scholar] [CrossRef]
  46. Reddy, K.N.; Rimando, A.M.; Duke, S.O. Aminomethylphosphonic Acid, a Metabolite of Glyphosate, Causes Injury in Glyphosate-Treated, Glyphosate-Resistant Soybean. J. Agric. Food Chem. 2004, 52, 5139–5143. [Google Scholar] [CrossRef] [PubMed]
  47. Brown, P.H.; Rathjen, A.H.; Graham, R.D.; Tribe, D.E. Rare earth elements in biological systems. Handb. Phys. Chem. Rare Earths 1990, 13, 423–452. [Google Scholar]
  48. Zicari, M.A.; d’Aquino, L.; Paradiso, A.; Mastrolitti, S.; Tommasi, F. Effect of cerium on growth and antioxidant metabolism of Lemna minor L. Ecotoxicol. Environ. Saf. 2018, 163, 536–543. [Google Scholar] [CrossRef] [PubMed]
  49. Blinova, I.; Muna, M.; Heinlaan, M.; Lukjanova, A.; Kahru, A. Potential hazard of lanthanides and lanthanide-based nanoparticles to aquatic ecosystems: Data gaps, challenges and future research needs derived from bibliometric analysis. Nanomaterials 2020, 10, 328. [Google Scholar] [CrossRef] [Green Version]
Figure 1. Experimental workflow of duckweed quantification by using the StarDist method. Wolffia globosa StarDist model was trained using pre-annotated Wolffia images in QuPath. After the model was trained, it can be applied to similar Wolffia images using StarDist plugin in ImageJ, to be used for counting duckweed fronds. The counting result was then exported to Microsoft Excel 2016 and processed using a Python-based script to reduce the overall workload. Finally, the data were statistically analyzed using GraphPad Prism.
Toxics 11 00680 g001
Figure 2. Original (A) and segmentation result (B) of common watermeal using ImageJ build of StarDist. StarDist plugin in ImageJ is able to detect the Wolffia globosa fronds in 6-well plates. However, there are several misdetections caused by fronds reflection on the sides of the wells. The different colors in the image marks individual Wolffia globosa fronds.
Toxics 11 00680 g002
Figure 3. Bland–Altman plots of manual counting compared to different overlap/NMS threshold values; 0.1 (A), 0.2 (B), 0.3 (C), 0.4 (D), 0.5 (E), 0.6 (F), 0.7 (G), 0.8 (H), and 0.9 (I). The black dotted line represents Mean Difference between manual counting and StarDist at different thresholds, while the blue/red dotted line represents the upper/lower limit of (n = 30).
Toxics 11 00680 g003
Figure 4. The inhibition rate of W. globosa at day seven after exposure to different kinds of herbicides; Glyphosate (A) and Glufosinate (B) to determine the median inhibitory concentration (IC50), data are presented as Mean ± 95% CI (n = 3).
Toxics 11 00680 g004
Figure 5. Wolffia globosa growth at Day 0 (A) and Day 7 (B), Top rows are the control group, and the bottom rows are exposed to Herbicides (Glufosinate) at 100 ppm. Bleaching of Wolffia fronds was observed after exposure to Herbicides (Glufosinate).
Toxics 11 00680 g005
Figure 6. The inhibition rate of W. globosa at day seven after exposure to different kinds of LREE; Lanthanum (A), Cerium (B), Praseodymium (C), Gadolinium (D), Neodymium (E), Samarium (F) and Europium (G) to determine the median inhibitory concentration (IC50), data are presented as Mean ± 95% CI (n = 3).
Toxics 11 00680 g006
Figure 7. The inhibition rate of W. globosa at day seven after exposure to different kinds of HREE; Dysprosium (A), Holmium (B), Erbium (C), Terbium (D), Thulium (E), Lutetium (F) and Ytterbium (G) to determine the median inhibitory concentration (IC50), data are presented as Mean ± 95% CI (n = 3).
Toxics 11 00680 g007
Figure 8. Comparison of overall W. globosa Day 7 IC50 between LREE and HREE, data are calculated using unpaired t-test and presented as Median ± 95% CI (ns = not significant difference) (A). Linear regression analysis showing the relation between atomic numbers to their Day 7 IC50 for LREE with r = 0.67 (B) and HREE with r = 0.21 (C).
Toxics 11 00680 g008
Figure 9. Linear regression analysis on the relation between Ln Milliken charge to Day 7 IC50 for LREE (A) and HREE (B) and Linear regression analysis on the relation between Cavg charge to Day 7 IC50 for LREE (C) and HREE (D) Overall Day 7 IC50 comparison between LREE and HREE, data are calculated using unpaired t-test and presented as Median ± 95% CI.
Toxics 11 00680 g009
Table 1. Comparison of available Duckweed fronds counting tool/method.
Plant SpeciesEndpointsManual/AutoSoftware and References
Wolffia globosaDuckweed fronds counting based on the size and shape of objectsAutomaticQuPath (pre-training) and StarDist (Training and processing) (This study)
Wolffia globosaEC50 determination through biomass weightManualNone [29]
Lemna gibbaDuckweed frond counting based on image recording and frond area interpretation based on color intensityAutomaticNikon ACT-2U (Area measurement) and Assess: Image Analysis Software for Plant Disease Quantification (Frond area interpretation) [24]
Lemna minorDifferentiation between live and dead duckweedAutomaticNI Vision Assistant [27]
Landoltia punctataManual counting using a magnifying glassManualNone [30]
Lemna minorDifferentiation between live and dead duckweed and countingAutomaticACD-See (pre-processing) and Image Pro-Plus (processing) [31]
Lemna minorDuckweed fronds countingManualNone [32]
Table 2. Day 7 IC50 values of herbicides and rare earth elements, Lanthanide’s charge, and Aromatic Cavg charge of all tested rare earth elements.
CompoundAtomic NumberValence ElectronGroupDay 7 IC50 (ppm)Ln Milliken ChargeAromatic Cavg Charge
Glyphosate--Herbicide36.4--
Glufosinate--Herbicide34.0--
Lanthanum575d16s2LREE31.91.900−0.432
Cerium584f15d16s2LREE21.31.905−0.434
Praseodymium594f36s2LREE117.81.980−0.441
Neodymium604f46s2LREE82.71.938−0.439
Samarium624f66s2LREE279.41.946−0.443
Europium634f76s2LREE158.21.877−0.443
Gadolinium644f75d16s2LREE122.42.158−0.455
Terbium654f96s2HREE260.32.190−0.45
Dysprosium664f106s2HREE14.62.138−0.454
Holmium674f116s2HREE16.52.168−0.458
Erbium684f126s2HREE15.52.175−0.461
Thulium694f136s2HREE146.32.117−0.461
Ytterbium704f146s2HREE195.82.004−0.455
Lutetium714f145d16s2HREE187.92.254−0.460
LREE = Light rare earth element; HREE = Heavy rare earth element. Ln Milliken charge: the calculated Milliken charge of Lanthanide when Lanthanide forms the model complex [38]. Aromatic Cavg charge: The average Milliken charge of the carbons on the Aromatic ring in the Ln complex. “Reprinted/adapted with permission from Ref. [38]. 2022, Lin, YT”.
Disclaimer/Publisher’s Note: The statements, opinions and data contained in all publications are solely those of the individual author(s) and contributor(s) and not of MDPI and/or the editor(s). MDPI and/or the editor(s) disclaim responsibility for any injury to people or property resulting from any ideas, methods, instructions or products referred to in the content.

