Article

A New Advanced and Validated Method for the Determination of Potentially Toxic Metals and Trace and Ultra-Trace Elements in Peritoneal Fluid to Assess the Health Risks of Women with Gynecological Pathologies

by
Andrea López-Botella
1,2,3,†,
Raquel Sánchez
3,†,
José-Luis Todolí-Torró
3,*,
María José Gómez-Torres
2,
Irene Velasco
1,2,* and
Maribel Acién
1,4
1
Service of Obstetrics and Gynecology, Unit of Human Reproduction, FISABIO—San Juan University Hospital, Carretera Alicante-Valencia s/n, 03550 Alicante, Spain
2
Biotechnology Department, Faculty of Sciences, University of Alicante, Carretera San Vicente del Raspeig s/n, 03690 Alicante, Spain
3
Department of Analytical Chemistry, Nutrition and Food Sciences, University of Alicante, Carretera San Vicente del Raspeig s/n, 03690 Alicante, Spain
4
Gynecology Division, Faculty of Medicine, Miguel Hernández University, Carretera Alicante-Valencia s/n, 03550 Alicante, Spain
*
Authors to whom correspondence should be addressed.
These authors contributed equally to this work.
Toxics 2023, 11(5), 399; https://doi.org/10.3390/toxics11050399
Submission received: 22 March 2023 / Revised: 20 April 2023 / Accepted: 21 April 2023 / Published: 23 April 2023
(This article belongs to the Special Issue Environmental and Health Effects of Heavy Metal)

Abstract

:
Toxic metals found in the environment have been linked to female infertility and gynecological illnesses. Reliable analytical methods, such as inductively coupled plasma tandem mass spectrometry (ICP-MS/MS), are necessary to determine the elemental composition of biological samples. Currently, the multielemental profile of peritoneal fluid (PF) samples has not yet been established. Due to the complexity of the PF matrix, an ICP-MS/MS-based method has been optimized to mitigate matrix effects and spectral interferences. A dilution factor of 1:4 was the best option to mitigate matrix effects while keeping sensitivity at an appropriate level. A collision gas (He) was useful to lower the extent of spectral interferences for 56Fe, 52Cr, 63Cu, and 68Zn. An intermediate validation test was performed to evaluate accuracy, achieving recoveries ranging from 90 to 110%. The method was validated in terms of intermediate precision, reproducibility, and trueness, with an expanded uncertainty lower than 15%. Afterward, it was applied to perform the multielemental analysis of 20 PF samples. The concentrations for major analytes were up to 151 µg L−1. Meanwhile,209Bi, 111Cd, 52Cr, 55Mn, 95Mo, 60Ni, 208Pb, 118Sn, and 51V were present at concentrations included within the 1–10 µg L−1 range, while 59Co and 139La were found at concentrations below 1 µg L−1.

Graphical Abstract

1. Introduction

The chemical elements present in cells and tissues are divided into structural elements (or macroelements) and trace elements [1]. According to the WHO, trace elements can be classified into three groups based on their biological role in the body: essential trace elements, which include iodine (I), zinc (Zn), selenium (Se), copper (Cu), molybdenum (Mo), and chromium (Cr); probably essential trace elements, which include manganese (Mn), silicon (Si), nickel (Ni), boron (B), and vanadium (V); and potentially toxic elements, some of which may have essential biochemical functions, such as fluorine (F), lead (Pb), cadmium (Cd), mercury (Hg), arsenic (As), aluminum (Al), lithium (Li), and tin (Sn).
Today, a group of elements known as “heavy metals” are studied because of the concerns about their potential harmful effects on human health. Heavy metals are defined as naturally occurring elements that have a high atomic weight and a density at least five times greater than that of water [2]. There are about 51 different elements that could be included in this category. However, the imprecision of this term has led to controversy, and in environmental research studies the term “potentially toxic metal elements” (PTMEs) is preferred, as it is more precise [3,4]. These elements are widely distributed in the environment due to multiple industrial, domestic, agricultural, medical, and technological applications [5]. The environment, lifestyle, and occupational exposure are factors that may contribute to human exposure to PTMEs [6].
Recent literature has linked environmental contaminants to human reproductive health concerns, affecting the ability to conceive healthy offspring [7]. Although the contribution of environmental exposure to infertility remains unclear, there is plenty of evidence suggesting that it could negatively affect fertility, as studies involving occupational exposure and animal experiments have demonstrated [8]. Some environmental contaminants, such as PTMEs [9], are considered to be endocrine disrupting compounds (EDCs). EDCs are chemical pollutants capable of interacting with the functions of endogenous hormones, thereby disrupting metabolic pathways [10]. For instance, cadmium (Cd) is a PTME that activates the estrogen receptor alpha (Erα), leading to estrogenic activity [6,11]. Thus, it may be related to the development of estrogen-dependent diseases [6]. Cadmium’s estrogenic properties are thought to contribute to the etiology of leiomyoma [12]. However, the available data on Cd exposure and its association with multiple adverse reproductive health outcomes in women remain controversial and require further investigation [12]. In other gynecological diseases, such as endometrial (END-P) and exocervical polyps (EX-P), researchers found a significant accumulation of Al, Cd, Ni, and Pb (END-P) or Al, Cd, and Cu (EX-P) [13]. Women with END-P were found to have higher Cu/Zn serum ratio levels than controls [14], while decreased Zn and increased Pb levels in the blood were associated with endometriosis in Asian women [15]. Illnesses such as breast cancer, endometriosis, endometrial cancer, menstrual disorders, spontaneous abortions, pre-term deliveries, and stillbirths can be related to exposure to PTMEs [16]. Although the number of studies on the topic is limited, the available evidence suggests that PTMEs could increase the risk of female infertility [16,17].
Analytical data studying the accumulation of PTMEs in organs or tissues and biological fluids such as whole blood, serum, plasma, peritoneal fluid (PF), and follicular fluid—among others—can provide useful information about their correlation with the quality of the environment, lifestyle, and diet. Thus, sensitive analytical low-volume-consuming procedures must be developed to achieve this goal and to provide an individualized patient study, since there is evidence of the impact of the increasing environmental load of PTMEs on female fertility. PF, in particular, is an extracellular fluid, representing plasma ultrafiltration [18] and ovarian exudation, caused by increased permeability. This fluid suffers cyclic variations in both volume and steroid hormone levels, with the latter being higher in PF than in plasma [19]. Peritoneal fluid (PF) is a normal, sterile, lubricating fluid found in the pelvic cavity to reduce the friction between the organs and the abdominal wall. It is present in a small and variable volume (2–10 mL) in healthy people, both male and female. However, multiple conditions—such as liver dysfunction, infection, cancer, or inflammatory processes—can lead to an abnormal accumulation of this fluid [20]. In women, PF is produced by normally functioning ovaries, with cyclic variation in volume, and is reabsorbed by the mesothelial cells of the peritoneal cavity. However, ovary-related diseases—such as epithelial or metastatic ovarian cancer, benign ovarian fibroma, stromal hyperplasia, primary peritoneal serous carcinoma, endometriosis, or ruptured ovarian functional cysts, among others—should be kept in mind when women are found to have an excess of PF [20]. PF biomarkers could be useful for the diagnosis and prognosis of gynecological pathologies, as well as for the prediction of the medical response to a given treatment, as this fluid contains specific biomarkers of gynecological diseases [21].
Inductively coupled plasma optical emission spectrometry (ICP-OES) [22,23] and inductively coupled plasma mass spectrometry (ICP-MS) [24,25] are analytical techniques that are suitable for multielemental analysis of clinical samples. ICP-MS is considered to be the most suitable approach due to its high sensitivity and ability to provide extremely low limits of quantification for numerous analytes. Although its use is well documented on a wide variety of biological samples, the proper use of ICP-MS requires a good knowledge of the different types of spectral and non-spectral interferences, especially when dealing with biological samples [26]. Otherwise, inaccurate results can be obtained. To address this issue, inductively coupled plasma tandem mass spectrometry (ICP-MS/MS) has emerged as a useful method for overcoming spectral interferences caused by the main sample components [27].
This article presents a newly validated method for the detection and quantification of PTMEs, trace metals, and ultra-trace metals in peritoneal fluid (PF) samples from female patients with gynecological pathologies. To the best of our knowledge, this is the first time that ICP-MS/MS has been applied to the analysis of these kinds of sample. The method was optimized in terms of minimization of the consumed sample volume, removal of interferences, and shortening of the analysis time.

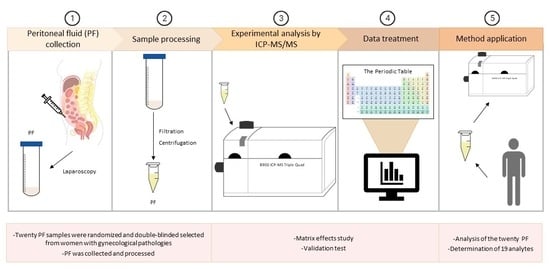
2. Materials and Methods

2.1. Instrumentation and Equipment

An Agilent 8900 ICP-MS/MS (Agilent Technologies, Santa Clara, CA, USA) equipped with an octopole reaction system (ORS) and axial acceleration technology was used throughout the present study. A micromist nebulizer (Glass Expansion, Weilburg, Germany) and a thermostatted double-pass spray chamber (Glass Expansion) were used to introduce the PF samples into the plasma. Table S1 in the Supplementary Materials summarizes the instrumental operating conditions.

2.2. Study Group and Sample Collection

Twenty PF samples were randomized and double-blinded for selection and collection between June 2020 and September 2022, from female patients recruited from the gynecology division of San Juan de Alicante University Hospital, Spain, during a surgical procedure in the operating room. The age of the female cohort ranged from 13 to 43 years (35.10 ± 8.53), and their body mass index ranged from 18.4 to 29.7 (22.30 ± 3.27) kg m−2. Each patient provided their informed consent after receiving a detailed explanation of the study. Ethical approval was granted by the Institutional Review Board of the Hospital Universitario San Juan de Alicante (Committee protocol code: 19/344, date of approval: 17 December 2019).
Samples were obtained by laparoscopy and collected by aspiration into sterile syringes. Then, the samples were filtered through a 20 µm filter to remove fibrin and cell aggregates and transferred to a glass centrifuge tube. After centrifugation (600× g, 10 min), the supernatants were stored in the dark at −20 °C until analysis.

2.3. Reagents and Solutions

Calibration curves were obtained from six standards prepared by proper dilution of a 100 mg L−1 multielemental stock solution (SCP33MS) purchased form SCP SCIENCE (Clark Graha, Baie D’Urfé, Canada). SCP33MS contained the following analytes: arsenic (As), barium (Ba), bismuth (Bi), cadmium (Cd), cobalt (Co), chromium (Cr), copper (Cu), iron (Fe), lanthanum (La), lithium (Li), manganese (Mn), molybdenum (Mo), nickel (Ni), lead (Pb), rubidium (Rb), tin (Sn), strontium (Sr), titanium (Ti), vanadium (V), and zinc (Zn). A solution containing four internal standard (IS) elements (germanium (Ge), scandium (Sc), rhodium (Rh), and rhenium (Re)) (SCP SCIENCE, Clark Graha, Baie D’Urfé, Canada) was continuously delivered and mixed online with the liquid sample stream. Internal standards were used to compensate for variations in sample introduction efficiencies, instrument drift, and sample matrix effects. Internal standards were added to all solutions at the same concentration level, including blank calibration standards and samples. The final concentration was 40 µg L−1. The calibration curves ranged from 0.05 to 1000 µg L−1.
The samples were diluted with ultrapure water (Millipore, El Paso, TX, USA) at two different dilution factors (1:2 and 1:4). A univariate optimization of the dilution factor was carried out (Section 3.1.1). According to the internal standardization procedure, the ratio of the signal for the analytes to that for the internal standard was plotted against the analyte concentration divided by the concentration of the internal standard.

2.4. Calculation of the Limit of Detection (LOD) and Quantification (LOQ)

The limits of detection (LOD) and quantification (LOQ) were calculated according to the 3sb and 10sb criteria, respectively.
L O D = 3 s b m
L O Q = 10 s b m
where sb is the standard deviation of 10 consecutive blank measurements and m is the slope of the calibration line.

2.5. Matrix Effects Study

In order to evaluate the extent of the matrix interferences, a recovery factor was calculated according to Equation (3):
R e c o v e r y = I n t e n s i t y s p i k e d s a m p l e I n t e n s i t y N o n s p i k e d s a m p l e I n t e n s i t y 50 p p b a q u e o u s s t a n d a r d × 100
To determine the analyte recoveries, a sample aliquot was spiked at a known analyte concentration (i.e., 100 µg L−1) with the multielemental standard. Non-spiked samples were taken as blanks.

2.6. Method Validation

Once the best dilution factor and experimental conditions were selected, a complete in-house validation according to the Eurachem guidelines [28] was carried out.
The linearity of the method was evaluated by performing calibration using eight elemental concentrations ranging from 0.05 to 1000 µg L−1. Five replicates were measured for each calibration solution. Coefficients of determination (R2) higher than 0.995 were obtained for the different calibration curves.
Trueness was assessed by a recovery study. A PF sample was spiked with a 50 µg L−1 multielemental solution, and five sub-samples were measured on four different days. The recovery rate was calculated as the ratio between the found and the spiked concentration values (Equation (3)).
The contribution of trueness to the uncertainty (ut) was calculated based on Equation (4):
u t = 100 × u R e c C T h e o r e t i c a l
where CTheoretical is the theoretical added concentration. The uncertainty of the measurement results on the spiked sample (uRec) combined the difference between the experimental value and the theoretical added concentration values (RMSBias) with the combined uncertainty of the spiked sample solution (uConc) and the uncertainty of the sample preparation (uPrep):
u R e c = R M S b i a s 2 + u C R e c o v e r y 2
u C R e c o v e r y = u C o n c 2 + u P r e p 2
Five sub-samples measured on four different days, using five different calibration curves, were used to determine the uncertainty contributions related to the repeatability and intermediate precision. One-way ANOVA was used to estimate the repeatability and intermediate precision as within-group and between-group standard deviations, respectively. The relative standard uncertainty contributions related to the repeatability and intermediate precision were obtained by applying Equations (7) and (8), repectively:
u r e p = 100 C T h e o r e t i c a l R S D r e p 2 n r e p
u i p = 100 C T h e o r e t i c a l R S D i p 2 n d a y s
where CTheoretical is the theoretical added concentration, RSDrep is the repeatability, nrep is the number of replicates, RSDip is the intermediate precision, and ndays is the number of days. Moreover, the relative standard uncertainty related to the trueness contribution was estimated by applying Equation (8).
The contributions of the repeatability, intermediate precision, and trueness were considered for the calculation of the expanded uncertainty (U) of the measurements.
U = k · u r e p 2 + u i p 2 + u t 2
where U is the expanded relative uncertainty, k is the coverage factor (k = 2), urep is the relative standard uncertainty of repeatability, uip is the relative standard uncertainty of intermediate precision, and ut is the relative standard uncertainty of trueness.

3. Results and Discussion

3.1. Method Optimization

One of the main limitations for the multielemental quantification of PF samples was the limited sample volume available for their analysis. Typically, liquid flow rates used with conventional sample introduction systems could reach values close to 1 mL min−1. In the present work, it was necessary to lower the sample flow rates to 100 µL min−1. Furthermore, due to the complexity of the PF matrix, the developed analytical method was optimized to mitigate matrix effects and spectral interferences.

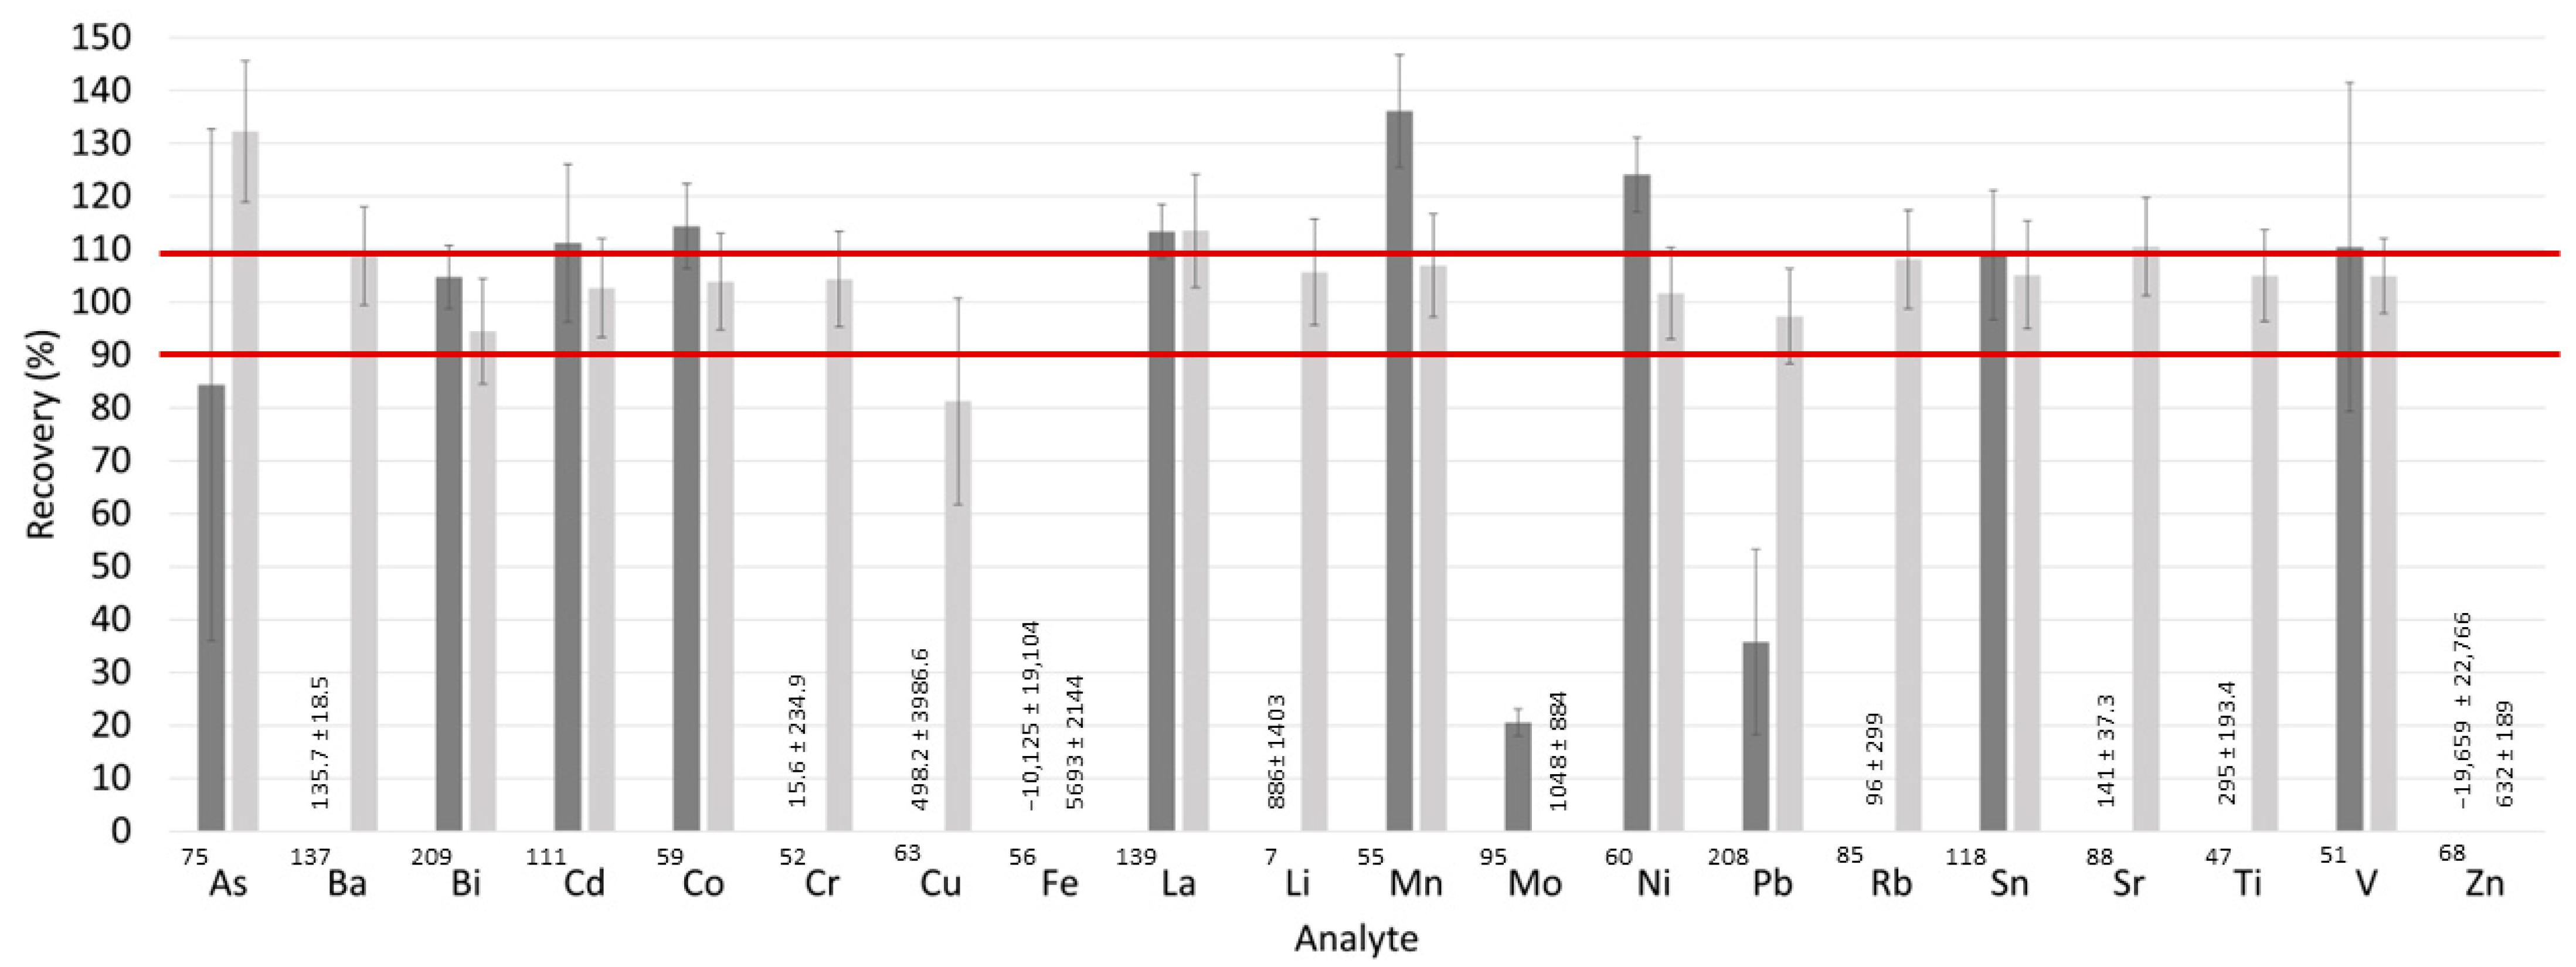
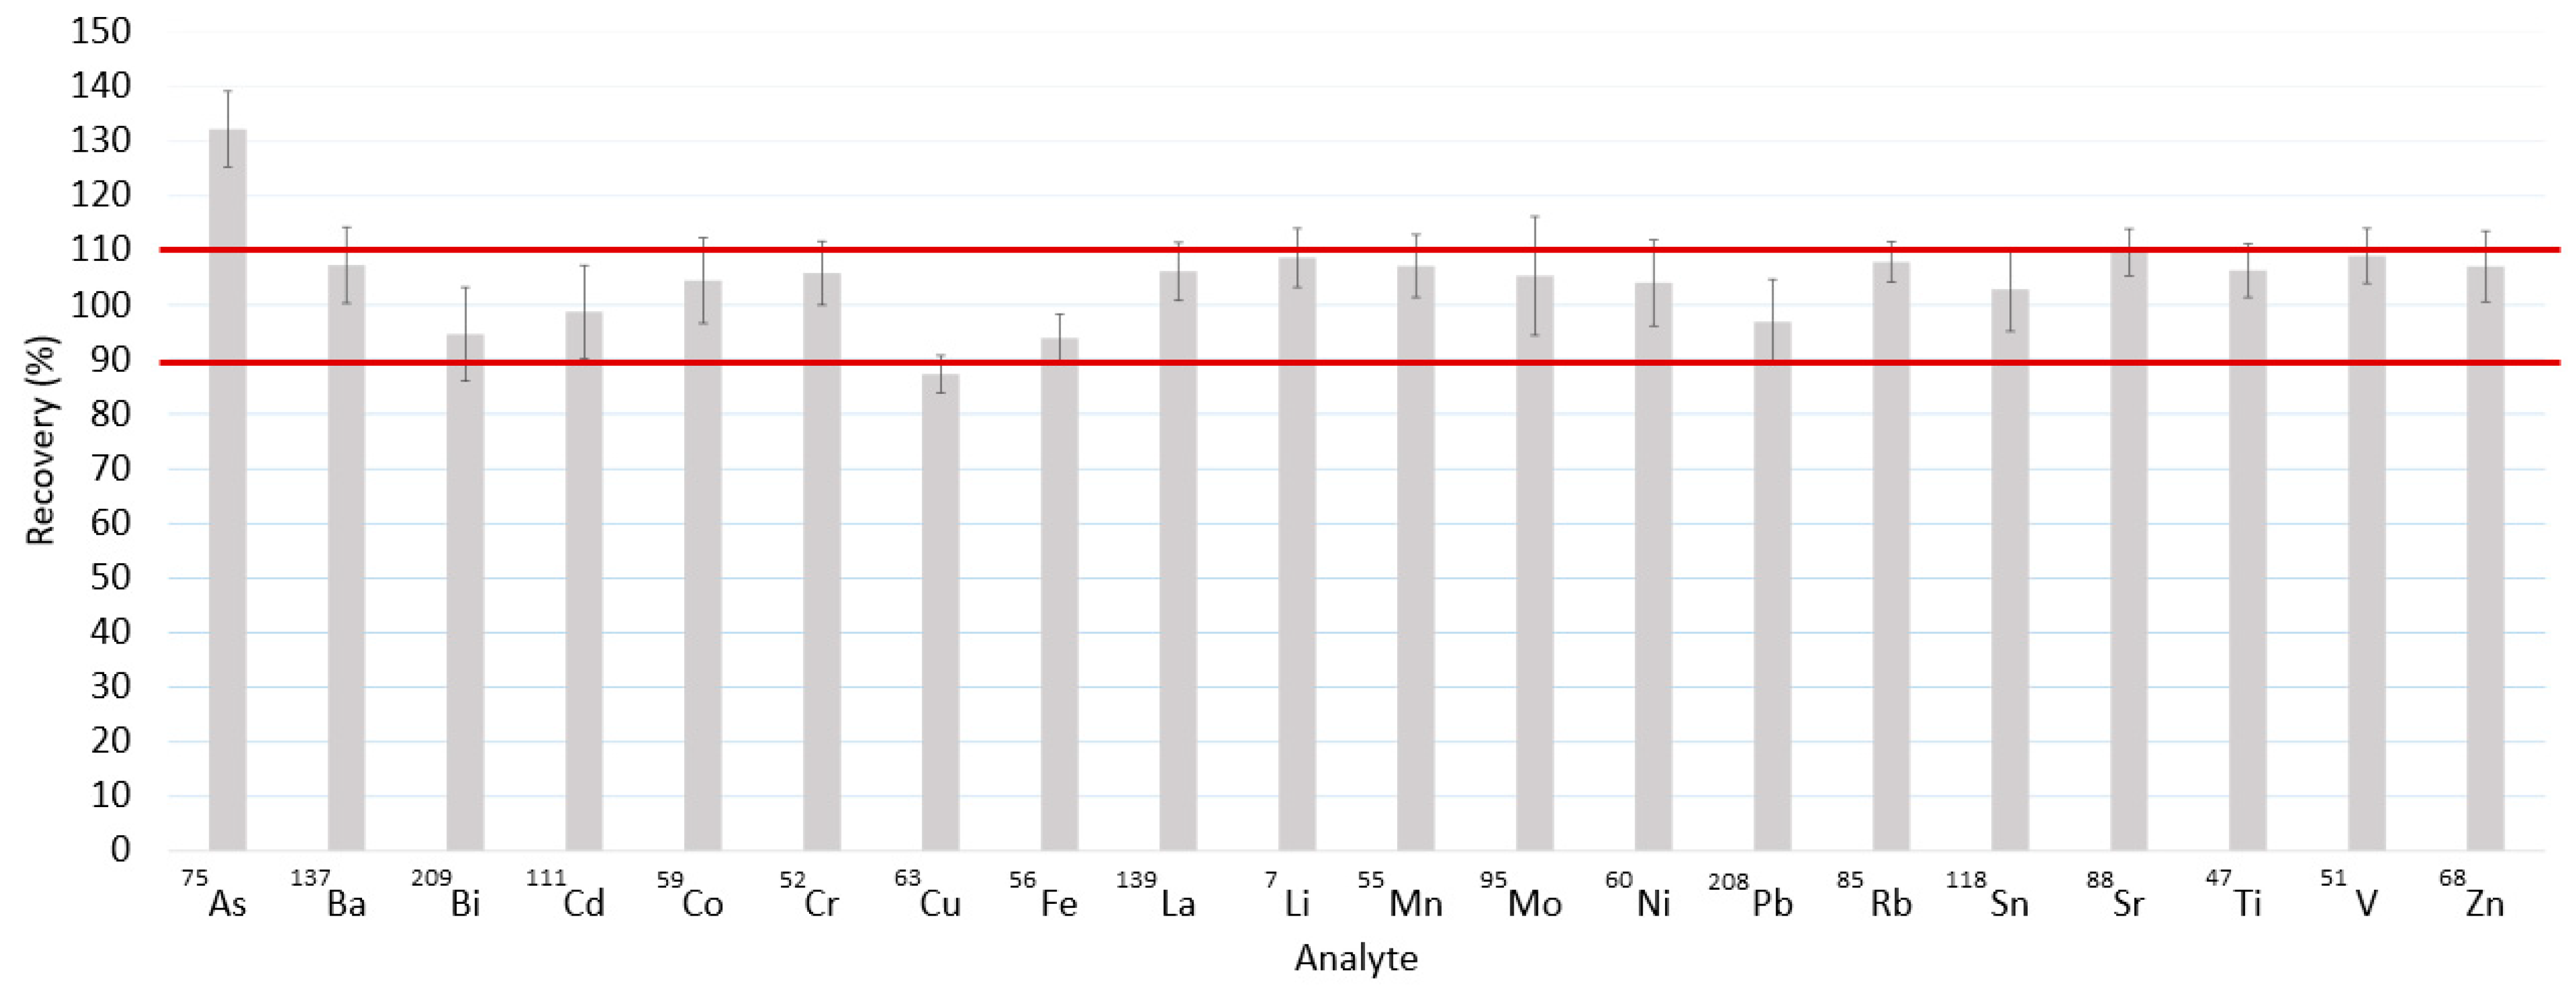
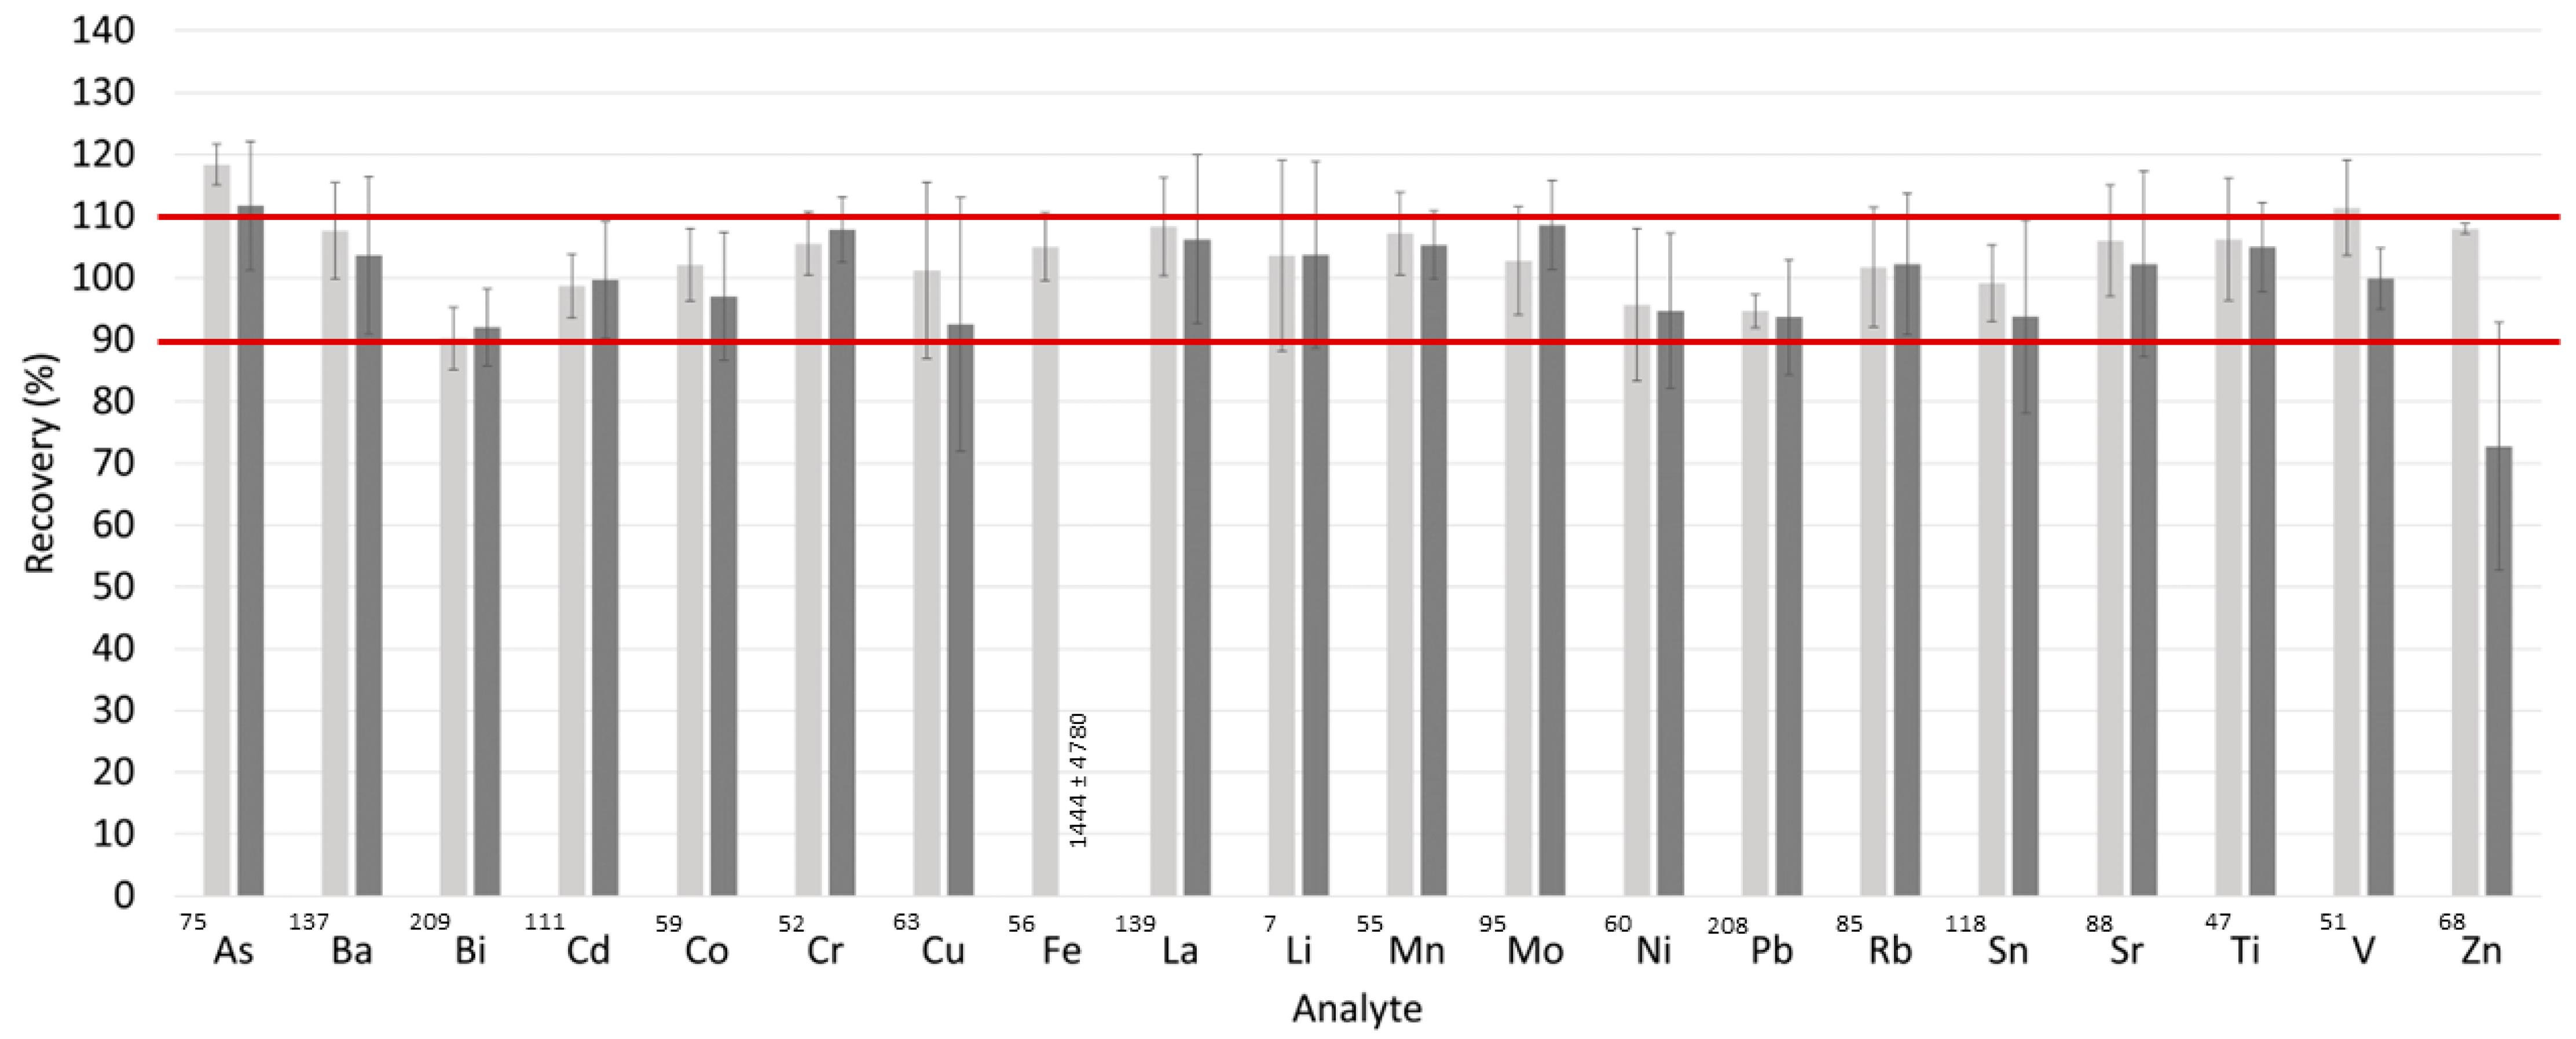
3.1.1. Matrix Effects

Peritoneal fluids are characterized by a rather complex composition, consisting of various organic and inorganic components, such as proteins and dissolved salts (e.g., Na, K, Ca, Mg, Cl, P, or S) [27]. The sample matrix could modify the aerosol characteristics, the amount of analyte delivered to the plasma, and the thermal plasma characteristics [29]. Consequently, the matrix could cause a modification of the signal with respect to a standard, degrading the accuracy of the results. To evaluate the impact of the sample dilution on the extent of matrix interferences and sensitivity, two dilution factors (1:2 and 1:4) were tested on five randomly selected peritoneal fluids spiked with a known concentration (100 µg L−1) of the multielemental standard (SCP33MS).
The recoveries calculated using Equation (3) deviated from 100% for many analytes (75As, 137Ba, 52Cr, 63Cu, 56Fe, 7Li, 55Mn, 95Mo, 60Ni, 208Pb, 85Rb, 88Sr, 47Ti, and 68Zn) when a 1:2 dilution factor was applied, as shown in Figure 1. The recoveries for 75As, 52Cr, 56Fe, 95Mo, 208Pb, and 68Zn were below 100%, while for 63Cu, 137Ba, 7Li, 55Mn, 60Ni, 88Sr, and 47Ti the recoveries were above 100%. The impact of matrix effects was reduced when a higher dilution factor (1:4) was used (Figure 1). A tolerance interval of ±10% was established, with good recoveries lying within the range of 90–110%. The recoveries for 137Ba, 111Cd, 59Co, 52Cr, 7Li, 55Mn, 60Ni, 208Pb, 85Rb, 118Sn, 88Sr, 47Ti, and 51V were within this interval. However, the recoveries obtained for 75As, 63Cu, 56Fe, 95Mo, and 68Zn were outside of the tolerance interval. The recovery for 63Cu was below 100%, while for 75As, 56Fe, 95Mo, and 68Zn it was above 100%. Therefore, the 1:4 dilution factor was selected.

3.1.2. Spectral Interferences

Elements with unacceptable recovery values are shown in Figure 1. Some of these elements may experience spectral interferences caused by ions with the same mass as the analyte ions (Table 1). These spectral interferences could be induced by polyatomic ions originating from the plasma gas or matrix components. For instance, the presence of chloride in the samples could lead to the spectral overlap of 35Cl40Ar on the 75As isotope [30]. To mitigate spectral interferences, a collision cell positioned before the analyzer quadrupole could be employed. The basic concept involves using a non-reactive gas, such as He, to stimulate ion–molecule collisions, as polyatomic ions have a larger ionic cross-section area than analyte ions with the same mass-to-charge ratio, thereby promoting collisions between He atoms and polyatomic ions.
The addition of a collision gas minimized spectral interferences for 63Cu, 56Fe, and 68Zn (Figure 2), leading to improved recoveries compared to those obtained without He (Figure 1). For example, for the 56Fe isotope, which is spectrally interfered with by 40Ca16O and 40Ar16O (Table 1), the recovery factor decreased from values near 6000% to values equal to 95%. However, the addition of the collision gas did not improve the recovery value for arsenic, which may be attributed to other processes, such as plasma charge transfer reactions between 75As and the carbon present in the sample [31].

3.2. Analytical Figures of Merit

The limits of detection (LOD) and quantification (LOQ) were calculated for each analyte on four different days by applying Equations (1) and (2). Table 2 shows the LOD and LOQ values in He and no-gas modes. Generally, the LOD and LOQ values were lower in no-gas mode than in He mode for most elements. However, it is important to note that the addition of a collision gas has a dilution effect and, therefore, degrades the LOD and LOQ. Moreover, for elements with spectral interferences, the LOD and LOQ values in no-gas mode were higher than those in He mode, due to an intensification in the standard deviation of the blank signal caused by spectral interferences in no-gas mode.
An interday validation test was carried out to evaluate the accuracy by means of a recovery study (Equation (3)). A randomly selected sample of PF was spiked and analyzed. Recovery was determined on four different days in He and no-gas modes. The mean values of the recoveries and the standard error of the mean (SEM) are shown in Figure 3. For the no-gas mode, the mean values of the recoveries were around 100% for all of the isotopes, except for those presenting spectral interferences (52Cr, 56Fe, 63Cu, 68Zn, and 75As). In contrast, in He mode, all of the recoveries—except that for 75As—lay within the tolerance interval (i.e., 100 ± 10%). Additionally, the accuracy of the analyte concentration determination was evaluated by comparing the results obtained using no-gas mode with those obtained using a collision gas (He). Table 3 shows the results for those elements above the limit of detection in at least one measurement method. Moreover, the concentrations for the elements subject to spectral interference were not compared. Although there were few instances where the concentrations for both methods were above the LOQ, both measurement methods provided similar concentration values in most cases (Table 3).

3.3. Complete Method Validation

According to the results previously shown, the developed method allows the accurate analysis of PF, with the use of a 1:4 sample dilution factor and the optional addition of a collision gas to minimize both non-spectral and spectral interferences. An in-house validation and uncertainty estimation was carried out. For those elements affected by non-spectral interference, the no-gas mode was used to achieve the lowest detection and quantification limits. However, for 52Cr, 56Fe, 63Cu, and 68Zn, helium was used as a collision gas. The expanded uncertainty values for most of the elements in both no-gas and He modes were approximately 15% (Table 4 and Table 5), with the trueness assessment representing 75–85% of the uncertainty. It should be noted that a recovery study was conducted, as no certified reference material was available; thus, the trueness uncertainty included the contribution of bias, as well as the uncertainty of the multielemental stock solution and the sample preparation process.

3.4. Sample Analysis under Optimal Conditions

The elemental contents of 20 PF samples were determined by ICP-MS/MS. To perform the analysis, a 1:4 sample dilution factor was applied. It is important to note that He mode (collision gas) was applied for those elements suffering from spectral interferences: 52Cr, 63Cu, 56Fe, and 68Zn. Unfortunately, accurate measurements of arsenic were not possible under the experimental conditions used.
In no-gas mode (Table 6), the analytes that were detected in 100% of the samples were 60Ni, 85Rb, 88Sr, and 47Ti. Lithium, in turn, was present in 45% of the samples at levels above the LOD. Some PTMEs—such as 95Mo, 209Bi, 111Cd, and 59Co—were found in a high percentage of samples (40–65%), while others—such as 55Mn, 208Pb, and 51V—were found in a very high percentage of samples (70–80%). Table 7 shows that the four elements measured in He mode were present in 100% of the samples.
In terms of concentrations, the minor analytes were 59Co and 139La, which were present at concentrations below 1 µg L−1; 209Bi, 111Cd, 52Cr, 55Mn, 95Mo, 60Ni, 208Pb, 118Sn, and 51V were present at concentrations ranging from 1 to 10 µg L−1; 137Ba, 7Li, 85Rb, 88Sr, and 47Ti presented concentration levels up to 151 µg L−1. The major analytes found in PF samples were 63Cu, 56Fe, and 68Zn.

3.5. Essential and Non-Essential Elements

In this section, elements are grouped as essential and non-essential to the organism and according to the concentrations found in PF samples. The roles of the essential elements in the organism, along with toxicological aspects such as the recommended daily allowance (RDA) and the tolerable upper intake level (UL), are detailed. For non-essential elements, safe daily levels and dietary consumption limits are summarized. Additionally, the elemental compositions found in the 20 PF samples are compared with the data obtained for biological fluids from previously published works, with a focus on their relevance to gynecological and reproductive health.

3.5.1. Elements Found at Major Concentrations in PF Samples

According to the concentrations found in PF samples, the essential major analytes were Zn, Fe, and Cu, as shown in Table 7. Zinc is an essential element required for the proper functioning of enzymes involved in protein maintenance and the regulation of gene expression. The recommended daily dose for Zn is 8 mg, while the UL is 40 mg [32]. High serum Zn levels have been linked to conditions such as polycystic ovary syndrome (PCOS), dysmenorrhea, and endometriosis. Serum levels of Zn were significantly higher in PCOS patients compared to controls (0.92 versus 0.77 µg mL−1, respectively) [33]. In the analyzed PF samples, Zn was found in 100% of the samples, with an average value of 6889 ± 13,385 µg L−1 (Table 7). In this context, the Zn concentration in the analyzed PF samples was higher than in serum [33].
Iron is another crucial element found in metalloproteins such as myoglobin and hemoglobin. The RDA of Fe for an adult woman is 18 mg per day, while the UL is 45 mg [32]. Higher iron concentration, transferrin saturation, and ferritin concentration were found in the PF of endometriosis patients than in the control group (59 and 49 mg mL−1, respectively) [34]. Fe was found in the follicular fluid (FF) in women with diminished ovarian reserves (DOR, 1.56 mg L−1) and in healthy controls (1.50 mg L−1) [35]. In this work, we found that Fe was present in 100% of the PF samples, with a mean value of 3118 ± 5123 µg L−1 (Table 7), which was significantly below those reported in the literature [34]. Conversely, the content of Fe in PF was higher as compared to FF [35].
Copper is a component of many metalloenzymes with oxidase activity involved in the reduction of molecular oxygen. The RDA for Cu is 900 µg, with UL levels of 10,000 µg [32]. Moreover, Cu has been considered as a potential target for cancer treatment because of its excessive elevated levels in malignant tissues, together with properties that promote angiogenesis, cancer growth, and metastasis. Aberrant elevated serum Cu concentrations have been found in malignant breast cancer tumors compared to controls (1252.20 ± 150.90 versus 964.95 ± 70.30 µg L−1, respectively) [36]. Cu was detected in 100% of the analyzed PF samples, with concentration levels (Table 7) similar to those found in serum [36].

3.5.2. Elements Found at Intermediate Concentrations in PF Samples

The essential elements that were present at intermediate concentrations in PF (i.e., levels up to 151 µg L−1) were Rb and Li (Table 6). Previous studies have shown that Rb is present in the whole-blood samples of pregnant women (control group: 1867.40 ± 392.50 µg L−1) and women who have suffered a miscarriage (1787.69 ± 384.92 µg L−1), with no significant differences. Interestingly, Rb was negatively associated with spontaneous abortion [37]. Rb was present in all 20 PF samples included in the present study, with an average concentration of 150.7 ± 57.9 µg L−1 (Table 6)—significantly lower than the values found in whole blood, as previously described [37]. Li, in turn, may have essential functions in animals, but it is not known whether there is a human requirement [1]. Toxicity from dietary Li is unknown, with an intake from dietary sources of approximately 100 µg per day. Li was found in FF in PCOS and in control women at similar concentration levels (2.75 ± 0.52 and 2.78 ± 0.67 μg L−1, respectively) [38]. In our study, Li was detected in 45% of the samples, with a higher concentration (12.7 ± 9.6 μg L−1, Table 6) than reported in FF [38].

3.5.3. Elements Found at Minor Concentrations in PF Samples

As regards minor essential elements in PF, Mo, Cr, Mn, Ni, and V were found at concentrations between 1 and 10 µg L−1 (Table 6 and Table 7), while Co was present at concentrations below 1 µg L−1 (Table 6). Mo is a cofactor of enzymes involved in the catabolism of sulfur amino acids, purines, and pyrimidines. The RDA of Mo ascends to 45 µg, while the UL is 2000 µg [32]. Mo levels have been reported in various biological samples, including urine, FF, serum, and placenta. Regarding the placenta, toxic and essential elements in this biological matrix, together with its relation to birth outcomes in women exposed to a low-toxic-metal environment, were investigated. The median Mo concentration value found in the placenta was 5.3 µg L−1 [39], while the concentration levels in the sera and FF of women attending an in vitro fertilization (IVF) center were 2.94 ± 7.26 and 1 ± 1.17 µg L−1, respectively [40]. In contrast to the previous data, Mo was detected in 40% of the PF samples, with only one sample above the LOQ, at a concentration of 17.9 µg L−1 (Table 6).
Cr is an essential nutrient that promotes the action of insulin, thereby influencing the carbohydrate, lipid, and protein metabolism [1]. Recent reports indicate that the RDA of Cr for adults is 20–35 μg per day [32]. Studies on environmental exposure revealed that placental Cr contents did not differ significantly between environmentally exposed women and the control group (244.19 versus 229.08 ng per wet weight, respectively) [41]. Regarding IVF, Cr in FF was positively correlated with the number of oocytes in the MII stage, with a mean concentration of 2.46 ± 2.66 µg L−1 [40]. In the present study, Cr was detected above the LOD in 100% of the PF samples, with a mean concentration of 6.6 ± 7.9 µg L−1 (Table 7). Cr appeared to be present at higher concentrations in PF compared to the placenta and FF samples [40,41].
Manganese is a trace element involved in bone formation and is present in enzymes involved in the metabolism of amino acids, cholesterol, and carbohydrates, with a daily recommended dose of 1.8 mg and a UL of 11 mg [32]. Increased levels of Mn in maternal whole blood (MWB) or umbilical cord blood (UCB) could be associated with environmental exposure. The MWB level of Mn was 54.98 ± 22.98 µg L−1, while the UCB Mn concentration was 78.75 ± 30.53 µg L−1, with a quadratic curvilinear relationship reported between Mn and birth size [42]. The Mn concentrations in the analyzed PF samples (Table 6) were lower than the concentration levels found in whole blood [42], with a mean concentration of 4.6 ± 4 µg L−1.
No biological function in humans has been found for Ni and V, although Ni has been found to potentially serve as a cofactor of metalloenzymes. The ULs for Ni and V are 1 and 1.8 mg per day, respectively. A study on women undergoing IVF found that the Ni levels in serum and follicular fluid (FF) were 1.61 ± 3.96 and 2.76 ± 2.43 µg L−1, respectively. In our study, 100% of the PF samples contained Ni, and the mean concentration was 5.4 ± 3.2 µg L−1 (Table 6). The V levels found in serum and FF in the previously mentioned study were 0.53 ± 0.35 µg L−1 and 0.49 ± 0.26 µg L−1, respectively [40]. Similarly, V levels were found to be higher in PF compared to serum and FF, with a detection rate of 70% and a mean concentration of 7.4 ± 1.9 µg L−1 (Table 6).
Cobalt, on the other hand, is a critical component of hydroxycobalamin (vitamin B12), which is essential for red blood cell production. In this case, the RDA for B12 is 2.4 μg per day [32]. Although the mean values for cobalt in biological fluids are typically low (0.16 µg L−1 for serum and 0.40 µg L−1 for urine) [43], our study found that 40% of the PF samples contained cobalt, with a mean value of 2.3 ± 0.3 µg L−1 (Table 6). It should be noted that Fe and Co in excess may promote oxidative stress and cause tumor formation [44].

3.5.4. Non-Essential Hhuman Elements

Various elements, including Ba, Bi, Cd, La, Li, Pb, Sn, Sr, and Ti, are considered non-essential for human beings; hence, there is no recommended dietary allowance (RDA) for these elements. Instead, safe daily levels and limits for dietary consumption are provided based on safety considerations. Despite their non-essential nature, some of these elements—such as Ba, Bi, La, Li, Sr, and Sn—have been linked to gynecological health, but the available data on their content in biological fluids and their relationships with gynecological health are limited. According to the concentrations found in PF samples, the non-essential analytes found at concentrations up to 64 µg L−1 were Ti, Ba, and Sr (Table 6).
Titanium exposure has been a concern due to its association with several adverse health effects, but the understanding of the effects of Ti on gynecological and reproductive health remains limited. An adult weighing 50 kg may consume approximately 10–35 mg of TiO2 through their diet [45]. Blood Ti levels were investigated in women who delivered normal-birth-weight infants (control group) and women who delivered low-birth-weight infants (case group). The median total blood concentration of Ti in the case group was significantly higher than in the control group (134 vs. 129 μg L−1) [46]. In FF, Ti was found to be significantly higher in healthy controls (179.06 μg L−1) compared to women with DOR (149.78 μg L−1) [35]. For PF samples, we found that Ti was present in 100% of the samples, with a mean concentration of 64.3 ± 68.9 μg L−1 (Table 6), which is different from the concentrations found in total blood and FF [35,46].
For Sr, there is a general lack of information available, but it was found in the FF of women with DOR (26.02 μg L−1) and healthy controls (36.48 μg L−1) [35]. In PF, we found that Sr was detected in all PF samples, with a mean value of 33.5 ± 11.1 μg L−1 (Table 6), which is similar to the concentrations found in FF samples. The Ba intake from food, water, and air is estimated to range from about 0.7 to 1.9 mg per day, with food being the primary source of intake for those who are not occupationally exposed [47]. In women undergoing IVF, Ba was found in the serum (17.11 ± 43.4 µg L−1) and FF (10.34 ± 18.57 µg L−1) [40]. Our results demonstrated the presence of Ba in 85% of the PF samples, with a mean value of 21.7 ± 31.8 µg L−1 (Table 6), similar to the values previously described as being found in serum [40].
Regarding minor non-essential elements, Pb, Bi, Sn, and Cd were found in PF samples at levels in between 1 and 10 µg L−1 (Table 6). The Food and Drug Administration (FDA) limits dietary Pb consumption to 8.8 μg per day for females of childbearing age [48]. There is no safe blood concentration of Pb, as even levels as low as 5 μg dL−1 could be associated with health problems [49]. Furthermore, it is known that as lead exposure increases, the range and severity of symptoms and effects grow. For example, occupationally exposed women had significantly higher levels of Pb in their blood (2.73 ± 2.39 µg dL−1) compared to those who were not occupationally exposed (1.25 ± 2.10 µg dL−1) [50]. Smoking increases Pb levels in the endometrium [14]. In IVF patients, Pb levels were 3.01 ± 2.77 µg L−1 in serum and 7.42 ± 32.51 µg L−1 in FF [40]. Compared to the previous data, in PF samples, Pb was detected in 80% of the samples, with a mean value of 6.3 ± 5.9 µg L−1 (Table 6)—similar values to those found in FF samples [40].
Bismuth was detected in 65% of the PF samples (Table 6). However, the long-term use of Bi may result in side effects and toxicity to human beings, depending on the nature and amount of the absorbed Bi species. It is not clear why selected individuals develop Bi toxicity. As for Bi in biological fluids, we did not find analytical data regarding Bi and gynecological health [51]. In the case of Sn, the main adverse effect on humans caused by excessive levels of tin in canned beverages (above 150 mg kg−1) or other canned foods (above 250 mg kg−1) is acute gastric irritation. Approximately 5% of Sn is absorbed from the gastrointestinal tract, distributed in the body, and then excreted by the kidneys. An excess of 130 mg per day could accumulate in the liver and kidneys, causing skin and eye irritation, cholangitis of the lower biliary tract, hepatotoxicity, and neurotoxicity [52]. Sn was found above the LOD in a 75% of the PF samples, with a mean concentration of 3.8 ± 2.1 μg L−1 (Table 6).
Cadmium is a PTME that has been widely studied due to its estrogenic activity, which has been linked to the development of estrogen-dependent diseases such as endometrial and breast cancers, endometriosis, and spontaneous abortions [6,11]. Safe daily levels of Cd intake should be kept below 30 µg per person [53]. Endometriosis was demonstrated to be associated with Cd exposure. The blood levels of Cd in women with endometriosis were significantly higher than those in a group of healthy individuals (0.53 vs. 0.46 µg L−1, respectively) [54]. Conversely, low levels of Cd in blood from women with uterine myomas (0.33–3.5 µg L−1) were correlated with its contents in the uterus, and with significantly decreased estradiol (E2) concentrations in sera [55]. Within this study, Cd was present in 45% of the PF samples (Table 6). The mean value found within the framework of the present study (2.8 ± 1.5 μg L−1) was similar to the Cd levels found in blood of women with uterine myomas [55].
Finally, a lack of general information about La was evidenced, and no available data were found concerning La in biological fluids. However, 80% of the PF samples contained La, with a mean concentration of 0.6 ± 1.1 μg L−1 (Table 6).
Overall, this study identified the elemental contents of 19 analytes in PF, including essential and non-essential elements such as trace and ultra-trace PTMEs. While some analytes were found at similar concentrations to those reported in whole blood, serum, follicular fluid, and urine (Rb, Cd, Pb, Ti, and Ba), others were found at different amounts (Fe, Cr, Zn, Mn, Mo, V, Ni, and Li). This suggests that PF is a unique biological fluid that cannot be directly compared to other matrices. Nonetheless, the developed method of analysis provides a new approach to diagnose and predict the health risks of women with gynecological pathologies, and to assess women’s health—including reproductive health.

4. Conclusions

This is the first work where an analytical method for the determination of 19 analytes by ICP-MS/MS in PF samples has been developed and validated. The methodology was found to be highly suitable for performing accurate determination of elements of interest such as 137Ba, 209Bi, 111Cd, 59Co, 52Cr, 63Cu, 56Fe, 139La, 7Li, 55Mn, 95Mo, 60Ni, 208Pb, 85Rb, 118Sn, 88Sr, 47Ti, 51V, and 68Zn. The main advantages of the developed procedure are as follows: (i) the amount of sample required to perform the analysis was reduced as it was aspirated at a low liquid flow; (ii) the application of an appropriate dilution factor allows the mitigation of matrix effects without degradation of the limits of detection and quantification; (iii) accurate determination of 52Cr, 63Cu, 56Fe, and 68Zn was possible through the addition of a collision gas; (iv) the method’s expanded uncertainty was lower than 15% for the 19 analytes; and (v) it avoids the use of toxic reagents, thereby lowering the cost and time of analysis and aligning the method with the principles of green chemistry.
This advanced research method could help individuals to identify and understand their health risks and monitor their health status over time. Specifically, this novel method could be employed as an advance routine analysis method for the analysis of PF, opening the possibility of using metal concentrations as an indicator of women’s fertility status, as well as to diagnose and prognose related gynecological pathologies. However, the main limitation of this study is the analysis of a limited number of PF samples (20 PF samples) that may not be sufficient to obtain conclusive results. The present work could be considered as a preliminary examination, and ongoing research with a wider study group is currently being carried out in our laboratories. The results of this extended study will be the subject of a forthcoming publication, which will provide more conclusive evidence regarding the efficacy of essential and non-essential elements such as trace and ultra-trace PTMEs for assessing women’s reproductive health.

Supplementary Materials

The following supporting information can be downloaded at: https://www.mdpi.com/article/10.3390/toxics11050399/s1, Table S1: ICP-MS/MS operating conditions.

Author Contributions

Conceptualization, A.L.-B., R.S., J.-L.T.-T., M.J.G.-T., I.V. and M.A.; methodology, A.L.-B., R.S. and J.-L.T.-T.; software, A.L.-B., R.S. and J.-L.T.-T.; validation, R.S.; formal analysis, A.L.-B., R.S. and J.-L.T.-T.; investigation, A.L.-B., R.S., J.-L.T.-T., M.J.G.-T., I.V. and M.A.; resources, R.S., J.-L.T.-T., M.J.G.-T., I.V. and M.A.; data curation, A.L.-B., R.S. and J.-L.T.-T.; writing—original draft preparation, A.L.-B. and R.S.; writing—review and editing, A.L.-B., R.S., J.-L.T.-T., M.J.G.-T., I.V. and M.A.; visualization, A.L.-B., R.S., J.-L.T.-T., M.J.G.-T., I.V. and M.A.; supervision, R.S. and J.-L.T.-T.; project administration, I.V. and M.A.; funding acquisition, I.V. and M.A. All authors have read and agreed to the published version of the manuscript.

Funding

This study was funded by the Fundación para el Fomento de la Investigación Sanitaria y Biomédica de la Comunitat Valenciana (UGP-19-042 and UGP-20-039). A.L.-B. is supported by the European Social Fund and the Generalitat Valenciana under a Ph.D. contract (ACIF–2021/243).

Institutional Review Board Statement

This study was conducted in accordance with the Declaration of Helsinki and approved by the Institutional Review Board (Ethics Committee) of Hospital Universitario San Juan de Alicante (committee protocol code: 19/344; date of approval: 17 December 2019).

Informed Consent Statement

Informed consent was obtained from all subjects involved in the study.

Conflicts of Interest

The authors declare no conflict of interest.

References

  1. World Health Organization; Food and Agriculture Organization of the United Nations; International Atomic Energy Agency. Trace Elements in Human Nutrition and Health; World Health Organization: Geneva, Switzerland, 1996. [Google Scholar]
  2. Ali, H.; Khan, E. What Are Heavy Metals? Long-Standing Controversy over the Scientific Use of the Term ‘Heavy Metals’—Proposal of a Comprehensive Definition. Toxicol. Environ. Chem. 2018, 100, 6–19. [Google Scholar] [CrossRef]
  3. Pourret, O.; Hursthouse, A. It’s Time to Replace the Term “Heavy Metals” with “Potentially Toxic Elements” When Reporting Environmental Research. Int. J. Environ. Res. Public Health 2019, 16, 4446. [Google Scholar] [CrossRef] [PubMed]
  4. Pourret, O.; Bollinger, J.C. “Heavy Metal”—What to Do Now: To Use or Not to Use? Sci. Total Environ. 2017, 610–611, 419–420. [Google Scholar] [CrossRef]
  5. Tchounwou, P.B.; Yedjou, C.G.; Patlolla, A.K.; Sutton, D.J. Heavy Metal Toxicity and the Environment. In Molecular, Clinical and Environmental Toxicology; Springer: Berlin/Heidelberg, Germany, 2012; pp. 133–164. [Google Scholar] [CrossRef]
  6. Rzymski, P.; Tomczyk, K.; Rzymski, P.; Poniedziałek, B.; Opala, T.; Wilczak, M. Impact of Heavy Metals on the Female Reproductive System. Ann. Agric. Environ. Med. 2015, 22, 259–264. [Google Scholar] [CrossRef] [PubMed]
  7. Hruska, K.S.; Furth, P.A.; Seifer, D.B.; Sharara, F.I.; Flaws, J.A. Environmental Factors in Infertility. Clin. Obstet. Gynecol. 2000, 43, 821–829. [Google Scholar] [CrossRef] [PubMed]
  8. Ma, Y.; He, X.; Qi, K.; Wang, T.; Qi, Y.; Cui, L.; Wang, F.; Song, M. Effects of Environmental Contaminants on Fertility and Reproductive Health. J. Environ. Sci. 2019, 77, 210–217. [Google Scholar] [CrossRef]
  9. López-Botella, A.; Velasco, I.; Acién, M.; Sáez-Espinosa, P.; Todolí-Torró, J.-L.; Sánchez-Romero, R.; Gómez-Torres, M.J. Impact of Heavy Metals on Human Male Fertility—An Overview. Antioxidants 2021, 10, 1473. [Google Scholar] [CrossRef]
  10. Kopp, R.; Martínez, I.O.; Legradi, J.; Legler, J. Exposure to Endocrine Disrupting Chemicals Perturbs Lipid Metabolism and Circadian Rhythms. J. Environ. Sci. 2017, 62, 133–137. [Google Scholar] [CrossRef]
  11. Stoica, A.; Katzenellenbogen, B.S.; Martin, M.B. Activation of Estrogen Receptor-α by the Heavy Metal Cadmium. Mol. Endocrinol. 2000, 14, 545–553. [Google Scholar] [CrossRef]
  12. Pollack, A.Z.; Ranasinghe, S.; Sjaarda, L.A.; Mumford, S.L. Cadmium and Reproductive Health in Women: A Systematic Review of the Epidemiologic Evidence. In Current Environmental Health Reports; Springer: Berlin/Heidelberg, Germany, 2014; pp. 172–184. [Google Scholar] [CrossRef]
  13. Rzymski, P.; Niedzielski, P.; Rzymski, P.; Tomczyk, K.; Kozak, L.; Poniedziałek, B. Metal Accumulation in the Human Uterus Varies by Pathology and Smoking Status. Fertil Steril. 2016, 105, 1511–1518. [Google Scholar] [CrossRef]
  14. Yılmaz, B.K.; Evliyaoğlu, Ö.; Yorgancı, A.; Özyer, Ş.; Üstün, Y.E. Serum Concentrations of Heavy Metals in Women with Endometrial Polyps. J. Obstet. Gynaecol. 2020, 40, 541–545. [Google Scholar] [CrossRef] [PubMed]
  15. Lai, G.; Yeh, C.; Yeh, C.; Chen, R.; Fu, C.; Chen, C.; Tzeng, C. Decreased zinc and increased lead blood levels are associated with endometriosis in Asian women. Reprod. Toxicol. 2017, 74, 77–84. [Google Scholar] [CrossRef]
  16. Dutta, S.; Gorain, B.; Choudhury, H.; Roychoudhury, S.; Sengupta, P. Environmental and Occupational Exposure of Metals and Female Reproductive Health. Environ. Sci. Pollut. Res. 2022, 29, 62067–62092. [Google Scholar] [CrossRef]
  17. Bhardwaj, J.K.; Paliwal, A.; Saraf, P. Effects of Heavy Metals on Reproduction Owing to Infertility. J. Biochem. Mol. Toxicol. 2021, 35, e22823. [Google Scholar] [CrossRef]
  18. Berger, N.; Rock, J. Peritoneal Fluid Environment in Endometriosis. Semin. Reprod. Med. 1985, 3, 313–318. [Google Scholar] [CrossRef]
  19. Koninckx, P. Endometriotic Disease: The Role of Peritoneal Fluid. Hum. Reprod. Update 1998, 4, 741–751. [Google Scholar] [CrossRef] [PubMed]
  20. Su, M.H.; Cho, S.W.; Kung, Y.S.; Lin, J.H.; Lee, W.L.; Wang, P.H. Update on the Differential Diagnosis of Gynecologic Organ-Related Diseases in Women Presenting with Ascites. Taiwan. J. Obstet. Gynecol. 2019, 58, 587–591. [Google Scholar] [CrossRef]
  21. Bedaiwy, M.A.; Falcone, T. Peritoneal Fluid Environment in Endometriosis. Clinicopathological Implications. Minerva Ginecol. 2003, 55, 333–345. [Google Scholar] [PubMed]
  22. Dos Santos, L.R.S.S.R.; de Freitas Santos, A.; das Graças Andrade Korn, M. Effects of Furosemide Administration on the Concentration of Essential and Toxic Elements in Wistar Rats by Inductively Coupled Plasma Optical Emission Spectrometry. J. Trace Elem. Med. Biol. 2018, 48, 25–29. [Google Scholar] [CrossRef]
  23. Hou, X.; Amais, R.S.; Jones, B.T.; Donati, G.L. Inductively Coupled Plasma Optical Emission Spectrometry. In Encyclopedia of Analytical Chemistry; John Wiley & Sons Ltd.: Hoboken, NJ, USA, 2006. [Google Scholar] [CrossRef]
  24. Markiewicz, B.; Sajnóg, A.; Lorenc, W.; Hanć, A.; Komorowicz, I.; Suliburska, J.; Kocyłowski, R.; Barałkiewicz, D. Multielemental Analysis of 18 Essential and Toxic Elements in Amniotic Fluid Samples by ICP-MS: Full Procedure Validation and Estimation of Measurement Uncertainty. Talanta 2017, 174, 122–130. [Google Scholar] [CrossRef]
  25. López-Botella, A.; Sánchez, R.; Paul, R.; Aizpurua, J.; Gómez-Torres, M.J.; Todolí-Torró, J.-L. Analytical Determination of Heavy Metals in Human Seminal Plasma—A Systematic Review. Life 2023, 13, 925. [Google Scholar] [CrossRef]
  26. Cavey, T.; Ropert, M.; Loréal, O.; Bendavid, C.; Peoc’h, K. Metals: Common Clinical Applications in Inductively Coupled Plasma Mass Spectrometry. Ann. Biol. Clin. 2019, 77, 495–504. [Google Scholar] [CrossRef] [PubMed]
  27. Bolea-Fernandez, E.; Balcaen, L.; Resano, M.; Vanhaecke, F. Overcoming Spectral Overlap via Inductively Coupled Plasma-Tandem Mass Spectrometry (ICP-MS/MS). A Tutorial Review. J. Anal. Spectrom. 2017, 32, 1660–1679. [Google Scholar] [CrossRef]
  28. Eurachem. The Fitness for Purpose of Analytical Methods: A Laboratory Guide to Method Validation and Related Topics; Eurachem Guides: Gembloux, Belgium, 1998. [Google Scholar]
  29. Todolí, J.-L.; Mermet, J.-M. Acid Interferences in Atomic Spectrometry: Analyte Signal Effects and Subsequent Reduction. Spectrochim. Acta Part B Spectrosc. 1999, 54, 895–929. [Google Scholar] [CrossRef]
  30. Darrouzes, J.; Bueno, M.; Lespes, G.; Holeman, M.; Potingautier, M. Optimisation of ICPMS Collision/Reaction Cell Conditions for the Simultaneous Removal of Argon Based Interferences of Arsenic and Selenium in Water Samples. Talanta 2007, 71, 2080–2084. [Google Scholar] [CrossRef]
  31. Allain, P.; Jaunault, L.; Mauras, Y.; Mermet, J.M.; Delaporte, T. Signal Enhancement of Elements Due to the Presence of Carbon-Containing Compounds in Inductively Coupled Plasma Mass Spectrometry. Anal. Chem. 1991, 63, 1497–1498. [Google Scholar] [CrossRef]
  32. Trumbo, P.; Yates, A.A.; Schlicker, S.; Poos, M. Dietary Reference Intakes. J. Am. Diet. Assoc. 2001, 101, 294–301. [Google Scholar] [CrossRef]
  33. Kurdoglu, Z.; Kurdoglu, M.; Demir, H.; Sahin, H.G. Serum Trace Elements and Heavy Metals in Polycystic Ovary Syndrome. Hum. Exp. Toxicol. 2012, 31, 452–456. [Google Scholar] [CrossRef]
  34. Lousse, J.C.; Defrère, S.; Van Langendonckt, A.; Gras, J.; González-Ramos, R.; Colette, S.; Donnez, J. Iron Storage Is Significantly Increased in Peritoneal Macrophages of Endometriosis Patients and Correlates with Iron Overload in Peritoneal Fluid. Fertil Steril 2009, 91, 1668–1675. [Google Scholar] [CrossRef]
  35. Chen, Y.; Sun, Y.; Zhao, A.; Cai, X.; Yu, A.; Xu, Q.; Wang, P.; Yao, J.; Wang, Q.; Wang, W. Arsenic Exposure Diminishes Ovarian Follicular Reserve and Induces Abnormal Steroidogenesis by DNA Methylation. Ecotoxicol. Environ. Saf. 2022, 241, 113816. [Google Scholar] [CrossRef]
  36. Kuo, H.W.; Chen, S.F.; Wu, C.C.; Chen, D.R.; Lee, J.H. Serum and Tissue Trace Elements in Patients with Breast Cancer in Taiwan. Biol. Trace Elem. Res. 2002, 89, 1–12. [Google Scholar] [CrossRef] [PubMed]
  37. Lu, Y.; Zhang, Y.; Guan, Q.; Xu, L.; Zhao, S.; Duan, J.; Wang, Y.; Xia, Y.; Xu, Q. Exposure to Multiple Trace Elements and Miscarriage during Early Pregnancy: A Mixtures Approach. Environ. Int. 2022, 162, 107161. [Google Scholar] [CrossRef] [PubMed]
  38. Sun, Y.; Wang, W.; Guo, Y.; Zheng, B.; Li, H.; Chen, J.; Zhang, W. High Copper Levels in Follicular Fluid Affect Follicle Development in Polycystic Ovary Syndrome Patients: Population-Based and in Vitro Studies. Toxicol. Appl. Pharmacol. 2019, 365, 101–111. [Google Scholar] [CrossRef]
  39. Osman, K.; Åkesson, A.; Berglund, M.; Bremme, K.; Schu¨tz, A.; Schu¨tz, S.; Ask, K.; Vahter, M. Toxic and Essential Elements in Placentas of Swedish Women. Clin. Biochem. 2000, 33, 131–138. [Google Scholar] [CrossRef] [PubMed]
  40. Zhou, L.; Liang, K.; Li, M.; Rong, C.; Zheng, J.; Li, J. Metal Elements Associate with in Vitro Fertilization (IVF) Outcomes in 195 Couples. J. Trace Elem. Med. Biol. 2021, 68, 126810. [Google Scholar] [CrossRef]
  41. Guo, Y.; Huo, X.; Li, Y.; Wu, K.; Liu, J.; Huang, J.; Zheng, G.; Xiao, Q.; Yang, H.; Wang, Y.; et al. Monitoring of Lead, Cadmium, Chromium and Nickel in Placenta from an e-Waste Recycling Town in China. Sci. Total Environ. 2010, 408, 3113–3117. [Google Scholar] [CrossRef]
  42. Guan, H.; Wang, M.; Li, X.; Piao, F.; Li, Q.; Xu, L.; Kitamura, F.; Yokoyama, K. Manganese Concentrations in Maternal and Umbilical Cord Blood: Related to Birth Size and Environmental Factors. Eur. J. Public Health 2014, 24, 150–157. [Google Scholar] [CrossRef]
  43. Baruthio, F.; Pierre, F. Cobalt Determination in Serum and Urine by Electrothermal Atomic Absorption Spectrometry. Biol. Trace Elem. Res. 1993, 39, 21–31. [Google Scholar] [CrossRef]
  44. Ćwiertnia, A.; Kozłowski, M.; Cymbaluk-Płoska, A. The Role of Iron and Cobalt in Gynecological Diseases. Cells 2023, 12, 117. [Google Scholar] [CrossRef]
  45. Weir, A.; Westerhoff, P.; Fabricius, L.; Hristovski, K.; Von Goetz, N. Titanium Dioxide Nanoparticles in Food and Personal Care Products. Environ. Sci. Technol. 2012, 46, 2242–2250. [Google Scholar] [CrossRef]
  46. Jin, Y.; Li, Z.; An, H.; Pang, Y.; Li, K.; Zhang, Y.; Zhang, L.; Yan, L.; Wang, B.; Ye, R.; et al. Environmental Titanium Exposure and Reproductive Health: Risk of Low Birth Weight Associated with Maternal Titanium Exposure from a Nested Case-Control Study in Northern China. Ecotoxicol. Environ. Saf. 2021, 208, 111632. [Google Scholar] [CrossRef] [PubMed]
  47. World Health Organization. Barium in Drinking-Water; Background Document for Development of WHO Guidelines for Drinking-Water Quality; WHO: Geneva, Switzerland, 2016. [Google Scholar]
  48. Flannery, B.M.; Middleton, K.B. Updated Interim Reference Levels for Dietary Lead to Support FDA’s Closer to Zero Action Plan. Regul. Toxicol. Pharmacol. 2022, 133, 105202. [Google Scholar] [CrossRef]
  49. Mehri, A. Trace Elements in Human Nutrition (II)—An Update. Int. J. Prev. Med. 2020. [Google Scholar] [CrossRef]
  50. Popovic, M.; McNeill, F.E.; Chettle, D.R.; Webber, C.E.; Lee, C.V.; Kaye, W.E. Impact of Occupational Exposure on Lead Levels in Women. Environ. Health Perspect. 2005, 113, 478–484. [Google Scholar] [CrossRef] [PubMed]
  51. Yang, N.; Sun, H. Bismuth: Environmental Pollution and Health Effects. Encycl. Environ. Health 2011, 414–420. [Google Scholar] [CrossRef]
  52. Winship, K.A. Toxicity of Tin and Its Compounds. Advers. Drug React Acute Poisoning Rev. 1988, 7, 19–38. [Google Scholar]
  53. Satarug, S.; Haswell-Elkins, M.R.; Moore, M.R. Safe Levels of Cadmium Intake to Prevent Renal Toxicity in Human Subjects. Br. J. Nutr. 2000, 84, 791–802. [Google Scholar] [CrossRef]
  54. Jackson, L.W.; Zullo, M.D.; Goldberg, J.M. The Association between Heavy Metals, Endometriosis and Uterine Myomas among Premenopausal Women: National Health and Nutrition Examination Survey 1999–2002. Hum. Reprod. 2008, 23, 679–687. [Google Scholar] [CrossRef]
  55. Nasiadek, M.; Swiatkowska, E.; Nowinska, A.; Krawczyk, T.; Wilczynski, J.R.; Sapota, A. The Effect of Cadmium on Steroid Hormones and Their Receptors in Women with Uterine Myomas. Arch. Environ. Contam. Toxicol. 2011, 60, 734–741. [Google Scholar] [CrossRef]
Figure 1. Recovery values for five spiked peritoneal fluid samples (at 100 µg L−1), calculated from 5 replicate measurements. Five randomly selected PF samples were selected to obtain recoveries. The recovery values were obtained for samples diluted with ultrapure water at ratios of 1:2 (dark grey bars) and 1:4 (light grey bars). The measurements were performed by ICP-MS/MS. The experimental conditions are available in Table S1 in the Supplementary Materials. No collision gas was added. The mean (bars) and standard error of the mean (error bars) are shown. For those elements with average recovery values outside the range displayed on the axis, numerical values are provided.
Toxics 11 00399 g001
Figure 2. Recovery values for five spiked peritoneal fluid samples (at 100 µg L−1), calculated from 5 replicate measurements. Five randomly selected PF samples were selected to obtain recoveries. The recovery values were obtained for samples diluted 1:4 with ultrapure water. The measurements were performed by ICP-MS/MS. The experimental conditions are available in Table S1 in the Supplementary Materials. He was used as a collision gas. The mean (bars) and standard error of the mean (error bars) are shown.
Toxics 11 00399 g002
Figure 3. Recovery values for five spiked peritoneal fluid samples (at 100 µg L−1), calculated from 5 replicate measurements. Five randomly selected PF samples were selected to obtain recoveries. The recovery values were obtained for samples diluted 1:4 with ultrapure water. The measurements were performed by ICP-MS/MS. The experimental conditions are available in Table S1 in the Supplementary Materials. He was used as a collision gas (light grey), or no-gas mode was employed (dark grey). The mean (bars) and standard error of the mean (error bars) are shown. For those elements with average recovery values outside the range displayed on the axis, numerical values are provided.
Toxics 11 00399 g003
Table 1. ICP-MS spectroscopic interferences found when analyzing peritoneal fluids for isotopes of various elements.
IsotopeAbundance (%)Interference from the Matrix/Argon Plasma
52Cr83.840Ar12C+, 35Cl17O+
56Fe91.740Ca16O+,40Ar16O+
63Cu69.236Ar12C14N1H+, 14N12C37Cl+, 16O12C35Cl+
68Zn18.640Ar14N2+, 35Cl16O17O+, 64S2+, 38Ar32S+
75As10023Na12C40Ar, 12C31P16O2+, 40Ar35Cl+, 36Ar39K+
Table 2. Limits of detection (LOD) and quantification (LOQ) in He and no-gas modes (µg L−1), obtained on four different days. The measurements were performed by ICP-MS/MS. The experimental conditions are available in Table S1 in the Supplementary Materials. He was used as a collision gas.
LOD (µg L−1)LOQ (µg L−1)
No GasHe GasNo GasHe Gas
75As1.71.966
137Ba0.71.124
209Bi0.160.20.50.8
111Cd0.20.450.71.5
59Co0.190.20.60.9
52Cr0.30.51.11.6
63Cu3297
56Fe60420012
139La0.050.140.180.5
7Li0.31.61.05
55Mn0.30.71.02
95Mo1.80.461.3
60Ni0.61.01.93
208Pb0.50.21.70.8
85Rb0.140.50.41.7
118Sn0.40.41.51.3
88Sr1.11.144
47Ti26718
51V0.70.321.0
68Zn1464719
Table 3. Analyte concentrations in five peritoneal fluid samples measured in He and no-gas modes. Concentrations are expressed in μg L−1. The measurements were performed by ICP-MS/MS. The experimental conditions are available in Table S1 in the Supplementary Materials. He was used as a collision gas.
AnalytePeritoneal Fluid Sample
Sample 1Sample 2Sample 3Sample 4Sample 5
137Ba (No Gas)2.8 ± 0.32.7 ± 0.418.4 ±1.011.0 ±1.419.7 ± 0.8
137Ba (He)0.58 ± 0.15<LOQ (4)16.9 ± 1.413.8 ± 0.819.2 ± 0.7
209Bi (No Gas)0.34 ± 0.070.34 ± 0.120.77 ± 0.130.20 ± 0.020.17 ± 0.03
209Bi (He)<LOQ (0.8)<LOQ (0.8)0.85 ± 0.090.49 ± 0.03<LOQ (0.8)
111Cd (No Gas)<LOQ (0.5)<LOQ (0.5)<LOQ (0.5)<LOQ (0.5)4.4 ± 0.4
111Cd (He)<LOQ (1.5)<LOQ (1.5)<LOQ (1.5)<LOQ (1.5)5.3 ± 1.7
59Co (No Gas)<LOQ (0.3)<LOQ (0.3)<LOQ (0.3)<LOQ (0.3)2.50 ± 0.06
59Co (He)<LOQ (0.9)<LOQ (0.9)<LOQ (0.9)<LOQ (0.9)1.9 ± 0.5
139La (No Gas)<LOQ (0.14)<LOQ (0.14)0.21 ± 0.030.24 ± 0.053.22 ± 0.16
139La (He)<LOQ (0.5)<LOQ (0.5)<LOQ (0.5)<LOQ (0.5)2.80 ± 0.09
7Li (No Gas)2.70 ± 0.07<LOQ (0.9)10.8 ± 0.2<LOQ (0.9)<LOQ (0.9)
7Li (He)<LOQ (5)<LOQ (5)9.8 ± 0.5<LOQ (5)<LOQ (5)
55Mn (No Gas)1.06 ± 0.042.18 ± 0.08<LOQ (0.7)<LOQ (0.7)3.70 ± 0.11
55Mn (He)<LOQ (2)<LOQ (2)<LOQ (2)<LOQ (2)<LOQ (2)
60Ni (No Gas)3.0 ± 0.34.4 ± 0.65.10 ± 0.1211.1 ± 0.46.8 ± 0.4
60Ni (He)<LOQ (3)<LOQ (3)5.5 ± 1.14.3 ± 0.96.2 ± 0.8
208Pb (No Gas)<LOQ (1.7)<LOQ (1.7)4.84 ± 0.082.77 ± 0.04<LOQ (1.7)
208Pb (He)0.98 ± 0.071.57 ± 0.114.64 ± 0.182.49 ± 0.161.33 ± 0.12
Table 4. Relative standard uncertainty contributions and expanded relative uncertainty for measurements of metal contents in peritoneal fluid samples in no-gas mode. A PF sample was spiked with a 50 µg L−1 multielemental solution, and five sub-samples were measured on four different days. The recovery values were obtained for samples diluted 1:4 with ultrapure water. The measurements were performed by ICP-MS/MS. The experimental conditions are available in Table S1 in the Supplementary Materials. No-gas mode was used.
137Ba209Bi111Cd59Co139La7Li55Mn59Mo60Ni208Pb85Rb118Sn88Sr47Ti51V
uip2.71.83.10.81.01.20.81.20.91.41.51.50.91.31.2
urep1.11.10.91.41.42.31.31.71.71.41.72.21.91.81.4
ut7.58.07.16.74.58.75.17.96.36.36.88.88.15.37.7
Expanded relative uncertainty (U, k = 2)16.016.615.613.89.618.210.616.313.113.214.318.416.711.515.8
Table 5. Relative standard uncertainty contributions and expanded relative uncertainty for measurements of Cr, Cu, Fe, and Zn contents in peritoneal fluid samples in He mode. A PF sample was spiked with a 50 µg L−1 multielemental solution, and five sub-samples were measured on four different days. The recovery values were obtained for samples diluted 1:4 with ultrapure water. The measurements were performed by ICP-MS/MS. The experimental conditions are available in Table S1 in the Supplementary Materials. He was used as a collision gas.
52Cr63Cu56Fe68Zn
uip1.71.31.31.3
urep2.51.81.61.9
ut7.36.98.08.2
Expanded relative uncertainty (U, k = 2)15.814.516.517.0
Table 6. Trace and ultra-trace metal elements and PTMEs; mean, standard error of the mean (SEM), minimum (min), and maximum (max) values, and percentages of samples above the limit of detection (%), found in 20 peritoneal fluid samples measured in no-gas mode. Samples were diluted 1:4 with ultrapure water. The measurements were performed by ICP-MS/MS. The experimental conditions are available in Table S1 in the Supplementary Materials.
AnalyteMean ± SEM
(μg L−1)
Min
(μg L−1)
Max
(μg L−1)
% > LOD
137Ba21.7 ± 31.82.7110.785
209Bi 4.7 ± 7.50.615.865
111Cd2.8 ± 1.50.94.455
59Co2.3 ± 0.32.12.540
139La0.6 ± 1.10.23.980
7Li12.7 ± 9.61.625.345
55Mn 4.6 ± 4.01.114.675
95Mo17.9--40
60Ni 5.4 ± 3.22.914.5100
208Pb6.3 ± 5.91.817.980
85Rb150.7 ± 57.977.2313.5100
118Sn3.8 ± 2.12.27.475
88Sr33.5 ± 11.19.854.1100
47Ti64.3 ± 68.912.2219100
51V7.4 ± 1.94.311.570
Table 7. Trace and ultra-trace metal elements and PTMEs; mean, standard error of the mean (SEM), minimum (min), and maximum (max) concentration values, and percentages of samples above the limit of detection (%), found in 20 peritoneal fluid samples measured in He mode. Samples were diluted 1:4 with ultrapure water. The measurements were performed by ICP-MS/MS. The experimental conditions are available in Table S1 in the Supplementary Materials.
AnalyteMean ± SEM
(μg L−1)
Min
(μg L−1)
Max
(μg L−1)
% > LOD
52Cr6.6 ± 7.91.735.1100
63Cu1115 ± 14663047221100
56Fe3118 ± 512333217,832100
68Zn6889 ± 13,38516947,040100
Disclaimer/Publisher’s Note: The statements, opinions and data contained in all publications are solely those of the individual author(s) and contributor(s) and not of MDPI and/or the editor(s). MDPI and/or the editor(s) disclaim responsibility for any injury to people or property resulting from any ideas, methods, instructions or products referred to in the content.

