
Preliminary Toxicological Analysis in a Safe-by-Design and Adverse Outcome Pathway-Driven Approach on Different Silver Nanoparticles: Assessment of Acute Responses in A549 Cells

 ,
,  ,
,  , ,
, ,  and
and 
Abstract

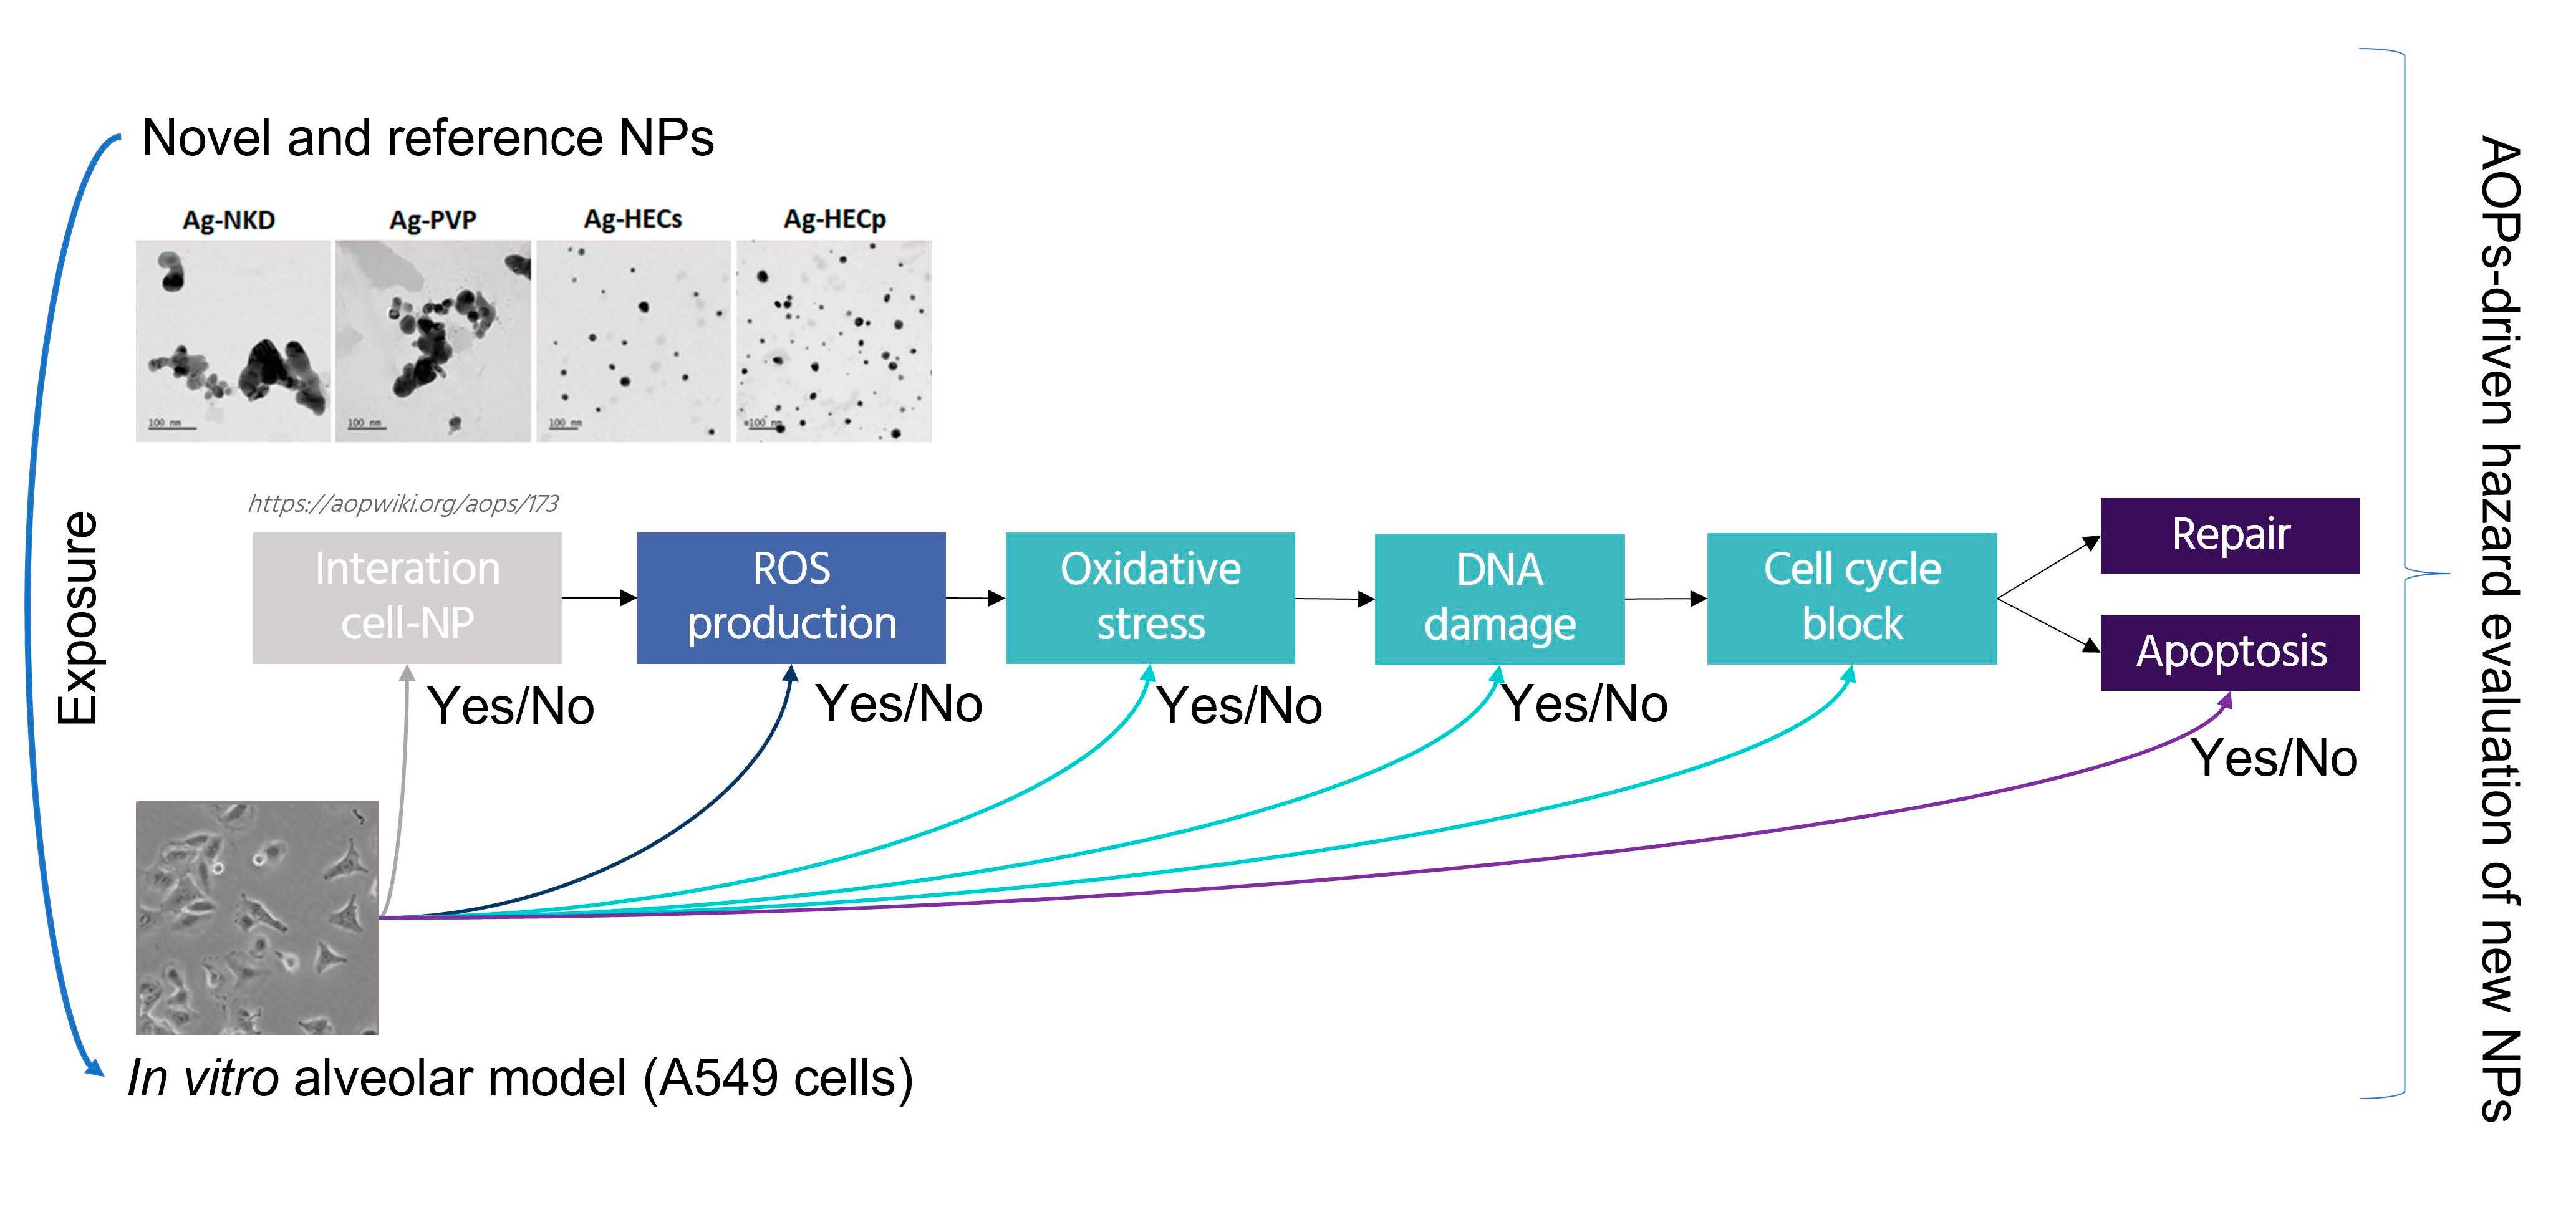
1. Introduction
2. Materials and Methods
2.1. Chemicals and Reagents
2.2. NP Suspension Preparation
2.3. Ag NP Characterization
2.4. Cell Culture
2.5. Viability Assay
2.6. Inflammatory Response
2.7. Intracellular ROS
2.8. DNA Damage
2.9. The Cell Cycle
2.10. Cell–Particle Bio-Interaction
2.11. Statistical Analysis
3. Results
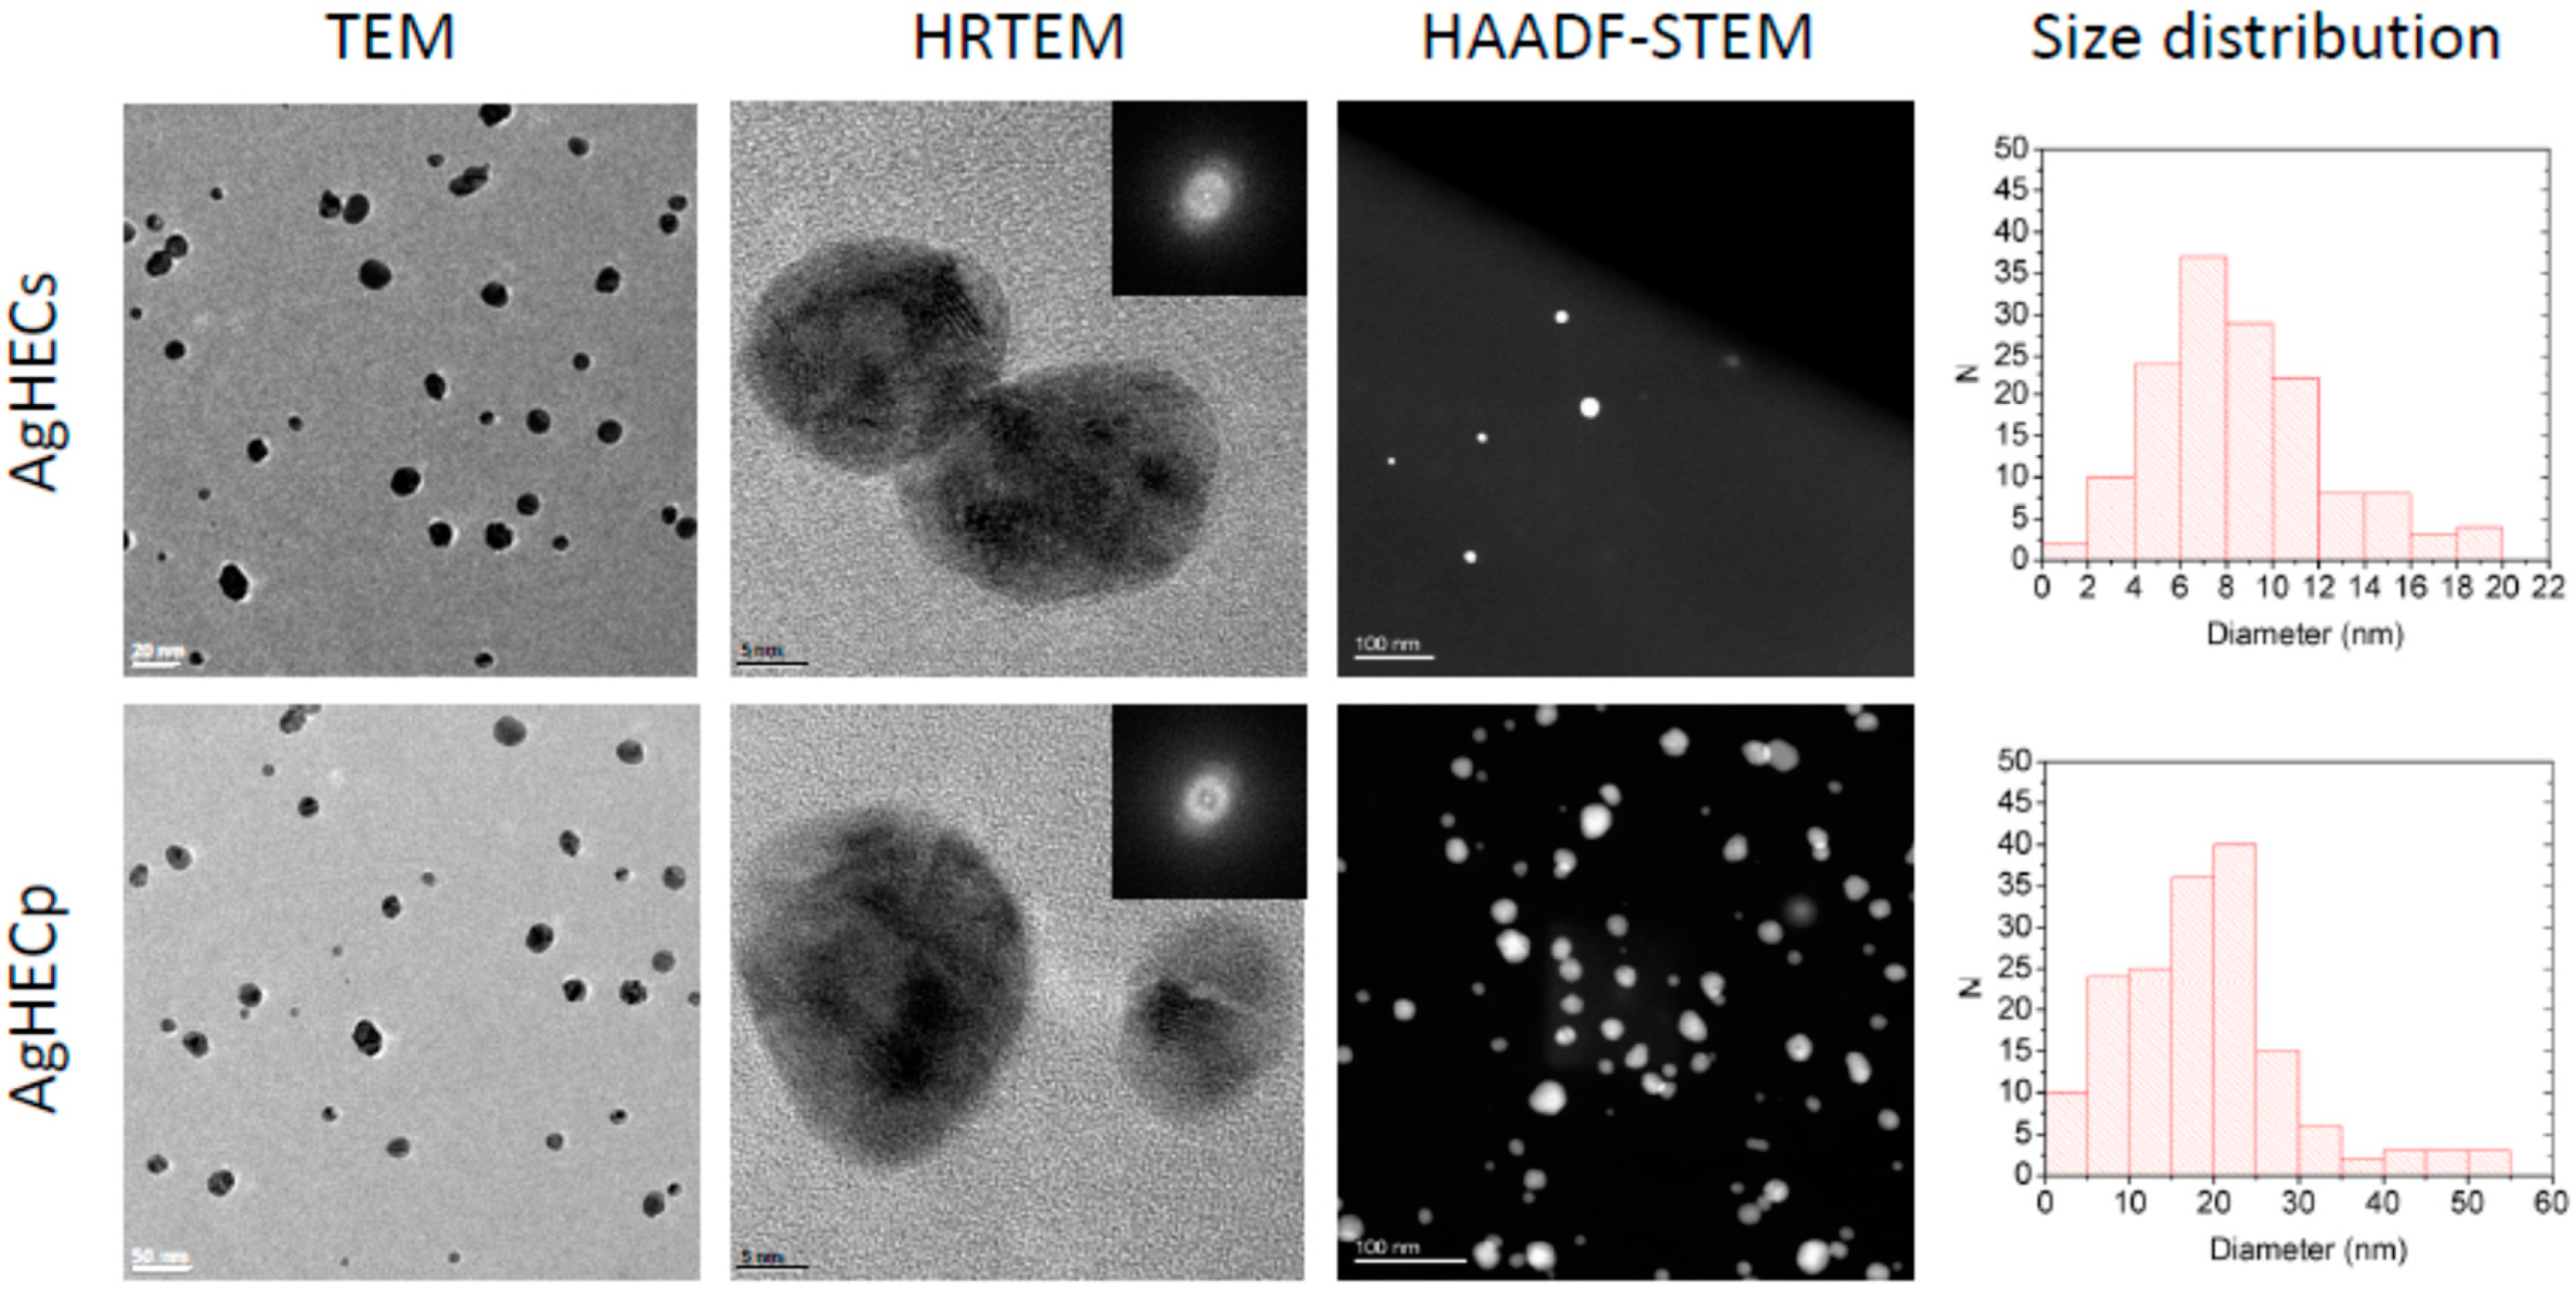
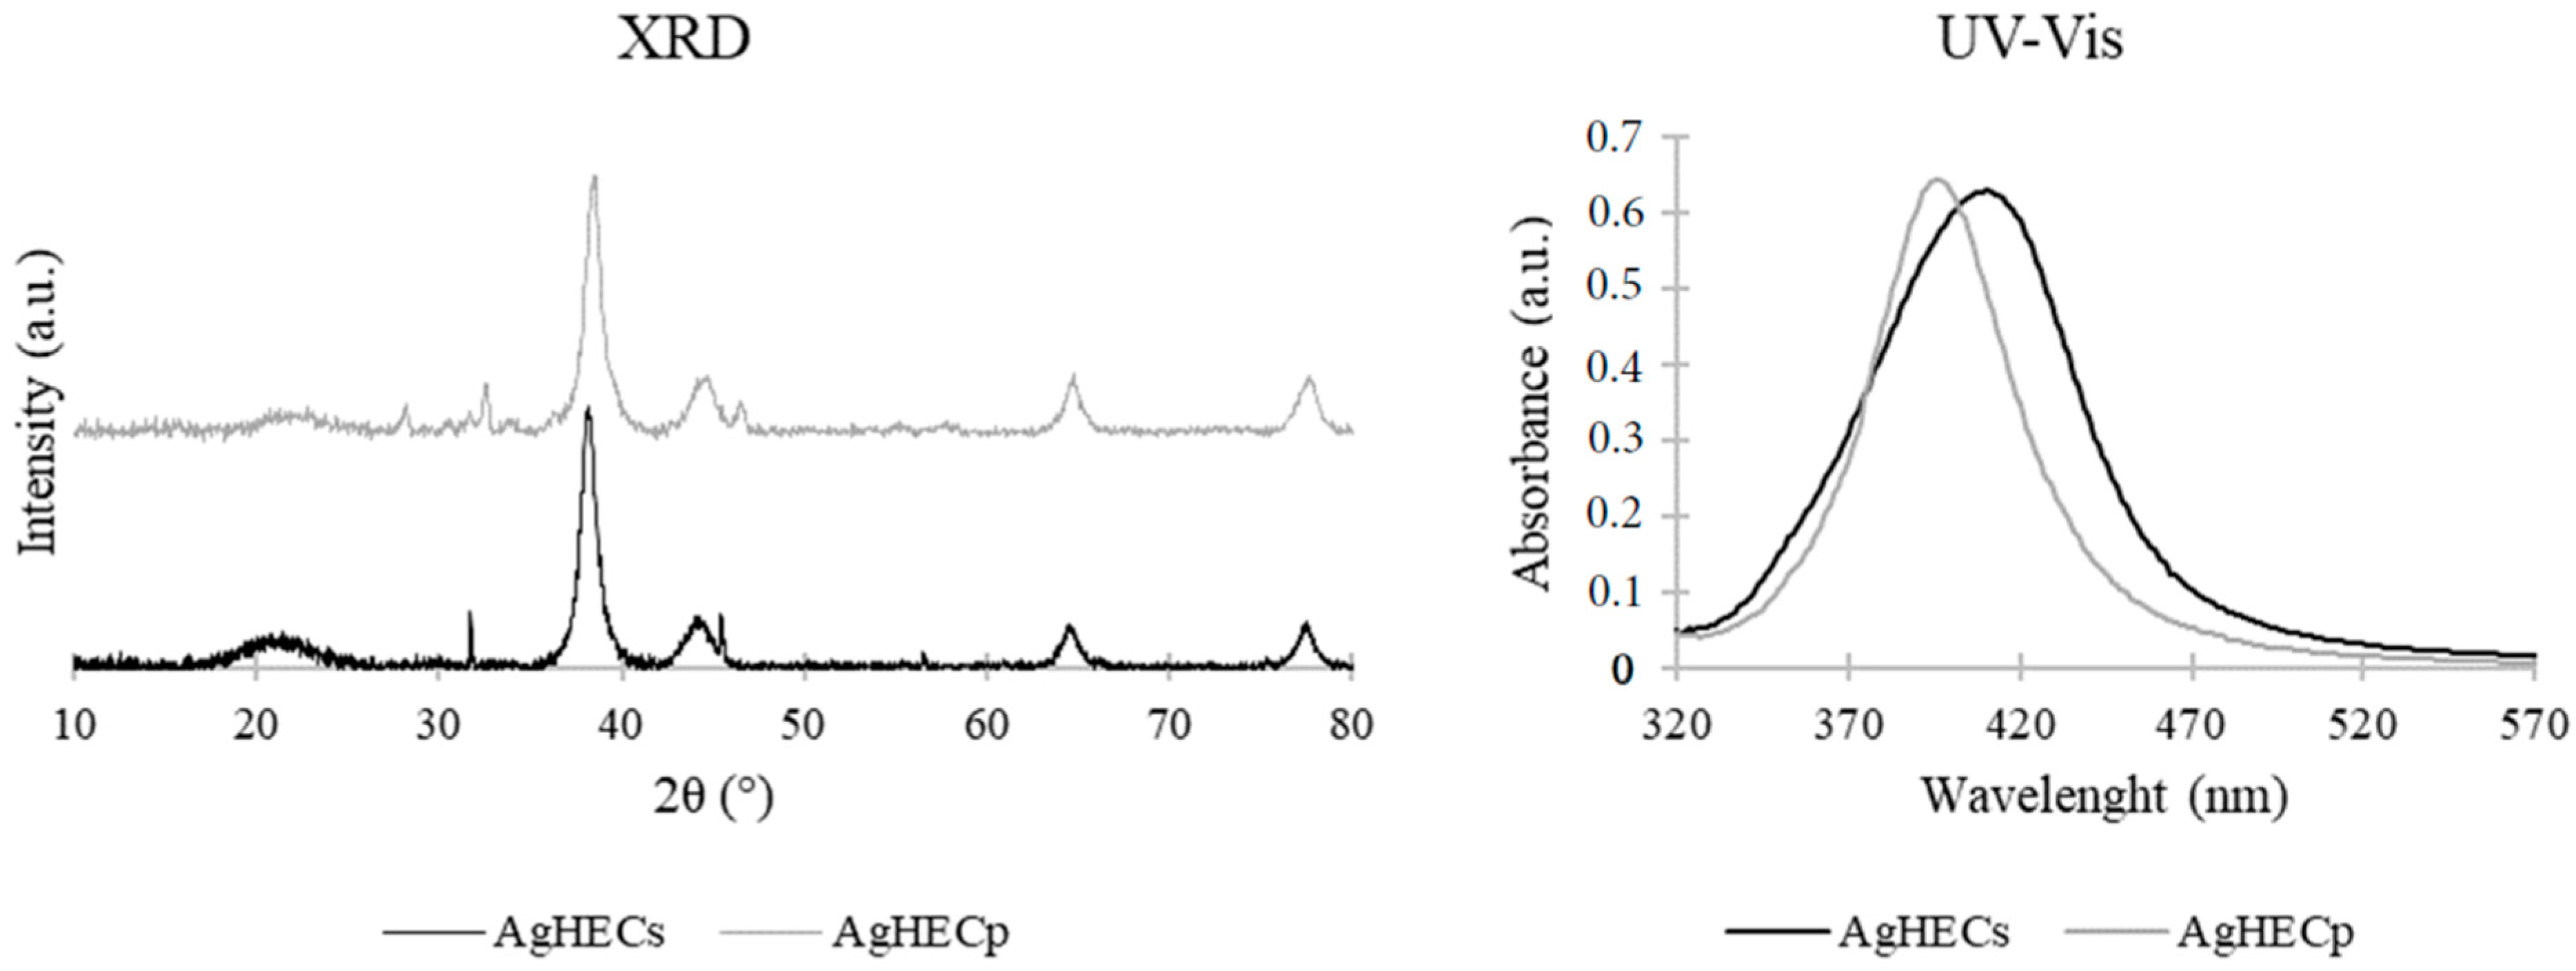
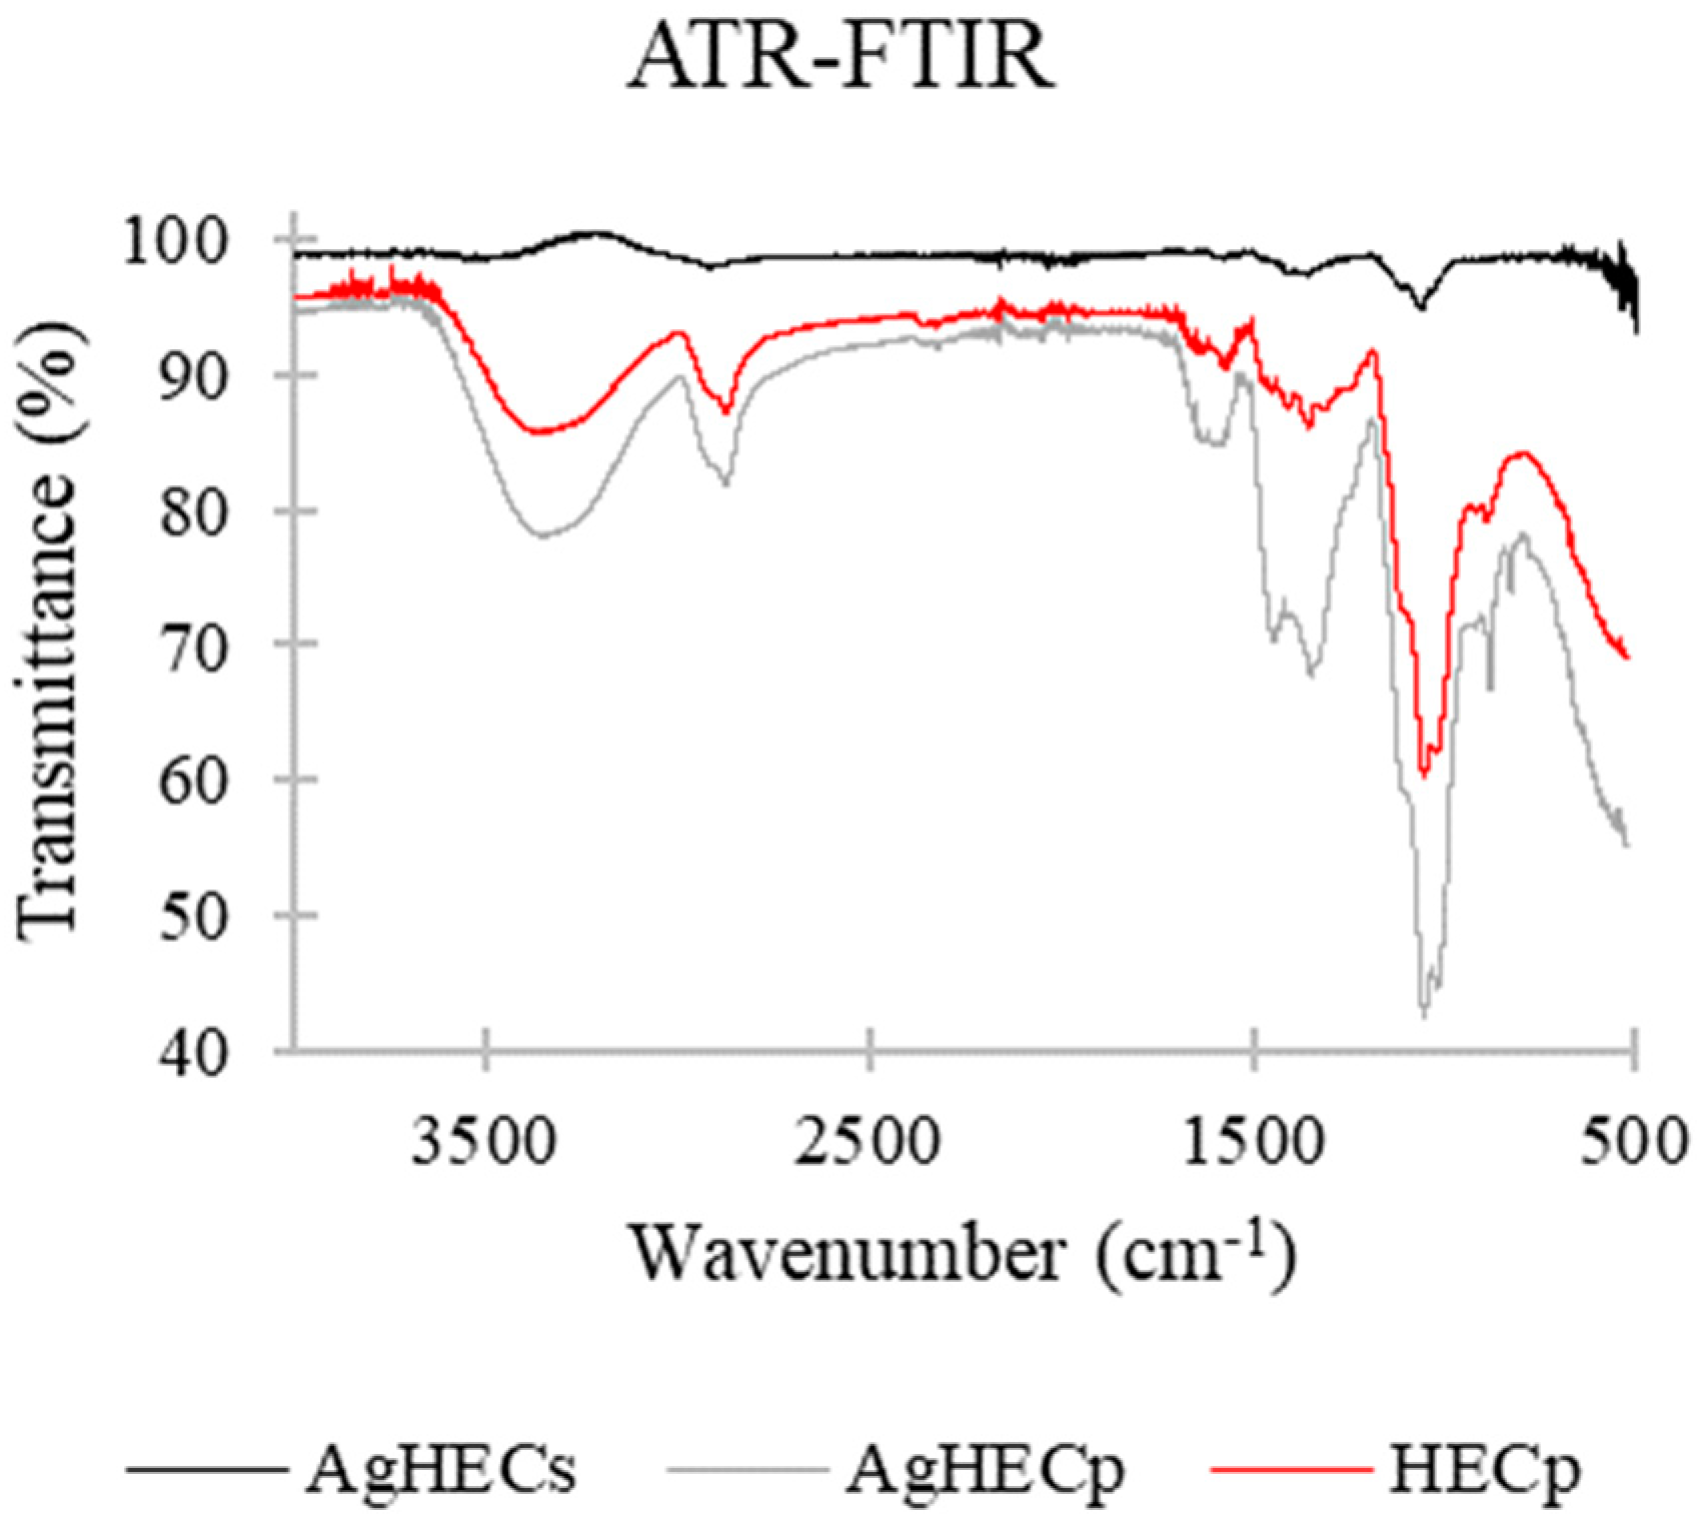
3.1. Novel AgHEC Particles Characterization
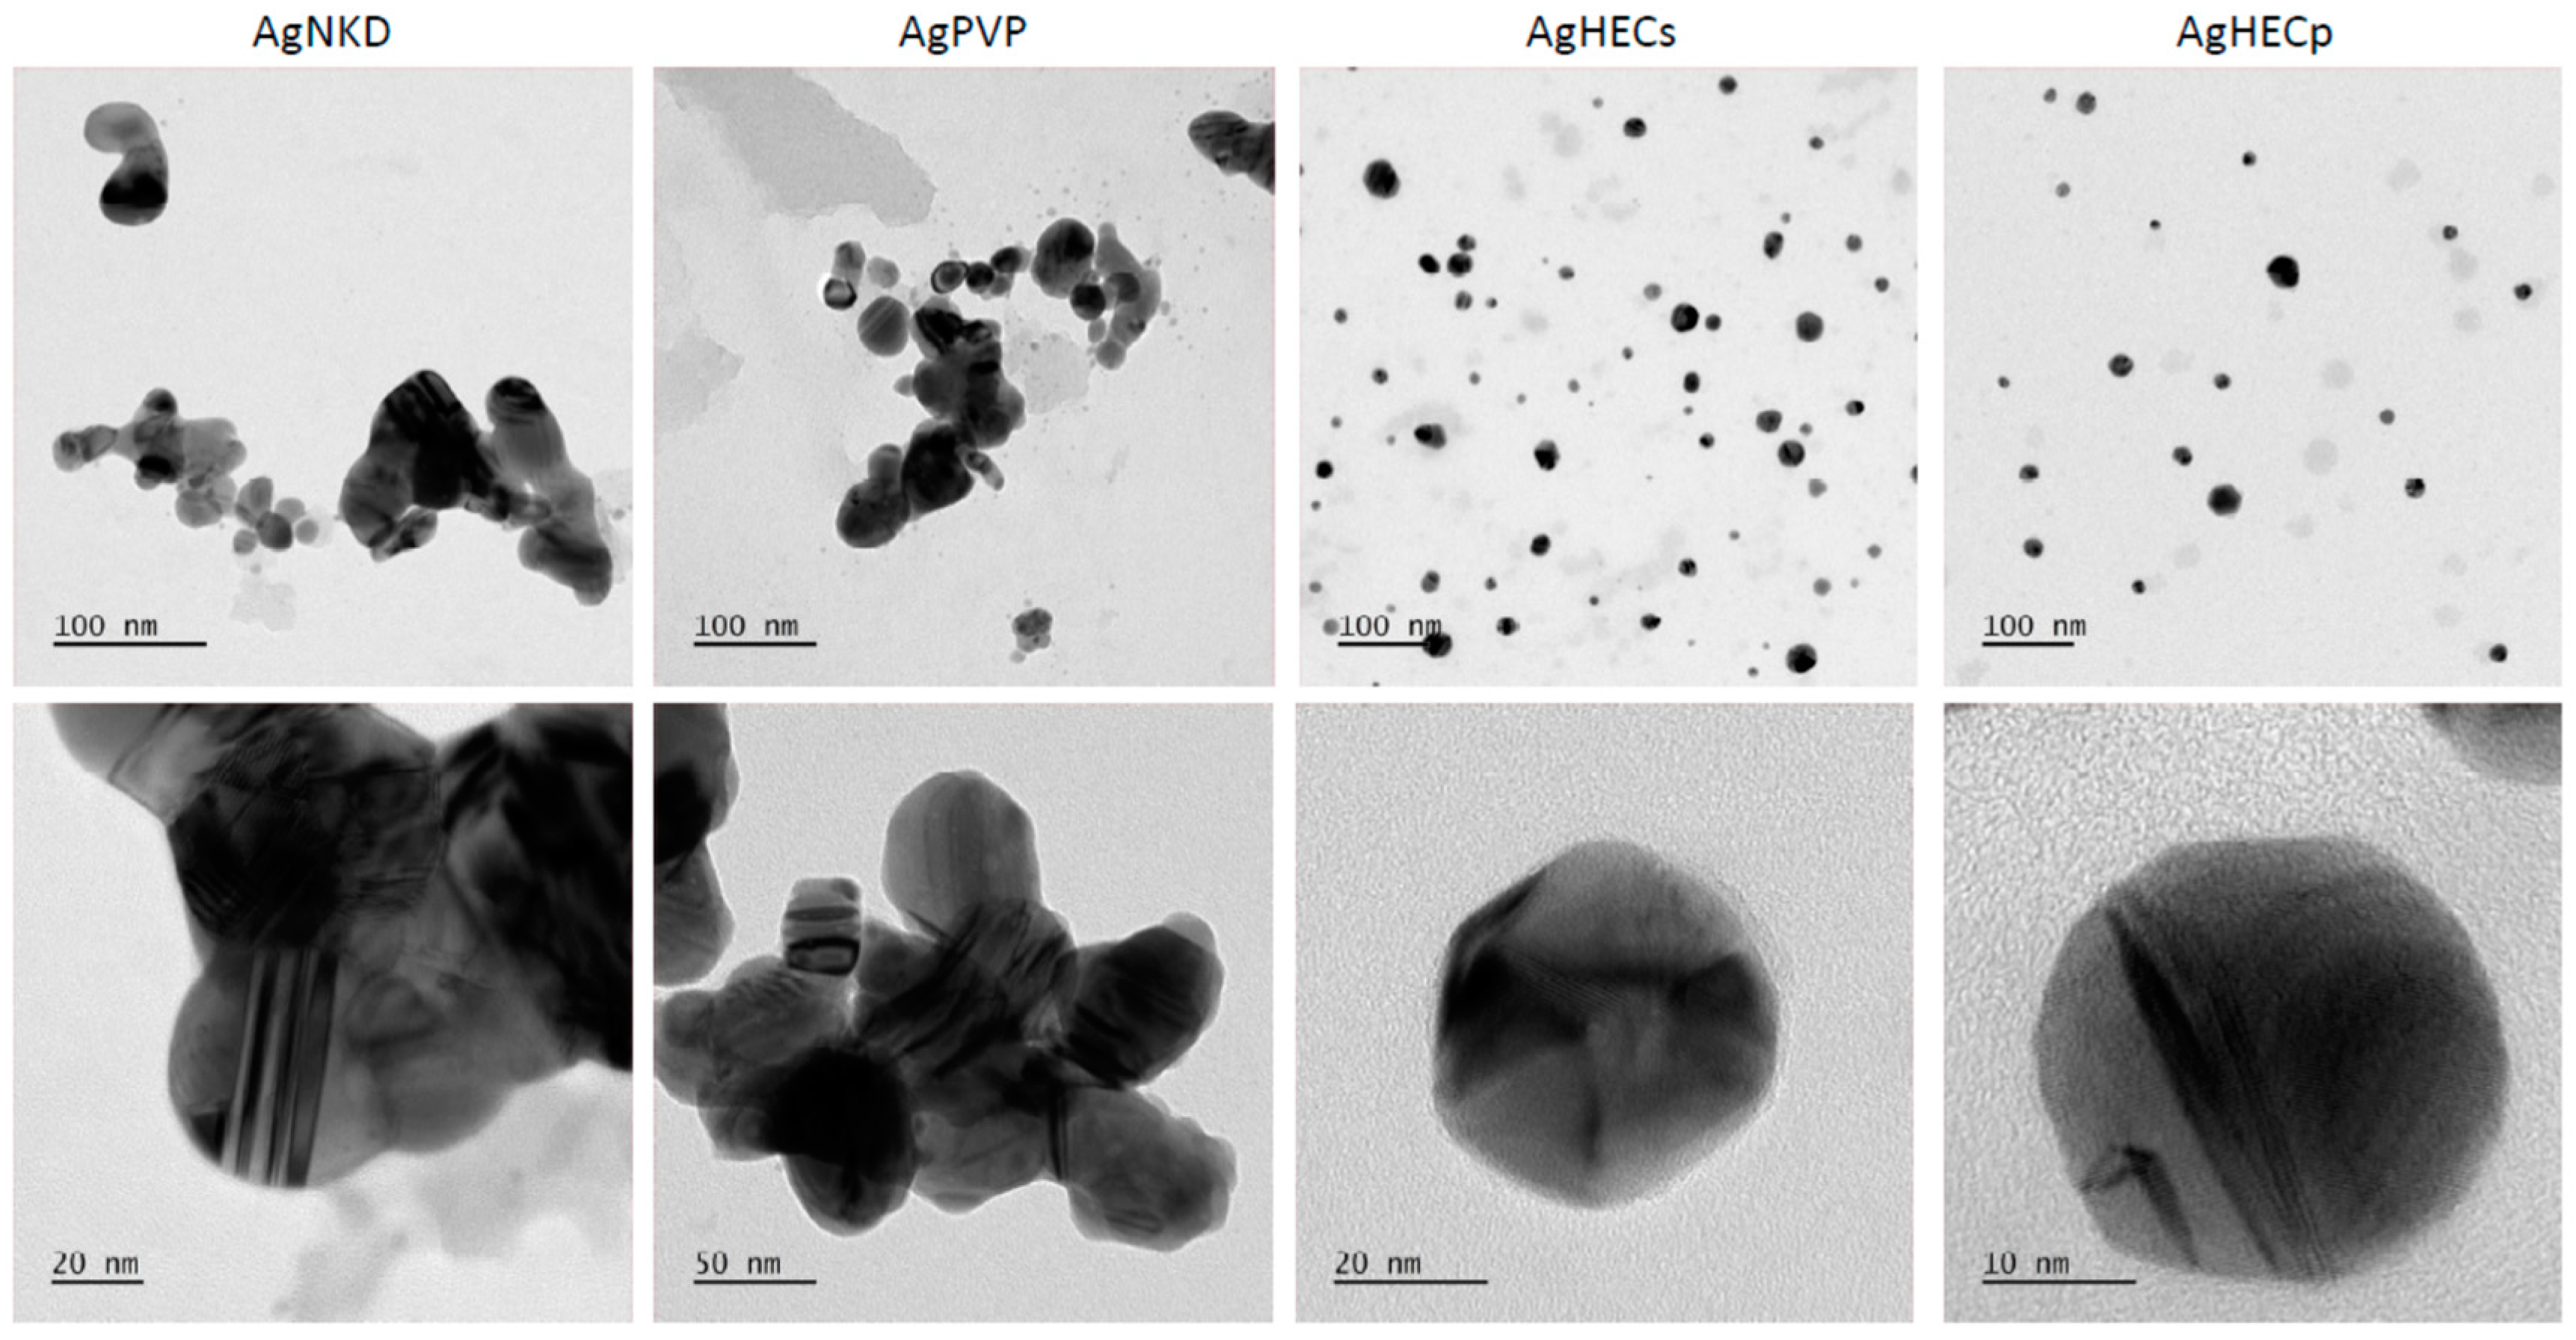
3.2. Ag NP Characterization for Toxicological Analyses
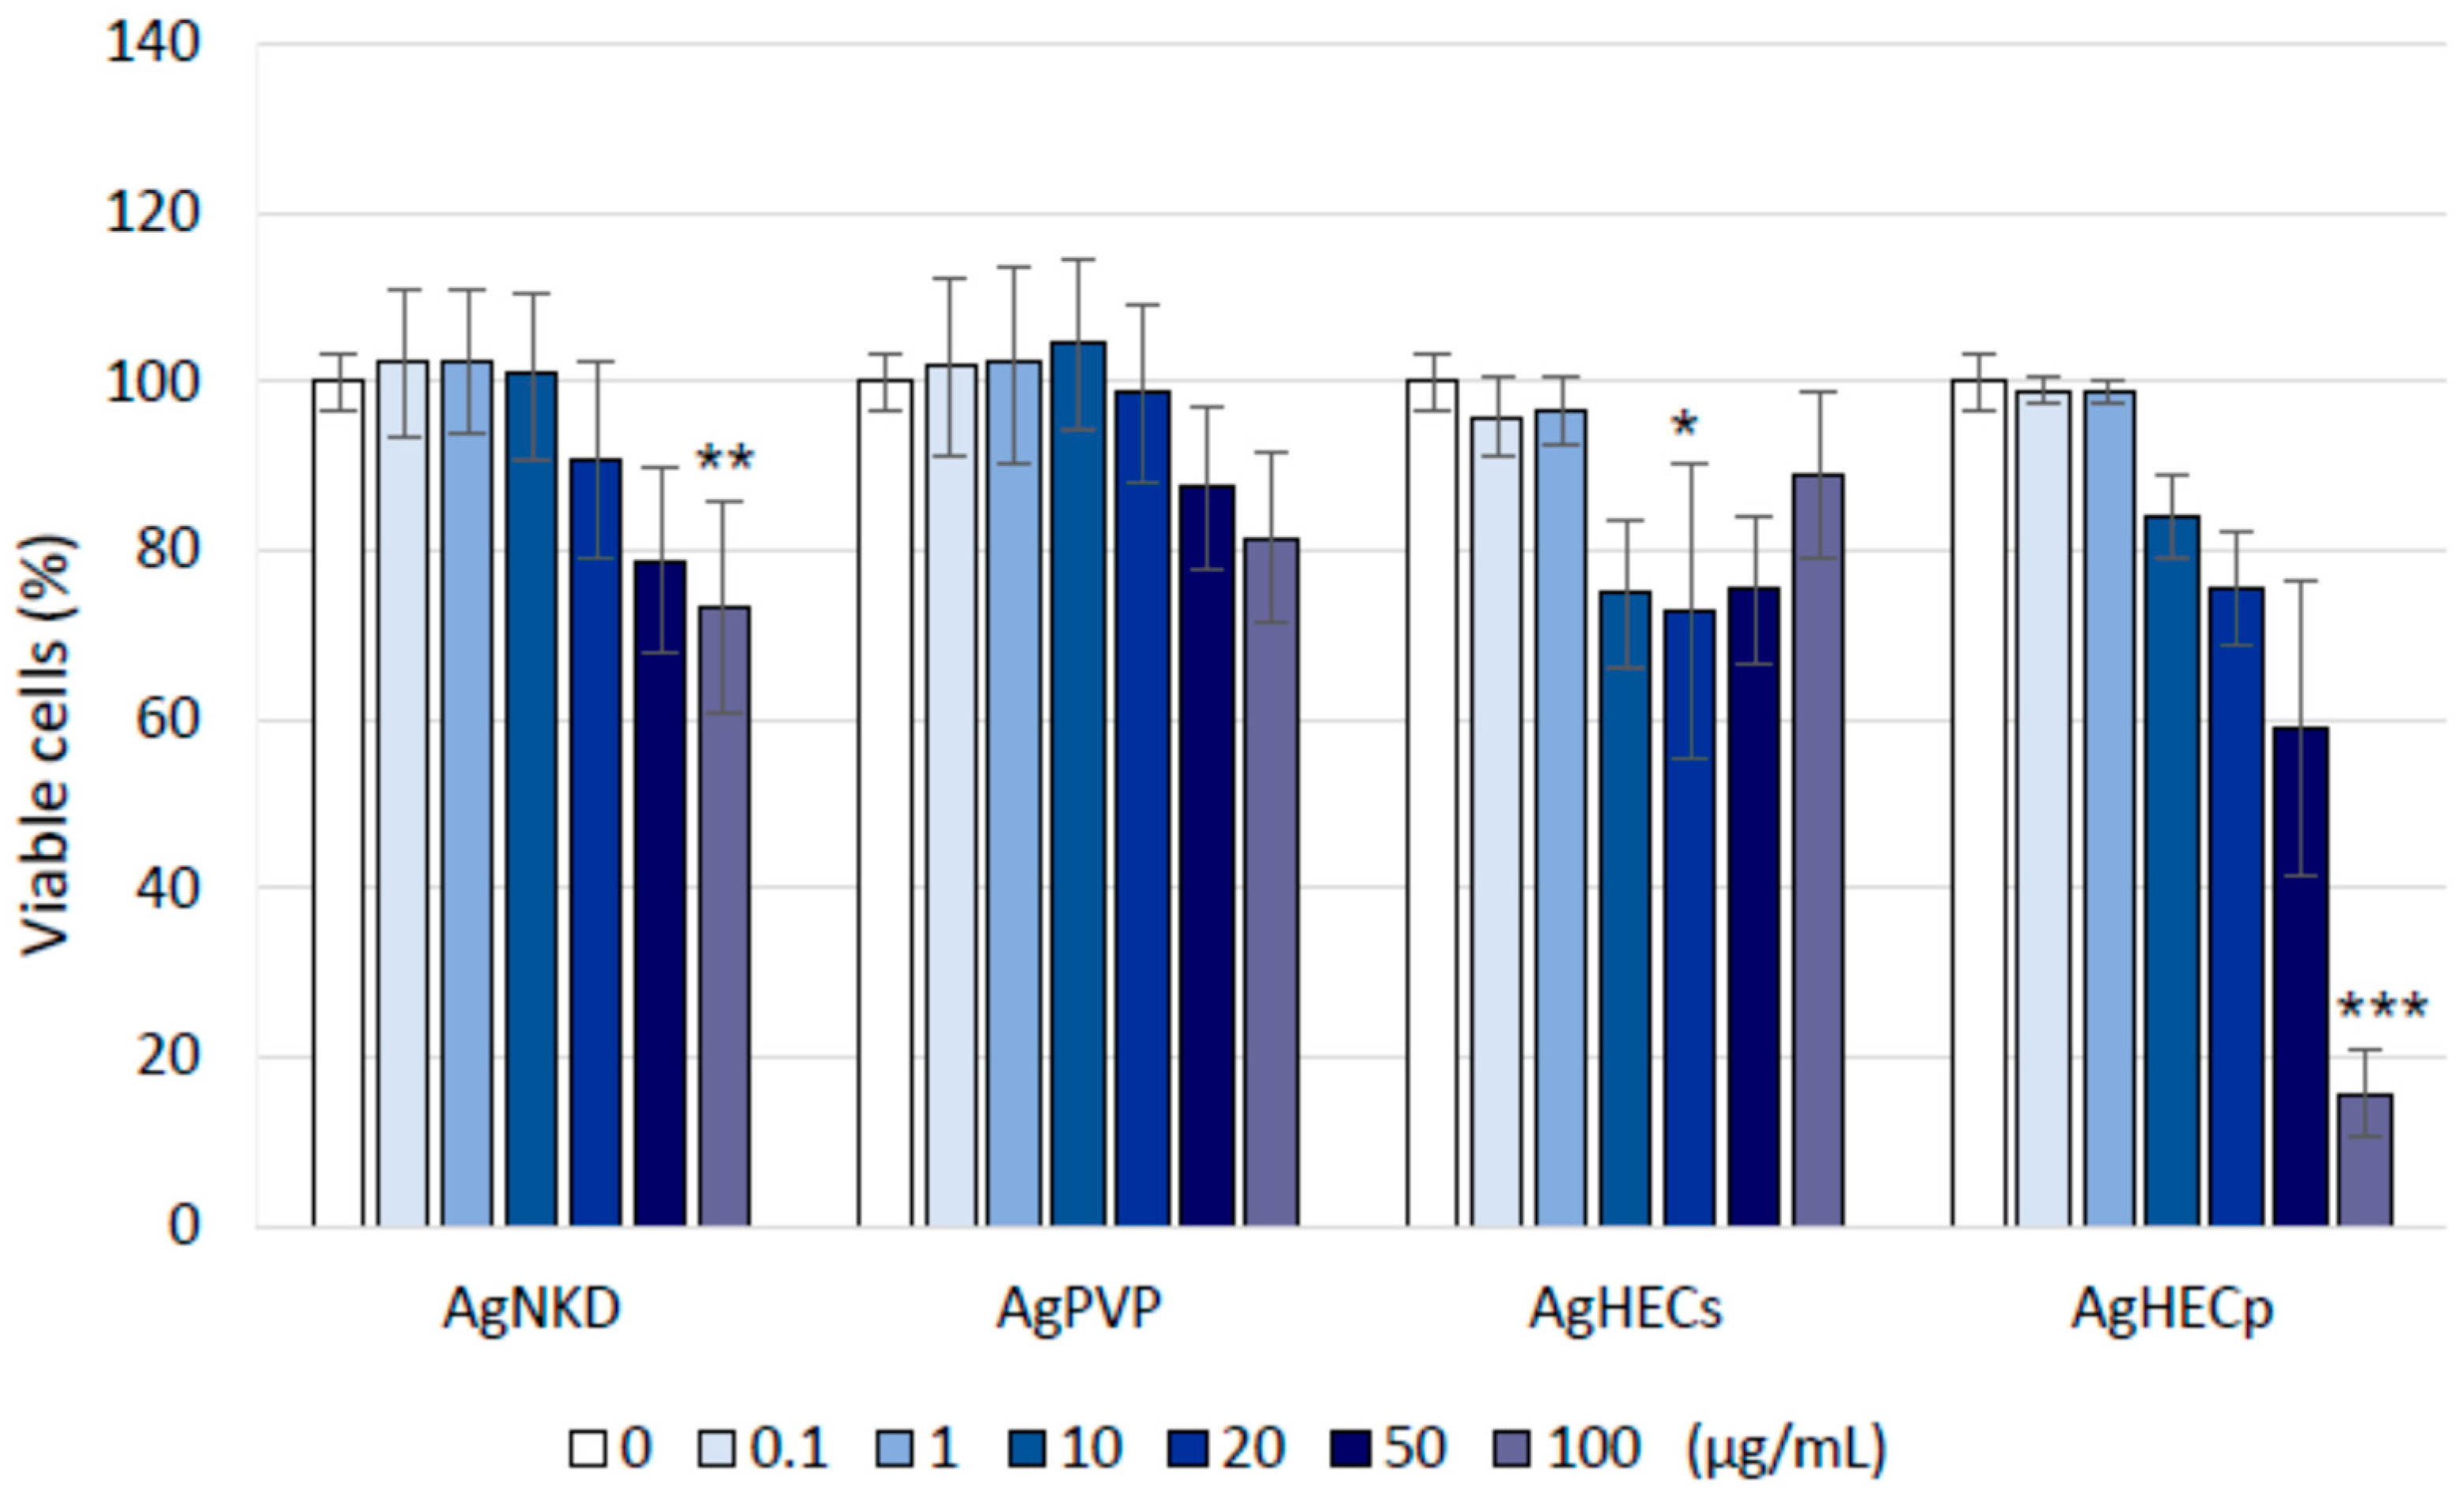
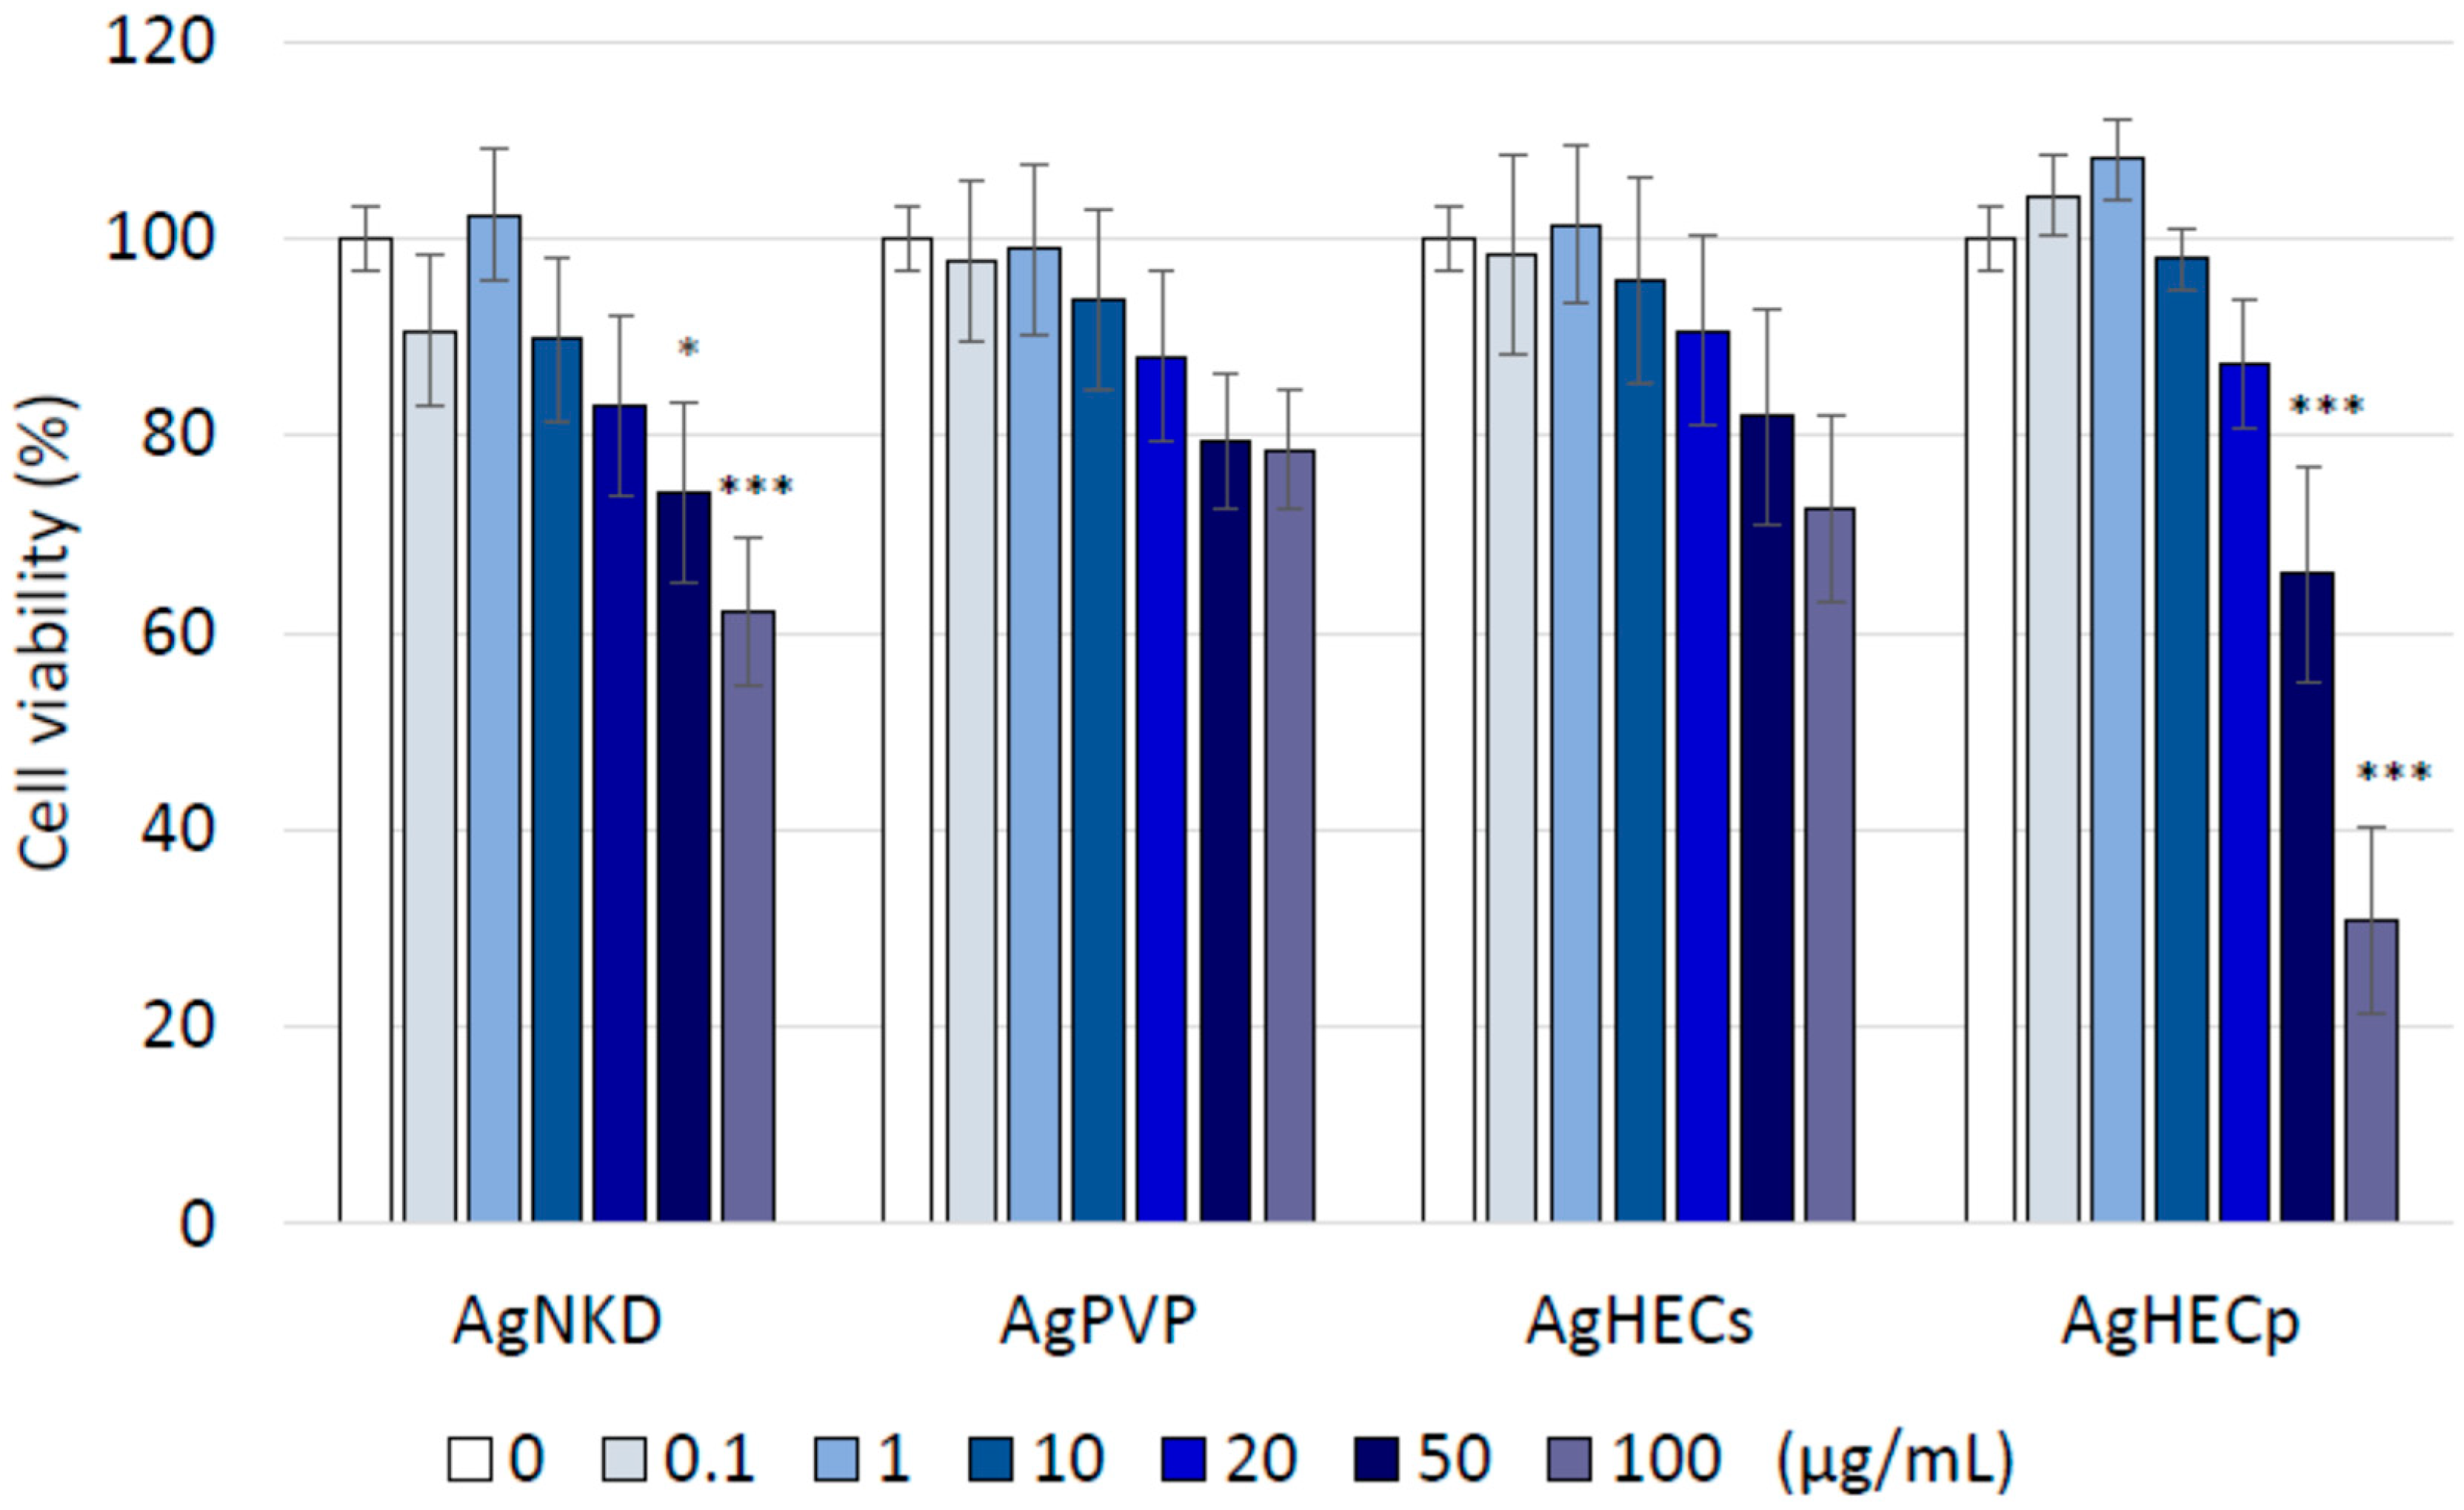
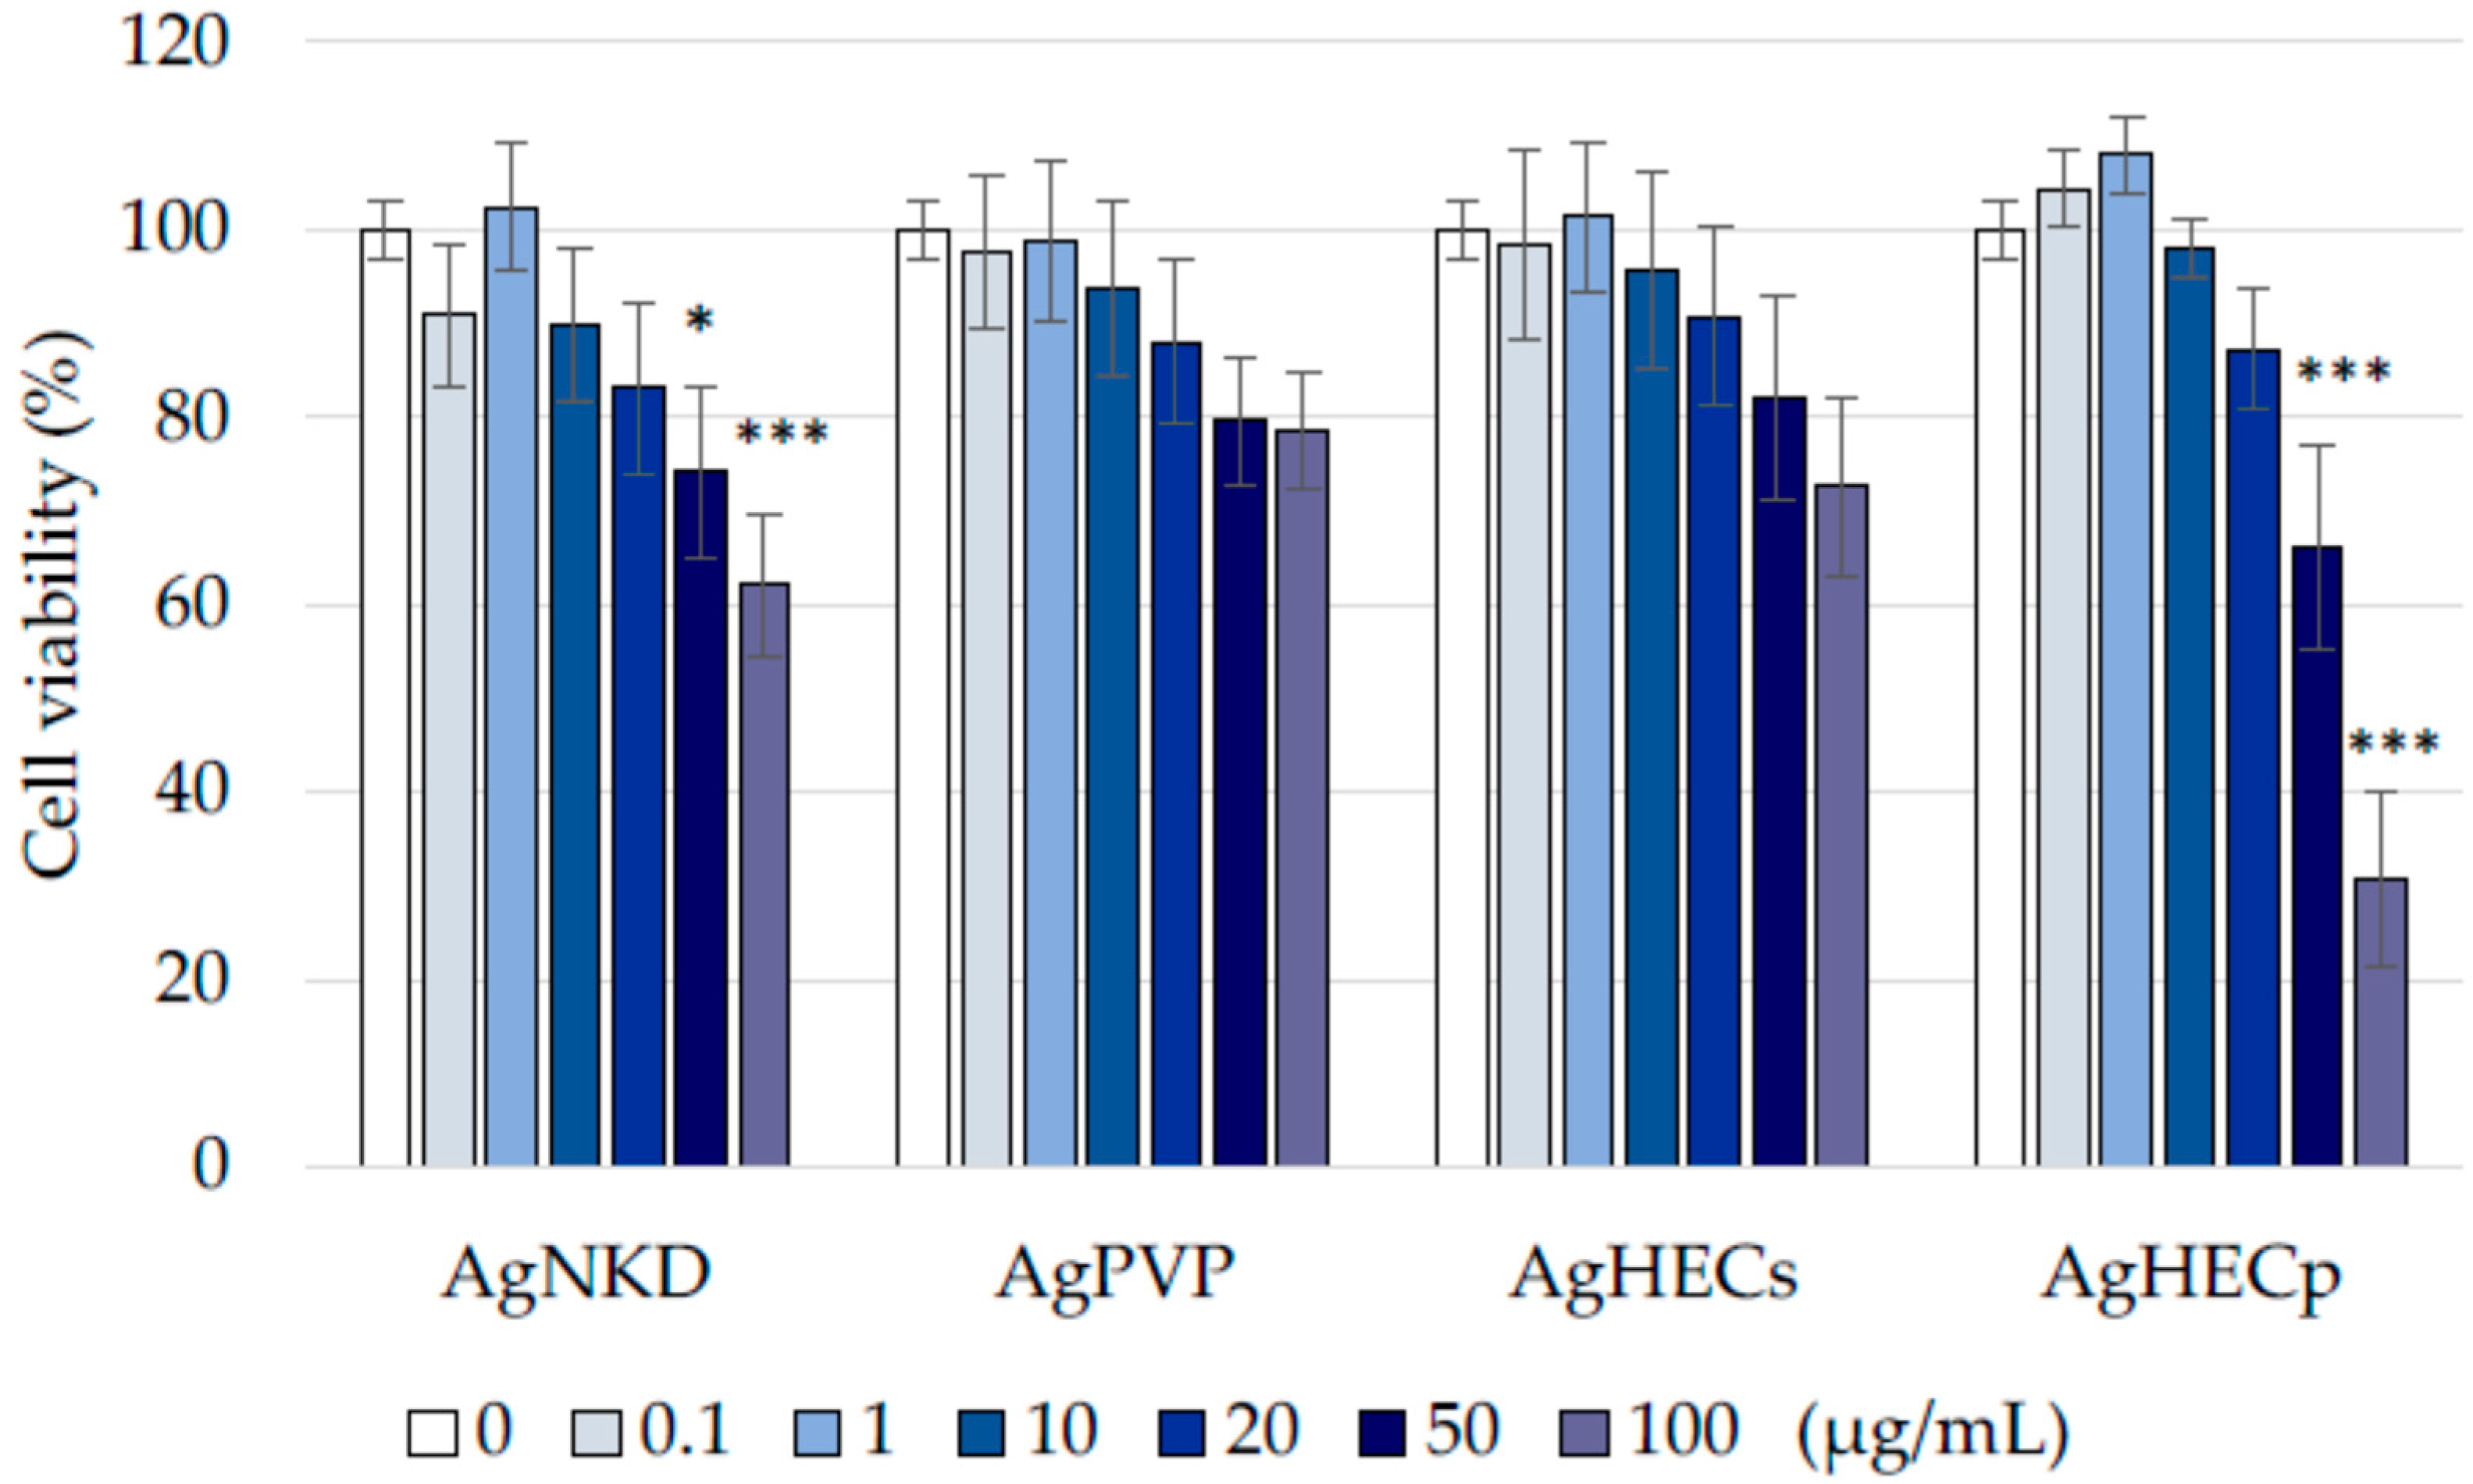
3.3. Cell Viability
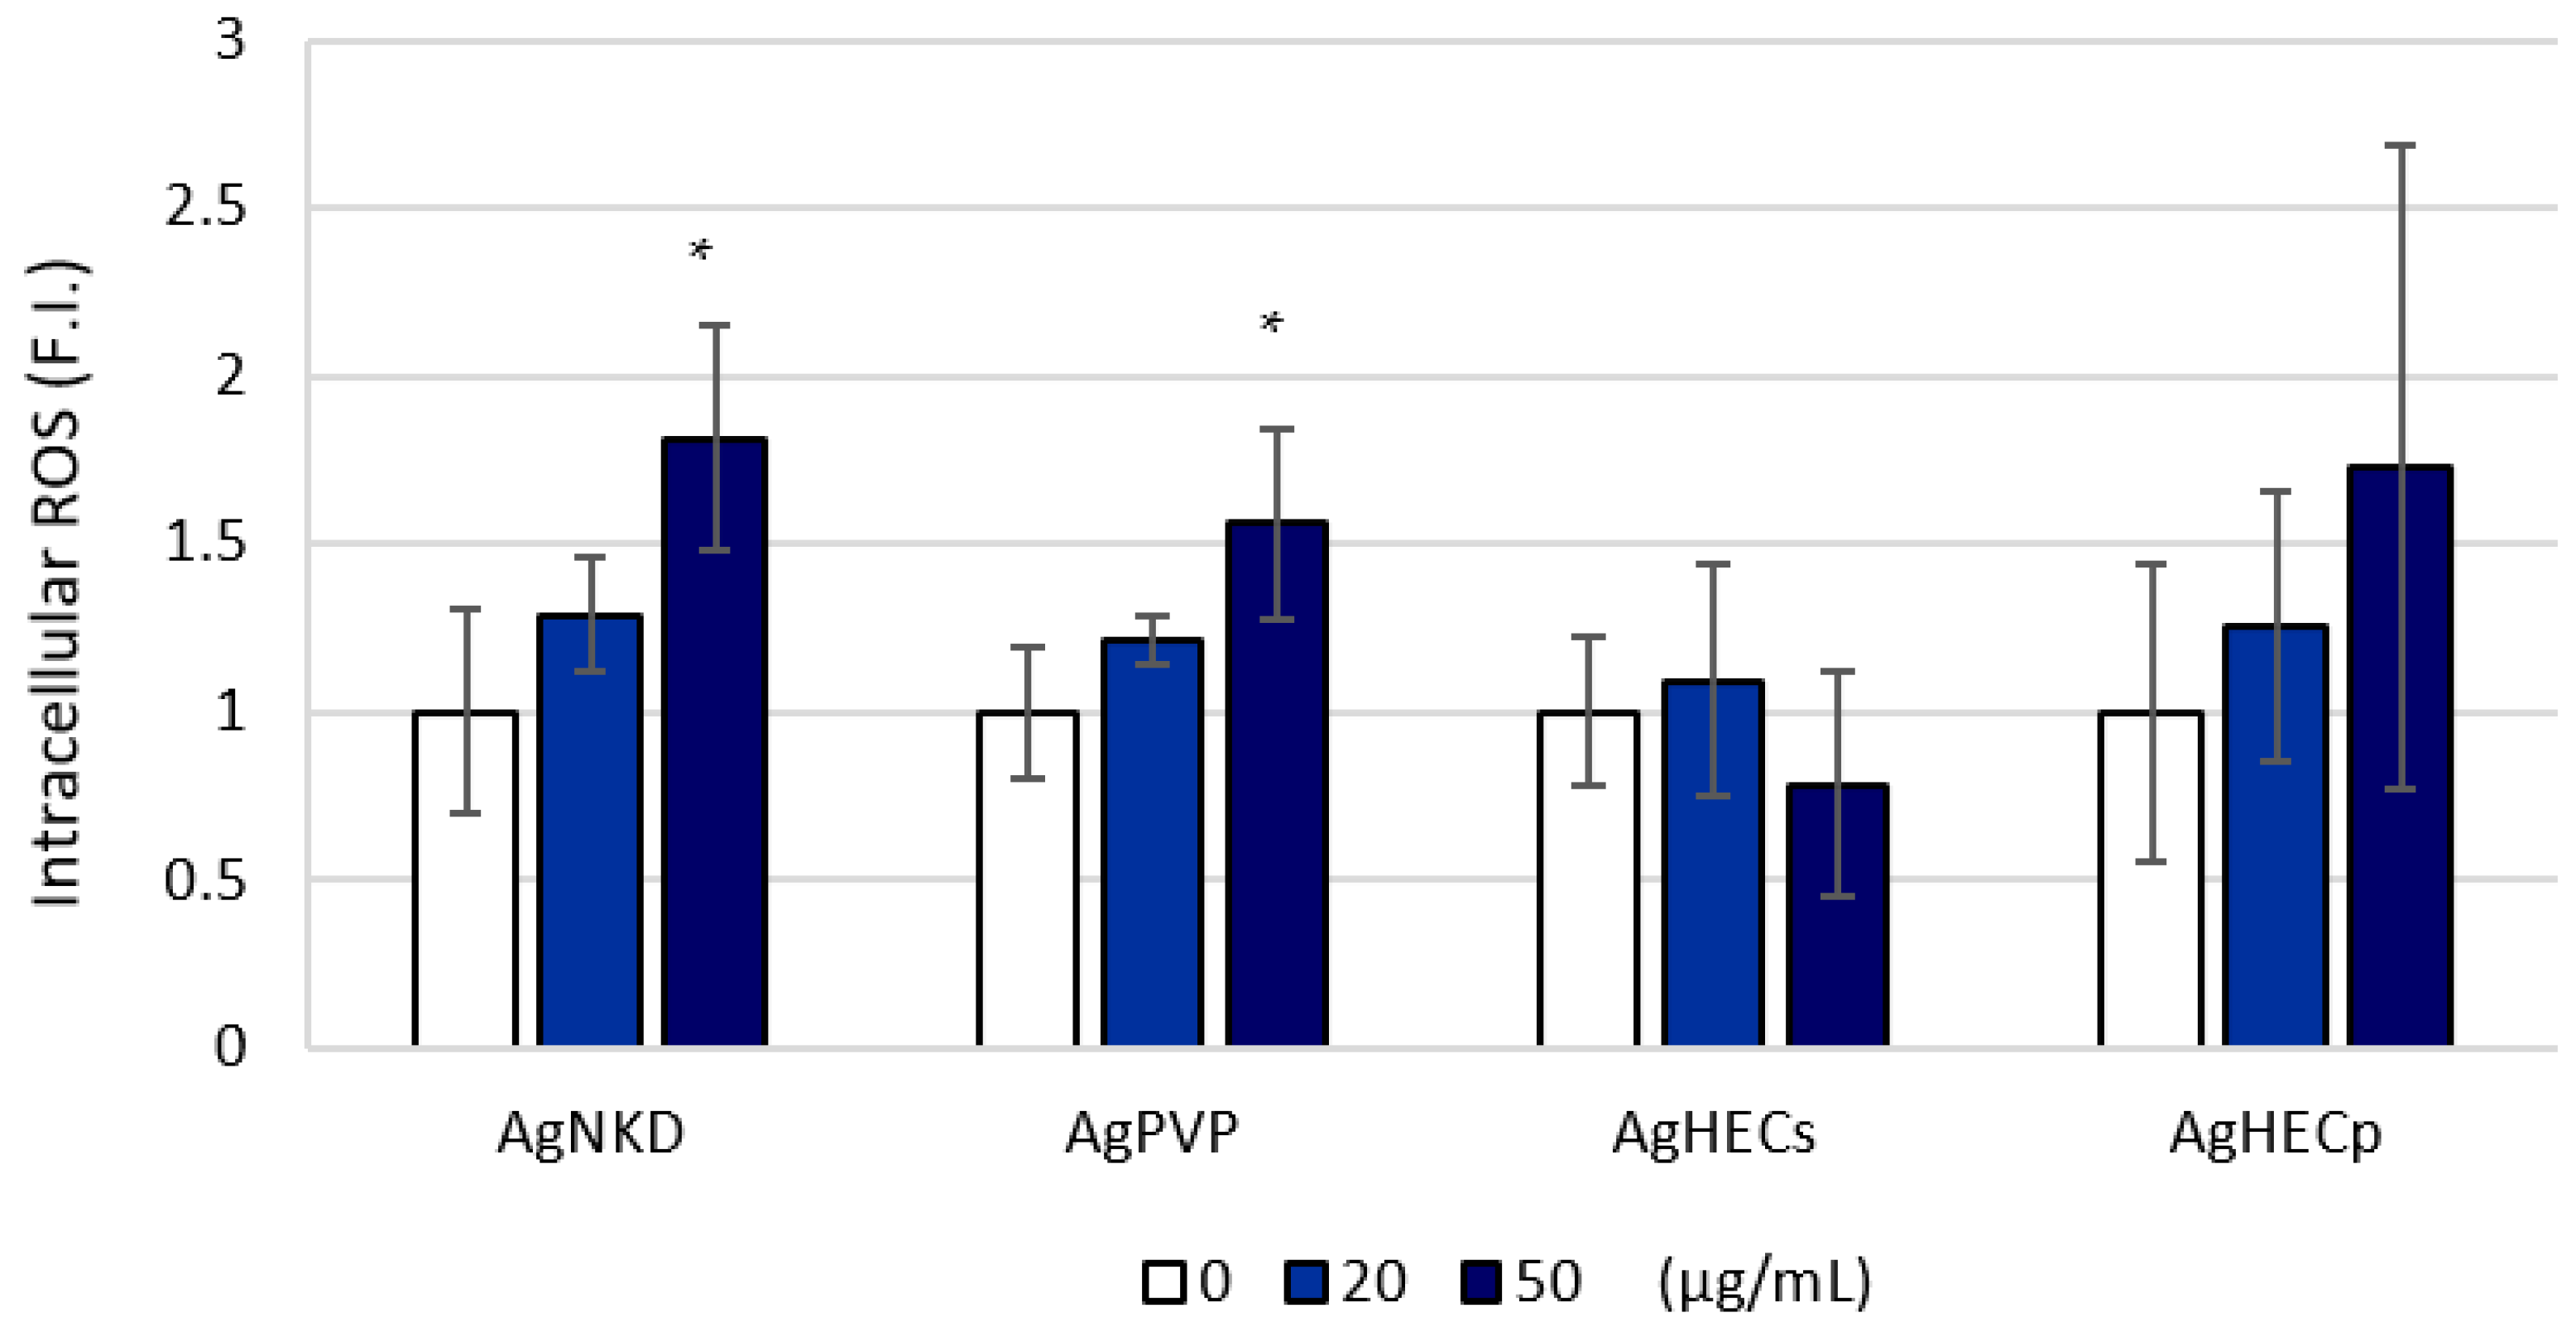
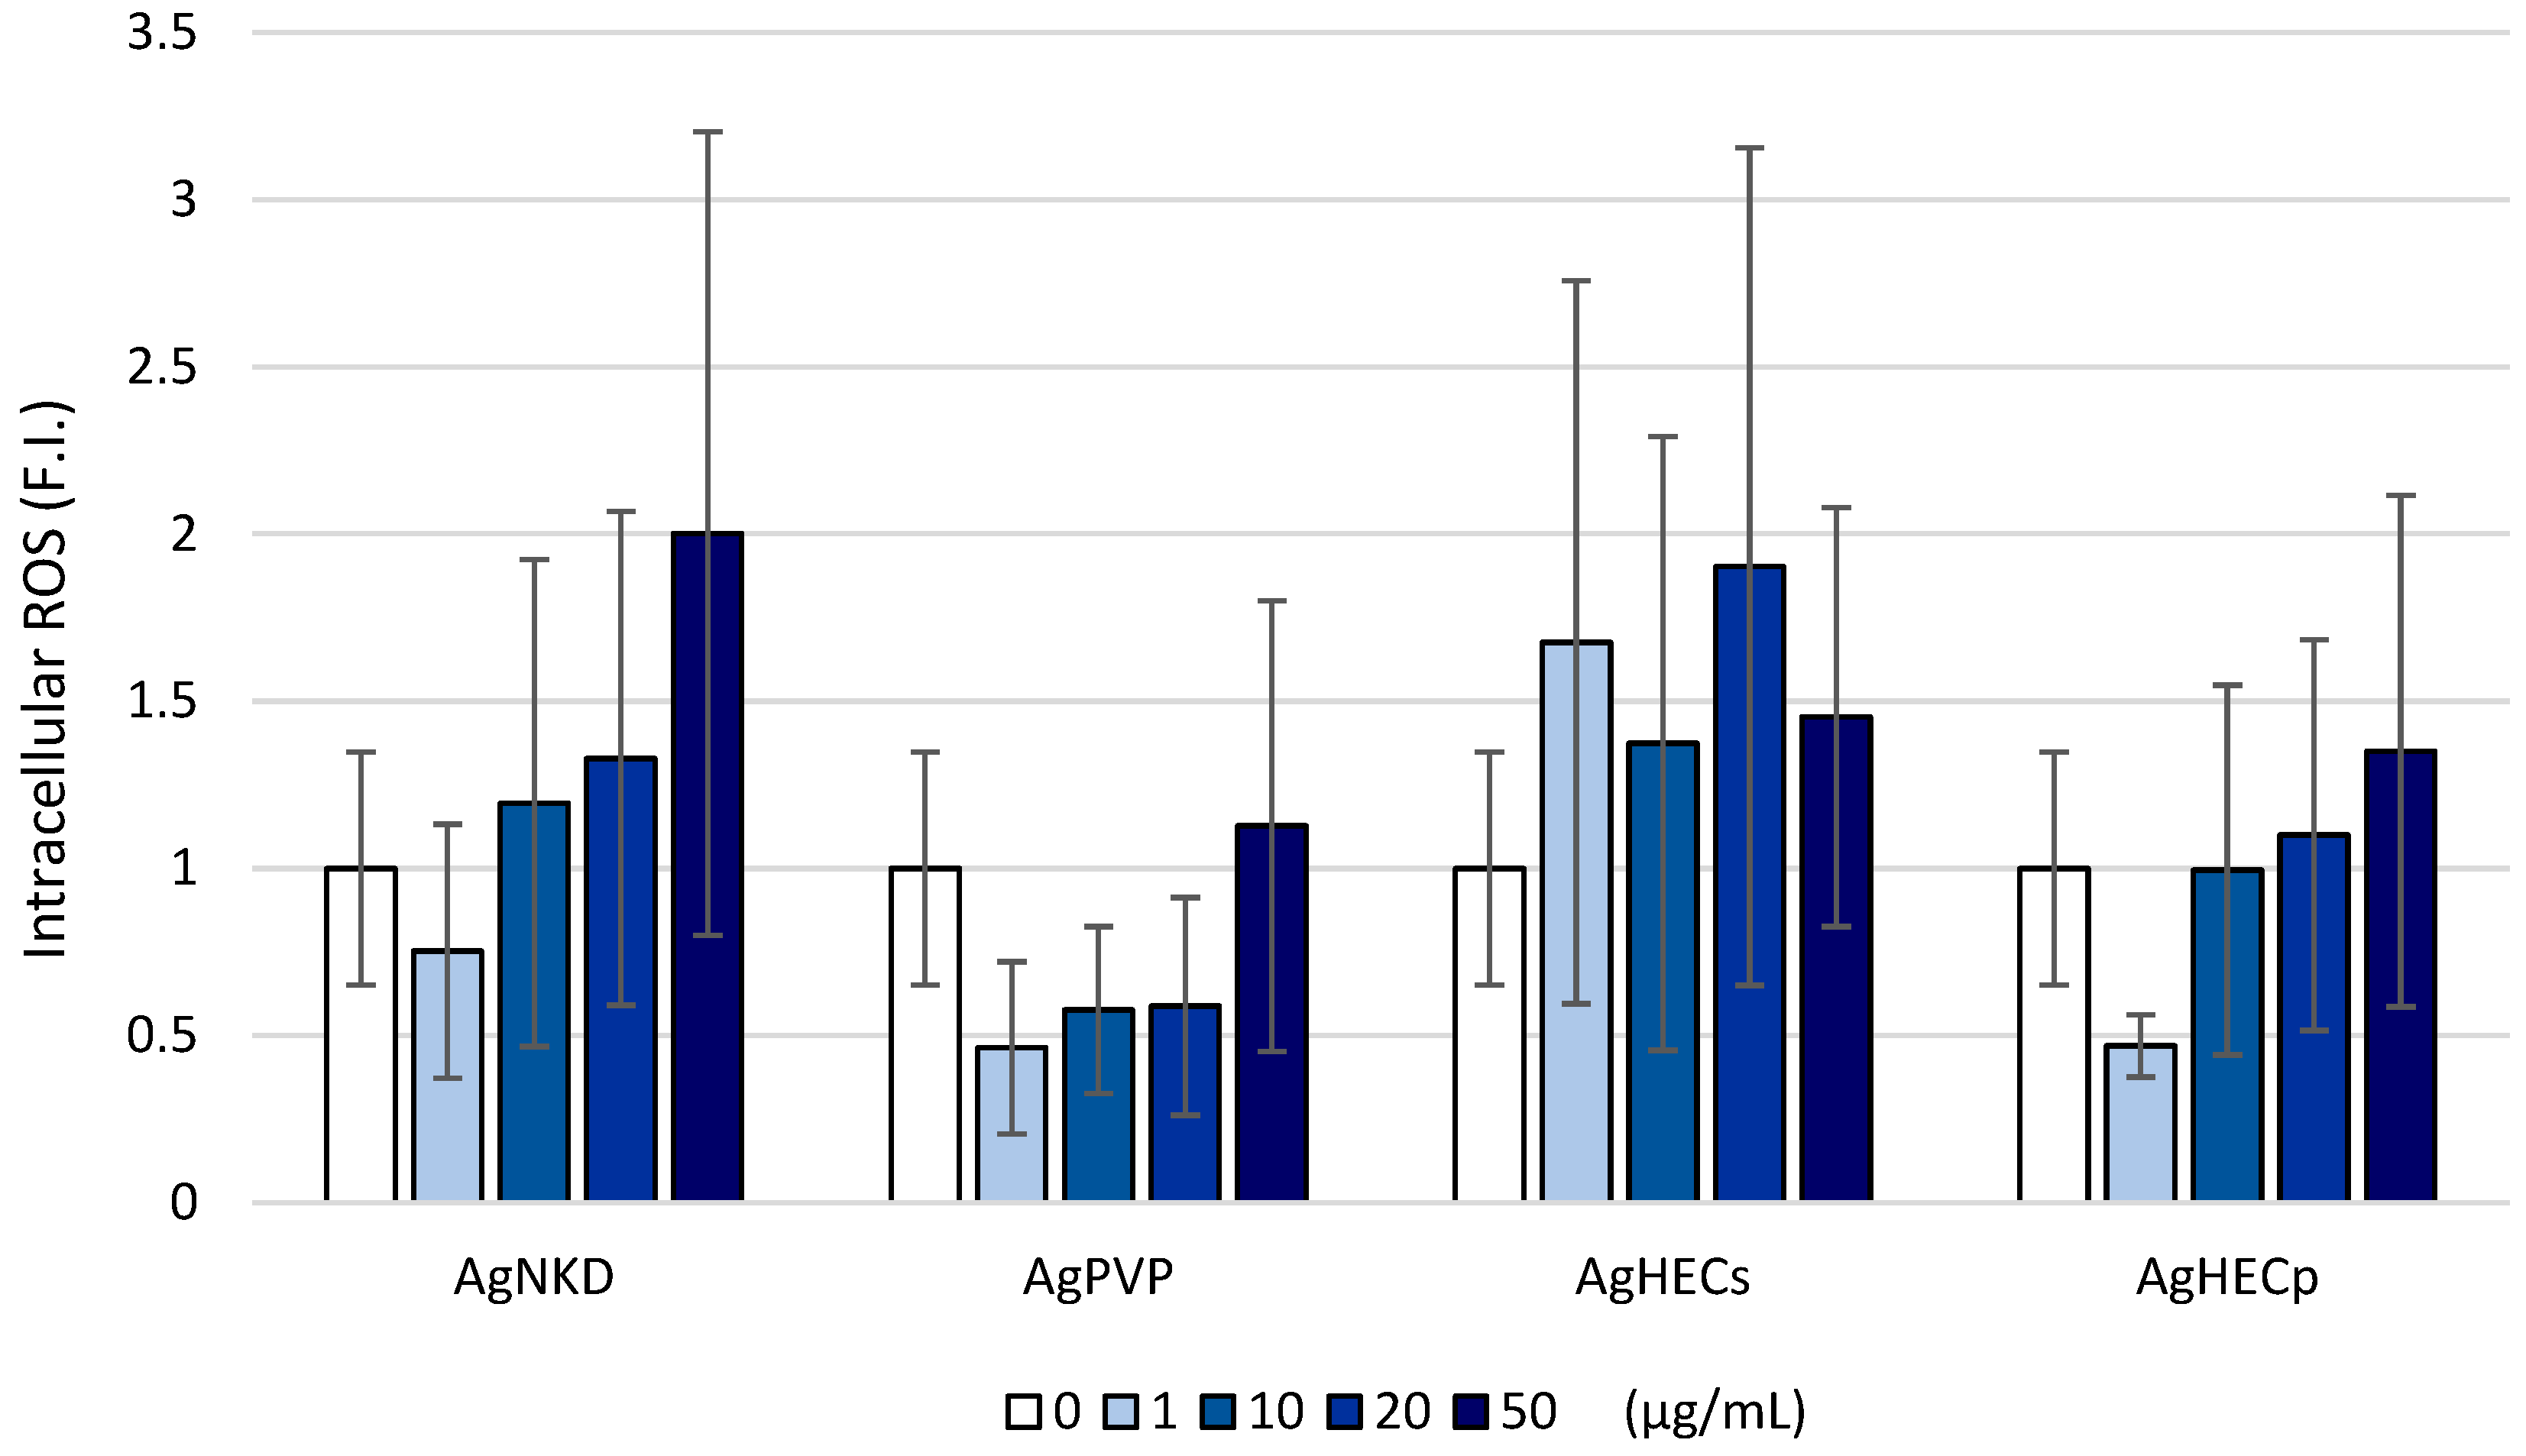
3.4. Reactive Oxygen Species Formation
3.5. Inflammatory Response (IL-8 Release)
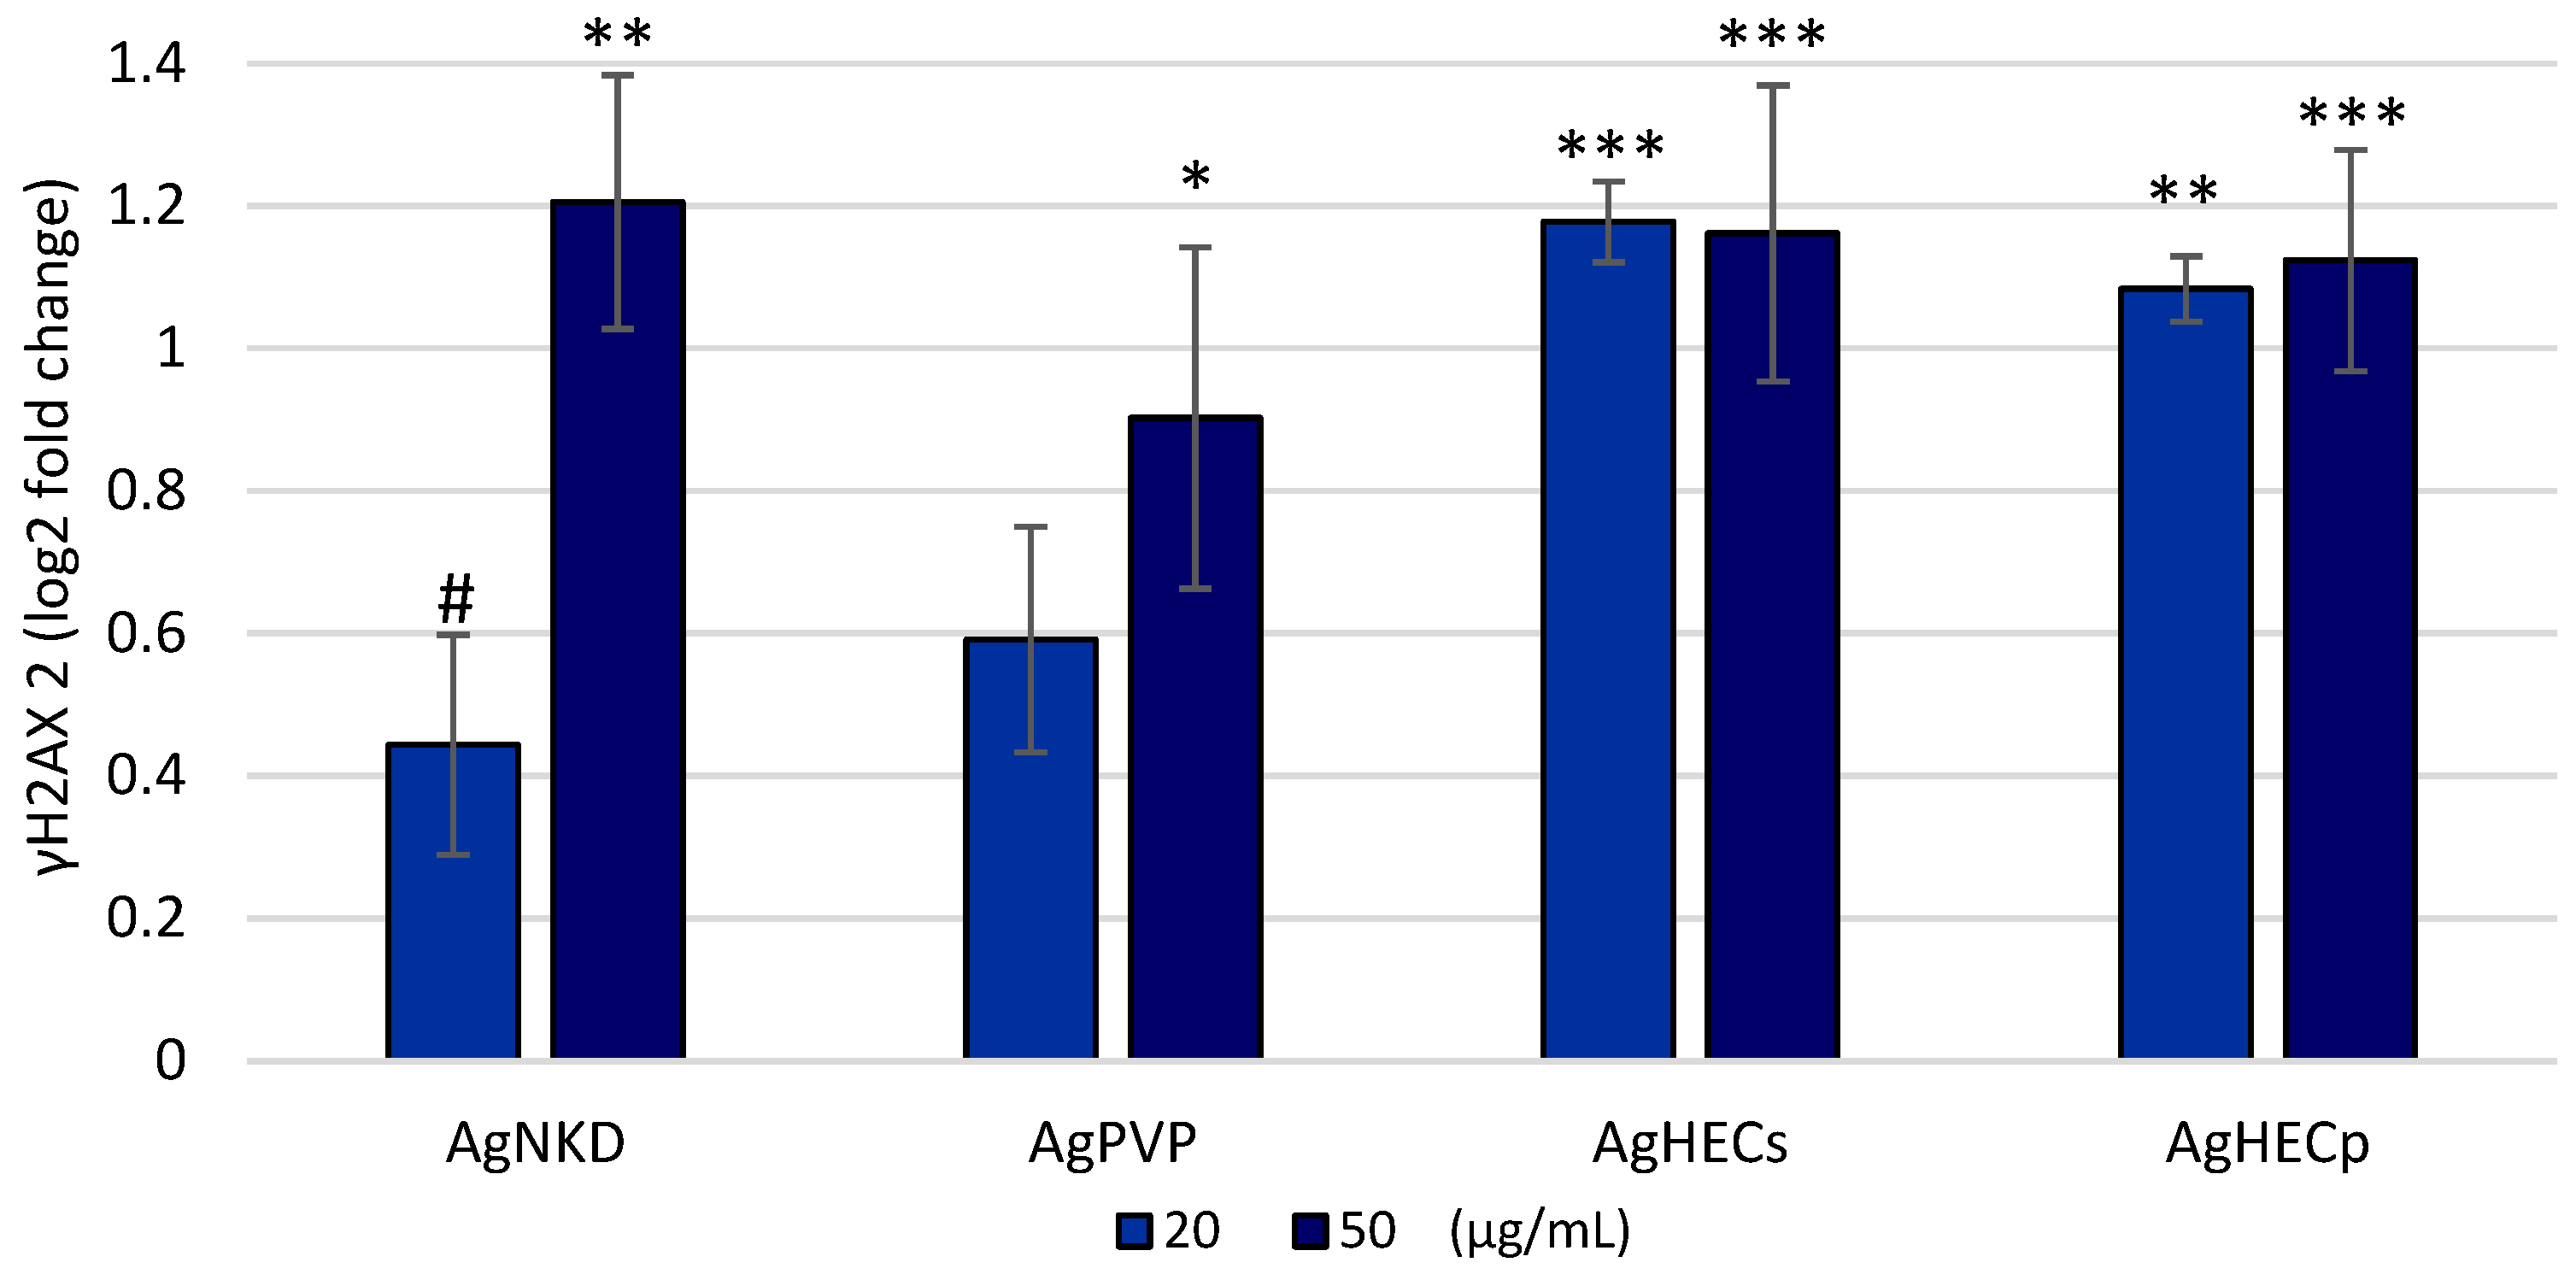
3.6. Oxidative DNA Damage (γH2AX)
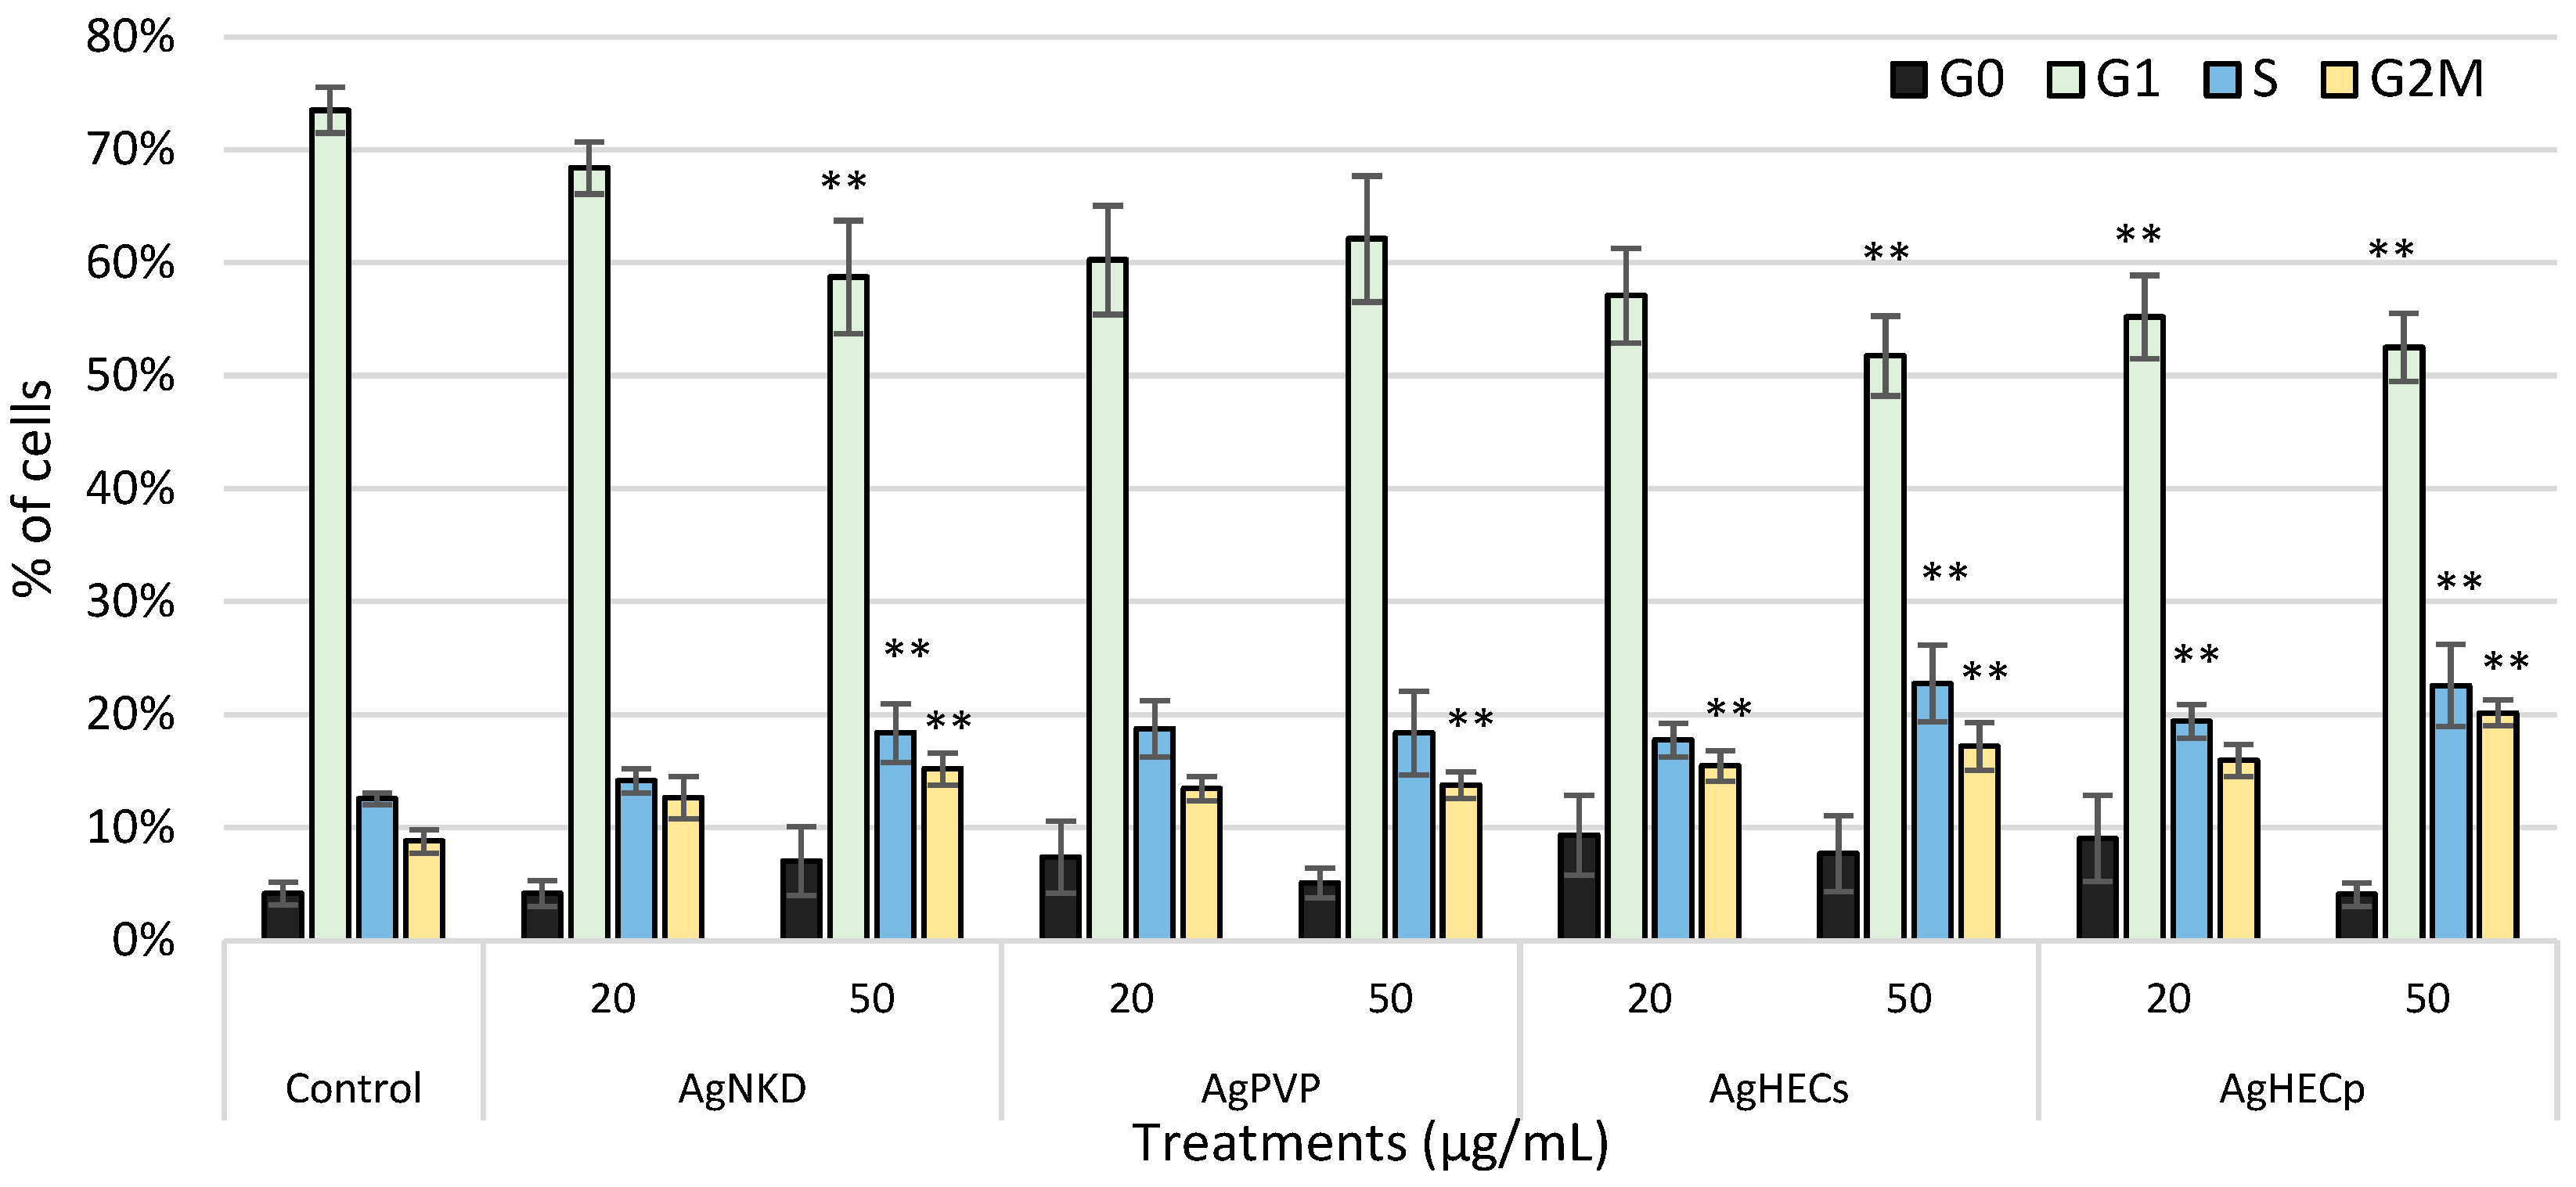
3.7. Cell Cycle Alteration
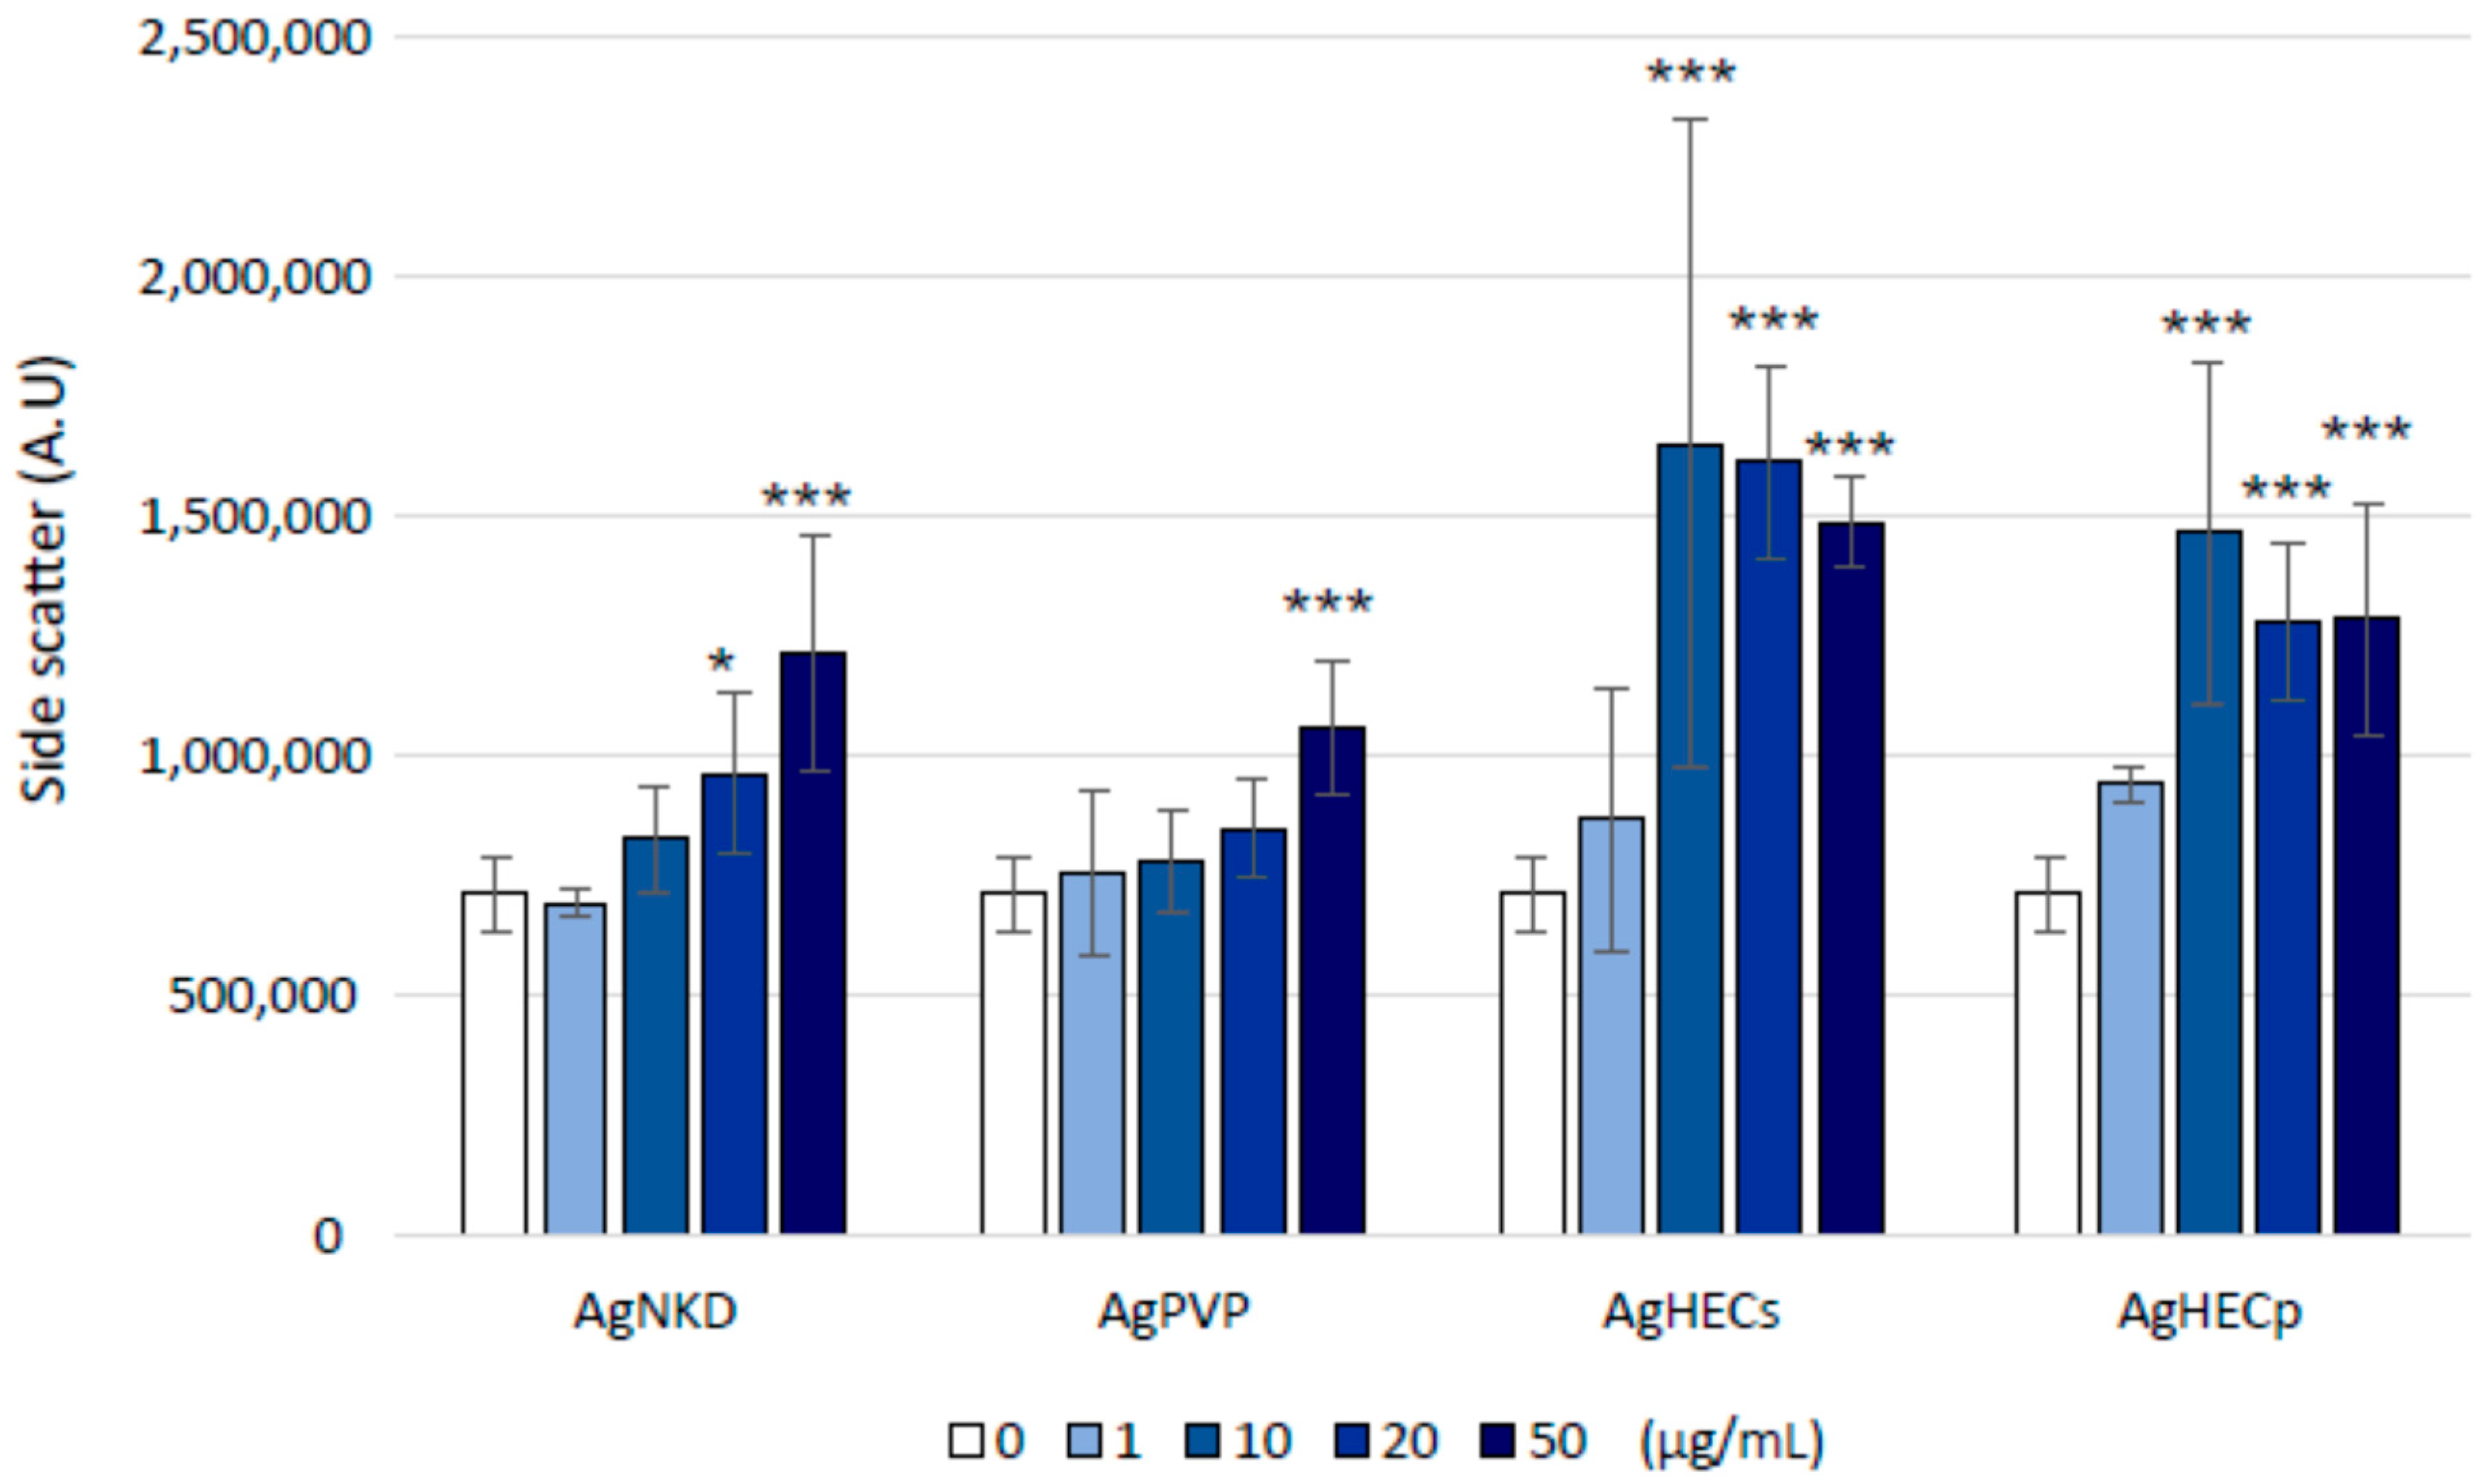
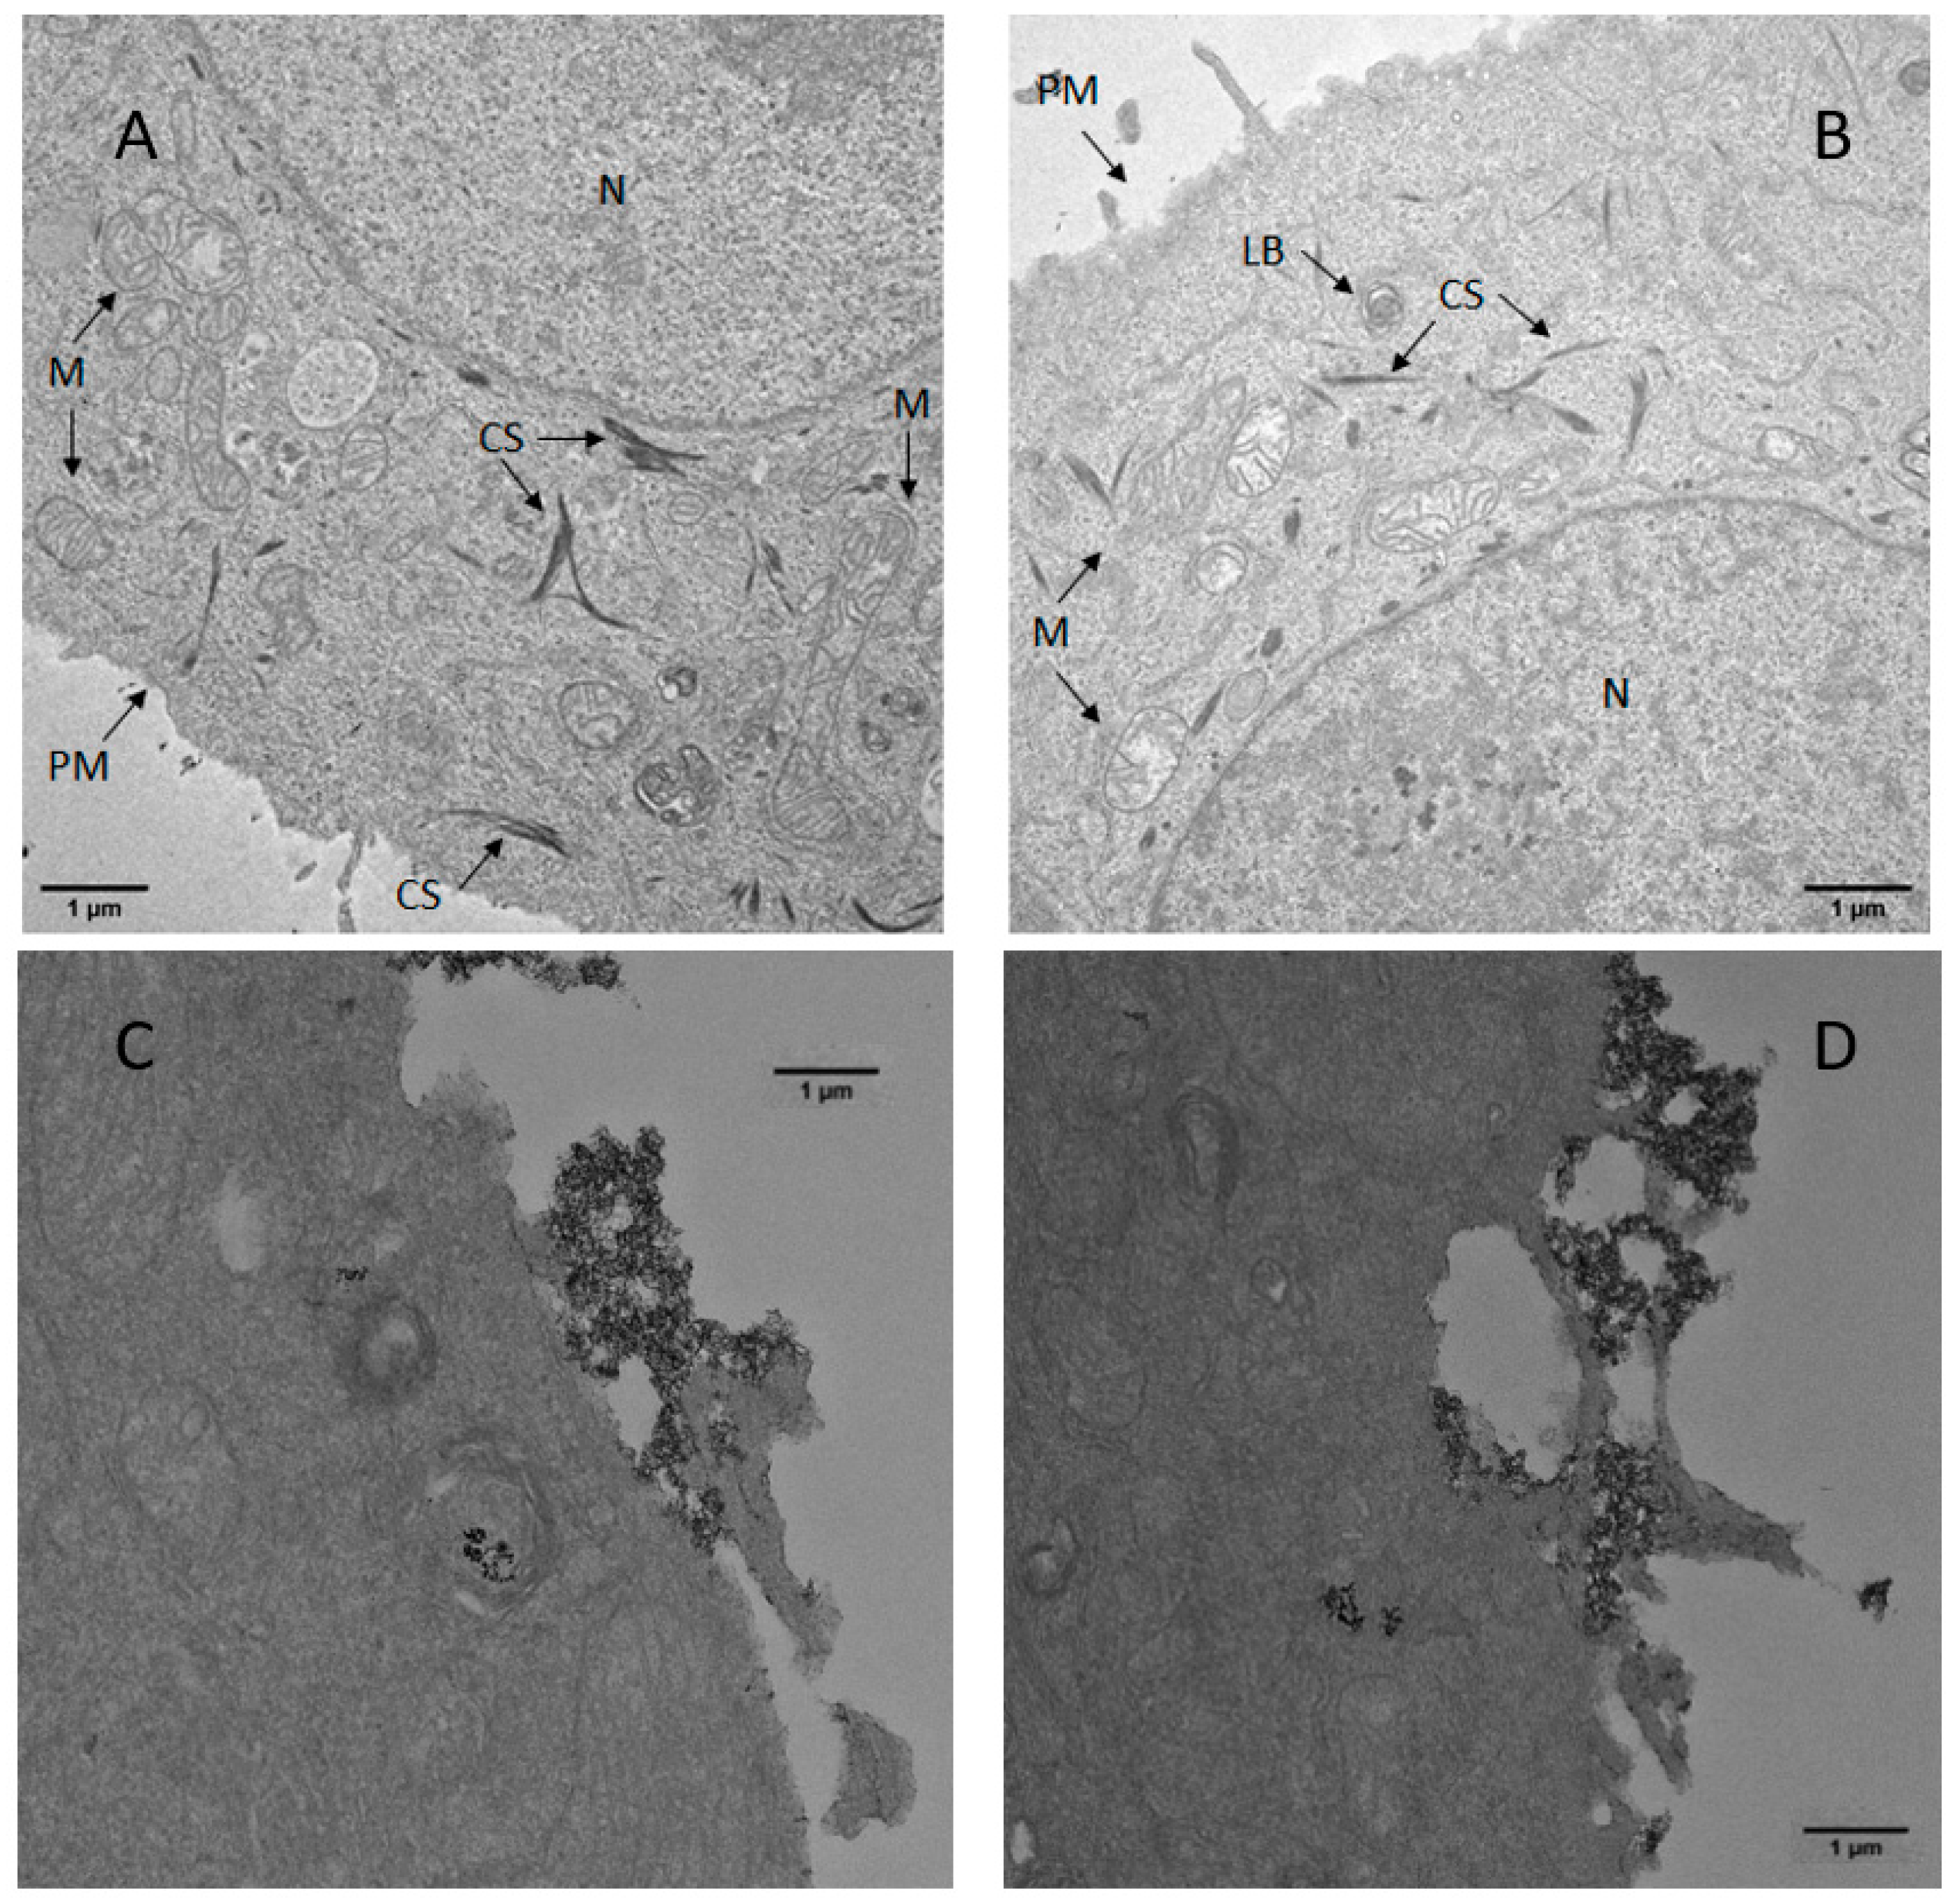
3.8. Cell–Particle Bio-Interactions
4. Discussion
5. Conclusions
Author Contributions
Funding
Institutional Review Board Statement
Informed Consent Statement
Data Availability Statement
Acknowledgments
Conflicts of Interest
Appendix A
- MTT assay
- Mycoplasma detection
Appendix B

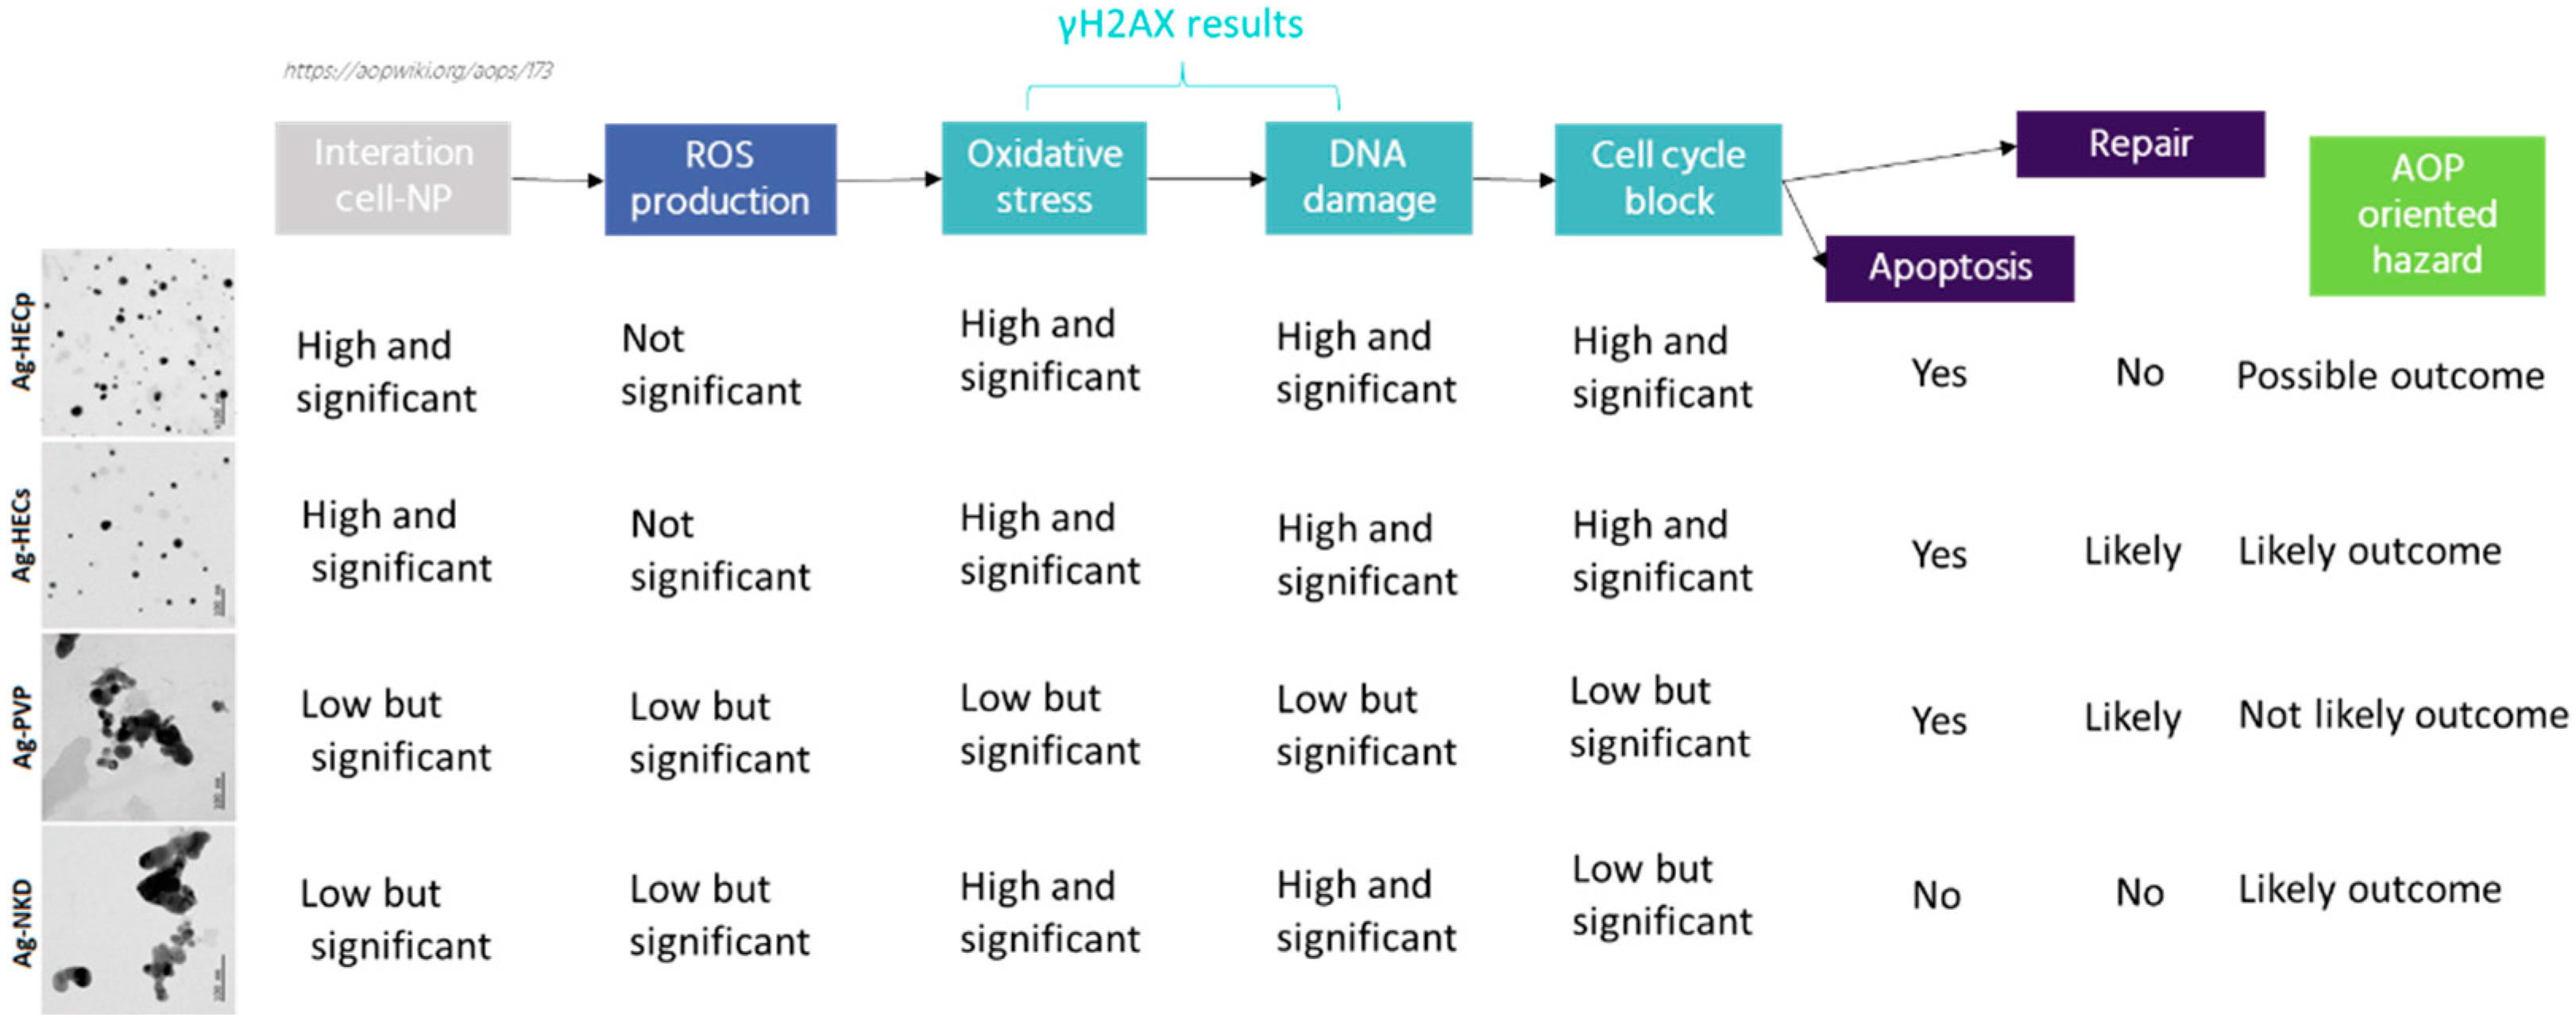
| NPs | Cytotoxicity | ROS (90 min) | Inflammation | DNA Damage | Cell Cycle Alteration | Final Rank from Less to Most Toxic |
|---|---|---|---|---|---|---|
| AgNKD | + | + | + | + | + | 1 |
| AgPVP | ++ | + | + | + | 1 | |
| AgHECs | ++ | ++ | ++ | ++ | 2 | |
| AgHECp | +++ | ++ | ++ | ++ | 3 |


References
- Nowack, B.; Krug, H.F.; Height, M. 120 Years of Nanosilver History: Implications for Policy Makers. Environ. Sci. Technol. 2011, 45, 1177–1183. [Google Scholar] [CrossRef] [PubMed]
- Beyene, H.D.; Werkneh, A.A.; Bezabh, H.K.; Ambaye, T.G. Synthesis paradigm and applications of silver nanoparticles (AgNPs), a review. Sustain. Mater. Technol. 2017, 13, 18–23. [Google Scholar] [CrossRef]
- Shanmuganathan, R.; Karuppusamy, I.; Saravanan, M.; Muthukumar, H.; Ponnuchamy, K.; Ramkumar, V.S.; Pugazhendhi, A. Synthesis of Silver Nanoparticles and their Biomedical Applications—A Comprehensive Review. Curr. Pharm. Des. 2019, 25, 2650–2660. [Google Scholar] [CrossRef] [PubMed]
- Bruna, T.; Maldonado-Bravo, F.; Jara, P.; Caro, N. Silver Nanoparticles and Their Antibacterial Applications. Int. J. Mol. Sci. 2021, 22, 7202. [Google Scholar] [CrossRef] [PubMed]
- Natsuki, J.; Natsuki, T.; Hashimoto, Y. A Review of Silver Nanoparticles: Synthesis Methods, Properties and Applications. Int. J. Mater. Sci. Appl. 2015, 4, 325. [Google Scholar] [CrossRef]
- Tortella, G.; Rubilar, O.; Durán, N.; Diez, M.; Martínez, M.; Parada, J.; Seabra, A. Silver nanoparticles: Toxicity in model organisms as an overview of its hazard for human health and the environment. J. Hazard. Mater. 2020, 390, 121974. [Google Scholar] [CrossRef] [PubMed]
- Burdușel, A.-C.; Gherasim, O.; Grumezescu, A.M.; Mogoantă, L.; Ficai, A.; Andronescu, E. Biomedical Applications of Silver Nanoparticles: An Up-to-Date Overview. Nanomaterials 2018, 8, 681. [Google Scholar] [CrossRef]
- Garcés, M.; Cáceres, L.; Chiappetta, D.; Magnani, N.; Evelson, P. Current understanding of nanoparticle toxicity mechanisms and interactions with biological systems. New J. Chem. 2021, 45, 14328–14344. [Google Scholar] [CrossRef]
- Ahmadian, E.; Dizaj, S.M.; Rahimpour, E.; Hasanzadeh, A.; Eftekhari, A.; Zadegan, H.H.; Halajzadeh, J.; Ahmadian, H. Effect of silver nanoparticles in the induction of apoptosis on human hepatocellular carcinoma (HepG2) cell line. Mater. Sci. Eng. C 2018, 93, 465–471. [Google Scholar] [CrossRef]
- de Matteis, V.; Rinaldi, R. Toxicity assessment in the nanoparticle era. Adv. Exp. Med. Biol. 2018, 1048, 1–19. [Google Scholar] [CrossRef]
- Gurunathan, S.; Kang, M.-H.; Qasim, M.; Kim, J.-H. Nanoparticle-Mediated Combination Therapy: Two-in-One Approach for Cancer. Int. J. Mol. Sci. 2018, 19, 3264. [Google Scholar] [CrossRef] [PubMed]
- Han, J.W.; Gurunathan, S.; Jeong, J.-K.; Choi, Y.-J.; Kwon, D.-N.; Park, J.-K.; Kim, J.-H. Oxidative stress mediated cytotoxicity of biologically synthesized silver nanoparticles in human lung epithelial adenocarcinoma cell line. Nanoscale Res. Lett. 2014, 9, 459. [Google Scholar] [CrossRef] [PubMed]
- Bobyk, L.; Tarantini, A.; Beal, D.; Veronesi, G.; Kieffer, I.; Motellier, S.; Valsami-Jones, E.; Lynch, I.; Jouneau, P.-H.; Pernet-Gallay, K.; et al. Toxicity and chemical transformation of silver nanoparticles in A549 lung cells: Dose-rate-dependent genotoxic impact. Environ. Sci. Nano 2021, 8, 806–821. [Google Scholar] [CrossRef]
- Gulumian, M.; Cassee, F.R. Safe by design (SbD) and nanotechnology: A much-discussed topic with a prudence? Part. Fibre Toxicol. 2021, 18, 32. [Google Scholar] [CrossRef] [PubMed]
- Halappanavar, S.; Brule, S.V.D.; Nymark, P.; Gaté, L.; Seidel, C.; Valentino, S.; Zhernovkov, V.; Danielsen, P.H.; De Vizcaya-Ruiz, A.; Wolff, H.; et al. Adverse outcome pathways as a tool for the design of testing strategies to support the safety assessment of emerging advanced materials at the nanoscale. Part. Fibre Toxicol. 2020, 17, 16. [Google Scholar] [CrossRef]
- Ma, J.; Bishoff, B.; Mercer, R.; Barger, M.; Schwegler-Berry, D.; Castranova, V. Role of epithelial-mesenchymal transition (EMT) and fibroblast function in cerium oxide nanoparticles-induced lung fibrosis. Toxicol. Appl. Pharmacol. 2017, 323, 16–25. [Google Scholar] [CrossRef]
- Sun, B.; Wang, X.; Ji, Z.; Wang, M.; Liao, Y.-P.; Chang, C.H.; Li, R.; Zhang, H.; Nel, A.E.; Xiang, W. NADPH Oxidase-Dependent NLRP3 Inflammasome Activation and its Important Role in Lung Fibrosis by Multiwalled Carbon Nanotubes. Small 2015, 11, 2087–2097. [Google Scholar] [CrossRef]
- Wang, Z.; Wang, C.; Liu, S.; He, W.; Wang, L.; Gan, J.; Huang, Z.; Wei, H.; Zhang, J.; Dong, L. Specifically Formed Corona on Silica Nanoparticles Enhances Transforming Growth Factor β1 Activity in Triggering Lung Fibrosis. ACS Nano 2017, 11, 1659–1672. [Google Scholar] [CrossRef]
- Roda, E.; Bottone, M.; Biggiogera, M.; Milanesi, G.; Coccini, T. Pulmonary and hepatic effects after low dose exposure to nanosilver: Early and long-lasting histological and ultrastructural alterations in rat. Toxicol. Rep. 2019, 6, 1047–1060. [Google Scholar] [CrossRef]
- Lolli, A.; Blosi, M.; Ortelli, S.; Costa, A.L.; Zanoni, I.; Bonincontro, D.; Carella, F.; Albonetti, S. Innovative synthesis of nanostructured composite materials by a spray-freeze drying process: Efficient catalysts and photocatalysts preparation. Catal. Today 2019, 334, 193–202. [Google Scholar] [CrossRef]
- Gardini, D.; Blosi, M.; Ortelli, S.; Delpivo, C.; Bussolati, O.; Bianchi, M.; Allegri, M.; Bergamaschi, E.; Costa, A. Nanosilver: An innovative paradigm to promote its safe and active use. Nanoimpact 2018, 11, 128–135. [Google Scholar] [CrossRef]
- Costa, A.L.; Blosi, M.; Brigliadori, A.; Zanoni, I.; Ortelli, S.; Simeone, F.C.; Delbue, S.; D’Alessandro, S.; Parapini, S.; Vineis, C.; et al. Environmental Science Eco design for Ag-based solutions against SARS-CoV-2 and E. coli. Environ. Sci. Nano 2022, 9, 4295–4304. [Google Scholar] [CrossRef]
- Marassi, V.; Di Cristo, L.; Smith, S.; Ortelli, S.; Blosi, M.; Costa, A.L.; Reschiglian, P.; Volkov, Y.; Prina-Mello, A. Silver nanoparticles as a medical device in healthcare settings: A five-step approach for candidate screening of coating agents. R. Soc. Open Sci. 2018, 5, 171113. [Google Scholar] [CrossRef] [PubMed]
- Blosi, M.; Albonetti, S.; Dondi, M.; Baldi, G.; Barzanti, A.; Bitossi, M. Process for Preparing Stable Suspensions of Metal Nanoparticles and the Stable Colloidal Suspensions Obtained Thereby. European Patent Office EP2403636A2, 10 March 2010. [Google Scholar]
- Mello, D.F.; Trevisan, R.; Rivera, N.; Geitner, N.K.; Di Giulio, R.T.; Wiesner, M.R.; Hsu-Kim, H.; Meyer, J.N. Caveats to the use of MTT, neutral red, Hoechst and Resazurin to measure silver nanoparticle cytotoxicity. Chem. Interact. 2020, 315, 108868. [Google Scholar] [CrossRef]
- Fragkos, M.; Jurvansuu, J.; Beard, P. H2AX Is Required for Cell Cycle Arrest via the p53/p21 Pathway. Mol. Cell. Biol. 2009, 29, 2828–2840. [Google Scholar] [CrossRef]
- Tanaka, T.; Huang, X.; Jorgensen, E.; Gietl, D.; Traganos, F.; Darzynkiewicz, Z.; Albino, A.P. ATM activation accompanies histone H2AX phosphorylation in A549 cells upon exposure to tobacco smoke. BMC Cell Biol. 2007, 8, 26. [Google Scholar] [CrossRef]
- Nikitaki, Z.; Hellweg, C.E.; Georgakilas, A.G.; Ravanat, J.-L. Stress-induced DNA damage biomarkers: Applications and limitations. Front. Chem. 2015, 3, 35. [Google Scholar] [CrossRef]
- R Core Team. R: A Language and Environment for Statistical Computing; R Foundation for Statistical Computing: Vienna, Austria, 2019; Available online: https://www.R-project.org/ (accessed on 5 October 2022).
- Vishwakarma, V.; Samal, S.S.; Manoharan, N. Safety and Risk Associated with Nanoparticles-A Review. J. Miner. Mater. Charact. Eng. 2010, 9, 455–459. [Google Scholar] [CrossRef]
- Demir, E. A review on nanotoxicity and nanogenotoxicity of different shapes of nanomaterials. J. Appl. Toxicol. 2021, 41, 118–147. [Google Scholar] [CrossRef]
- Schmutz, M.; Borges, O.; Jesus, S.; Borchard, G.; Perale, G.; Zinn, M.; Sips, A.J.A.M.; Soeteman-Hernandez, L.G.; Wick, P.; Som, C. A Methodological Safe-by-Design Approach for the Development of Nanomedicines. Front. Bioeng. Biotechnol. 2020, 8, 258. [Google Scholar] [CrossRef]
- Delrue, N.; Sachana, M.; Sakuratani, Y.; Gourmelon, A.; Leinala, E.; Diderich, R. The Adverse Outcome Pathway Concept: A Basis for Developing Regulatory Decision-making Tools. Altern. Lab. Anim. 2016, 44, 417–429. [Google Scholar] [CrossRef]
- Ankley, G.T.; Edwards, S.W. The adverse outcome pathway: A multifaceted framework supporting 21st century toxicology. Curr. Opin. Toxicol. 2018, 9, 1–7. [Google Scholar] [CrossRef] [PubMed]
- Leist, M.; Ghallab, A.; Graepel, R.; Marchan, R.; Hassan, R.; Bennekou, S.H.; Limonciel, A.; Vinken, M.; Schildknecht, S.; Waldmann, T.; et al. Adverse outcome pathways: Opportunities, limitations and open questions. Arch. Toxicol. 2017, 91, 3477–3505. [Google Scholar] [CrossRef] [PubMed]
- Gerloff, K.; Landesmann, B.; Worth, A.; Munn, S.; Palosaari, T.; Whelan, M. The Adverse Outcome Pathway approach in nanotoxicology. Comput. Toxicol. 2017, 1, 3–11. [Google Scholar] [CrossRef]
- Medici, S.; Peana, M.; Pelucelli, A.; Zoroddu, M.A. An updated overview on metal nanoparticles toxicity. Semin. Cancer Biol. 2021, 76, 17–26. [Google Scholar] [CrossRef] [PubMed]
- Glinski, A.; de Souza, T.L.; da Luz, J.Z.; Junior, A.G.B.; de Oliveira, C.C.; Ribeiro, C.A.D.O.; Neto, F.F. Toxicological effects of silver nanoparticles and cadmium chloride in macrophage cell line (RAW 264.7): An in vitro approach. J. Trace Elements Med. Biol. 2021, 68, 126854. [Google Scholar] [CrossRef] [PubMed]
- Lubick, N. Nanosilver toxicity: Ions, nanoparticles—Or both? Environ. Sci. Technol. 2008, 42, 8617. [Google Scholar] [CrossRef]
- Studer, A.M.; Limbach, L.K.; Van Duc, L.; Krumeich, F.; Athanassiou, E.K.; Gerber, L.C.; Moch, H.; Stark, W.J. Nanoparticle cytotoxicity depends on intracellular solubility: Comparison of stabilized copper metal and degradable copper oxide nanoparticles. Toxicol. Lett. 2010, 197, 169–174. [Google Scholar] [CrossRef]
- Niu, Y.; Tang, M. In vitro review of nanoparticles attacking macrophages: Interaction and cell death. Life Sci. 2022, 307, 120840. [Google Scholar] [CrossRef]
- Capasso, L.; Camatini, M.; Gualtieri, M. Nickel oxide nanoparticles induce inflammation and genotoxic effect in lung epithelial cells. Toxicol. Lett. 2014, 226, 28–34. [Google Scholar] [CrossRef]
- Moschini, E.; Gualtieri, M.; Colombo, M.; Fascio, U.; Camatini, M.; Mantecca, P. The modality of cell–particle interactions drives the toxicity of nanosized CuO and TiO2 in human alveolar epithelial cells. Toxicol. Lett. 2013, 222, 102–116. [Google Scholar] [CrossRef] [PubMed]
- Jr, A.D.C.M.; Azevedo, L.F.; Rocha, C.C.D.S.; Carneiro, M.F.H.; Venancio, V.P.; De Almeida, M.R.; Antunes, L.M.G.; Hott, R.D.C.; Rodrigues, J.L.; Ogunjimi, A.T.; et al. Evaluation of distribution, redox parameters, and genotoxicity in Wistar rats co-exposed to silver and titanium dioxide nanoparticles. J. Toxicol. Environ. Health Part A 2017, 80, 1156–1165. [Google Scholar] [CrossRef]
- Rahmanian, N.; Shokrzadeh, M.; Eskandani, M. Recent advances in γH2AX biomarker-based genotoxicity assays: A marker of DNA damage and repair. DNA Repair 2021, 108, 103243. [Google Scholar] [CrossRef] [PubMed]
- Zhao, X.; Takabayashi, F.; Ibuki, Y. Coexposure to silver nanoparticles and ultraviolet A synergistically enhances the phosphorylation of histone H2AX. J. Photochem. Photobiol. B Biol. 2016, 162, 213–222. [Google Scholar] [CrossRef] [PubMed]
- Hoffmann, M.H.; Griffiths, H.R. The dual role of Reactive Oxygen Species in autoimmune and inflammatory diseases: Evidence from preclinical models. Free. Radic. Biol. Med. 2018, 125, 62–71. [Google Scholar] [CrossRef]
- Sharma, A.; Tewari, D.; Nabavi, S.F.; Habtemariam, S. Reactive oxygen species modulators in pulmonary medicine. Curr. Opin. Pharmacol. 2021, 57, 157–164. [Google Scholar] [CrossRef]
- Delgado-Roche, L.; Mesta, F. Oxidative Stress as Key Player in Severe Acute Respiratory Syndrome Coronavirus (SARS-CoV) Infection. Arch. Med. Res. 2020, 51, 384–387. [Google Scholar] [CrossRef]
- Castranova, V. Signaling Pathways Controlling The Production Of Inflammatory Mediators in Response To Crystalline Silica Exposure: Role Of Reactive Oxygen/Nitrogen Species. Free. Radic. Biol. Med. 2004, 37, 916–925. [Google Scholar] [CrossRef]
- Geering, B.; Stoeckle, C.; Conus, S.; Simon, H.-U. Living and dying for inflammation: Neutrophils, eosinophils, basophils. Trends Immunol. 2013, 34, 398–409. [Google Scholar] [CrossRef]
- Alessandri, A.L.; Sousa, L.; Lucas, C.; Rossi, A.G.; Pinho, V.; Teixeira, M.M. Resolution of inflammation: Mechanisms and opportunity for drug development. Pharmacol. Ther. 2013, 139, 189–212. [Google Scholar] [CrossRef]
- Gomez-Mejiba, S.E.; Zhai, Z.; Akram, H.; Pye, Q.N.; Hensley, K.; Kurien, B.T.; Scofield, R.H.; Ramirez, D.C. Inhalation of environmental stressors & chronic inflammation: Autoimmunity and neurodegeneration. Mutat. Res. Toxicol. Environ. Mutagen. 2009, 674, 62–72. [Google Scholar] [CrossRef]
- Nissinen, L.; Kähäri, V.-M. Matrix metalloproteinases in inflammation. Biochim. et Biophys. Acta (BBA) Gen. Subj. 2014, 1840, 2571–2580. [Google Scholar] [CrossRef] [PubMed]
- Selman, M.; Pardo, A. The leading role of epithelial cells in the pathogenesis of idiopathic pulmonary fibrosis. Cell Signal. 2019, 66, 109482. [Google Scholar] [CrossRef] [PubMed]
- Sheikhi, A.; Hayashi, J.; Eichenbaum, J.; Gutin, M.; Kuntjoro, N.; Khorsandi, D.; Khademhosseini, A. Recent advances in nanoengineering cellulose for cargo delivery. J. Control. Release 2019, 294, 53–76. [Google Scholar] [CrossRef] [PubMed]
- Ciekot, J.; Psurski, M.; Jurec, K.; Boratyński, J. Hydroxyethylcellulose as a methotrexate carrier in anticancer therapy. Investig. New Drugs 2020, 39, 15–23. [Google Scholar] [CrossRef]
- Jung, H.; Wang, S.-Y.; Yang, I.-W.; Hsueh, D.-W.; Yang, W.-J.; Wang, T.-H.; Wang, H.-S. Detection and treatment of mycoplasma contamination in cultured cells. Chang. Gung Med. J. 2003, 26, 250–258. [Google Scholar]


| NPs | Medium | Time (h) | µg/mL | z-Average (nm) ± SD | PdI ± SD |
|---|---|---|---|---|---|
| AgNKD ζ-potential: −27.57 (100µg/mL in mQ) | mQ | 0 | 10 | 266.29 ± 35.96 | 0.47 ± 0.01 |
| 24 | 10 | 142.52 ± 51.02 | 0.29 ± 0.05 | ||
| 0 | 100 | 270.76 ± 53.18 | 0.45 ± 0.04 | ||
| 24 | 100 | 109.35 ± 22.42 | 0.34 ± 0.08 | ||
| DMEM 1% FBS | 0 | 10 | 624.32 ± 106.24 | 0.75 ± 0.09 | |
| 24 | 10 | 128.99 ± 15.32 | 0.24 ± 0.06 | ||
| 0 | 100 | 328.71 ± 76.9 | 0.37 ± 0.13 | ||
| 24 | 100 | 167.57 ± 7.55 | 0.33 ± 0.1 | ||
| AgPVP ζ-potential: −6.07 (100µg/mL in mQ) | mQ | 0 | 10 | 1515.88 ± 928.18 | 0.92 ± 0.14 |
| 24 | 10 | 591.67 ± 192.93 | 0.81 ± 0.16 | ||
| 0 | 100 | 695.91 ± 617.49 | 0.7 ± 0.26 | ||
| 24 | 100 | 227.06 ± 159.62 | 0.45 ± 0.15 | ||
| DMEM 1% FBS | 0 | 10 | 545.96 ± 386.17 | 0.69 ± 0.26 | |
| 24 | 10 | 165.92 ± 58.32 | 0.21 ± 0.15 | ||
| 0 | 100 | 361.4 ± 110.43 | 0.43 ± 0.06 | ||
| 24 | 100 | 185.11 ± 7.62 | 0.2 ± 0.14 | ||
| AgHECs ζ-potential: −4.71 (100µg/mL in mQ) | mQ | 0 | 10 | 122.04 ± 10.16 | 0.14 ± 0.02 |
| 24 | 10 | 109.41 ± 8.36 | 0.15 ± 0.003 | ||
| 0 | 100 | 122.16 ± 5.89 | 0.14 ± 0.02 | ||
| 24 | 100 | 115.7 ± 5.37 | 0.15 ± 0.01 | ||
| DMEM 1% FBS | 0 | 10 | 72.57 ± 6.26 | 0.23 ± 0.04 | |
| 24 | 10 | 77.82 ± 0.82 | 0.23 ± 0.03 | ||
| 0 | 100 | 80.37 ± 2.4 | 0.2 ± 0.02 | ||
| 24 | 100 | 75.23 ± 4.91 | 0.21 ± 0.05 | ||
| AgHECp ζ-potential: 9.92 (100µg/mL in mQ) | mQ | 0 | 10 | 293.83 ± 6.76 | 0.41 ± 0.06 |
| 24 | 10 | 219.33 ± 5.13 | 0.4 ± 0.01 | ||
| 0 | 100 | 304.89 ± 34.89 | 0.37 ± 0.07 | ||
| 24 | 100 | 261.63 ± 26.86 | 0.36 ± 0.06 | ||
| DMEM 1% FBS | 0 | 10 | 62.72 ± 10.85 | 0.46 ± 0.02 | |
| 24 | 10 | 148.66 ± 39.78 | 0.28 ± 0.03 | ||
| 0 | 100 | 150.29 ± 19.7 | 0.35 ± 0.06 | ||
| 24 | 100 | 88.63 ± 4.97 | 0.51 ± 0.01 |
Disclaimer/Publisher’s Note: The statements, opinions and data contained in all publications are solely those of the individual author(s) and contributor(s) and not of MDPI and/or the editor(s). MDPI and/or the editor(s) disclaim responsibility for any injury to people or property resulting from any ideas, methods, instructions or products referred to in the content. |
© 2023 by the authors. Licensee MDPI, Basel, Switzerland. This article is an open access article distributed under the terms and conditions of the Creative Commons Attribution (CC BY) license (https://creativecommons.org/licenses/by/4.0/).
Share and Cite
Motta, G.; Gualtieri, M.; Saibene, M.; Bengalli, R.; Brigliadori, A.; Carrière, M.; Mantecca, P. Preliminary Toxicological Analysis in a Safe-by-Design and Adverse Outcome Pathway-Driven Approach on Different Silver Nanoparticles: Assessment of Acute Responses in A549 Cells. Toxics 2023, 11, 195. https://doi.org/10.3390/toxics11020195
Motta G, Gualtieri M, Saibene M, Bengalli R, Brigliadori A, Carrière M, Mantecca P. Preliminary Toxicological Analysis in a Safe-by-Design and Adverse Outcome Pathway-Driven Approach on Different Silver Nanoparticles: Assessment of Acute Responses in A549 Cells. Toxics. 2023; 11(2):195. https://doi.org/10.3390/toxics11020195
Chicago/Turabian StyleMotta, Giulia, Maurizio Gualtieri, Melissa Saibene, Rossella Bengalli, Andrea Brigliadori, Marie Carrière, and Paride Mantecca. 2023. "Preliminary Toxicological Analysis in a Safe-by-Design and Adverse Outcome Pathway-Driven Approach on Different Silver Nanoparticles: Assessment of Acute Responses in A549 Cells" Toxics 11, no. 2: 195. https://doi.org/10.3390/toxics11020195
APA StyleMotta, G., Gualtieri, M., Saibene, M., Bengalli, R., Brigliadori, A., Carrière, M., & Mantecca, P. (2023). Preliminary Toxicological Analysis in a Safe-by-Design and Adverse Outcome Pathway-Driven Approach on Different Silver Nanoparticles: Assessment of Acute Responses in A549 Cells. Toxics, 11(2), 195. https://doi.org/10.3390/toxics11020195