

Risk Assessment of Isoeugenol in Food Based on Benchmark Dose—Response Modeling


Abstract
:1. Introduction

| [µg/day] | [µg/kg b.w./day] | |
|---|---|---|
| Exposure via Food (Artificially and Naturally) | ||
| Europe (total intake in food) estimated by JECFA [4] | 117 | 1.95 1 |
| USA (total intake in food) estimated by JECFA [4] | 43 | 0.72 1 |
| - due to its addition as a flavoring agent (USA) | - | 0.10 2 |
| - due to its natural occurrence in plants (USA) | - | 0.62 2 |
| Exposure via Consumer Products | ||
| Total systemic exposure (inhalation, oral, dermal, estimated by RIFM [5]) | - | 0.4 |
| Total Exposure (Food and Consumer Products) | ||
| Europe | - | 2.35 |
| USA | - | 1.12 |
2. Materials and Methods
| Dichotomous Data (Quantal Data) | |
|---|---|
| Analysis type 1 | Frequentist |
| Models used | All available models |
| Restriction 2 | The available models were used in their restricted and unrestricted form if both options were offered |
| Maximum degree for the multistage model | One less than the number of test groups (including control) but not more than 3 |
| Risk type | Extra risk |
| BMRF | 0.1 (10%) |
| Confidence level | 0.95 |
| Continuous Data | |
| Analysis type 1 | Frequentist |
| Models used | All available models |
| Restriction 2 | The available models were used in their restricted and unrestricted form if both options were offered |
| Maximum degree for the polynomial model | One less than the number of test groups (including the control group) but not more than 3 |
| Risk type | Relative deviation |
| BMRF | 0.1 (10%) |
| Confidence level | 0.95 |
| Adverse direction | Depending on the endpoint (the direction is “down” for body weight) |
| Distribution | Normal |
| Variance | Constant |
- From the viable models with a “sufficiently narrow range”, those with the lowest AIC value will be selected [14].
- Otherwise, the model with the lowest BMDL value is recommended by the software.
3. Results
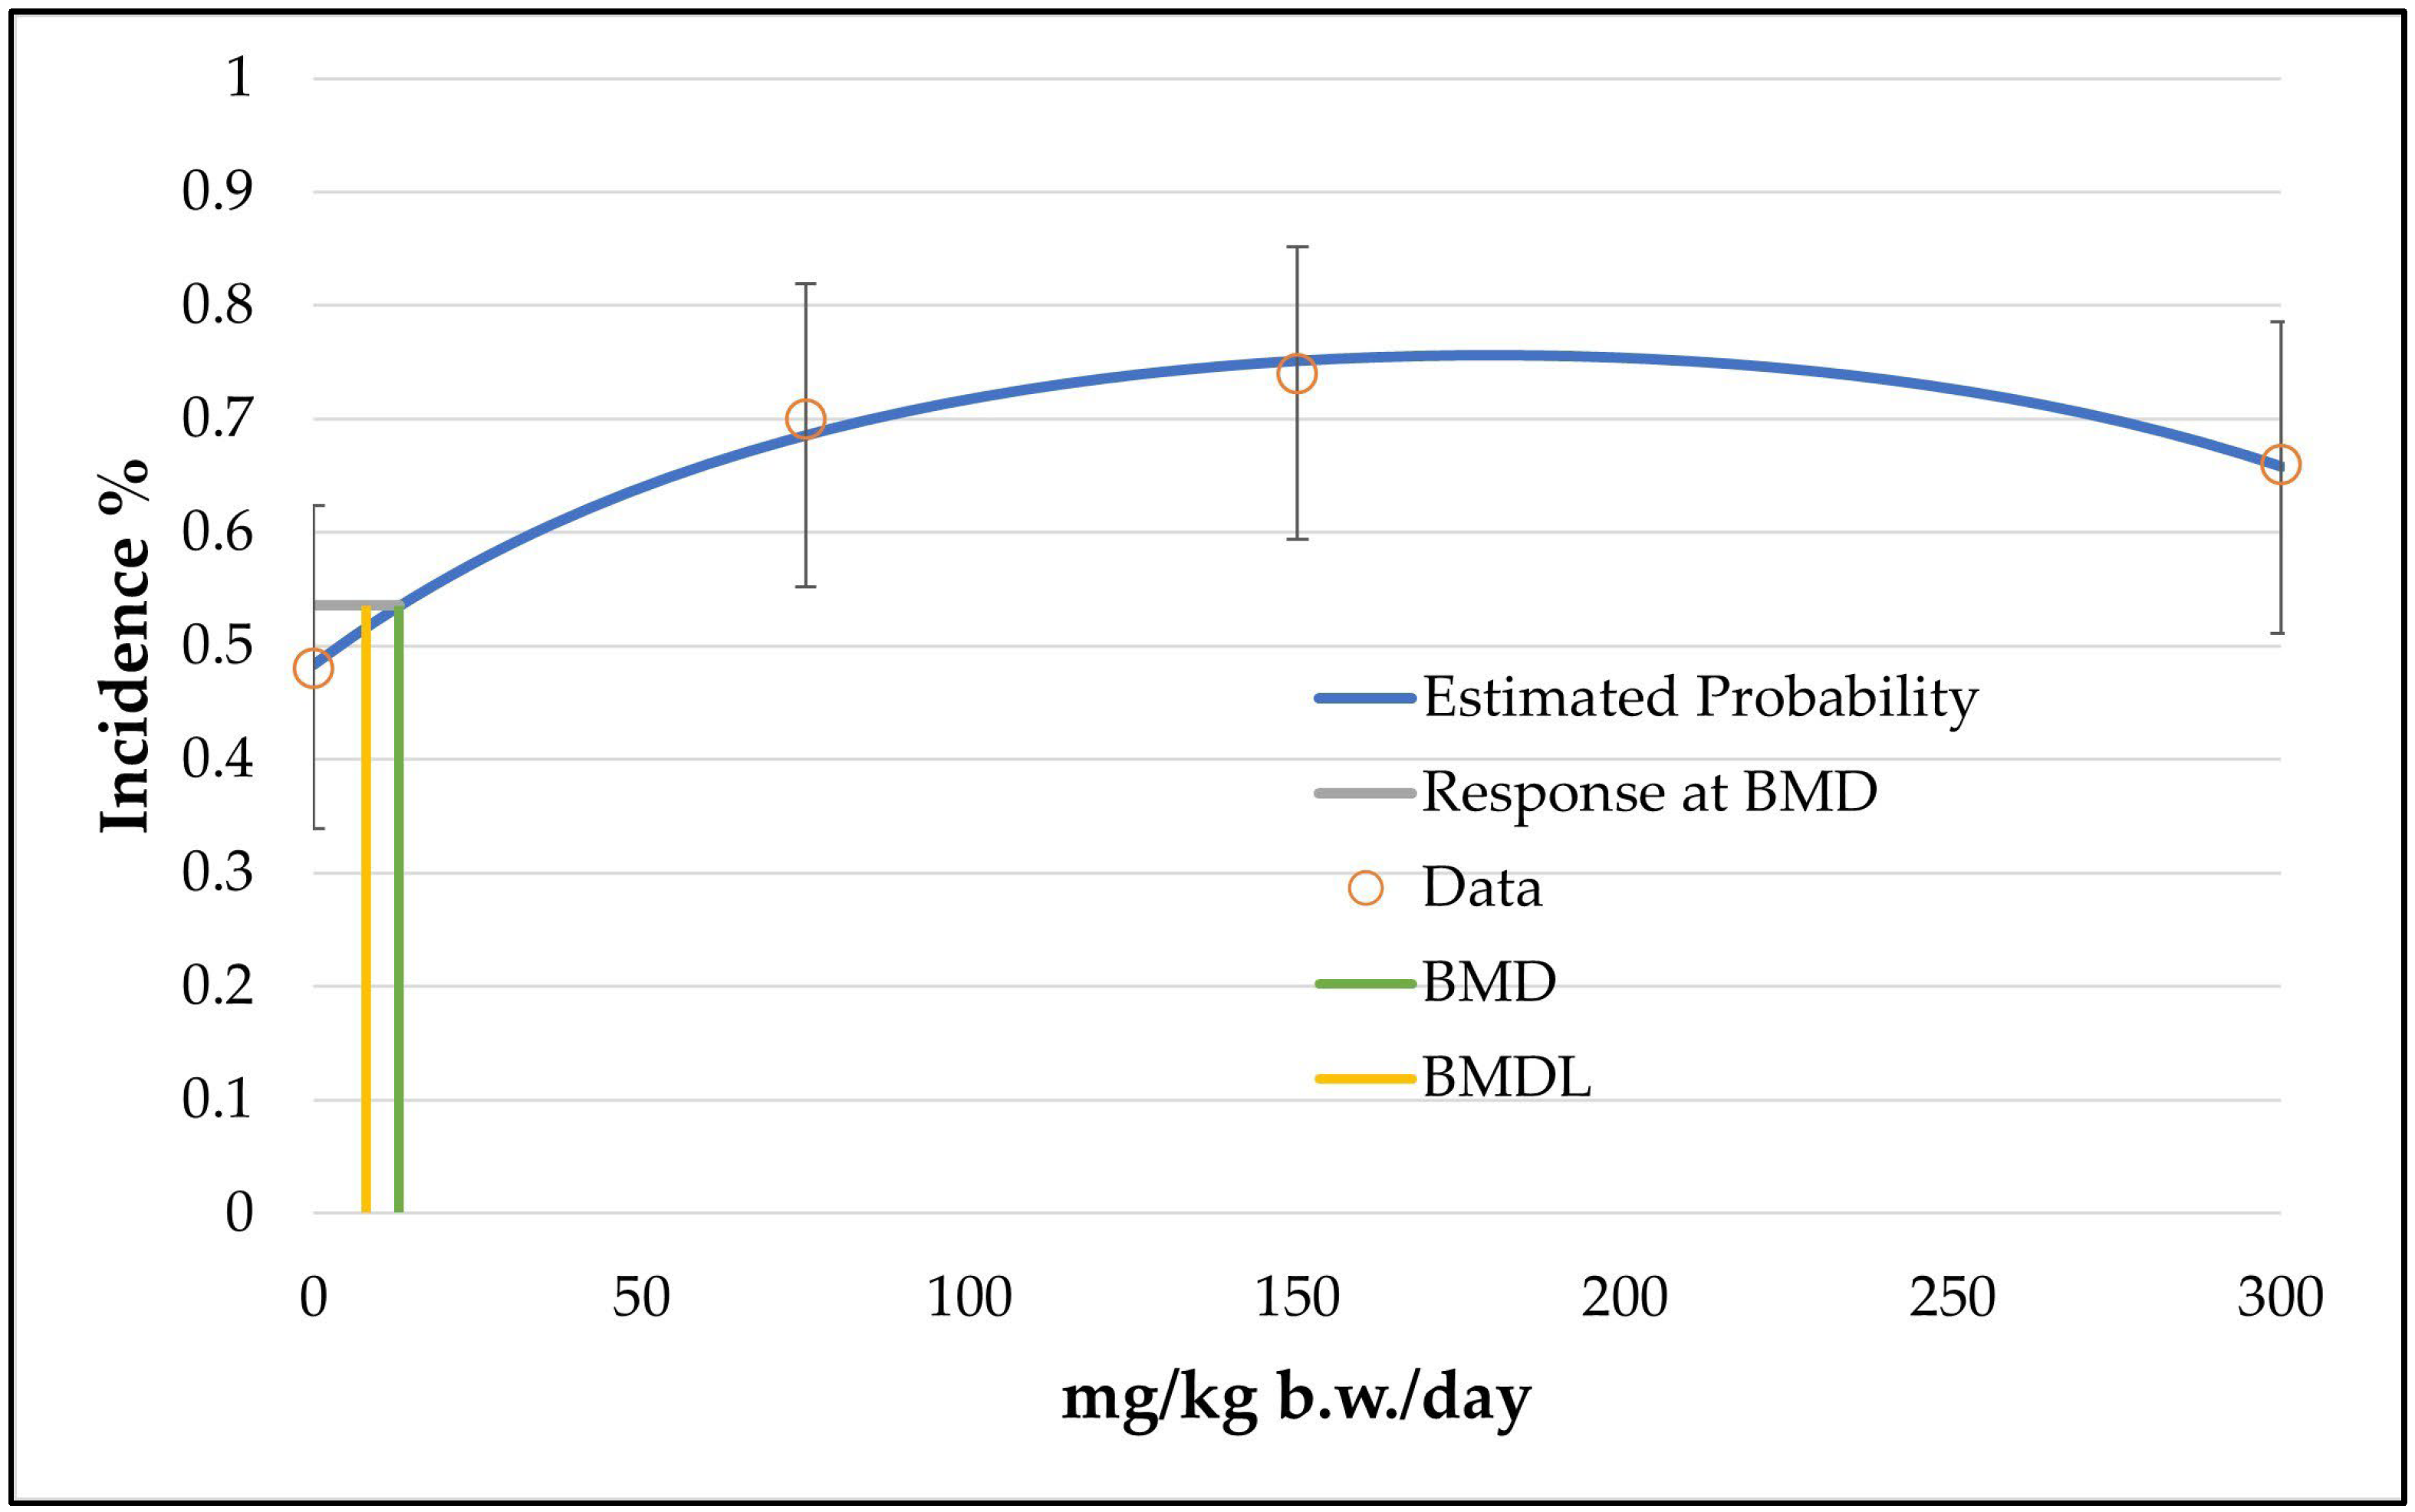
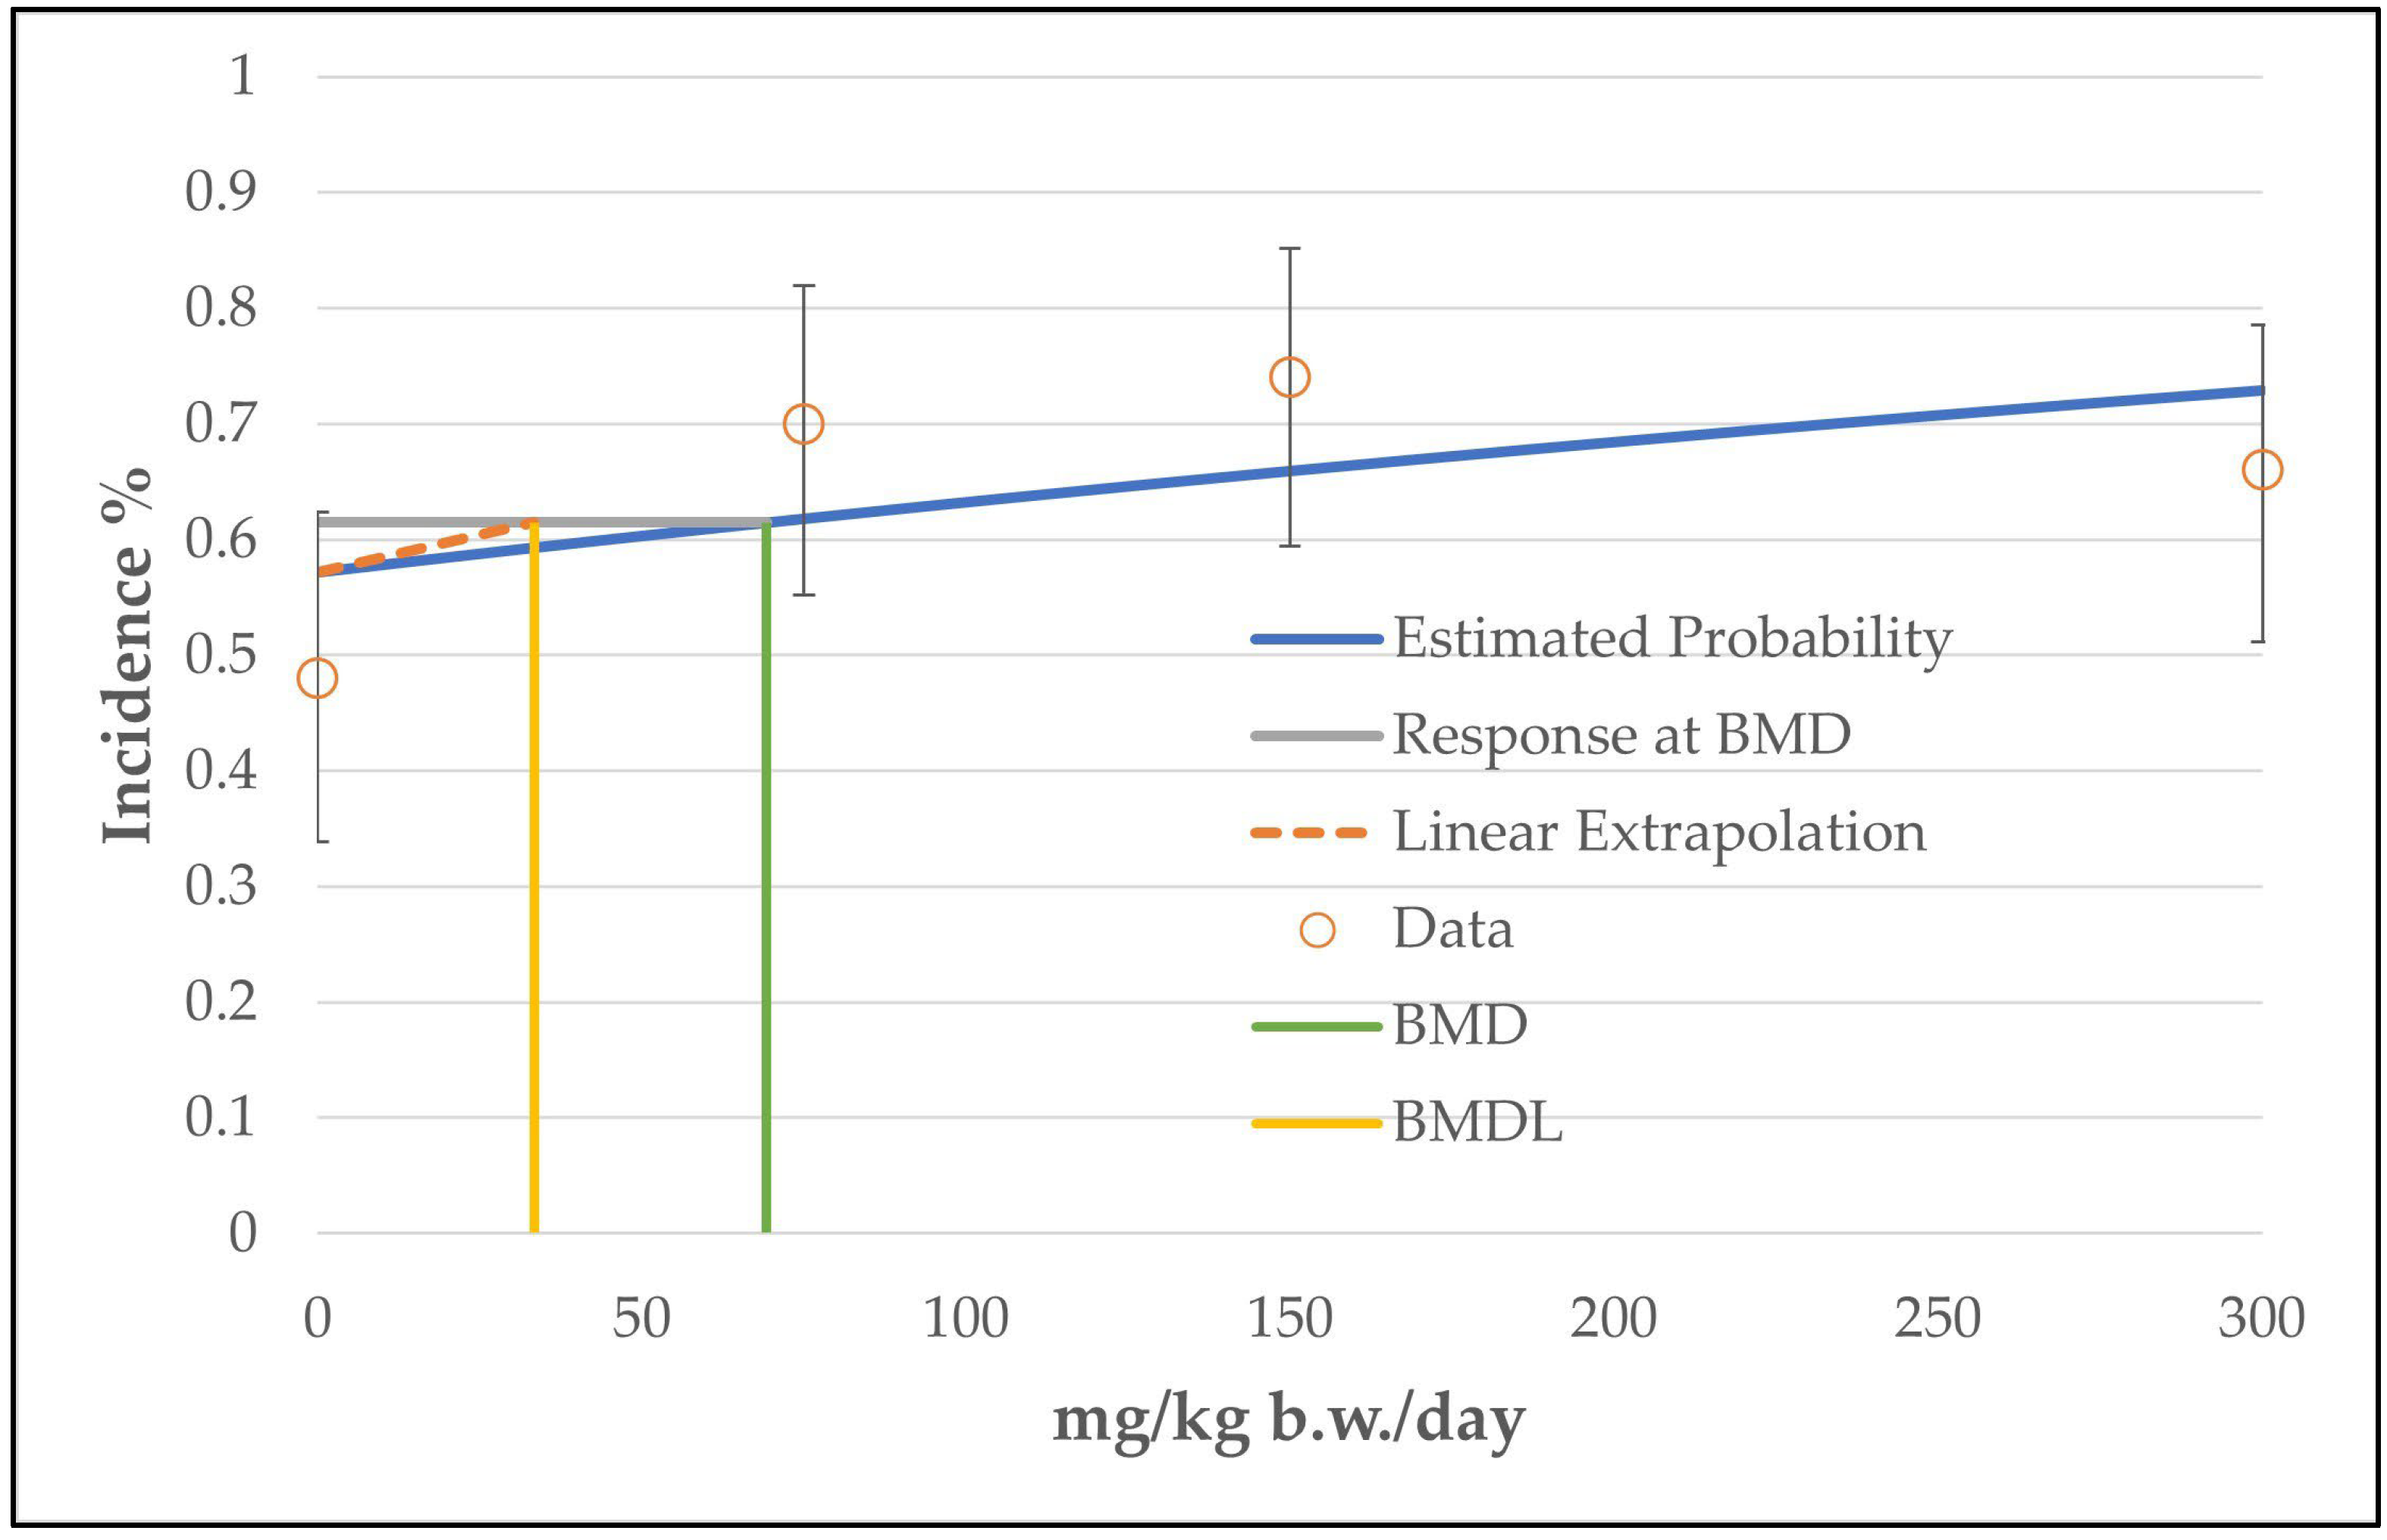
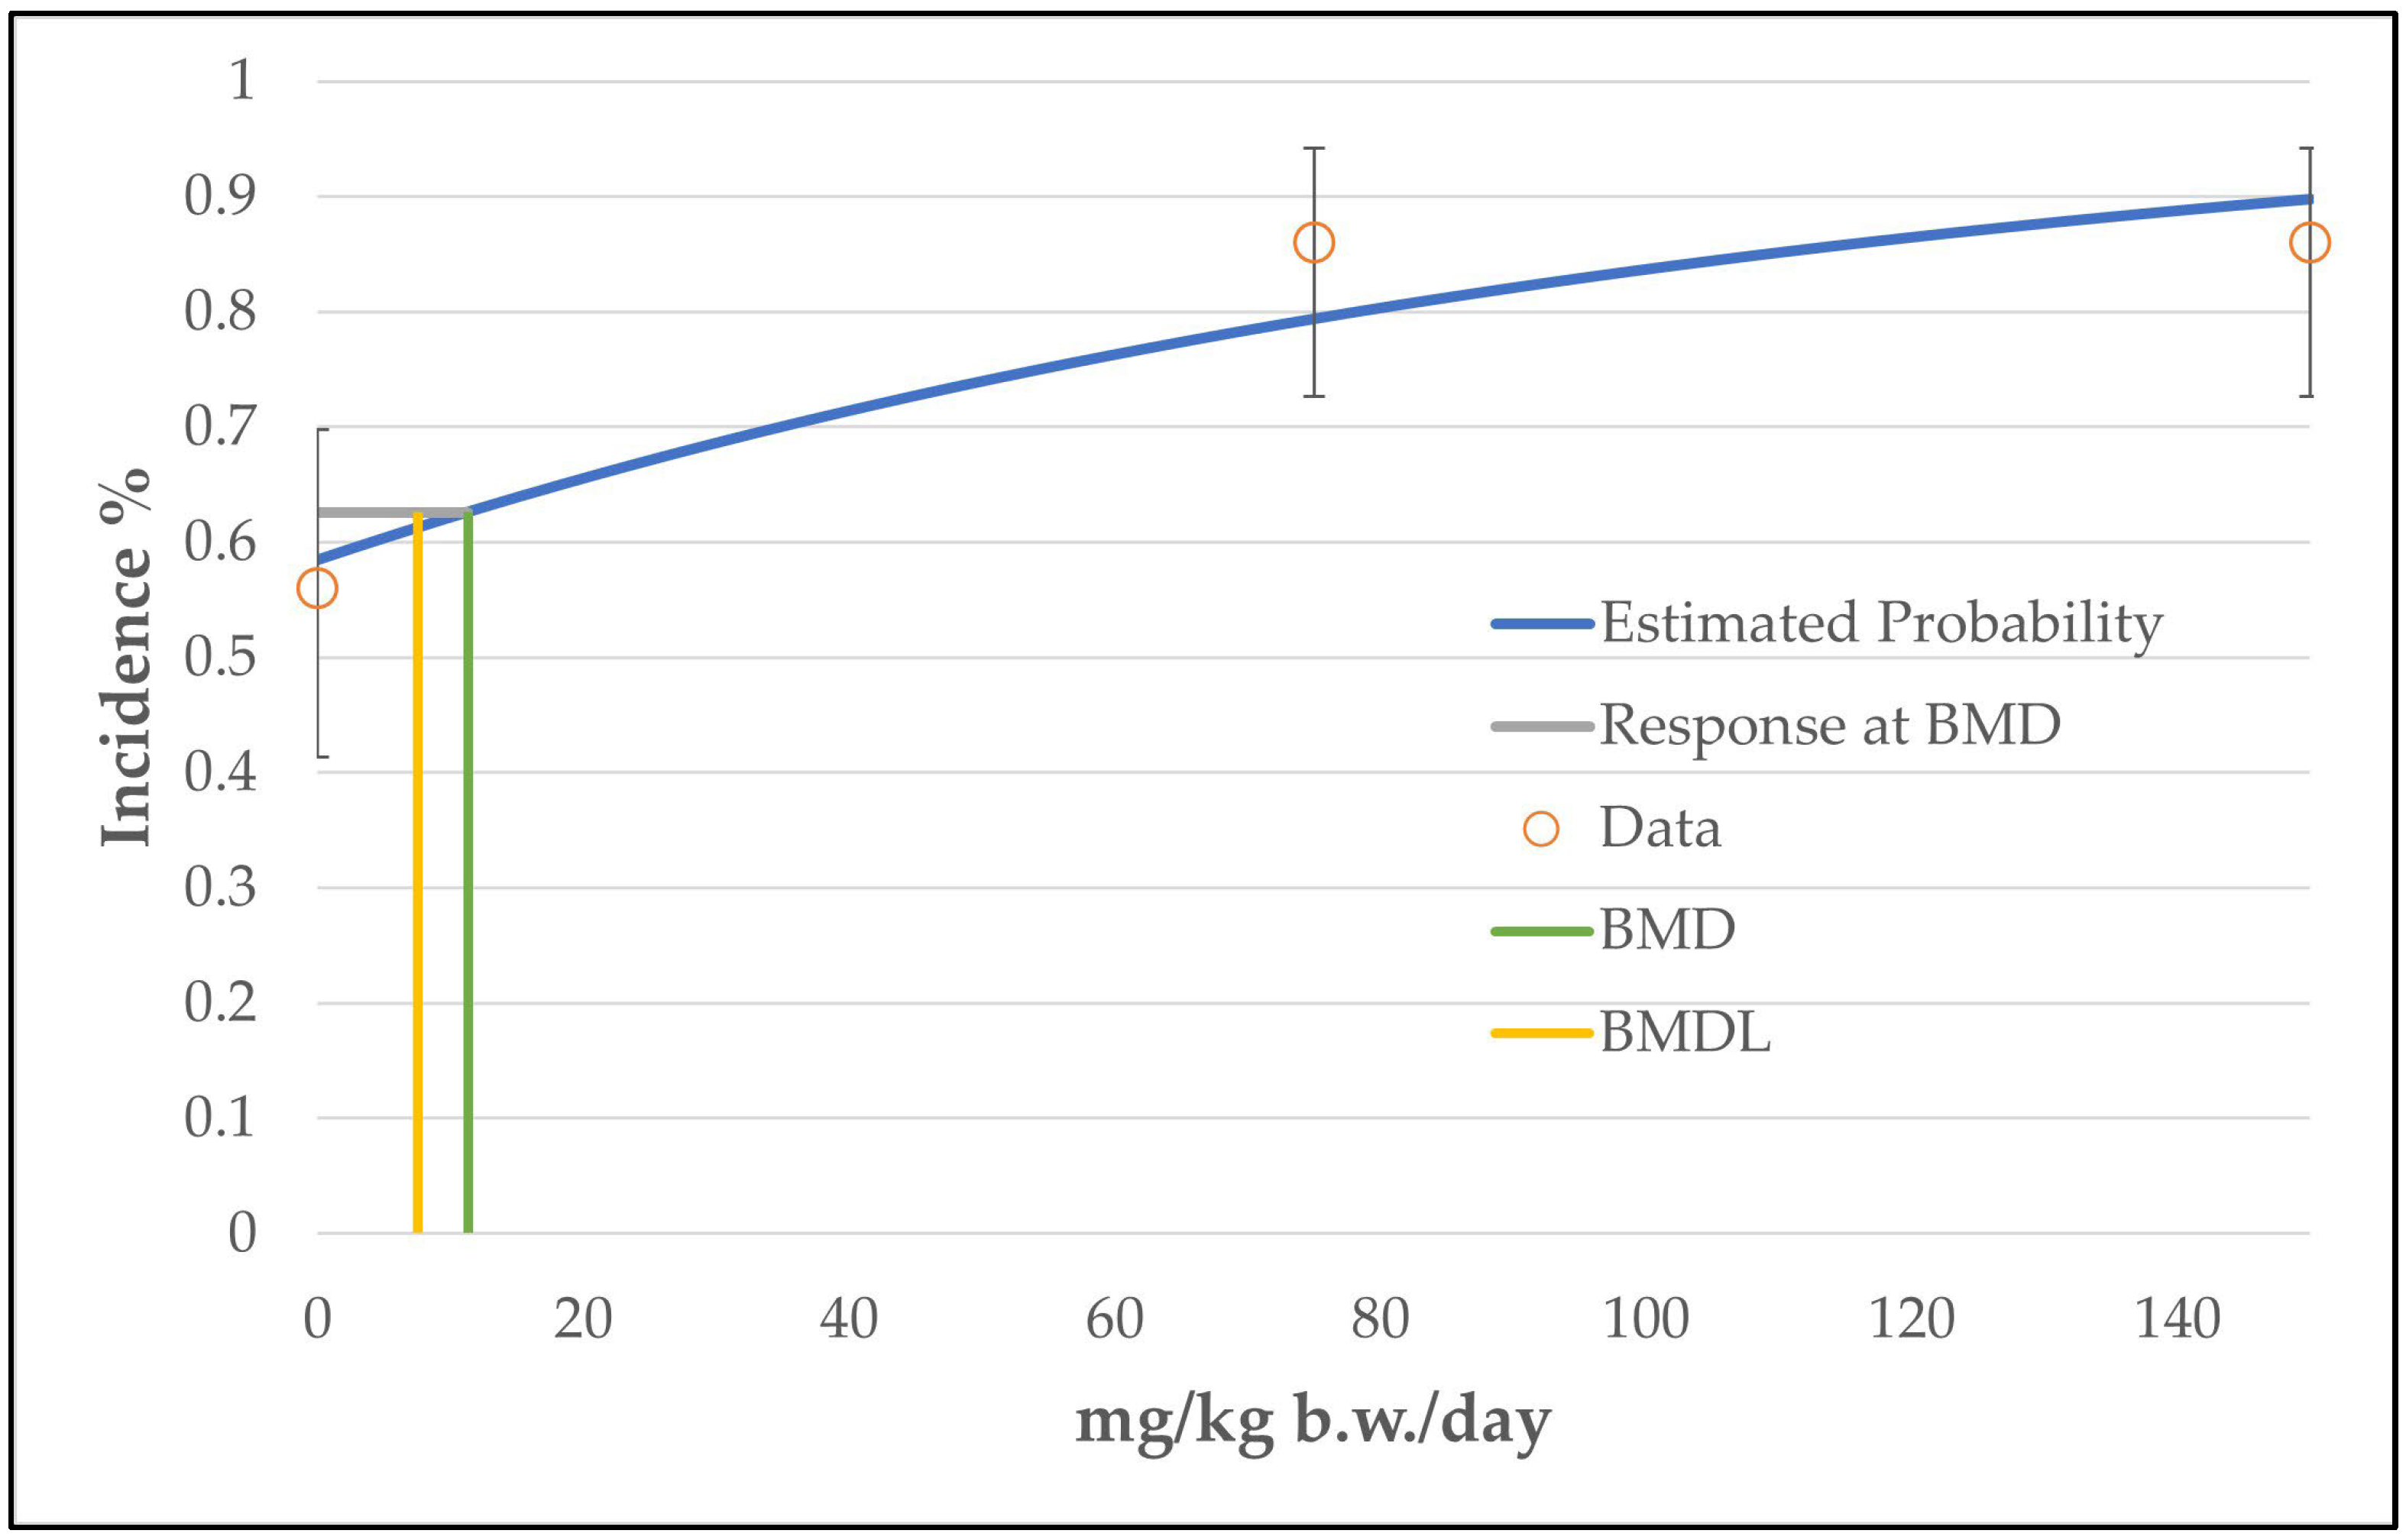
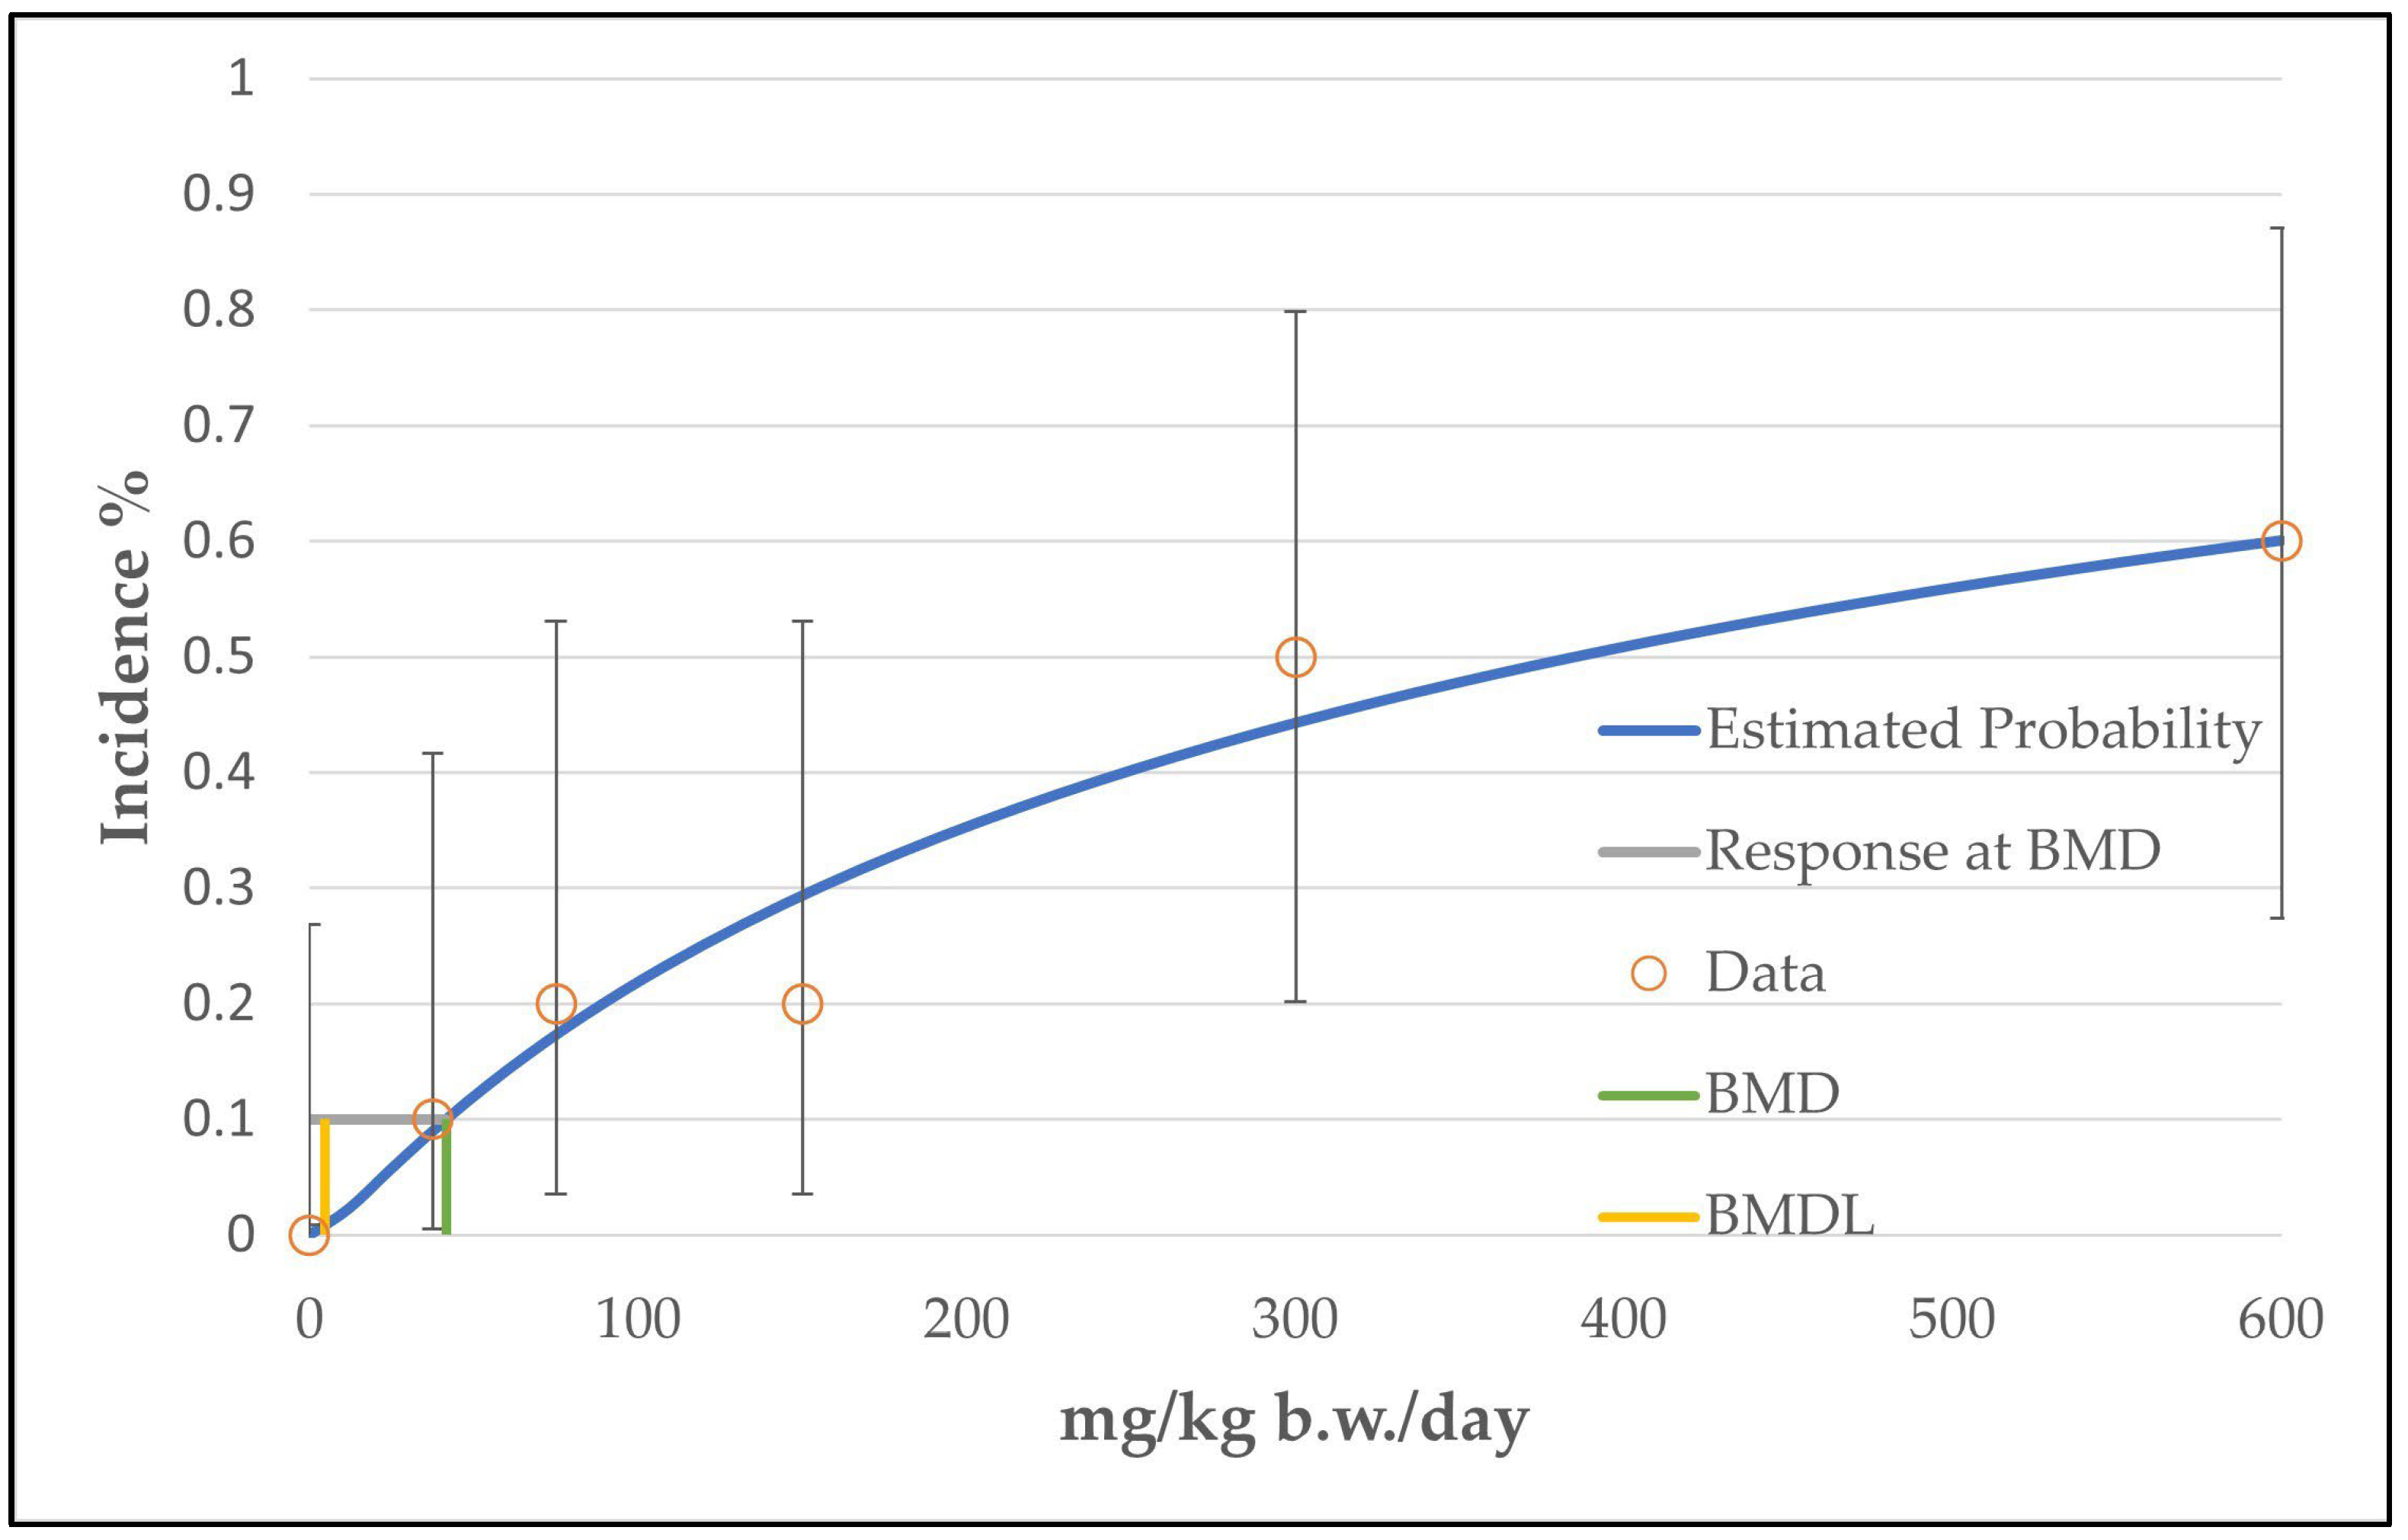
3.1. BMD Modeling of Neoplastic Liver Lesions
- It has the more conservative value.
- The fitting of the unrestricted curve near the BMD value is good (low values for the scaled residuals: −0.5 instead of 1.19 for the data point near the BMD value; see Supplementary Table S1) and the decreasing course of the curve near the high-dose group is not important for the determination of the BMD/BMDL values, which were taken between the control and the low-dose group.
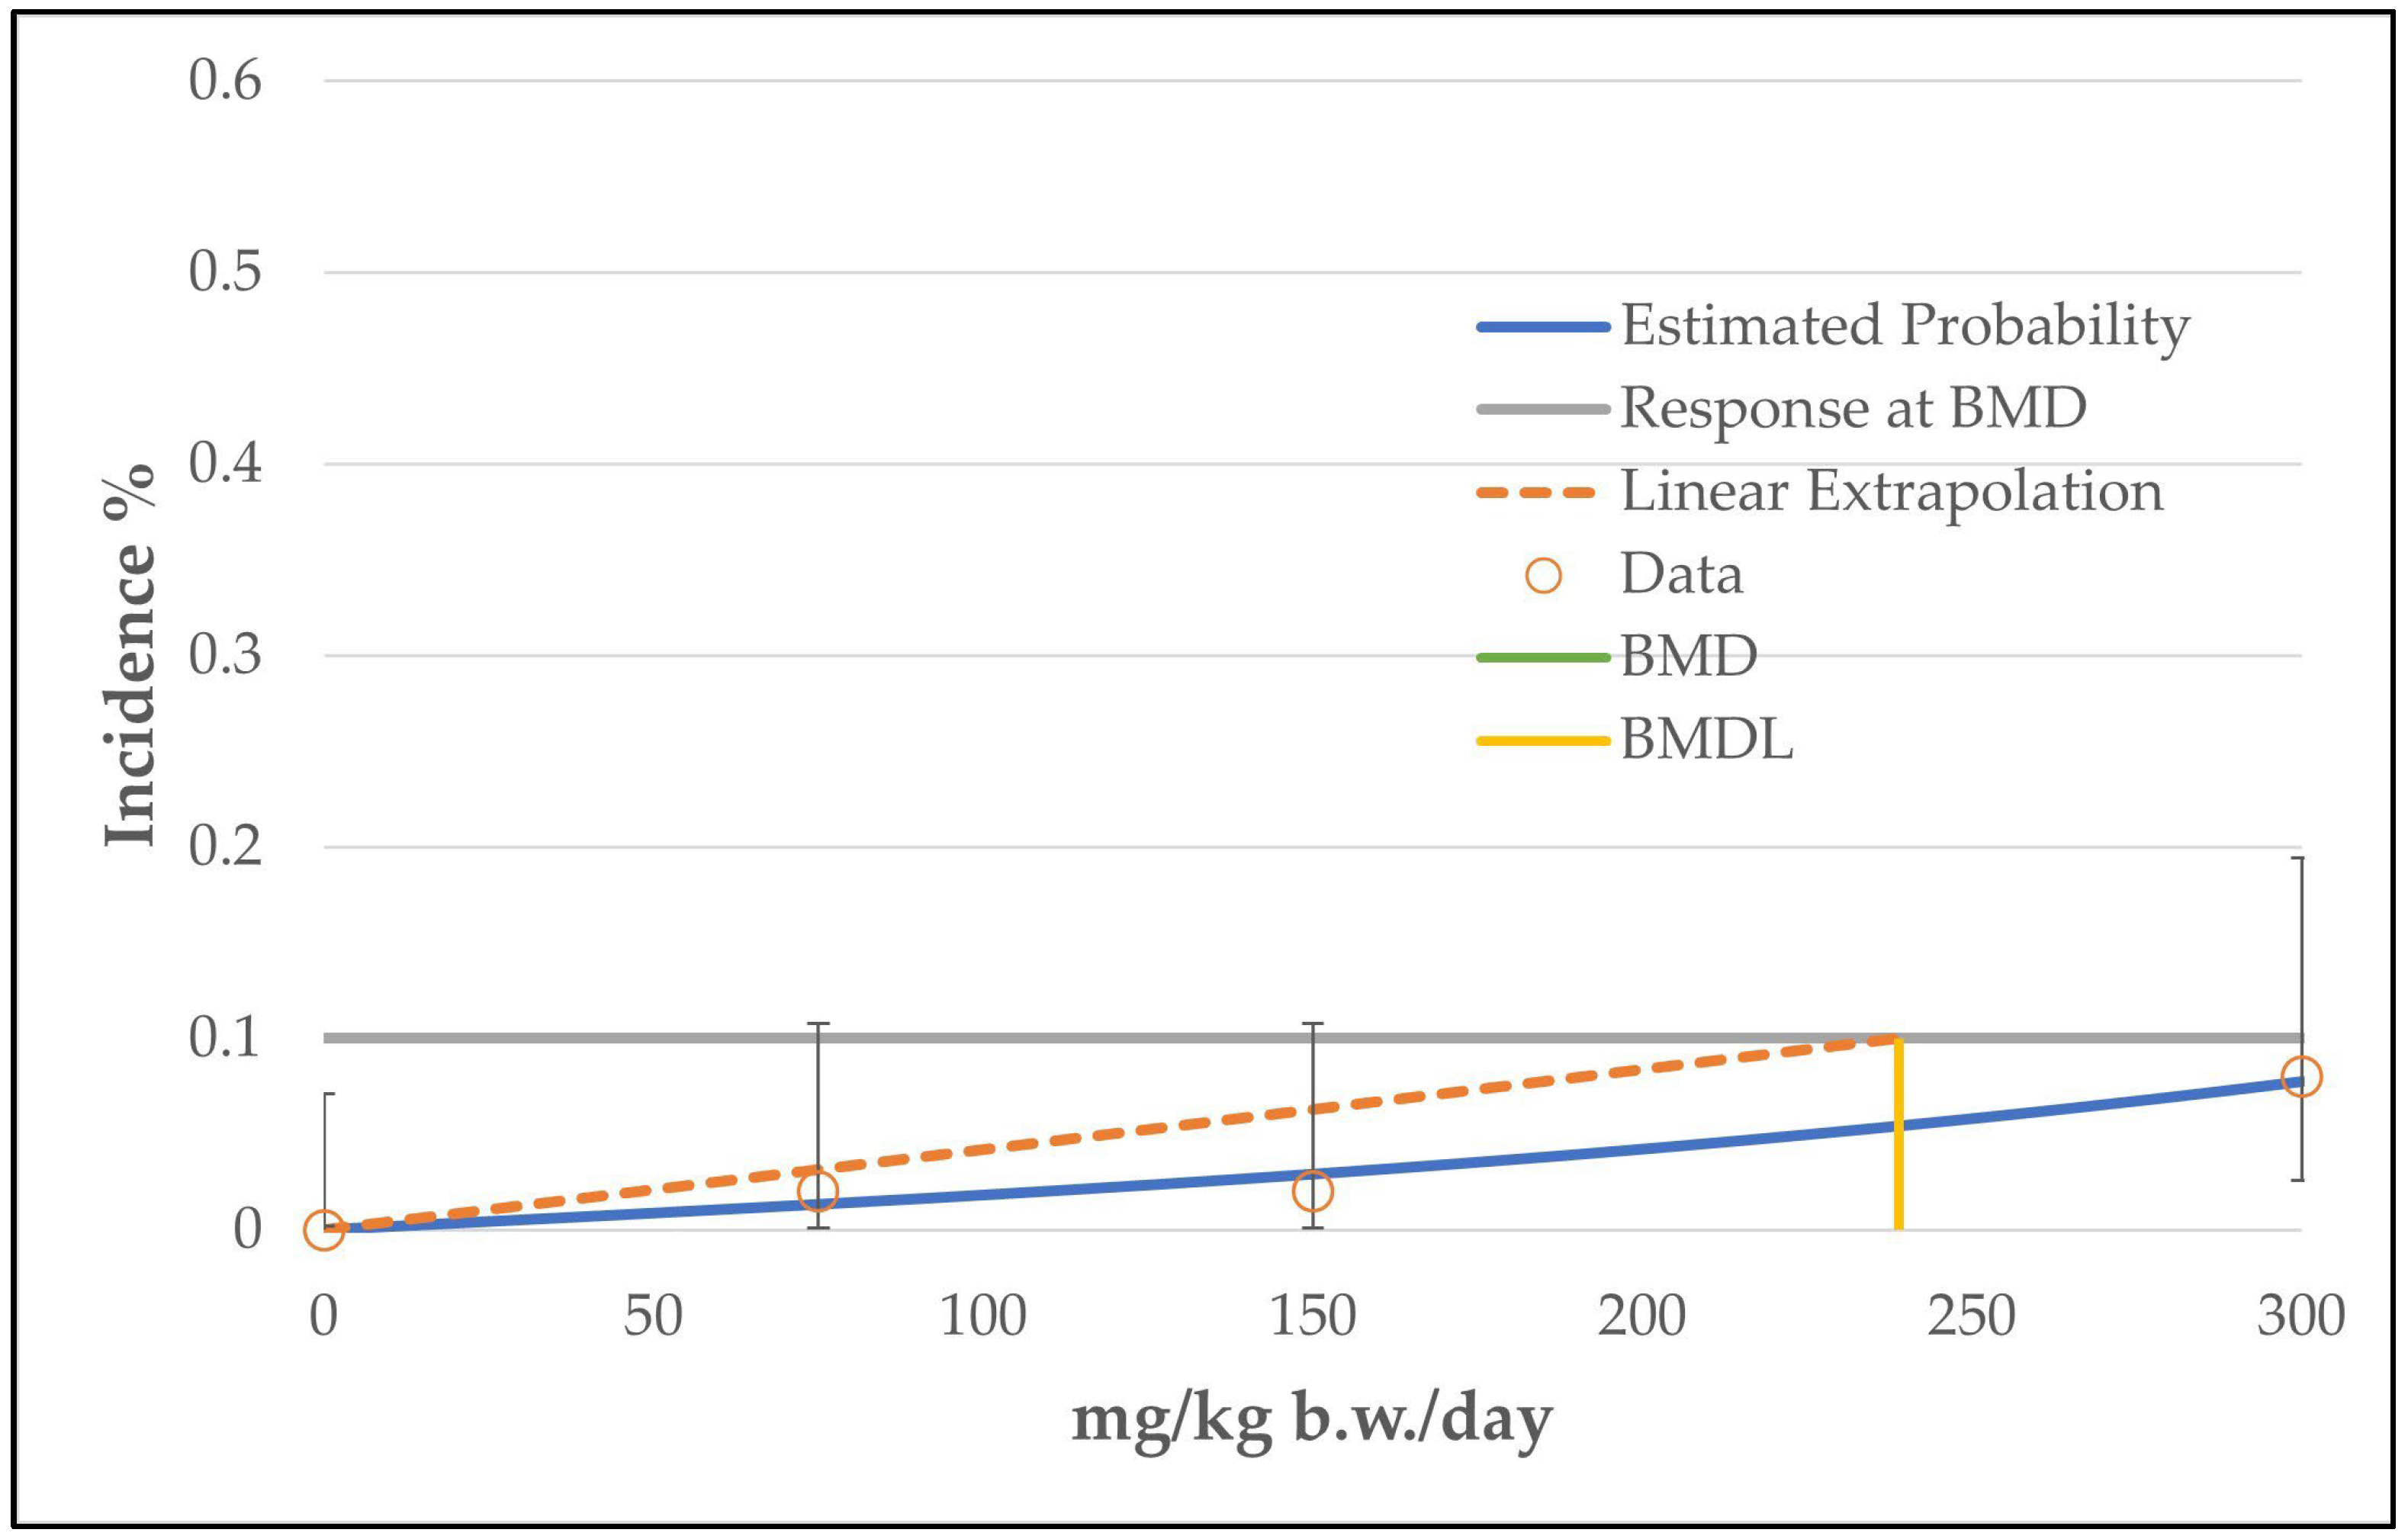
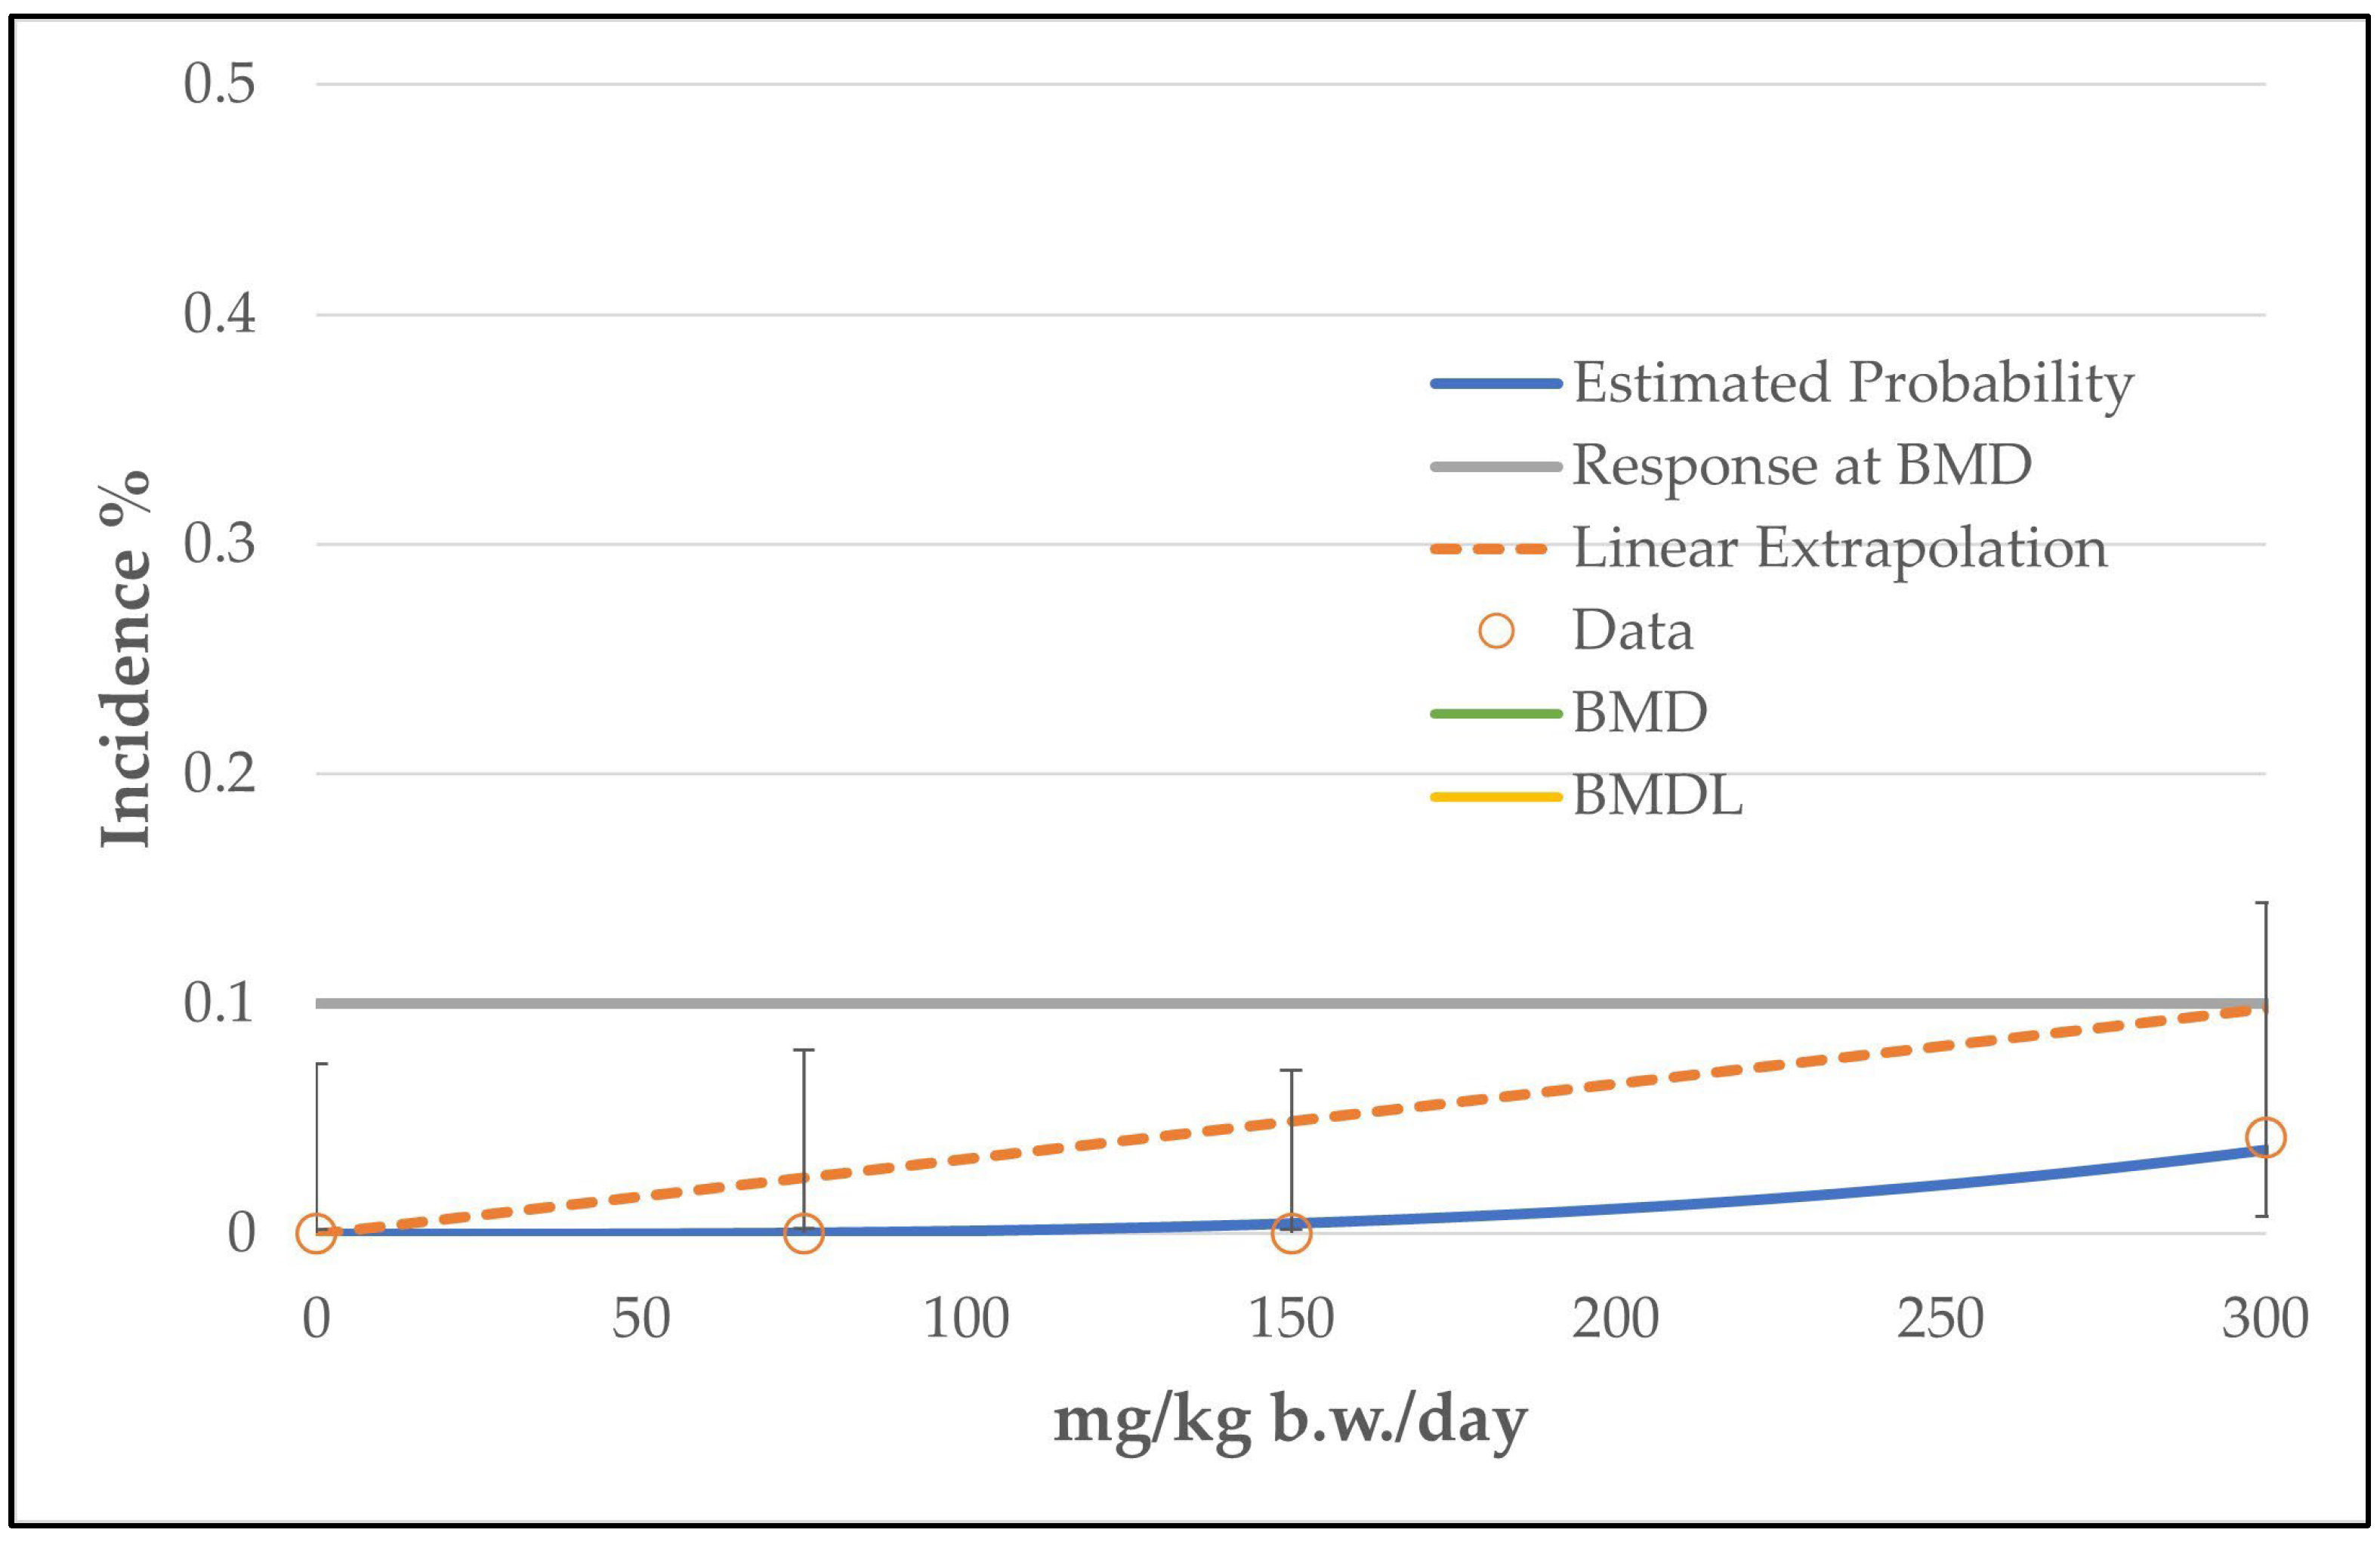
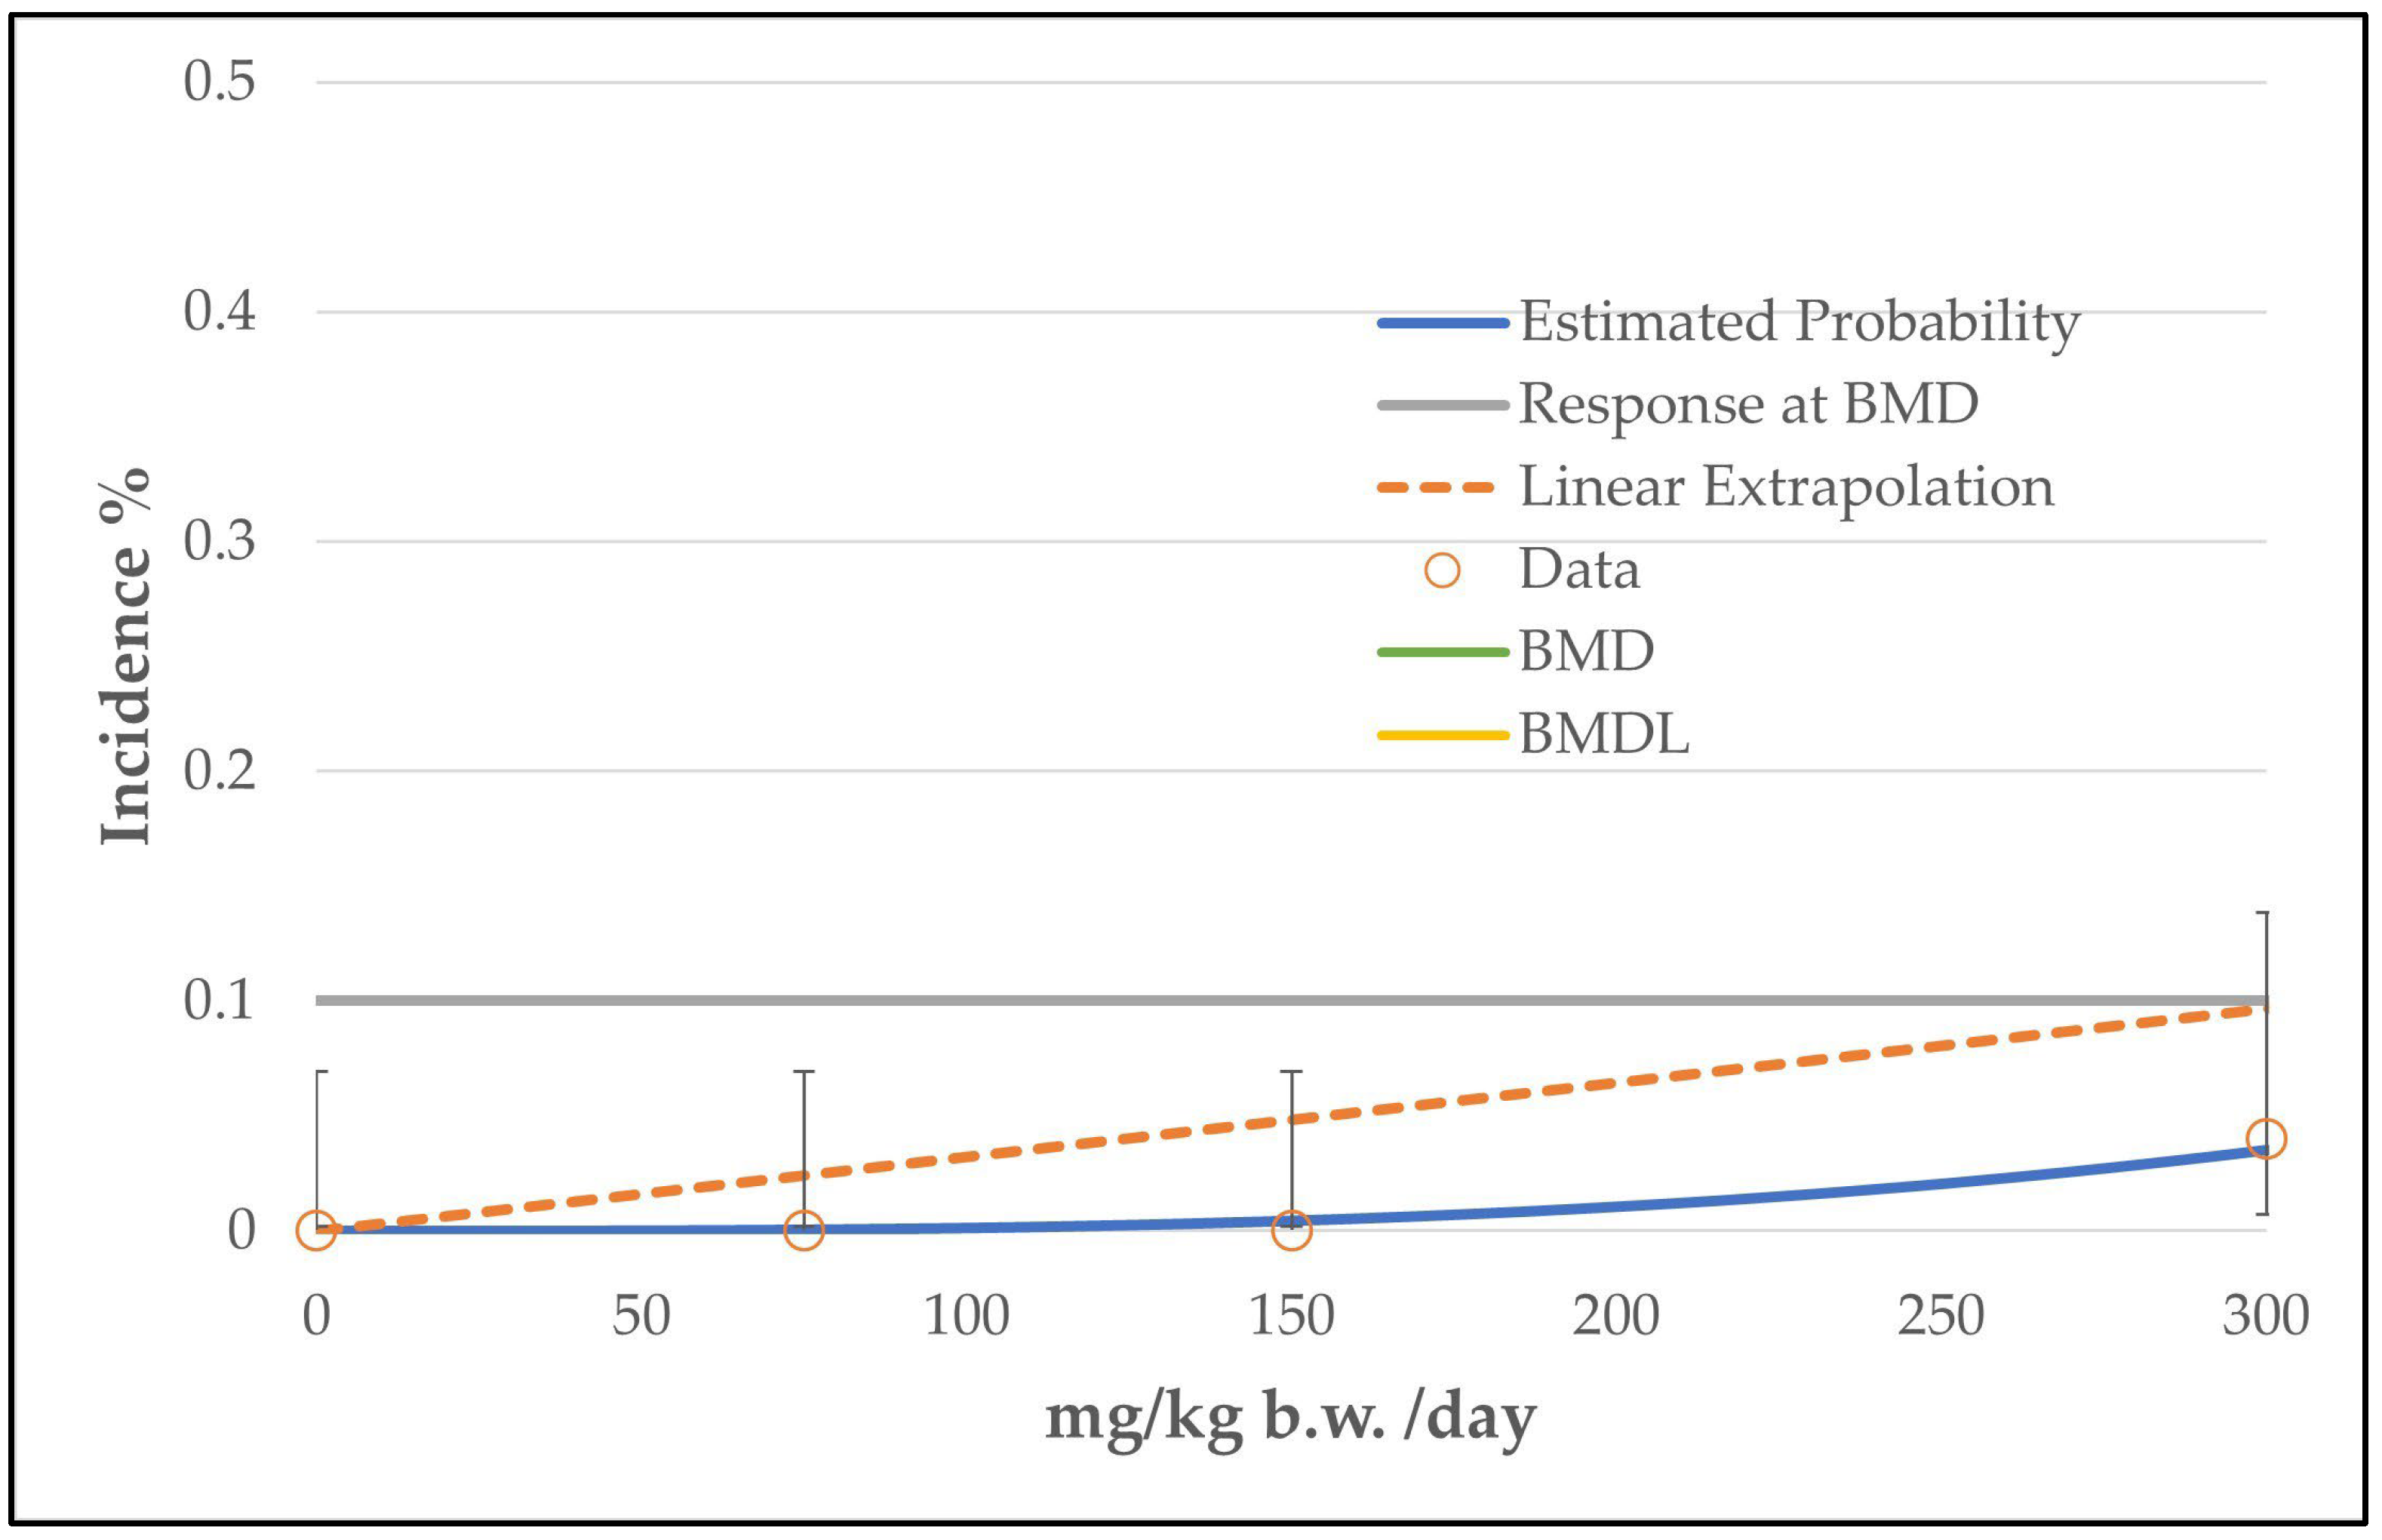
3.2. BMD Modeling of Other Neoplastic Lesions: Histiocytic Sarcomas, Thymoma and Mammary Gland Carcinoma
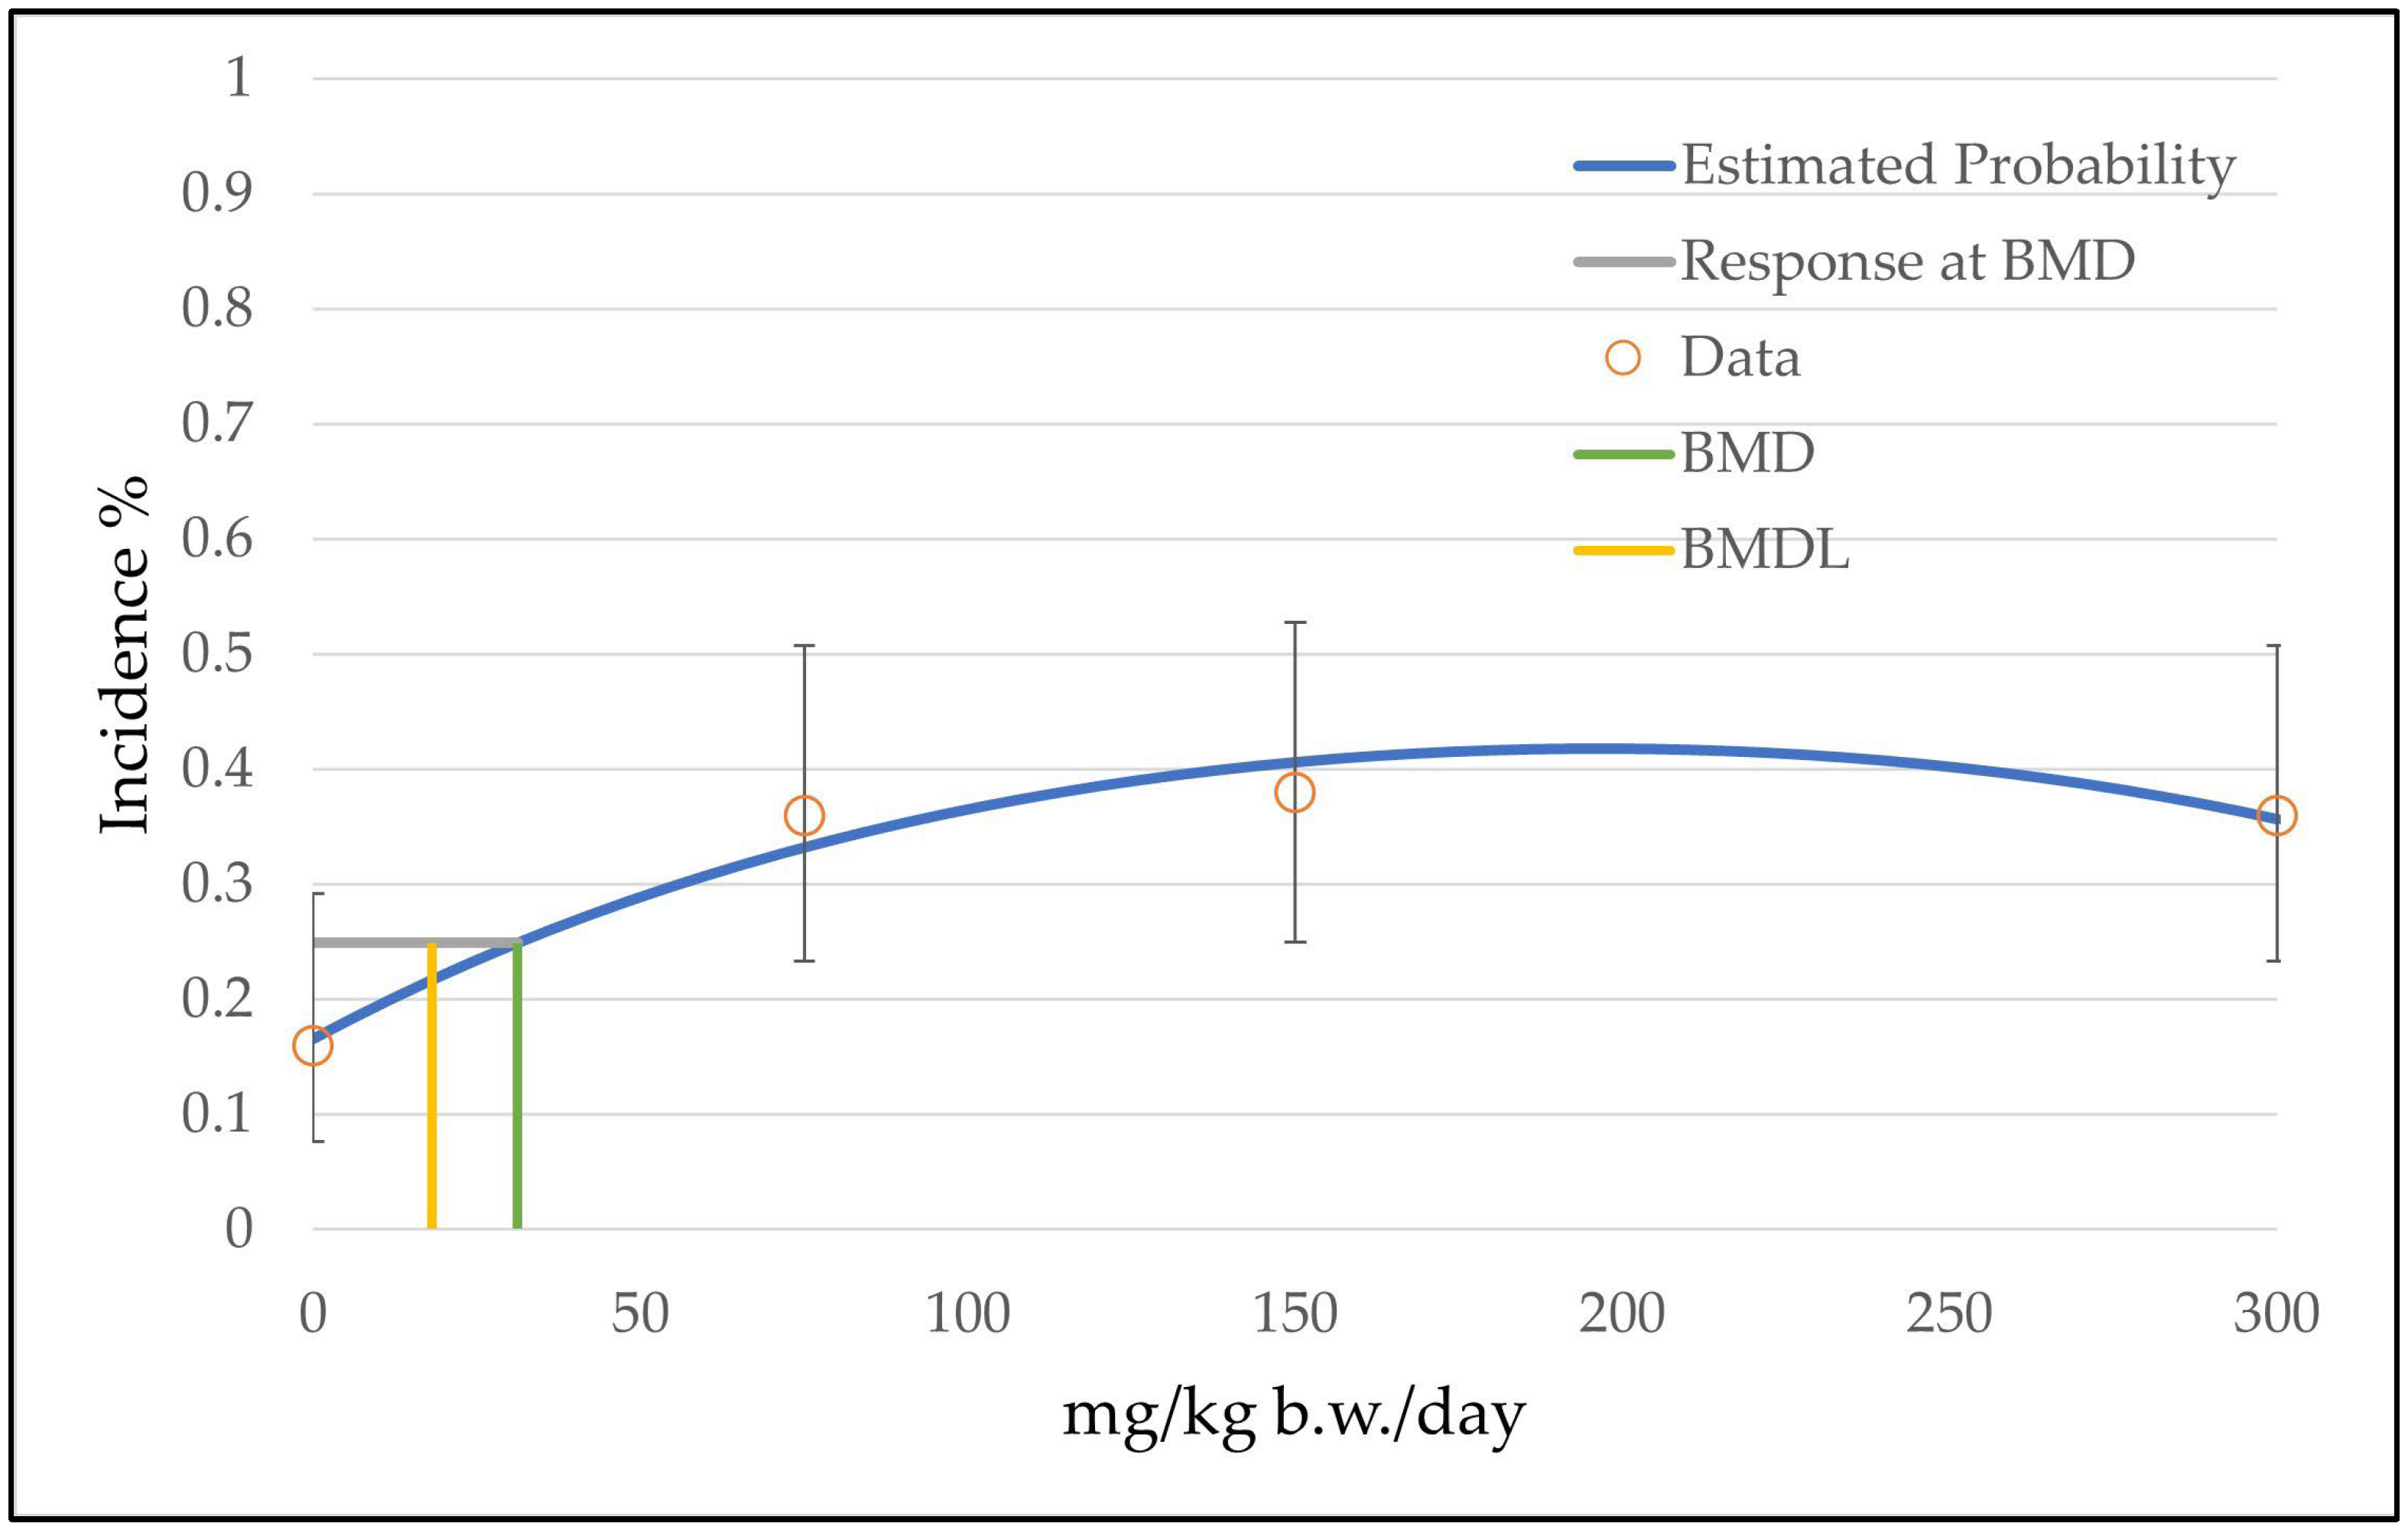
3.3. BMD Modeling of Non-Neoplastic Lesions of the Nose
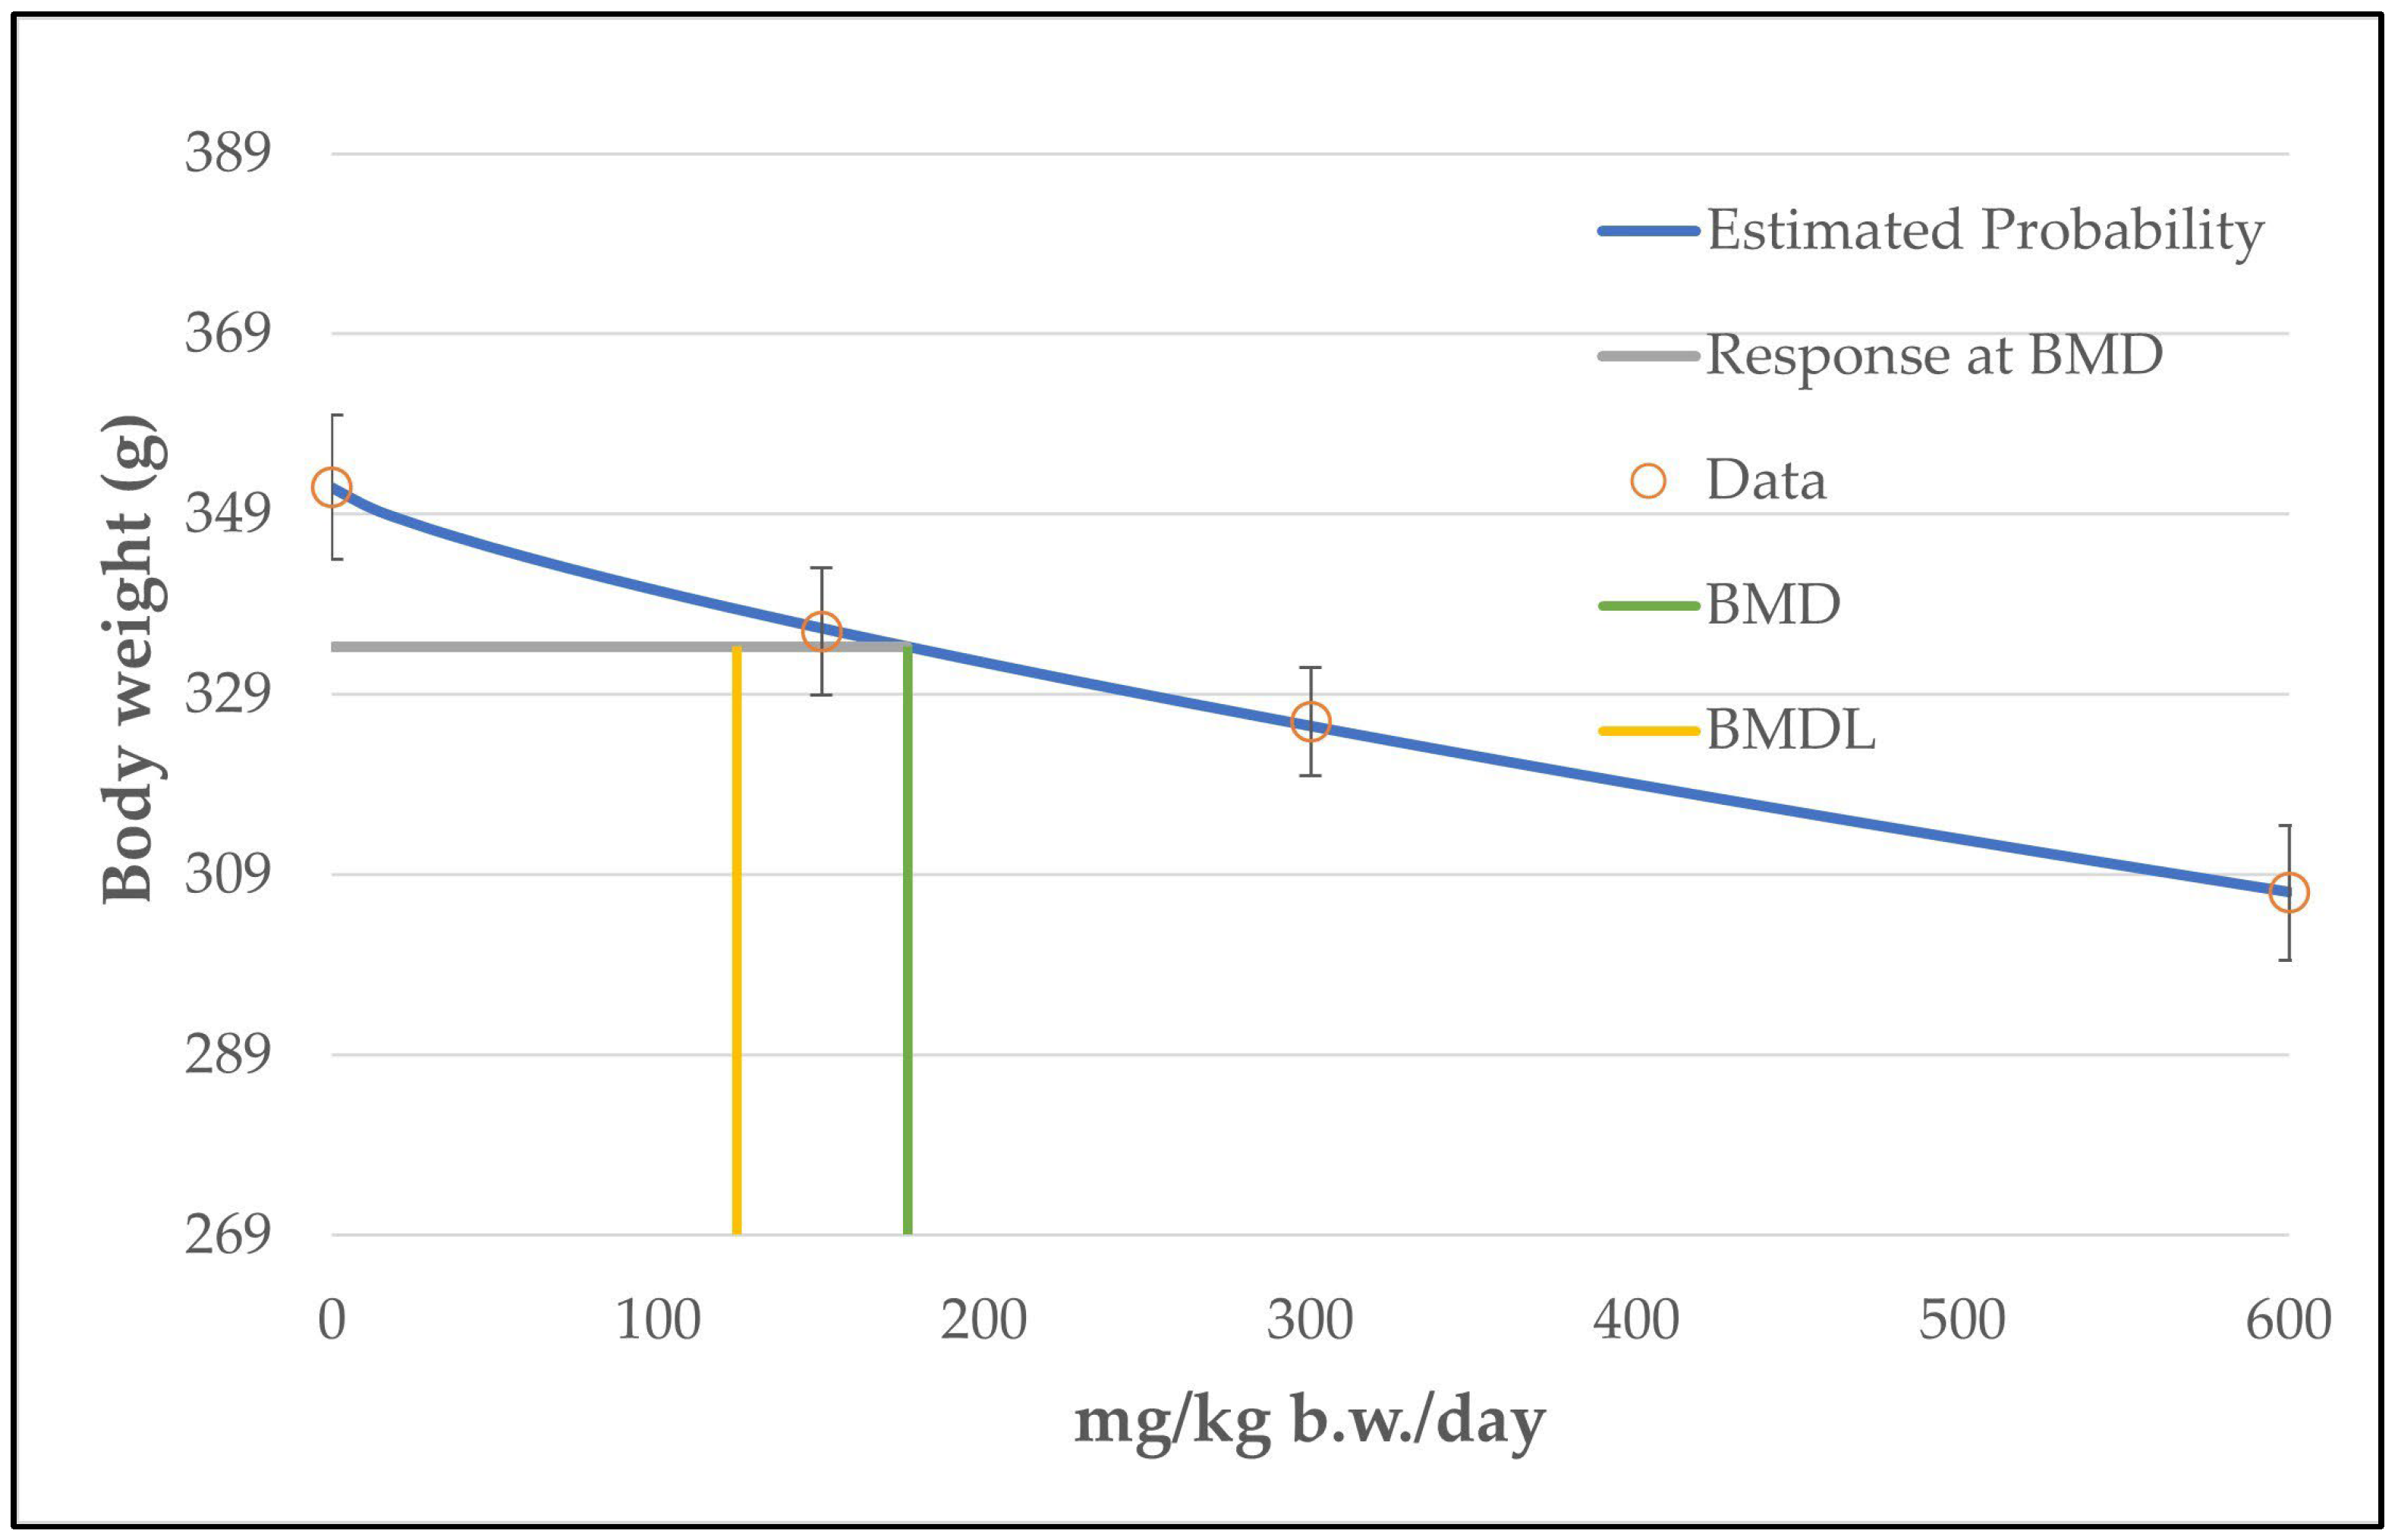
3.4. BMD Modeling of Body Weight
4. Discussion
4.1. Summary of Calculated BMDL Values
4.2. Rationale for the Approach for Risk Assessment of Isoeugenol
4.3. Calculation of ADI Value
4.4. Re-Calculation of the MRL Value for Fin Fish
4.5. Relevance of the Observed Neoplastic Liver Lesions for Humans
5. Conclusions
Supplementary Materials
Author Contributions
Funding
Institutional Review Board Statement
Informed Consent Statement
Data Availability Statement
Acknowledgments
Conflicts of Interest
Abbreviations
| ADI | Acceptable Daily Intake |
| AIC | Akaike Information Criterion |
| BMD | Benchmark Dose |
| BMDL | Benchmark Dose lower confidence limit |
| BMRF | Benchmark Response Factor |
| CVMP | Committee for Veterinary Medicinal Products |
| GRAS | Generally Recognized As Safe |
| FAO/WHO | Food and Agriculture Organization/Worl Health Organization |
| IARC | International Agency for Research on Cancer |
| JECFA | Joint FAO/WHO Expert Committee on Food Additives |
| LOAEL | Lowest Observed Adverse Effect Level |
| MOE | Margin Of Exposure |
| MRL | Maximum Residue Level |
| NOAEL | No Observed Adverse Effect Level |
| NTP | National Toxicology Program |
| POD | Point Of Departure |
| RIFM | Research Institute of Fragrance Materials |
| SCE | Sister Chromatid Exchange |
References
- Rietjens, I.M.C.M.; Cohen, S.M.; Fukushima, S.; Gooderham, N.J.; Hecht, S.; Marnett, L.J.; Smith, R.L.; Adams, T.B.; Bastaki, M.; Harman, C.G.; et al. Impact of structural and metabolic variations on the toxicity and carcinogenicity of hydroxy- and alkoxy-substituted allyl- and propenylbenzenes. Chem. Res. Toxicol. 2014, 27, 1092–1103. [Google Scholar] [CrossRef] [PubMed]
- International Agency for Research on Cancer. Aspartame, Methyleugenol, and Isoeugenol. In IARC Monographs on The Identification of Carcinogenic Hazards to Humans; International Agency for Research on Cancer: Lyon, France, 2023; Volume 134. [Google Scholar]
- Riboli, E.; Beland, F.A.; Lachenmeier, D.W.; Marques, M.M.; Phillips, D.H.; Schernhammer, E.; Afghan, A.; Assunção, R.; Caderni, G.; Corton, J.C.; et al. Carcinogenicity of aspartame, methyleugenol, and isoeugenol. Lancet Oncol. 2023, 24, 848–850. [Google Scholar] [CrossRef] [PubMed]
- Joint FAO/WHO Expert Committee on Food Additives. Safety Evaluation of Certain Food Additives and Contaminants: Prepared by the Sixty-First Meeting of the Joint FAO/WHO Expert Committee on Food Additives (JECFA); WHO Food Additives Series 52; World Health Organization: Geneva, Switzerland, 2004; ISBN 92-4-166052-X.
- Api, A.M.; Belsito, D.; Bhatia, S.; Bruze, M.; Calow, P.; Dagli, M.L.; Dekant, W.; Fryer, A.D.; Kromidas, L.; La Cava, S.; et al. RIFM fragrance ingredient safety assessment, isoeugenol, CAS Registry Number 97-54-1. Food Chem. Toxicol. 2016, 97, S49–S56. [Google Scholar] [CrossRef] [PubMed]
- European Commission. Regulation (EC) No 1334/2008 of the European Parliament and of the Council of 16 December 2008 on flavourings and certain food ingredients with flavouring properties for use in and on foods and amending Council Regulation (EEC) No 1601/91, Regulations (EC) No 2232/96 and (EC) No 110/2008 and Directive 2000/13/EC (Text with EEA relevance) Text with EEA relevance. Off. J. EU 2008, L354, 34–50. [Google Scholar]
- European Commission. Regulation (EC) No 1223/2009 of the European Parliament and of the Council of 30 November 2009 on cosmetic products. Off. J. EU 2009, L342, 59–209. [Google Scholar]
- European Commission. Directive 2009/48/EC of the European Parliament and of the Council of 18 June 2009 on the safety of toys. Off. J. EU 2009, L170, 1–37. [Google Scholar]
- CVMP. Isoeugenol: European Public MRL Assessment Report (EPMAR)—Committee for Veterinary Medicinal Products. Available online: https://www.ema.europa.eu/en/documents/mrl-report/isoeugenol-fin-fish-european-public-mrl-assessment-report-epmar-cvmp_en.pdf (accessed on 23 November 2023).
- EFSA. Guidance on selected default values to be used by the EFSA Scientific Committee, Scientific Panels and Units in the absence of actual measured data. EFSA J. 2012, 10, 2579. [Google Scholar] [CrossRef]
- NTP. Toxicology and carcinogenesis studies of isoeugenol (CAS No. 97-54-1) in F344/N rats and B6C3F1 mice (gavage studies). Natl. Toxicol. Program Tech. Rep. Ser. 2010, 551, 1–178. [Google Scholar]
- More, S.J.; Bampidis, V.; Benford, D.; Bragard, C.; Halldorsson, T.I.; Hernández-Jerez, A.F.; Bennekou, S.H.; Koutsoumanis, K.; Lambré, C.; Machera, K.; et al. Guidance on the use of the benchmark dose approach in risk assessment. EFSA J. 2022, 20, 7584. [Google Scholar] [CrossRef]
- U.S. EPA, ORD, Center for Public Health and Environmental Assessment. Benchmark Dose Software 3.3 User Guide. Available online: https://assessments.epa.gov/bmds/document/&deid=353980 (accessed on 23 November 2023).
- Hogan, K.; EPA Technical Panel. Benchmark Dose Technical Guidance (EPA June 2012). Available online: https://www.epa.gov/risk/benchmark-dose-technical-guidance (accessed on 23 November 2023).
- EPA Risk Assessment Forum, Guidelines for Carcinogen Risk Assessment (EPA March 2015). EPA/630/P-03/001F_March 2015. Available online: https://www.epa.gov/risk/guidelines-carcinogen-risk-assessment (accessed on 23 November 2023).
- Kommalapati, A.; Tella, S.H.; Durkin, M.; Go, R.S.; Goyal, G. Histiocytic sarcoma: A population-based analysis of incidence, demographic disparities, and long-term outcomes. Blood 2018, 131, 265–268. [Google Scholar] [CrossRef]
- Hartwig, A.; Arand, M.; Epe, B.; Guth, S.; Jahnke, G.; Lampen, A.; Martus, H.-J.; Monien, B.; Rietjens, I.M.C.M.; Schmitz-Spanke, S.; et al. Mode of action-based risk assessment of genotoxic carcinogens. Arch. Toxicol. 2020, 94, 1787–1877. [Google Scholar] [CrossRef] [PubMed]
- Moore, M.M.; Pottenger, L.H.; House-Knight, T. Critical review of styrene genotoxicity focused on the mutagenicity/clastogenicity literature and using current organization of economic cooperation and development guidance. Environ. Mol. Mutagen. 2019, 60, 624–663. [Google Scholar] [CrossRef]
- Mishima, M. Chromosomal aberrations, clastogens vs aneugens. Front. Biosci. 2017, 9, 1–16. [Google Scholar] [CrossRef]
- Corvi, R.; Madia, F. In vitro genotoxicity testing-Can the performance be enhanced? Food Chem. Toxicol. 2017, 106, 600–608. [Google Scholar] [CrossRef]
- More, S.J.; Bampidis, V.; Bragard, C.; Halldorsson, T.I.; Hernández-Jerez, A.F.; Hougaard Bennekou, S.; Koutsoumanis, K.; Lambré, C.; Machera, K.; Naegeli, H.; et al. Guidance on aneugenicity assessment. EFSA J. 2021, 19, 6770. [Google Scholar] [CrossRef]
- Shaw, I.C.; Jones, H.B. Mechanisms of non-genotoxic carcinogenesis. Trends Pharmacol. Sci. 1994, 15, 89–93. [Google Scholar] [CrossRef] [PubMed]
- Hernández, L.G.; van Steeg, H.; Luijten, M.; van Benthem, J. Mechanisms of non-genotoxic carcinogens and importance of a weight of evidence approach. Mutat. Res. 2009, 682, 94–109. [Google Scholar] [CrossRef] [PubMed]
- Wu, K.; Zhou, Q.; Ouyang, S. Direct and Indirect Genotoxicity of Graphene Family Nanomaterials on DNA-A Review. Nanomaterials 2021, 11, 2889. [Google Scholar] [CrossRef]
- Pfohl-Leszkowicz, A.; Manderville, R.A. An update on direct genotoxicity as a molecular mechanism of ochratoxin a carcinogenicity. Chem. Res. Toxicol. 2012, 25, 252–262. [Google Scholar] [CrossRef]
- Kirsch-Volders, M.; Vanhauwaert, A.; Eichenlaub-Ritter, U.; Decordier, I. Indirect mechanisms of genotoxicity. Toxicol. Lett. 2003, 140–141, 63–74. [Google Scholar] [CrossRef] [PubMed]
- Bevan, R.J.; Harrison, P.T.C. Threshold and non-threshold chemical carcinogens: A survey of the present regulatory landscape. Regul. Toxicol. Pharmacol. 2017, 88, 291–302. [Google Scholar] [CrossRef] [PubMed]
- Jenkins, G.J.S.; Zaïr, Z.; Johnson, G.E.; Doak, S.H. Genotoxic thresholds, DNA repair, and susceptibility in human populations. Toxicology 2010, 278, 305–310. [Google Scholar] [CrossRef] [PubMed]
- More, S.; Bampidis, V.; Benford, D.; Bragard, C.; Halldorsson, T.; Hougaard Bennekou, S.; Koutsoumanis, K.; Machera, K.; Naegeli, H.; Nielsen, S.; et al. Statement on the derivation of Health-Based Guidance Values (HBGVs) for regulated products that are also nutrients. EFSA J. 2021, 19, 6479. [Google Scholar] [CrossRef]
- Belgian Federal Agency for the Safety of the Food Chain, Opinion 15-2019. Use of the ‘Margin of Exposure’ (MOE) Approach for Deriving Risk-Based Action Limits for Carcinogens Unintentionally Present in Food. Available online: https://www.favv-afsca.be/scientificcommittee/opinions/2019/_documents/Opinion15-2019_SciCom2018-12_MOEactionlimits.pdf (accessed on 23 November 2023).
- EFSA Scientific Committee. Opinion of the Scientific Committee on a request from EFSA related to A Harmonised Approach for Risk Assessment of Substances Which are both Genotoxic and Carcinogenic. EFSA J. 2005, 3, 282. [Google Scholar] [CrossRef]
- EFSA. Statement on the applicability of the Margin of Exposure approach for the safety assessment of impurities which are both genotoxic and carcinogenic in substances added to food/feed. EFSA J. 2012, 10, 2578. [Google Scholar] [CrossRef]
- Smith, M.T.; Guyton, K.Z.; Gibbons, C.F.; Fritz, J.M.; Portier, C.J.; Rusyn, I.; DeMarini, D.M.; Caldwell, J.C.; Kavlock, R.J.; Lambert, P.F.; et al. Key Characteristics of Carcinogens as a Basis for Organizing Data on Mechanisms of Carcinogenesis. Environ. Health Perspect. 2016, 124, 713–721. [Google Scholar] [CrossRef] [PubMed]
- Sekizawa, J.; Shibamoto, T. Genotoxicity of safrole-related chemicals in microbial test systems. Mutat. Res. 1982, 101, 127–140. [Google Scholar] [CrossRef] [PubMed]
- Ishii, Y.; Namiki, M.; Takasu, S.; Nakamura, K.; Takimoto, N.; Mitsumoto, T. Lack of genotoxic mechanisms in isoeugenol-induced hepatocellular tumorigenesis in male B6C3F1 mice. Jap. J. Food Chem. Saf. 2023, 30, 9–22. [Google Scholar] [CrossRef]
- Sasaki, Y.F.; Imanishi, H.; Ohta, T.; Shirasu, Y. Modifying effects of components of plant essence on the induction of sister-chromatid exchanges in cultured Chinese hamster ovary cells. Mutat. Res. 1989, 226, 103–110. [Google Scholar] [CrossRef]
- Burkey, J.L.; Sauer, J.M.; McQueen, C.A.; Sipes, I.G. Cytotoxicity and genotoxicity of methyleugenol and related congeners—A mechanism of activation for methyleugenol. Mutat. Res. 2000, 453, 25–33. [Google Scholar] [CrossRef]
- Munerato, M.C.; Sinigaglia, M.; Reguly, M.L.; de Andrade, H.H.R. Genotoxic effects of eugenol, isoeugenol and safrole in the wing spot test of Drosophila melanogaster. Mutat Res. 2005, 582, 87–94. [Google Scholar] [CrossRef] [PubMed]
- Kobets, T.; Duan, J.-D.; Brunnemann, K.D.; Etter, S.; Smith, B.; Williams, G.M. Structure-Activity Relationships for DNA Damage by Alkenylbenzenes in Turkey Egg Fetal Liver. Toxicol. Sci. 2016, 150, 301–311. [Google Scholar] [CrossRef]
- Jansson, T.; Curvall, M.; Hedin, A.; Enzell, C.R. In vitro studies of biological effects of cigarette smoke condensate II. Induction of sister-chromatid exchanges in human lymphocytes by weakly acidic, semivolatile constituents. Mutat. Res. 1986, 169, 129–139. [Google Scholar] [CrossRef] [PubMed]
- Jansson, T.; Curvall, M.; Hedin, A.; Enzell, C.R. In vitro studies of the biological effects of cigarette smoke condensate. III. Induction of SCE by some phenolic and related constituents derived from cigarette smoke. Mutat. Res. 1988, 206, 17–24. [Google Scholar] [CrossRef] [PubMed]
- Elhajouji, A.; Lukamowicz, M.; Cammerer, Z.; Kirsch-Volders, M. Potential thresholds for genotoxic effects by micronucleus scoring. Mutagenesis 2011, 26, 199–204. [Google Scholar] [CrossRef] [PubMed]
- ICH. S2(R1) Guideline: Guidance on Genotoxicity Testing and Data Interpretation for Pharmaceuticals Intended for Human Use. Available online: https://www.ich.org/page/safety-guidelines (accessed on 23 November 2023).
- FEMA Expert Panel. GRAS 24: The 24th publication by the FEMA Expert Panel presents safety and usage data on 236 new generally recognized as safe flavoring ingredients. Food Technol. 2009, 63, 46–105. [Google Scholar]


| Neoplastic Liver Lesions Affected Animals/Total (Overall Rate in %) 1 | ||||
|---|---|---|---|---|
| Control | 75 mg/kg b.w./day | 150 mg/kg b.w./day | 300 mg/kg b.w./day | |
| Male mice | ||||
| Hepatocellular adenoma (including multiple) 2 | 24/50 (48%) | 35/50 * (70%) | 37/50 ** (74%) | 33/50 ** (66%) |
| p = 0.012 3 | ||||
| (48 to 52%) 4 | ||||
| Hepatocellular carcinoma (including multiple) 2 | 8/50 (16%) | 18/50 * (36%) | 19/50 * (38%) | 18/50 * (36%) |
| p = 0.027 3 | ||||
| (16 to 28%) 4 | ||||
| Hepatocellular adenoma and/or carcinoma 5 | 28/50 (56%) | 43/50 ** (86%) | 43/50 ** (86%) | 43/50 ** (86%) |
| p < 0.001 2 | ||||
| (56 to 66%) 4 | ||||
| Model | Goodness of Fit | BMD | BMDL | Rationale for Model Selection by BMDS Software | |
|---|---|---|---|---|---|
| p-Value | AIC | ||||
| Multistage Degree 2 (unrestricted) | 0.77 | 257.82 | 13 | 8 | The multistage degree 2 model was the only model with an adequate fit (p ≥ 0.1) |
| Multistage Degree 1 to 3 (restricted) Multistage Degree 1 (unrestricted) | 0.06 | 261.56 | 69 | 33 | Models classified as questionable, due to a p-value < 0.1 |
| Model | Goodness of Fit | BMD | BMDL | Rationale for Model Selection | |
|---|---|---|---|---|---|
| p-Value | AIC | ||||
| Log-Logistic R | 0.15 | 248.80 | 88 | 43 | From all models that provided an adequate fit (p ≥ 0.1), the unrestricted multistage degree 2 model was selected based on the lowest BMDL (unrounded values). |
| Gamma R, | 0.13 | 249.22 | 108 | 58 | |
| Multistage Degree 3 R, | |||||
| Multistage Degree 2 R, | |||||
| Multistage Degree 1 R, | |||||
| Weibull R, | |||||
| Quantal Linear UnR, | |||||
| Multistage Degree 1 UnR | |||||
| Multistage Degree 2 UnR | 0.56 | 247.39 | 31 | 18 | |
| Model | Goodness of Fit | BMD | BMDL | Rationale for Model Selection | |
|---|---|---|---|---|---|
| p-Value | AIC | ||||
| Gamma R, | 0.14 | 155.88 | 11 | 8 | From all models that provided an adequate fit (p ≥ 0.1), the five models in bold were selected based on the lowest BMDL (unrounded values). |
| Multistage Degree 1 R, | |||||
| Weibull R, | |||||
| Multistage Degree 1 UnR, | |||||
| Quantal Linear | |||||
| Log-Probit R | 0.12 | 155.94 | 20 | 13 | |
| Multistage Degree 2 R 1 | 0.14 | 155.88 | 11 | 8 | |
| Histiocytic Sarcomas, Thymoma and Mammary Gland Carcinoma. Affected Animals/Total (Overall Rate in%) 1 | ||||
|---|---|---|---|---|
| 0 | 75 | 150 | 300 | |
| Female mice | ||||
| Histiocytic sarcomas (multiple sites) | 0/49 | 1/50 (2%) | 1/50 (2%) | 4/50 (8%) |
| p = 0.015 2 | ||||
| (0 to 8%) 3 | ||||
| Male rats | ||||
| Thymoma (benign or malignant) | 0/47 | 0/43 | 0/49 | 2/48 (4%) |
| p = 0.047 2 | ||||
| (0 to 2%) 3 | ||||
| Carcinoma of the mammary gland | 0/50 | 0/50 | 0/50 | 2/50 (4%) |
| p = 0.042 2 | ||||
| (not available) 3 | ||||
| Model | Goodness of Fit | BMD | BMDL | Rationale for Model Selection by BMDS Software | |
|---|---|---|---|---|---|
| p-Value | AIC | ||||
| Histiocytic sarcomas | All models were recommended as viable for all 3 endpoints; the selected models were chosen due to the lowest AIC value. | ||||
| Multistage Degree 3, R | 0.96 | 49.80 | 348 | 239 | |
| Range of other viable models | 0.61 to 1.00 | 49.86 to 53.48 | 318 to 448 | 198 to 254 | |
| Thymoma | |||||
| Multistage Degree 3, R | 0.99 | 17.17 | 425 | 307 | |
| Range of other viable models | 0.68 to 1.00 | 17.73 to 20.87 | 308 to 1300 | 294 to 490 | |
| Mammary gland carcinoma | |||||
| Multistage degree 3, R | 0.99 | 17.33 | 430 | 311 | |
| Range of other viable models | 0.68 to 1.00 | 17.90 to 22.79 | 310 to 1367 | 228 to 516 | |
| Affected Animals/Total Examined Animals (mg/kg b.w./day) | ||||||||
|---|---|---|---|---|---|---|---|---|
| T 1 | 0 | 37.5 | 75 | 150 | 300 | 600 | BMDL | |
| Atrophy of the olfactory epithelium | ||||||||
| Male rats | 4 | 0/10 | 3/10 | 3/10 | 4/10 * | 4/10 * | 5/10 * | 9 |
| Female rats | 4 | 0/10 | 1/10 | 2/10 | 2/10 | 5/10 * | 6/10 ** | 5 |
| Male rats | 9 | 1/50 | - | 5/48 | 9/49 ** | 13/49 ** | - | 44 |
| Female rats | 9 | 0/50 | - | 0/49 | 0/49 | 4/49 * | - | 265 |
| Male mice | 12 | 0/10 | 0/10 | 0/10 | 0/10 | 0/10 | 10/10 ** | 297 |
| Female mice | 12 | 0/10 | 0/10 | 0/10 | 0/10 | 0/10 | 10/10 ** | 297 |
| Male mice | 18 | 5/50 | - | 13/50 * | 36/50 ** | 41/50 ** | - | - 2 |
| Female mice | 18 | 3/48 | - | 8/50 | 36/50 ** | 43/50 ** | - | - 2 |
| Metaplasia of the respiratory olfactory epithelium | ||||||||
| Male rats | 9 | 4/50 | - | 6/48 | 10/49 ** | 15/49 ** | - | 18 |
| Female rats | 9 | 5/50 | - | 5/49 | 9/49 | 12/49 * | - | 38 |
| Male mice | 18 | 4/50 | - | 31/50 ** | 47/50 ** | 49/50 ** | - | 15 |
| Female mice | 18 | 6/48 | - | 37/50 ** | 49/50 ** | 50/50 ** | - | 12 |
| Degeneration of the olfactory epithelium | ||||||||
| Male rats | 9 | 1/50 | - | 0/48 | 2/49 | 6/49 * | - | 216 |
| Male mice | 18 | 1/50 | - | 1/50 | 7/50 * | 6/50 * | - | 135 |
| Accumulation of hyaline droplets in the olfactory epithelium | ||||||||
| Male mice | 18 | 0/50 | - | 6/50 * | 26/50 ** | 19/50 ** | - | 49 |
| Female mice | 18 | 0/48 | - | 4/50 | 18/50 ** | 12/50 ** | - | 54 |
| Hyperplasia of the nasal glands | ||||||||
| Male mice | 18 | 3/50 | - | 34/50 ** | 49/50 ** | 48/50 ** | - | - 2 |
| Female mice | 18 | 6/48 | - | 38/50 ** | 49/50 ** | 49/50 ** | - | 8 |
| Model | Goodness of Fit | BMD | BMDL | Rationale for Model Selection by BMDS Software | |
|---|---|---|---|---|---|
| p-Value | AIC | ||||
| Dichotomous Hill R | 0.96 | 58.45 | 41 | 14 | From all models that provided an adequate fit (p ≥ 0.1), the unrestricted log-probit model was selected based on the lowest BMDL. |
| Log-Logistic R | 0.99 | 56.45 | 42 | 24 | |
| Log-Probit R | 0.71 | 60.48 | 107 | 65 | |
| Logistic UnR | 0.56 | 61.81 | 147 | 103 | |
| Gamma R, | 0.95 | 56.91 | 55 | 37 | |
| Multistage Degree 3 R, | |||||
| Multistage Degree 2 R, | |||||
| Multistage Degree 1 R, | |||||
| Weibull R, | |||||
| Quantal Linear UnR, | |||||
| Multistage Degree 1 UnR | |||||
| Log-Probit UnR | 0.96 | 58.49 | 42 | 5 | |
| Multistage Degree 3 UnR | 0.90 | 60.43 | 44 | 18 | |
| Multistage Degree 2 UnR | 0.97 | 58.44 | 43 | 24 | |
| Probit UnR | 0.59 | 61.55 | 138 | 99 | |
| Mean Body Weights at Study Termination (g) | ||||||
|---|---|---|---|---|---|---|
| Body Weight | 0 | 37.5 | 75 | 150 | 300 | 600 |
| Male rats 1 | 352 ± 8 | 325 ± 3 * | 334 ± 6 * | 336 ± 7 * | 326 ± 6 ** | 307 ± 7 ** |
| −7.7% 2 | −5.1% 2 | −4.5% 2 | −7.4% 2 | −12.8% 2 | ||
| Male mice 3 | 37.7 ± 0.9 | 36.0 ± 1.0 | 36.1 ± 1.6 | 35.7 ± 1.1 | 37.1 ± 1.2 | 33.1 ± 1.0 * |
| Model | Goodness of Fit | BMD | BMDL | Rationale for Model Selection by BMDS Software | |
|---|---|---|---|---|---|
| p-Value | AIC | ||||
| Exponential 3 R | 0.26 | 267.31 | 468 | 418 | From all models that provided an adequate fit (p > 0.1), the unrestricted power model was selected based on the lowest AIC. |
| Exponential 5 R | 0.49 | 267.12 | 430 | 358 | |
| Hill R | 0.35 | 267.53 | 447 | 390 | |
| Polynominal Degree 3 R | 0.16 | 268.30 | 484 | 429 | |
| Power R, | 0.17 | 268.25 | 477 | 430 | |
| Linear (UnR) | |||||
| Polynominal Degree 2 UnR | 0.41 | 267.32 | 428 | 353 | |
| Power UnR | 0.77 | 266.73 | 438 | 372 | |
| Endpoint | Species | Sex | Study | NOAEL or LOAEL (mg/kg b.w./day) 1 | BMDL (mg/kg b.w./day) |
|---|---|---|---|---|---|
| Hepatocellular adenoma | Mouse | Male | 2 years | LOAEL 75 1 | 8 3 |
| Hepatocellular carcinoma | Mouse | Male | 2 years | LOAEL 75 1 | 18 |
| Hepatocellular adenoma and carcinoma combined | Mouse | Male | 2 years | LOAEL 75 1 | 8 4 |
| Histiocytic sarcomas | Mouse | Female | 2 years | NOAEL 150 2 | 239 |
| Thymoma | Rat | Male | 2 years | NOAEL 150 2 | 307 |
| Mammary gland carcinoma | Rat | Male | 2 years | NOAEL 150 2 | 311 |
| Atrophied olfactory epithelium | Rat | Female | 3 months | LOAEL 37.5 2 | 5 |
| Reduction in body weight | Rat | Male | 3 months | NOAEL 150 2 | 372 |
| Calculated ADI Value: 16 µg/kg b.w./day (8000 µg/kg b.w./day Divided by an Uncertainty Factor of 500) | |||
|---|---|---|---|
| Exposure from food intake | Total exposure (food intake + consumer products) | ||
| Europe | USA | Europe | USA |
| 1.95 µg/kg b.w./day | 0.72 µg/kg b.w./day | 2.35 µg/kg b.w./day | 1.12 µg/kg b.w./day |
Disclaimer/Publisher’s Note: The statements, opinions and data contained in all publications are solely those of the individual author(s) and contributor(s) and not of MDPI and/or the editor(s). MDPI and/or the editor(s) disclaim responsibility for any injury to people or property resulting from any ideas, methods, instructions or products referred to in the content. |
© 2023 by the authors. Licensee MDPI, Basel, Switzerland. This article is an open access article distributed under the terms and conditions of the Creative Commons Attribution (CC BY) license (https://creativecommons.org/licenses/by/4.0/).
Share and Cite
Quentin, T.; Franke, H.; Lachenmeier, D.W. Risk Assessment of Isoeugenol in Food Based on Benchmark Dose—Response Modeling. Toxics 2023, 11, 991. https://doi.org/10.3390/toxics11120991
Quentin T, Franke H, Lachenmeier DW. Risk Assessment of Isoeugenol in Food Based on Benchmark Dose—Response Modeling. Toxics. 2023; 11(12):991. https://doi.org/10.3390/toxics11120991
Chicago/Turabian StyleQuentin, Thomas, Heike Franke, and Dirk W. Lachenmeier. 2023. "Risk Assessment of Isoeugenol in Food Based on Benchmark Dose—Response Modeling" Toxics 11, no. 12: 991. https://doi.org/10.3390/toxics11120991
APA StyleQuentin, T., Franke, H., & Lachenmeier, D. W. (2023). Risk Assessment of Isoeugenol in Food Based on Benchmark Dose—Response Modeling. Toxics, 11(12), 991. https://doi.org/10.3390/toxics11120991