
Environmental and Health Risks Posed by Heavy Metal Contamination of Groundwater in the Sunan Coal Mine, China


Abstract
:1. Introduction
2. Materials and Methods
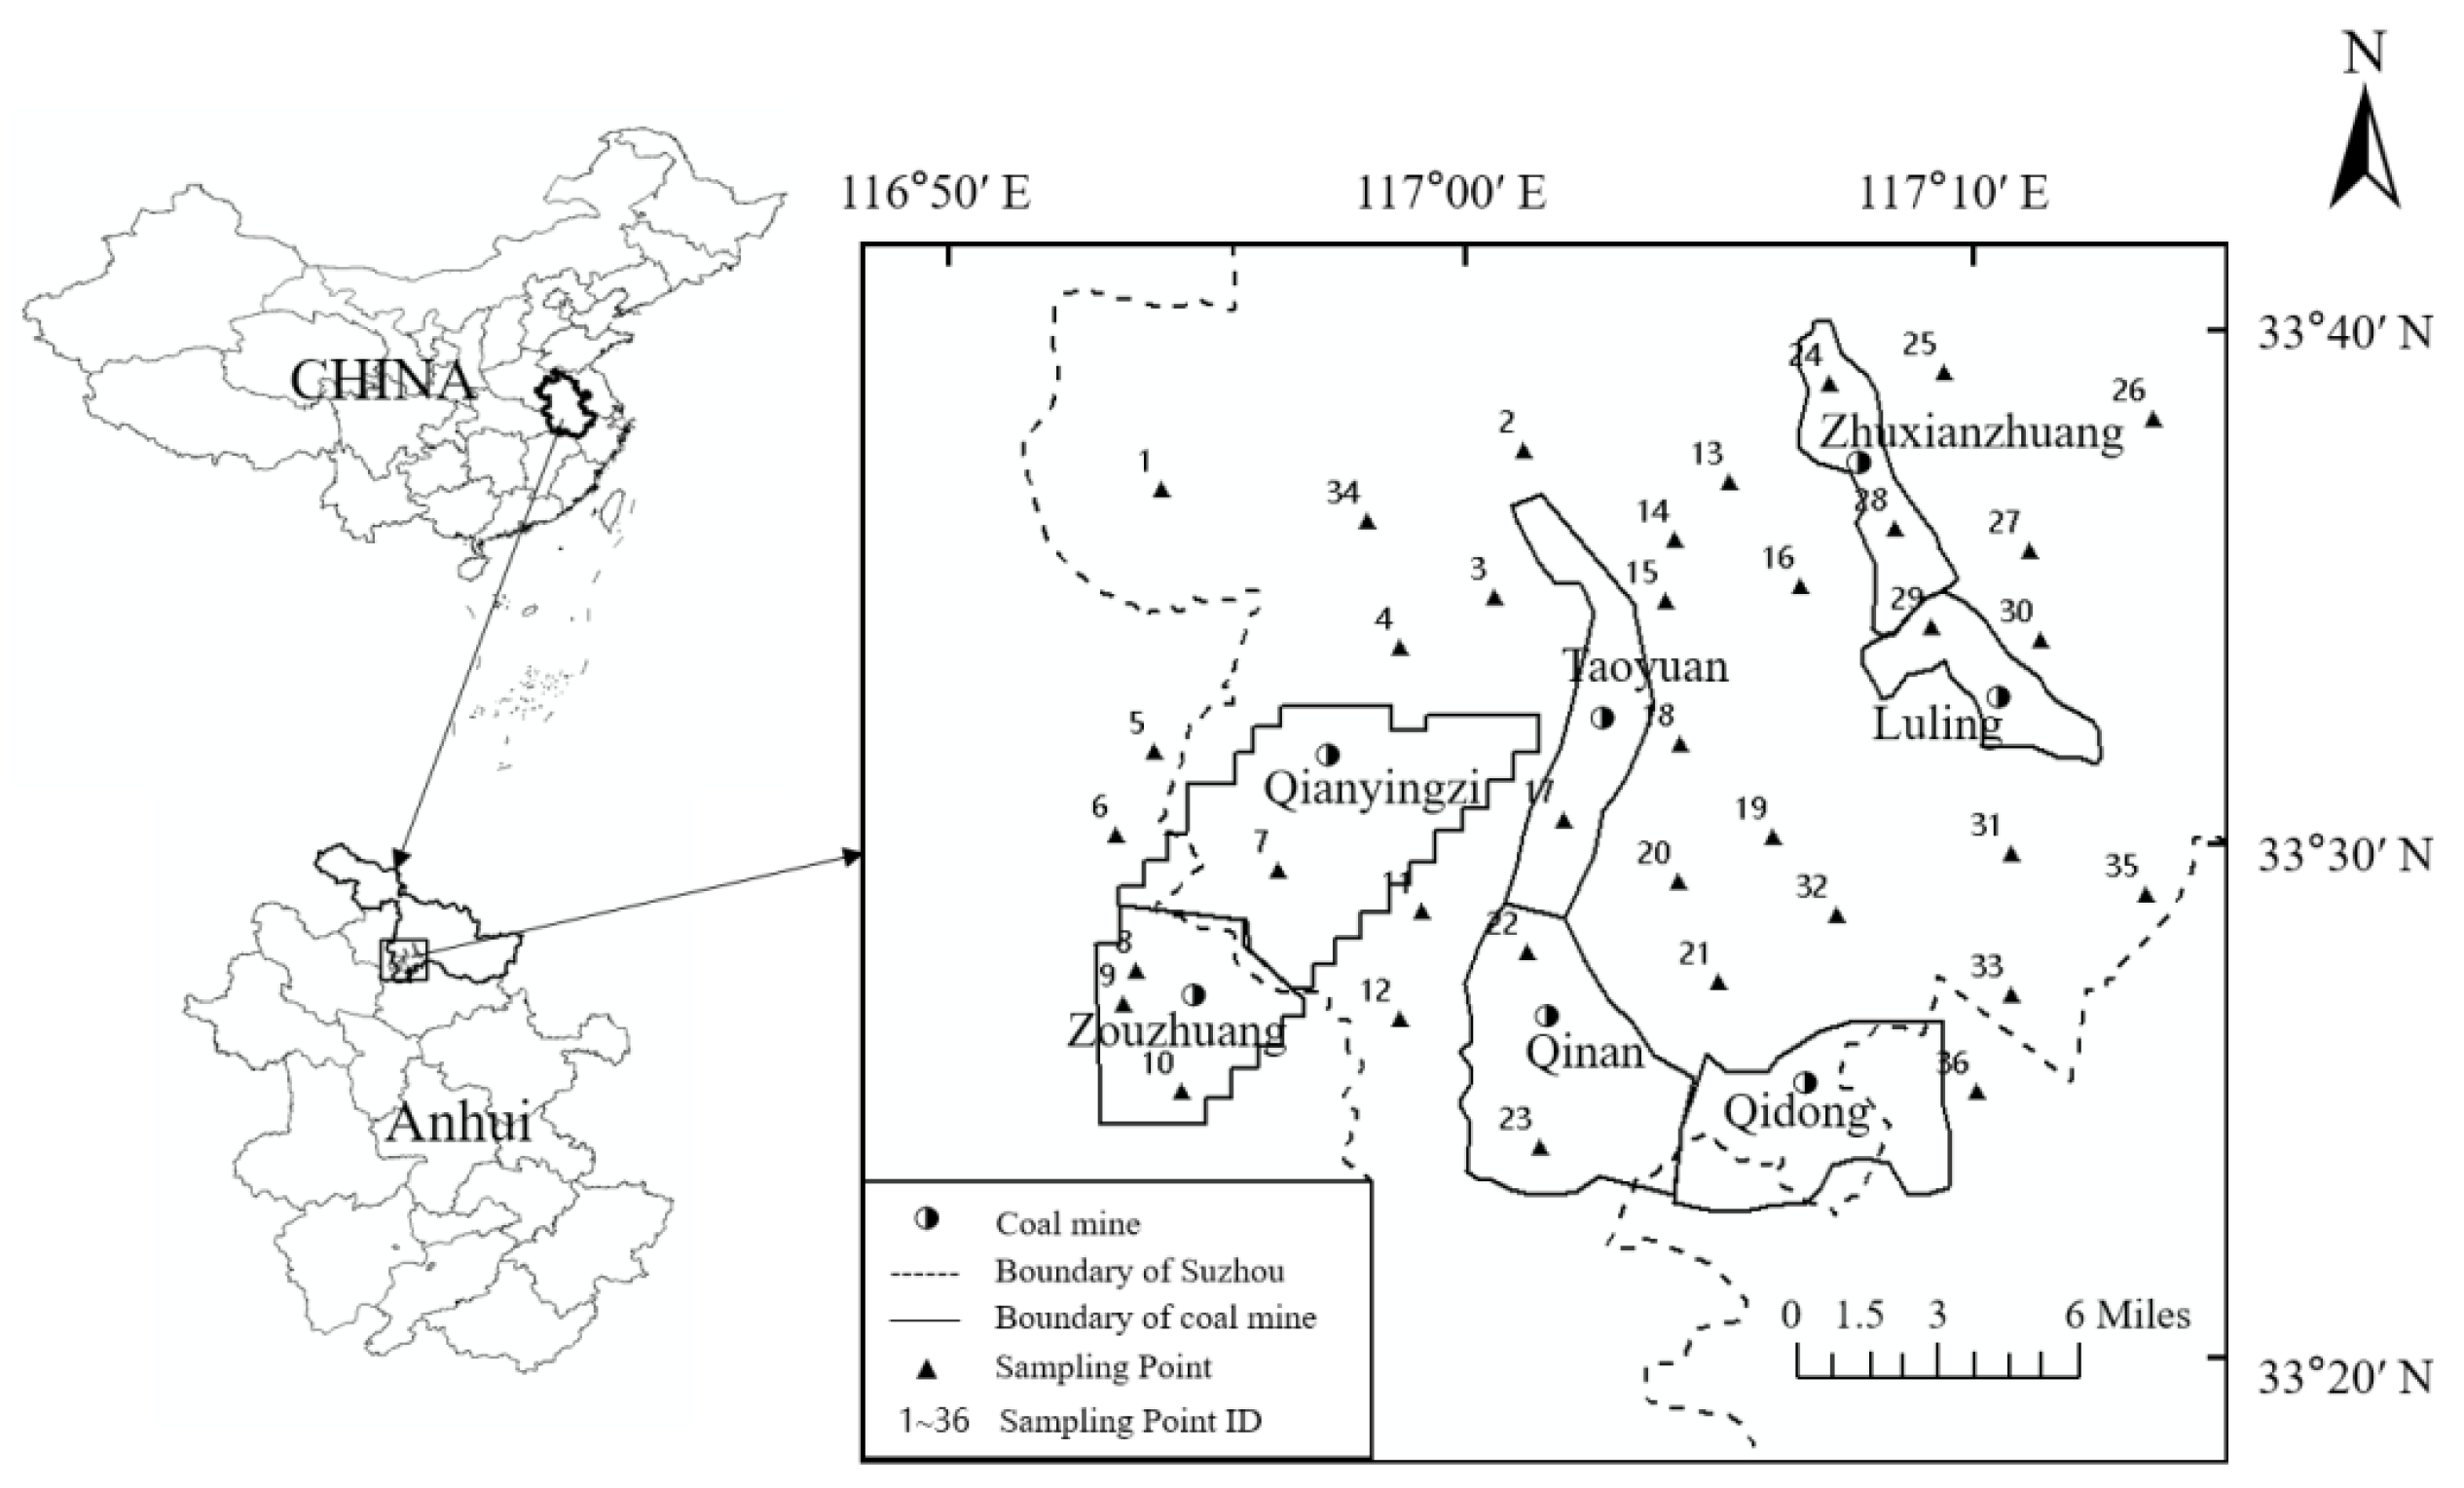
2.1. Research Area
2.2. Sample Collection and Analysis
2.3. Groundwater Quality Index
2.4. Human Health Risk
3. Results and Discussion
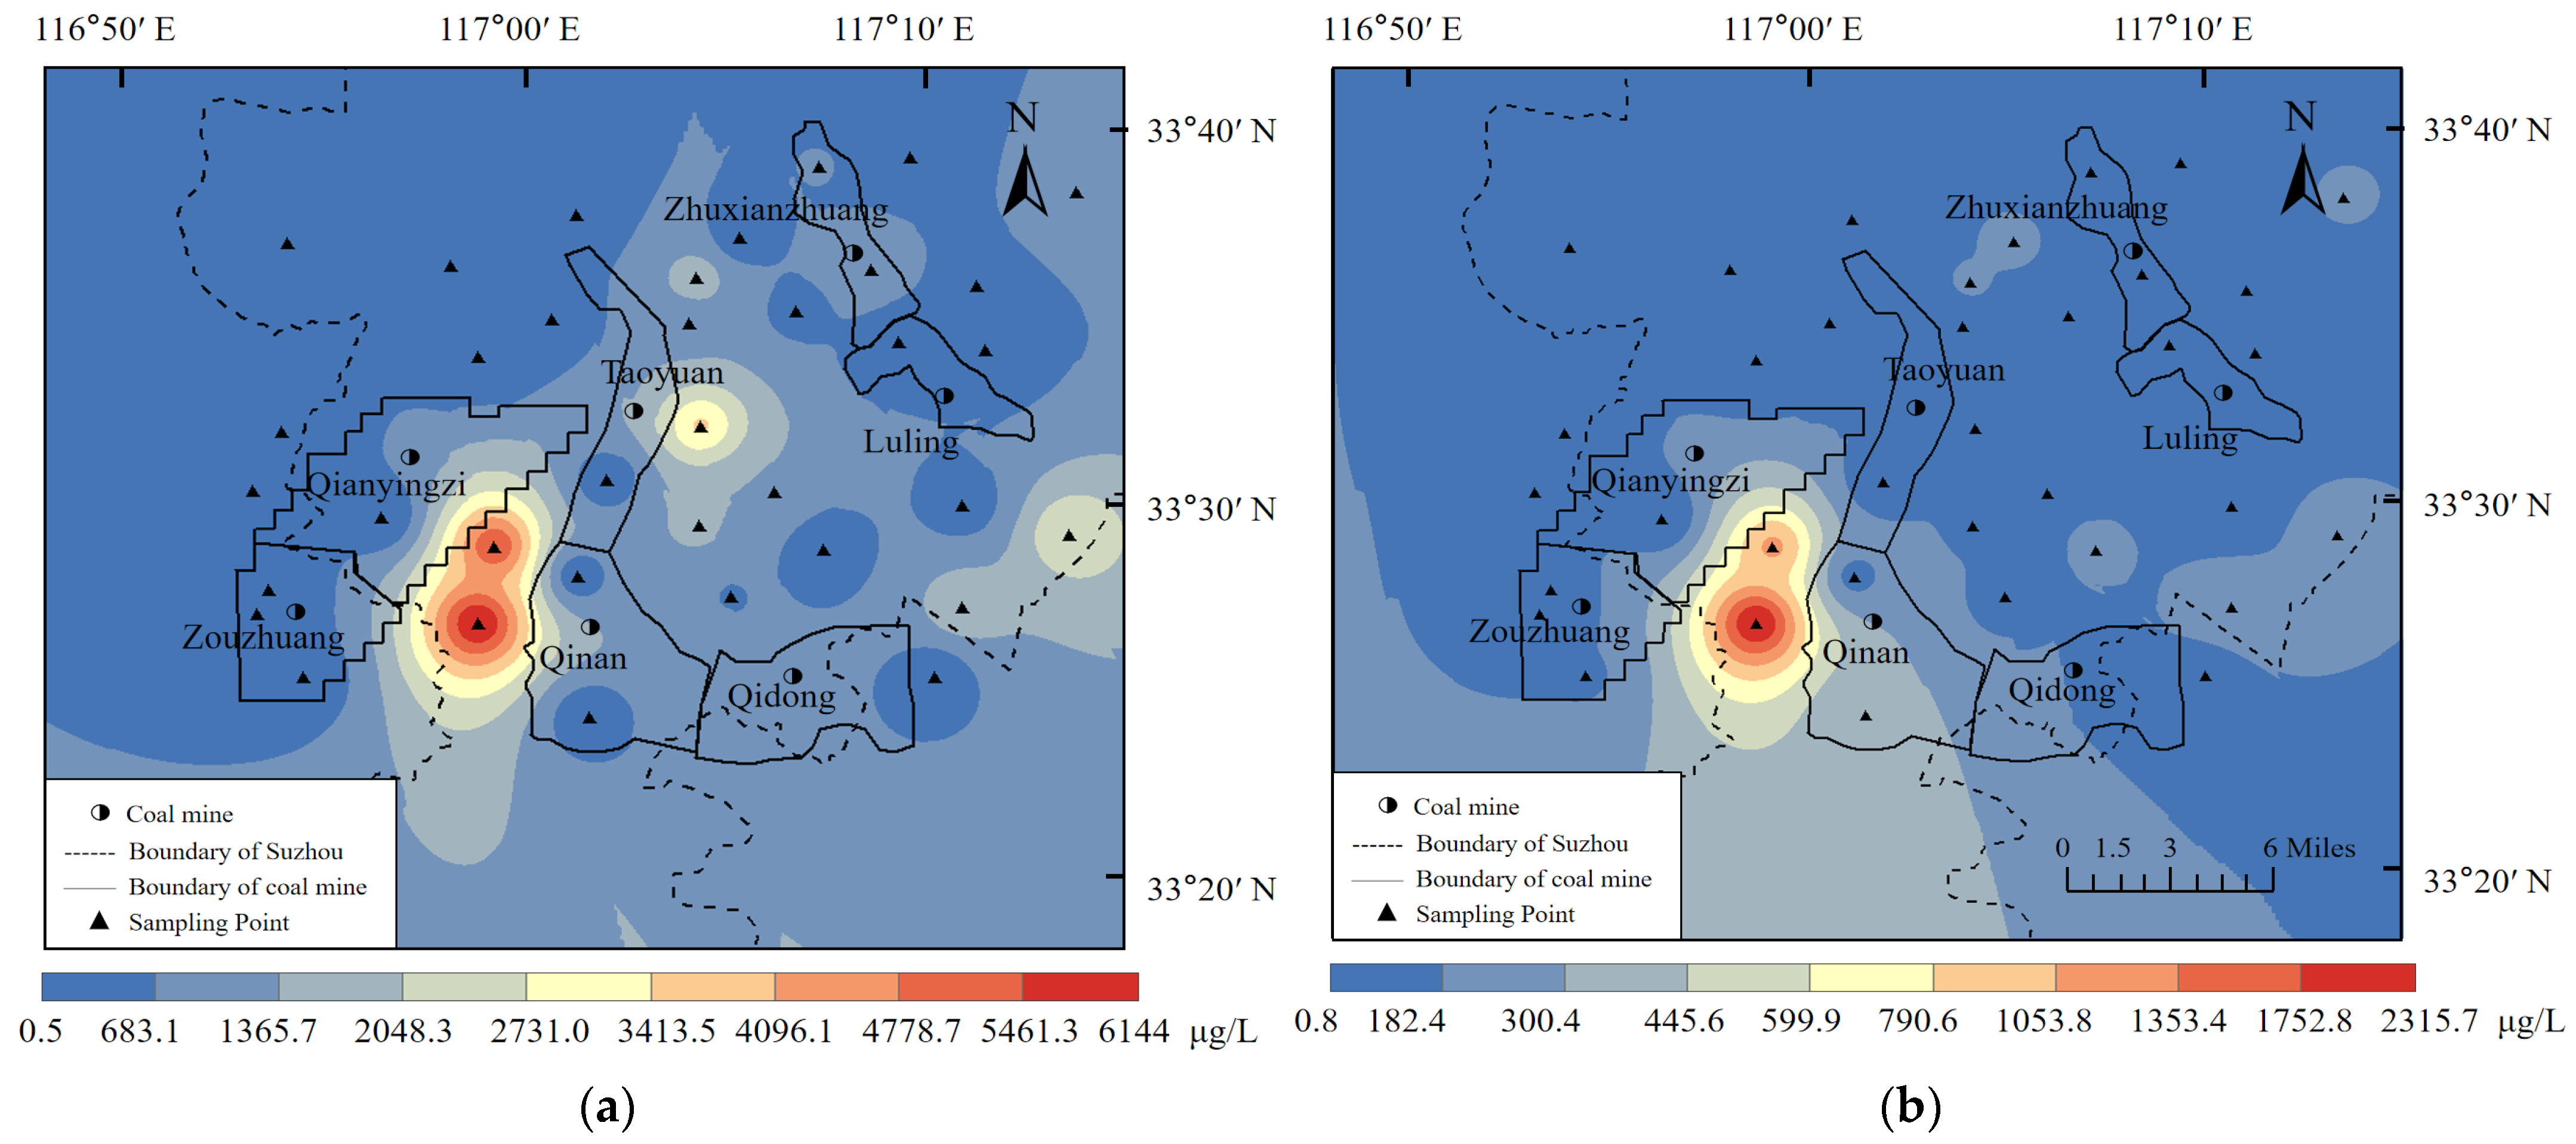
3.1. Environmental Quality Research
3.1.1. Single-Factor Evaluation
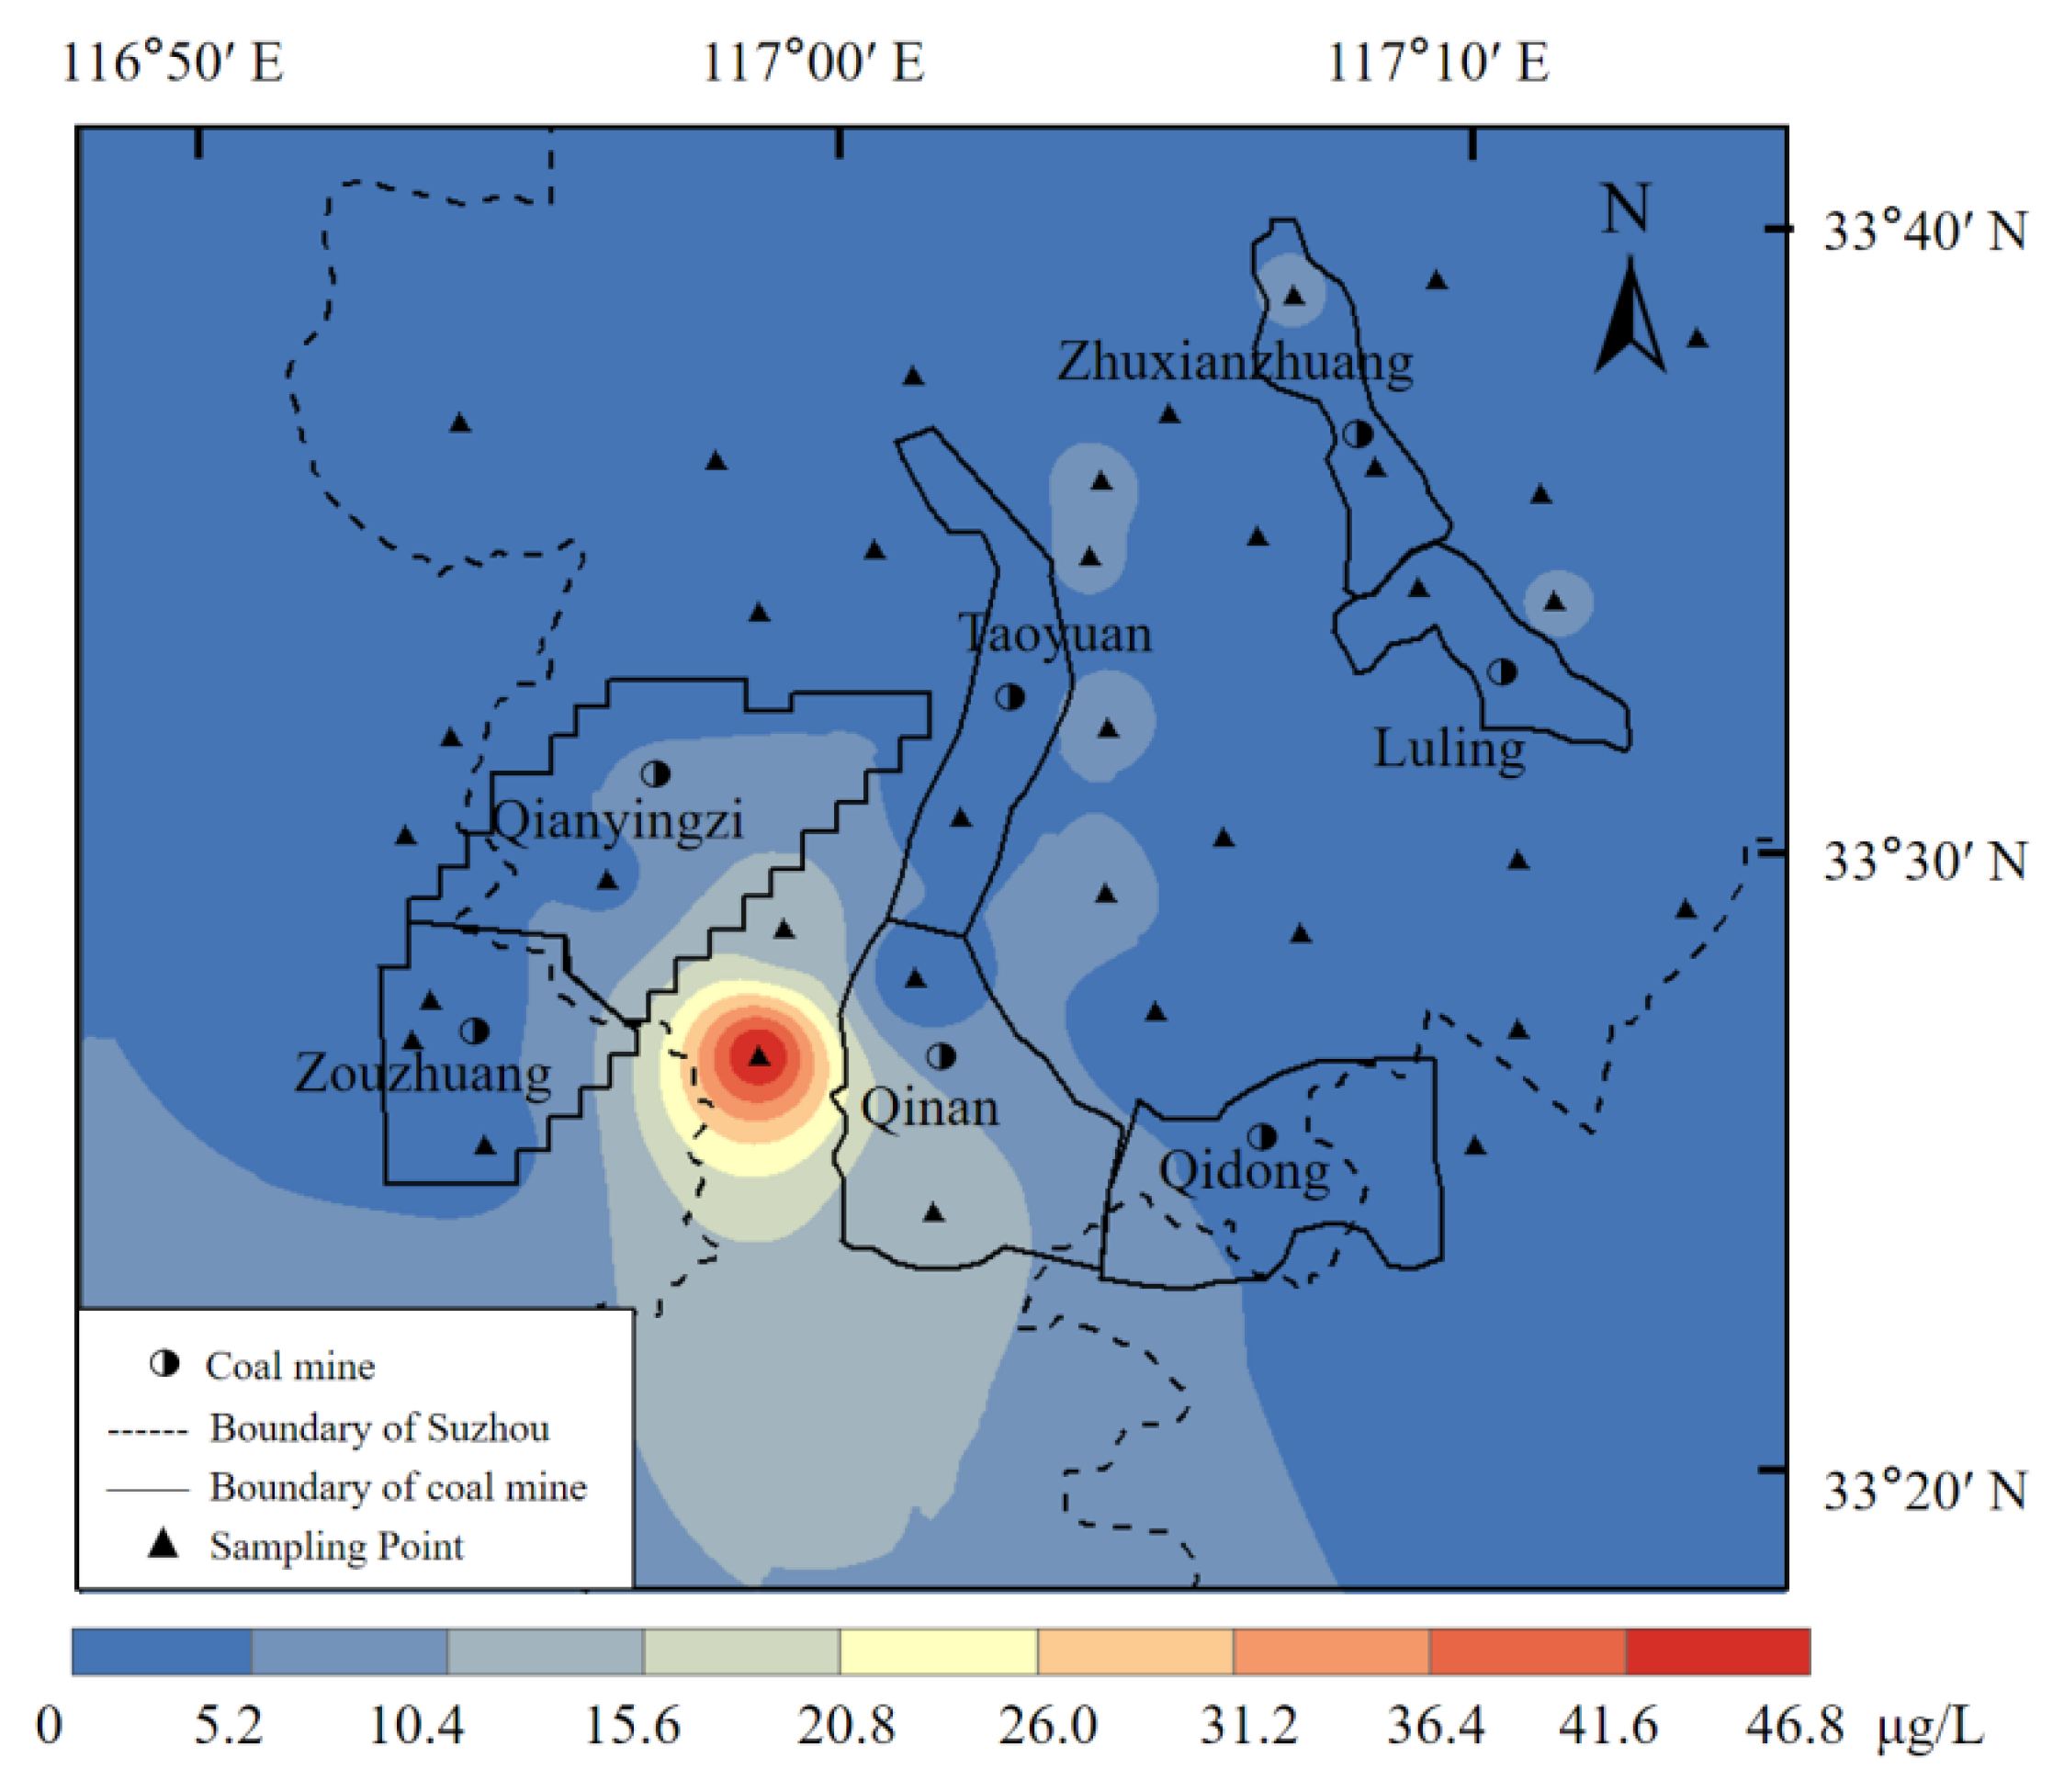
3.1.2. Comprehensive Evaluation
3.2. Human Health Risk Analysis
3.2.1. Non-Carcinogenic Health Risk
3.2.2. Carcinogenic Health Risks
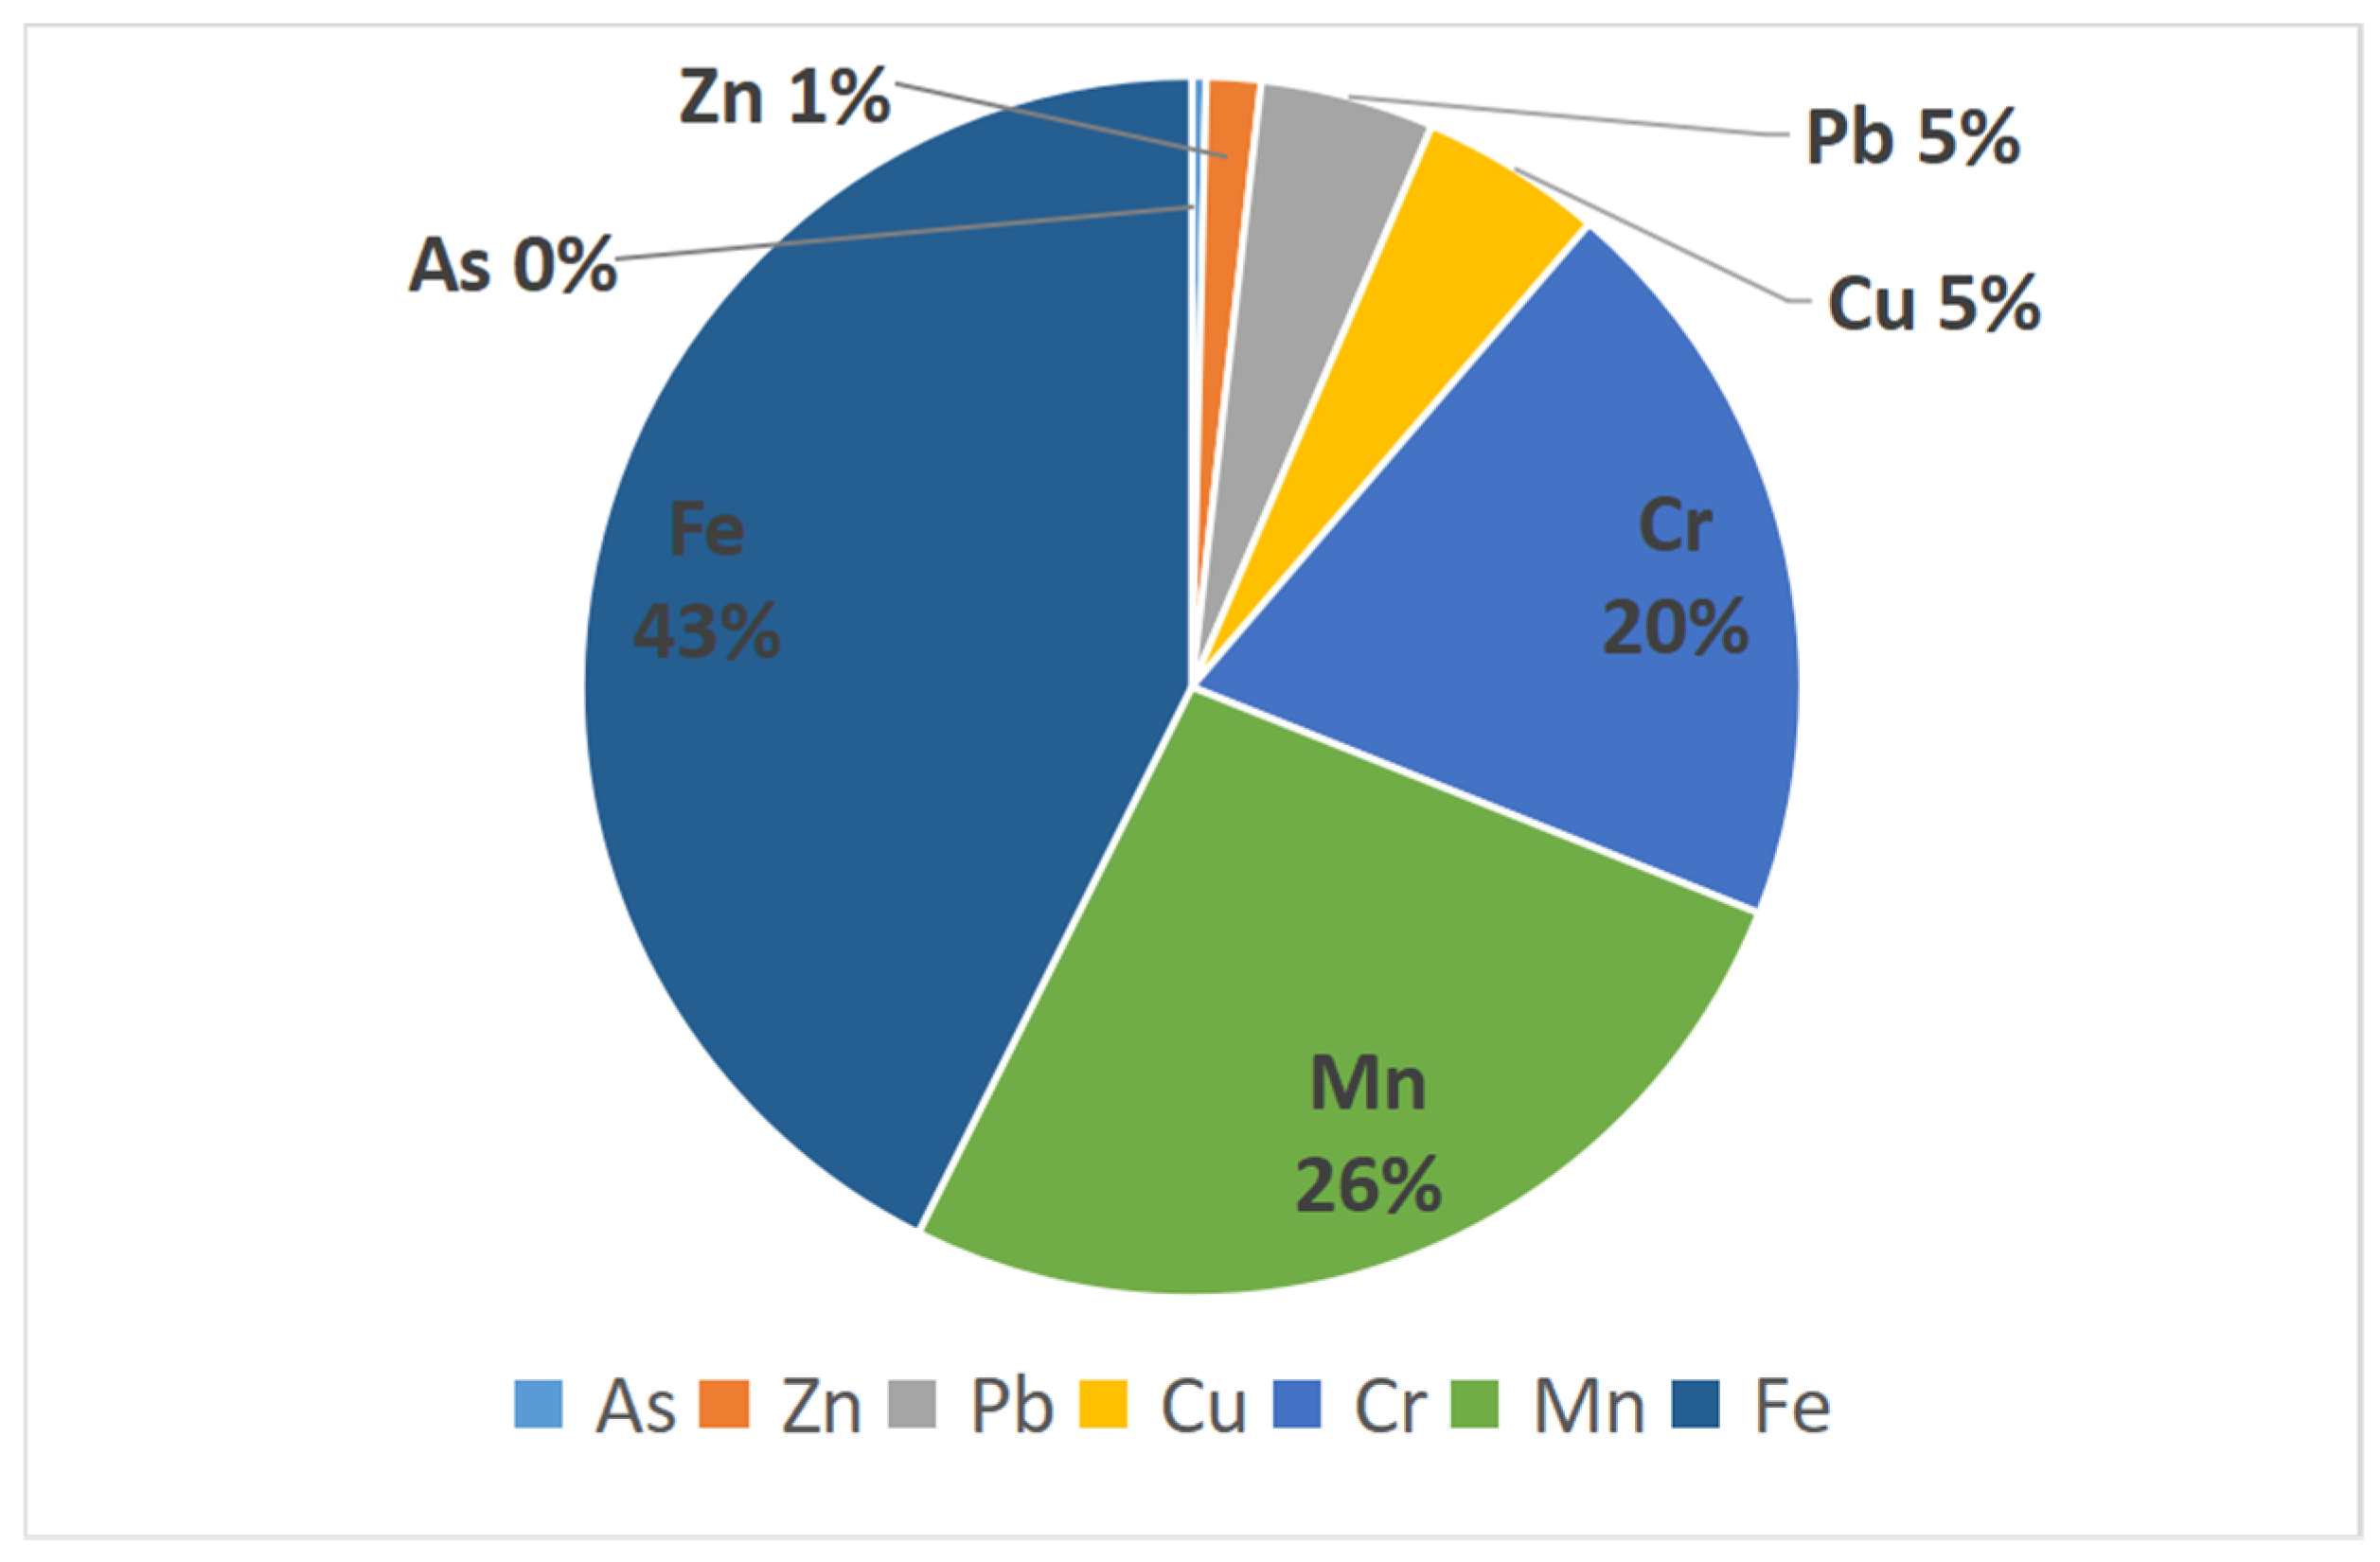
3.2.3. Total Health Risk
4. Conclusions
Author Contributions
Funding
Institutional Review Board Statement
Informed Consent Statement
Data Availability Statement
Conflicts of Interest
References
- Chen, Z.; Xu, J.; Duan, R.; Lu, S.; Hou, Z.; Yang, F.; Peng, M.; Zong, Q.; Shi, Z.; Yu, L. Ecological Health Risk Assessment and Source Identification of Heavy Metals in Surface Soil Based on a High Geochemical Background: A Case Study in Southwest China. Toxics 2022, 10, 282. [Google Scholar] [CrossRef]
- Duan, B.; Feng, Q. Comparison of the Potential Ecological and Human Health Risks of Heavy Metals from Sewage Sludge and Livestock Manure for Agricultural Use. Toxics 2021, 9, 145. [Google Scholar] [CrossRef] [PubMed]
- Sultana, S.; Hossain, M.B.; Choudhury, T.R.; Yu, J.; Rana, M.S.; Noman, M.A.; Hosen, M.M.; Paray, B.A.; Arai, T. Ecological and Human Health Risk Assessment of Heavy Metals in Cultured Shrimp and Aquaculture Sludge. Toxics 2022, 10, 175. [Google Scholar] [CrossRef] [PubMed]
- Nkpaa, K.W.; Amadi, B.A.; Wegwu, M.O. Hazardous metals levels in groundwater from Gokana, Rivers State, Nigeria: Non-cancer and cancer health risk assessment. Hum. Ecol. Risk Assess. 2018, 24, 214–224. [Google Scholar] [CrossRef]
- Mitchell, E.; Frisbie, S.; Sarkar, B. Exposure to multiple metals from groundwater—A global crisis: Geology, climate change, health effects, testing, and mitigation. Metallomics 2011, 3, 874–908. [Google Scholar] [CrossRef]
- Senoro, D.B.; de Jesus, K.L.M.; Nolos, R.C.; Lamac, M.R.L.; Deseo, K.M.; Tabelin, C.B. In Situ Measurements of Domestic Water Quality and Health Risks by Elevated Concentration of Heavy Metals and Metalloids Using Monte Carlo and MLGI Methods. Toxics 2022, 10, 342. [Google Scholar] [CrossRef]
- Jain, C.K.; Sharma, S.K.; Singh, S. Physico-chemical characteristics and hydrogeological mechanisms in groundwater with special reference to arsenic contamination in Barpeta District, Assam (India). Environ. Monit. Assess. 2018, 190, 417. [Google Scholar] [CrossRef] [PubMed]
- Fryar, A.E.; Schreiber, M.E.; Pholkern, K.; Srisuk, K.; Ziegler, B.A. Variability in groundwater flow and chemistry in the Mekong River alluvial aquifer (Thailand): Implications for arsenic and manganese occurrence. Environ. Earth Sci. 2021, 80, 225. [Google Scholar] [CrossRef]
- Coomar, P.; Mukherjee, A.; Bhattacharya, P.; Bundschuh, J.; Verma, S.; Fryar, A.E.; Ramos, O.E.R.; Muñoz, M.O.; Gupta, S.; Mahanta, C.; et al. Contrasting controls on hydrogeochemistry of arsenic-enriched groundwater in the homologous tectonic settings of Andean and Himalayan basin aquifers, Latin America and South Asia. Sci. Total Environ. 2019, 689, 1370–1387. [Google Scholar] [CrossRef]
- Johannesson, K.H.; Yang, N.; Trahan, A.S.; Telfeyan, K.; Mohajerin, T.J.; Adebayo, S.B.; Akintomide, O.A.; Chevis, D.A.; Datta, S.; White, C.D. Biogeochemical and reactive transport modeling of arsenic in groundwaters from the Mississippi River delta plain: An analog for the As-affected aquifers of South and Southeast Asia. Geochim. Cosmochim. Acta 2019, 264, 245–272. [Google Scholar] [CrossRef]
- Mushtaq, N.; Masood, N.; Khattak, J.A.; Hussain, I.; Khan, Q.; Farooqi, A. Health risk assessment and source identification of groundwater arsenic contamination using agglomerative hierarchical cluster analysis in selected sites from upper Eastern parts of Punjab province, Pakistan. Hum. Ecol. Risk Assess. 2020, 27, 999–1018. [Google Scholar] [CrossRef]
- Waqas, H.; Shan, A.; Khan, Y.G.; Nawaz, R.; Rizwan, M.; Rehman, M.S.-U.; Shakoor, M.B.; Ahmed, W.; Jabeen, M. Human health risk assessment of arsenic in groundwater aquifers of Lahore, Pakistan. Hum. Ecol. Risk Assess. 2017, 23, 836–850. [Google Scholar] [CrossRef]
- Sushant, K.S.; Ashok, K.G. Health Risk Assessment Due to Groundwater Arsenic Contamination: Children Are at High Risk. Hum. Ecol. Risk Assess. 2012, 18, 751–766. [Google Scholar]
- Quievryu, G.; Messer, J.; Zhitkovich, A. Carcinogenic chromium(VI)induces cross linking of vitamin C to DNA in vitro and in human lung A549 cells. Biochemistry 2002, 41, 3156–3167. [Google Scholar] [CrossRef]
- Jedrychowski, W.; Perera, F.; Jankowski, J.; Mrozek-Budzyn, D.; Mroz, E.; Flak, E.; Edwards, S.; Skarupa, A.; Lisowska-Miszczyk, I. Gender specific differences in neurodevelopmental effects of prenatal exposure to very low-lead levels: The prospective cohort study in three-year olds. Early Hum. Dev. 2009, 85, 503–510. [Google Scholar] [CrossRef] [Green Version]
- Gundacker, C.; Wittmann, K.J.; Kukuckova, M.; Komarnicki, G.; Hikkel, I.; Gencik, M. Genetic background of lead and mercury metabolism in a group of medical students in Austria. Environ. Res. 2009, 109, 786–796. [Google Scholar] [CrossRef] [PubMed]
- USEPA (US Environmental Protection Agency). Baseline Human Health Risk assessment, Vasquez Boulevard and I-70 Superfund Site; U.S. Public Health Service: Denver, CO, USA, 2001. [Google Scholar]
- WHO. Guidelines for Drinking-Water Quality, First Addendum to Third Edition. Volume 1: Recommendations. 2006. Available online: http://www.who.int/water_sanitation_health/dwq/gdwq0506.pdf (accessed on 5 March 2021).
- Qiu, H.; Gui, H. Heavy metals contamination in shallow groundwater of a coal-mining district and a probabilistic assessment of its human health risk. Hum. Ecol. Risk Assess. Int. J. 2019, 25, 548–563. [Google Scholar] [CrossRef]
- Li, R.; Zhang, Y.; Chu, W.; Deng, Z.; Chen, Z.; Tian, D. Natural Mineral for Remediation of Ironand Manganese-Contaminated Groundwaters. Pol. J. Environ. Stud. 2021, 30, 2161–2171. [Google Scholar] [CrossRef]
- Calderon, R.L. The epidemiology of chemical contami-nants of drinking water. Food Chem. Toxicol. 2000, 38, S13–S20. [Google Scholar] [CrossRef] [Green Version]
- Jareda, G.; Mahapatra, S.; Dhekne, P. Water quality index, heavy metal pollution index and seasonal variation correlation of groundwater of Bailadila iron ore mine area and its peripherals: Dantewada district, Chhattisgarh, India. Desalin. Water Treat. 2018, 101, 7–16. [Google Scholar] [CrossRef]
- Chotpantarat, S.; Wongsasuluk, P.; Siriwong, W.; Borjan, M.; Robson, M. Non-Carcinogenic Hazard Maps of Heavy Metal Contamination in Shallow Groundwater for Adult and Aging Populations at an Agricultural Area in Northeastern Thailand. Hum. Ecol. Risk Assess. 2014, 20, 689–703. [Google Scholar] [CrossRef]
- Chen, D.; Feng, Q.; Liang, H.; Gao, B.; Alam, E. Distribution characteristics and ecological risk assessment of polycyclic aromatic hydrocarbons (PAHs) in underground coal mining environment of Xuzhou. Hum. Ecol. Risk Assess. 2018, 25, 1564–1578. [Google Scholar] [CrossRef]
- Wu, Y. Coal Resources Distribution and Its Influence on Industrial Development and Underground Water in UK. J. Coast. Res. 2019, 93, 97–101. [Google Scholar] [CrossRef]
- Shafer, M.M.; Toner, B.M.; Overdier, J.T.; Schauer, J.J.; Fakra, S.C.; Hu, S.; Herner, J.D.; Ayala, A. Chemical Speciation of Vanadium in Particulate Matter Emitted from Diesel Vehicles and Urban Atmospheric Aerosols. Environ. Sci. Technol. 2011, 46, 189–195. [Google Scholar] [CrossRef]
- Li, P.; Wu, J.; Tian, R.; He, S.; He, X.; Xue, C.; Zhang, K. Geochemistry, Hydraulic Connectivity and Quality Appraisal of Multilayered Groundwater in the Hongdunzi Coal Mine, Northwest China. Mine Water Environ. 2018, 37, 222–237. [Google Scholar] [CrossRef]
- Mester, T.; Szabó, G.; Sajtos, Z.; Baranyai, E.; Szabó, G.; Balla, D. Environmental Hazards of an Unrecultivated Liquid Waste Disposal Site on Soil and Groundwater. Water 2022, 14, 226. [Google Scholar] [CrossRef]
- Wang, Y.; Fu, K.; Zhang, H.; He, G.; Zhao, R.; Yang, C. A GIS-based analysis of intrinsic vulnerability, pollution load, and function value for the assessment of groundwater pollution and health risk. Hum. Ecol. Risk Assess. 2021, 28, 1–21. [Google Scholar] [CrossRef]
- Barzegar, R.; Moghaddam, A.A.; Adamowski, J.; Nazemi, A.H. Assessing the potential origins and human health risks of trace elements in groundwater: A case study in the Khoy plain, Iran. Environ. Geochem. Health 2018, 41, 981–1002. [Google Scholar] [CrossRef]
- Ağca, N.; Karanlik, S.; Ödemiş, B. Assessment of ammonium, nitrate, phosphate, and heavy metal pollution in groundwater from Amik Plain, southern Turkey. Environ. Monit. Assess. 2014, 186, 5921–5934. [Google Scholar] [CrossRef]
- Shyam, R.; Kalwania, G.S. Health risk assessment of fluoride with other parameters in ground water of Sikar city (India). Environ. Earth Sci. 2011, 65, 1275–1282. [Google Scholar] [CrossRef]
- Wongsanit, J.; Teartisup, P.; Kerdsueb, P.; Tharnpoophasiam, P.; Worakhunpiset, S. Contamination of nitrate in groundwater and its potential human health: A case study of lower Mae Klong river basin, Thailand. Environ. Sci. Pollut. Res. 2015, 22, 11504–11512. [Google Scholar] [CrossRef] [PubMed]
- Fan, W.; Zhou, J.L.; Zhou, Y.H.; Zeng, Y.Y.; Chen, Y.F.; Sun, Y. Water quality and health risk assessment of shallow groundwater in the southern margin of the Tarim Basin in Xinjiang, P.R. China. Hum. Ecol. Risk Assess. 2021, 27, 483–503. [Google Scholar] [CrossRef]
- Zuo, R.; Meng, L.; Wang, B.; Wang, J.; Ding, F.; Guo, X.; Jin, S.; Teng, Y. Pollution risk assessment based on source apportionment in a groundwater resource area, NE China. Hum. Ecol. Risk Assess. 2018, 24, 1197–1215. [Google Scholar] [CrossRef]
- Mirzabeygi, M.; Abbasnia, A.; Yunesian, M.; Nodehi, R.N.; Yousefi, N.; Hadi, M.; Mahvi, A.H. Heavy metal contamination and health risk assessment in drinking water of Sistan and Baluchistan, Southeastern Iran. Hum. Ecol. Risk Assess. 2017, 23, 1893–1905. [Google Scholar] [CrossRef]
- Naz, A.; Chowdhury, A.; Mishra, B.K.; Gupta, S.K. Metal pollution in water environment and the associated human health risk from drinking water: A case study of Sukinda chromite mine, India. Hum. Ecol. Risk Assess. 2016, 22, 1433–1455. [Google Scholar] [CrossRef]
- Huang, D.W.; Gui, H.R.; Lin, M.L.; Peng, W.H. Accumulation Characteristics and Health Risk of Heavy Metals in Soil and Plant:A Case Study From Huaibei Coalfield, China. Fresenius Environ. Bull. 2017, 26, 631–639. [Google Scholar]
- Togawa, K.; Le Cornet, C.; Feychting, M. Parental occupational exposure to heavy metals and welding fumes and risk of testicular germ cell tumors in offspring: A registry-based case-control study. Cancer Epidemiol. Biomark. Prev. 2016, 25, 1426–1434. [Google Scholar] [CrossRef] [Green Version]
- Weller, M.M.D.C.A.; Fortes, M.; Marcondes, M.; Rotta, P.; Gionbeli, T.; Filho, S.V.; Campos, M.; Silva, F.; Silva, W.; Moore, S.; et al. Effect of maternal nutrition and days of gestation on pituitary gland and gonadal gene expression in cattle. J. Dairy Sci. 2016, 99, 3056–3071. [Google Scholar] [CrossRef] [Green Version]
- Qiu, H.L.; Gui, H.R.; Gui, L. Hydrogeochemical characteristice and water quality assessment of shallow groundwater a case study from Linhuan coal-mining district in northern Anhui Province, China. Water Sci. Technol. Water Supply 2019, 19, 1572–1578. [Google Scholar] [CrossRef]
- China Ministry of Environmental Protection. Water Quality-Determination of 65 Elements-Inductively Coupled Plasma-Mass Spectrometry. 2014. Available online: https://www.mee.gov.cn/ (accessed on 1 June 2021).
- Pervez, S.; Dugga, P.; Siddiqui, M.N.; Bano, S.; Verma, M.; Candeias, C.; Mishra, A.; Verma, S.R.; Tamrakar, A.; Karbhal, I.; et al. Sources and health risk assessment of potentially toxic elements in groundwater in the mineral-rich tribal belt of Bastar, Central India. Groundw. Sustain. Dev. 2021, 14, 100628. [Google Scholar] [CrossRef]
- SAC (Standardization Administration of the People’s Republic of China). Standard for Groundwater Quality, China. 2017. Available online: http://www.mwr.gov.cn/ (accessed on 5 May 2021).
- IRIS (Integrated Risk Information System). US Environmental Protection Agency. Cincinnati, OH, USA. 2005. Available online: http://www.epa.gov/iris (accessed on 5 May 2021).
- Zhao, W.D.; Zhao, L.; Gong, J.S. Pollution assessment and source apportionment of shallow groundwater in Suzhou mining area, China. Earth Sci. Front. 2021, 28, 001–004. [Google Scholar]
- Huang, Z.N.; Tang, Y.K.; Zhang, K.X.; Chen, Y.H.; Wang, Y.; Kong, L.M.; You, T.Y.; Gu, Z.Q. Environmental risk assessment of manganese and its associated heavy metals in a stream impacted by manganese mining in South China. Hum. Ecol. Risk Assess. 2016, 22, 1341–1358. [Google Scholar] [CrossRef]
- Yi, F.H.; Chen, L.; Yan, F. The health risk weighting model in groundwater quality evaluation. Hum. Ecol. Risk Assess. 2019, 25, 2089–2097. [Google Scholar] [CrossRef]
- Xu, Z.G.; Ding, Y.; Huang, H.M.; Wu, L.; Zhao, Y.L.; Yang, G.Y. Biosorption Characteristics of Mn (II) by Bacillus cereus Strain HM-5 Isolated from Soil Contaminated by Manganese Ore. Pol. J. Environ. Stud. 2019, 28, 463–472. [Google Scholar]
- Bartsakoulia, M.; Pyle, A.; Troncoso-Chandía, D.; Vial-Brizzi, J.; Paz-Fiblas, M.V.; Duff, J.; Griffin, H.; Boczonadi, V.; Lochmüller, H.; Kleinle, S.; et al. A novel mechanism causing imbalance of mitochondrial fusion and fission in human myopathies. Hum. Mol. Genet. 2018, 27, 1186–1195. [Google Scholar] [CrossRef] [Green Version]
- WHO; Food and Agriculture Organization. Joint WHO/FAO Expert Consultation on Diet, Nutrition and the Prevention of Chronic Diseases; World Health Organization: Geneva, Switzerland, 2003. [Google Scholar]
- Farina, M.; Avila, D.S.; da Rocha, J.B.T.; Aschner, M. Metals, oxidative stress and neurodegeneration: A focus on iron, manganese and mercury. Neurochem. Int. 2012, 62, 575–594. [Google Scholar] [CrossRef] [PubMed] [Green Version]
- Kell, D.B. Towards a unifying, systems biology understanding of large-scale cellular death and destruction caused by poorly liganded iron: Parkinson’s, Huntington’s, Alzheimer’s, prions, bactericides, chemical toxicology and others as examples. Arch. Toxicol. 2010, 84, 825–889. [Google Scholar] [CrossRef] [PubMed] [Green Version]
- Sel, S.; Erulas, F.A.; Turak, F. Simultaneous Determination of Chromium Species in Water and Plant Samples at Trace Levels by Ion Chromatography–Inductively Coupled Plasma-Mass Spectrometry. Anal. Lett. 2019, 52, 761–771. [Google Scholar] [CrossRef]
- Zhang, Z.; Xiao, C.; Adeyeye, O.; Yang, W.; Liang, X. Source and Mobilization Mechanism of Iron, Manganese and Arsenic in Groundwater of Shuangliao City, Northeast China. Water 2020, 12, 534. [Google Scholar] [CrossRef] [Green Version]
- Khozyem, H.; Hamdan, A.; Tantawy, A.A.; Emam, A.; Elbadry, E. Distribution and origin of iron and manganese in groundwater: Case study, Balat-Teneida area, El-Dakhla Basin, Egypt. Arab. J. Geosci. 2019, 12, 523. [Google Scholar] [CrossRef]
- Samal, P.; Mohanty, A.K.; Khaoash, S.; Mishra, P.; Ramaswamy, K. Health risk assessment and hydrogeochemical modelling of groundwater due to heavy metals contaminants at Basundhara coal mining region, India. Int. J. Environ. Anal. Chem. 2022, 1–20. [Google Scholar] [CrossRef]
- Ayub, A.; Ahmad, S. Seasonal Assessment of Groundwater Contamination in Coal Mining Areas of Balochistan. Sustainability 2020, 12, 6889. [Google Scholar] [CrossRef]
- Qiu, H.; Gui, H.; Fang, P.; Li, G. Groundwater pollution and human health risk based on Monte Carlo simulation in a typical mining area in Northern Anhui Province, China. Int. J. Coal Sci. Technol. 2021, 8, 1118–1129. [Google Scholar] [CrossRef]
- Wu, J.; Zhou, H.; He, S.; Zhang, Y. Comprehensive understanding of groundwater quality for domestic and agricultural purposes in terms of health risks in a coal mine area of the Ordos basin, north of the Chinese Loess Plateau. Environ. Earth Sci. 2019, 78, 446. [Google Scholar] [CrossRef]
- Shirkhanloo, H.; Ghazaghi, M.; Eskandari, M.M. Cloud point assisted dispersive ionic liquid -liquid microextraction for chromium speciation in human blood samples based on isopropyl 2-[(isopropoxycarbothiolyl)disulfanyl] ethane thioate. Anal. Chem. Res. 2016, 10, 18–27. [Google Scholar] [CrossRef] [Green Version]
- Ma, L.; Xu, J.; Chen, N.; Li, M.; Feng, C. Microbial reduction fate of chromium (Cr) in aqueous solution by mixed bacterial consortium. Ecotoxicol. Environ. Saf. 2018, 170, 763–770. [Google Scholar] [CrossRef]
- Shrivastava, H.Y.; Ravikumar, T.; Shanmugasundaram, N.; Babu, M.; Nair, B.U. Cytotoxicity studies of chromium(III) com-plexes on human dermal fibroblasts. Free Radical Biol. Med. 2005, 38, 58–69. [Google Scholar] [CrossRef]
- IARC (International Agency for Research on Cancer). Arsenic, Metals, Fibres and Dusts; IARC Monographs on the Evaluation of Carcinogenic Risks to Humans; WHO: Geneva, Switzerland, 2012. [Google Scholar]
- Tumolo, M.; Ancona, V.; De Paola, D.; Losacco, D.; Campanale, C.; Massarelli, C.; Uricchio, V.F. Chromium Pollution in European Water, Sources, Health Risk, and Remediation Strategies: An Overview. Int. J. Environ. Res. Public Health 2020, 17, 5438. [Google Scholar] [CrossRef]
- Al-Battashi, H.; Joshi, S.J.; Pracejus, B.; Al-Ansari, A. The Geomicrobiology of Chromium (VI) Pollution: Microbial Diversity and its Bioremediation Potential. Open Biotechnol. J. 2016, 10, 379–389. [Google Scholar] [CrossRef]
- Habib, M.A.; Islam, A.R.M.T.; Bodrud-Doza, M.; Mukta, F.A.; Khan, R.; Siddique, M.A.B.; Phoungthong, K.; Techato, K. Simultaneous appraisals of pathway and probable health risk associated with trace metals contamination in groundwater from Barapukuria coal basin, Bangladesh. Chemosphere 2020, 242, 125183. [Google Scholar] [CrossRef]
- Halim, M.A.; Majumder, R.K.; Zaman, M.N.; Hossain, S.; Rasul, M.G.; Sasaki, K. Mobility and impact of trace metals in Barapukuria coal mining area, Northwest Bangladesh. Arab. J. Geosci. 2012, 6, 4593–4605. [Google Scholar] [CrossRef]
- Singh, A.K.; Mahato, M.K.; Neogi, B.; Singh, K.K. Quality Assessment of Mine Water in the Raniganj Coalfield Area, India. Mine Water Environ. 2010, 29, 248–262. [Google Scholar] [CrossRef]
- Erarslan, C.; Orgün, Y.; Bozkurtoglu, E. Geochemistry of trace elements in the Kesan coal and its effect on the physicochemical features of ground- and surface waters in the coal fields, Edirne, Thrace Region, Turkey. Int. J. Coal Geol. 2014, 133, 1–12. [Google Scholar] [CrossRef]


| Sampling Point | Well Depth (m) | Cr | Cu | Fe | Mn | Pb | Zn | As |
|---|---|---|---|---|---|---|---|---|
| 1 | 36.7 | 3.70 | 1.82 | 13.00 | 154 | 0.52 | 11.03 | 0.80 |
| 2 | 32.0 | 2.30 | 0.13 | 38.73 | 149 | 0.25 | 8.83 | 0.50 |
| 3 | 30.7 | 0.20 | 0.27 | 121 | 61.88 | <LD | 3.69 | 0.90 |
| 4 | 33.0 | 0.40 | <LD | 15.92 | 0.50 | 0.23 | 12.92 | 0.80 |
| 5 | 45.0 | 1.40 | 0.37 | 3.40 | 5.60 | 0.48 | 8.98 | 0.50 |
| 6 | 40.0 | 3.92 | 3.52 | <LD | 221 | 0.60 | 6.95 | <LD |
| 7 | 33.0 | 4.33 | 0.60 | 2.10 | 9.00 | 0.44 | 7.35 | 0.40 |
| 8 | 30.0 | 0.30 | 0.36 | 176 | 202 | 0.17 | 8.33 | 0.90 |
| 9 | 15.0 | 3.57 | 1.22 | 69.66 | 6.49 | <LD | 8.84 | 0.50 |
| 10 | 40.0 | 3.81 | 0.68 | 199 | 228 | 0.19 | 4.83 | <LD |
| 11 | 9.0 | 12.53 | 21.38 | 5324 | 1600 | <LD | 56.85 | <LD |
| 12 | 45.1 | 46.88 | 1.48 | 6150 | 2318 | <LD | 29.45 | 2.50 |
| 13 | 47.9 | <LD | 11.77 | 273 | 320 | <LD | 31.63 | 1.10 |
| 14 | 27.0 | 6.70 | 0.44 | 1752 | 282 | 0.60 | <LD | <LD |
| 15 | 25.0 | 5.68 | 0.54 | 1113 | 186 | <LD | 499.30 | 0.70 |
| 16 | 6.2 | 3.20 | 1.05 | 409 | 137 | <LD | 10.47 | 0.80 |
| 17 | 10.0 | 2.10 | 0.16 | 135 | 39.29 | 0.20 | 12.25 | 0.40 |
| 18 | 7.6 | 6.33 | 0.68 | 3500 | 130 | 0.19 | 34.36 | 0.90 |
| 19 | 18.0 | 0.20 | 0.23 | 1335 | 252 | 0.21 | <LD | 0.40 |
| 20 | 23.5 | 8.73 | 0.53 | 1453 | 214 | 1.00 | 5.67 | 0.40 |
| 21 | 20.0 | 2.10 | 1.55 | 635 | 157 | 2.07 | 12.45 | <LD |
| 22 | 12.5 | 0.30 | 0.87 | 222 | 174 | 0.53 | 11.96 | <LD |
| 23 | 10.0 | 12.12 | 1.82 | 184 | 528 | <LD | 3.74 | 0.80 |
| 24 | 9.0 | 5.94 | 0.13 | 706 | 85.79 | <LD | 17.02 | 1.00 |
| 25 | 23.5 | 1.20 | 0.27 | 4.50 | 37.46 | 0.50 | 42.52 | 0.60 |
| 26 | 47.3 | 0.50 | 1.44 | 1328 | 290 | <LD | 174.50 | 0.60 |
| 27 | 24.2 | 0.80 | 1.14 | 414 | 105 | <LD | 10.19 | 0.90 |
| 28 | 45.0 | 3.55 | 1.61 | 1353 | 111 | 6.63 | 7.47 | <LD |
| 29 | 32.0 | 0.30 | 0.43 | 93.13 | 3.20 | <LD | 1.51 | 0.40 |
| 30 | 43.0 | 6.32 | 1.06 | 315 | 13.45 | 0.16 | 5.17 | 0.50 |
| 31 | 9.8 | 0.30 | 0.83 | 270 | 160 | 0.26 | 3.36 | 0.30 |
| 32 | 16.8 | <LD | 0.81 | 75.94 | 294 | 0.86 | 2.43 | 0.40 |
| 33 | 25.0 | <LD | 1.01 | 1887 | 383 | <LD | 5.16 | 0.80 |
| 34 | 18.2 | 3.62 | 1.96 | 674 | 181 | 0.17 | 12.45 | 0.50 |
| 35 | 32.2 | <LD | 0.59 | 2689 | 346 | 0.20 | 34.30 | <LD |
| 36 | 48.0 | 0.30 | 0.25 | 255 | 195 | 0.22 | 16.53 | 0.40 |
| Order Number | Class | Scope of Application |
|---|---|---|
| 1 | I class | Various uses |
| 2 | II class | Various uses |
| 3 | III class | Centralized domestic and drinking water sources, industrial and agricultural water use |
| 4 | IV class | Used for agriculture and in the industry, but can be used for drinking after appropriate treatment |
| 5 | V class | Choose according to the purpose of use |
| Water Quality Classification | Individual Component Score Values | The Nemerow Pollution Index, F | Water Quality Classification |
|---|---|---|---|
| I | 0 | <0.80 | Excellent |
| II | 1 | 0.80–2.50 | Good |
| III | 3 | 2.50–4.25 | Better |
| IV | 6 | 4.25–7.20 | Poor |
| V | 10 | >7.20 | Extremely Poor |
| Target Substance | RfD Value |
|---|---|
| Cr | 3.0 × 10⁻³ |
| Cu | 5 × 10⁻³ |
| Fe | 0.3 |
| Mn | 1.4 × 10⁻¹ |
| Pb | 1.4 × 10⁻³ |
| Zn | 3.0 × 10⁻¹ |
| As | 0.02 |
| Institution Name | Maximum Acceptable Level | Negligible Level | Remarks |
|---|---|---|---|
| The Swedish Environmental Protection Agency | 1.0 × 10⁻⁶ | - | Chemical pollutant |
| The Dutch Ministry of Construction and the Environment | 1.0 × 10⁻⁶ | 1.0 × 10⁻⁸ | Chemical pollutant |
| Royal Society | 1.0 × 10⁻⁶ | 1.0 × 10⁻⁷ | - |
| International Commission on Radiological Protection | 5.0 × 10⁻⁵ | - | Radiation |
| US Environmental Protection Agency | 1.0 × 10⁻⁴ | - | - |
| Index | Cr | Cu | Fe | Mn | Pb | Zn | As |
|---|---|---|---|---|---|---|---|
| Max | 46.88 | 21.38 | 6150 | 2318 | 6.63 | 499.30 | 2.50 |
| Min | <LD | <LD | <LD | 0.50 | <LD | <LD | <LD |
| Mean | 4.27 | 1.75 | 922 | 266 | 0.47 | 31.20 | 0.55 |
| Standard deviation | 8.01 | 3.89 | 1440 | 442 | 1.13 | 85.57 | 0.47 |
| Coefficient of variation (100%) | 1.87 | 2.22 | 1.56 | 1.66 | 2.43 | 2.74 | 0.85 |
| Index | Cr | Cu | Fe | Mn | Pb | Zn | As |
|---|---|---|---|---|---|---|---|
| Indices limit of groundwater quality classification (mg/L) [44] | ≤0.05 | ≤1.00 | ≤0.3 | ≤0.10 | ≤0.01 | ≤1.00 | ≤0.01 |
| Excess sampling point (Each) | 0 | 0 | 17 | 26 | 0 | 0 | 0 |
| Exceeding the standard (%) | 0 | 0 | 47 | 72 | 0 | 0 | 0 |
| Maximum excess multiple | 0.00 | 0.00 | 20.50 | 23.20 | 0.00 | 0.00 | 0.00 |
| Sample Point | F (Cr) | F (Cu) | F (Fe) | F (Mn) | F (Pb) | F (Zn) | F (As) | F | ||
|---|---|---|---|---|---|---|---|---|---|---|
| 1 | 0 | 0 | 0 | 3 | 0 | 0 | 0 | 3 | 0.75 | 2.19 |
| 2 | 0 | 0 | 0 | 3 | 0 | 0 | 0 | 3 | 0.75 | 2.19 |
| 3 | 0 | 0 | 1 | 1 | 0 | 0 | 0 | 1 | 0.38 | 0.76 |
| 4 | 0 | 0 | 0 | 0 | 0 | 0 | 0 | 0 | 0.00 | 0.00 |
| 5 | 0 | 0 | 0 | 0 | 0 | 0 | 0 | 0 | 0.00 | 0.00 |
| 6 | 0 | 0 | 0 | 3 | 0 | 0 | 0 | 3 | 0.75 | 2.19 |
| 7 | 0 | 0 | 0 | 0 | 0 | 0 | 0 | 0 | 0.00 | 0.00 |
| 8 | 0 | 0 | 1 | 3 | 0 | 0 | 0 | 3 | 0.88 | 2.21 |
| 9 | 0 | 0 | 0 | 0 | 0 | 0 | 0 | 0 | 0.00 | 0.00 |
| 10 | 0 | 0 | 1 | 3 | 0 | 0 | 0 | 3 | 0.88 | 2.21 |
| 11 | 3 | 1 | 10 | 10 | 0 | 1 | 0 | 10 | 4.38 | 7.72 |
| 12 | 3 | 0 | 10 | 10 | 0 | 0 | 1 | 10 | 4.25 | 7.68 |
| 13 | 0 | 1 | 3 | 3 | 0 | 0 | 1 | 3 | 1.38 | 2.33 |
| 14 | 1 | 0 | 6 | 3 | 0 | 0 | 0 | 6 | 2.00 | 4.47 |
| 15 | 1 | 0 | 6 | 3 | 0 | 1 | 0 | 6 | 2.13 | 4.50 |
| 16 | 0 | 0 | 6 | 3 | 0 | 0 | 0 | 6 | 1.88 | 4.44 |
| 17 | 0 | 0 | 1 | 0 | 0 | 0 | 0 | 1 | 0.25 | 0.73 |
| 18 | 1 | 0 | 10 | 3 | 0 | 0 | 0 | 10 | 3.00 | 7.38 |
| 19 | 0 | 0 | 6 | 3 | 0 | 0 | 0 | 6 | 1.88 | 4.44 |
| 20 | 1 | 0 | 6 | 3 | 0 | 0 | 0 | 6 | 2.00 | 4.47 |
| 21 | 0 | 0 | 6 | 3 | 0 | 0 | 0 | 6 | 1.88 | 4.44 |
| 22 | 0 | 0 | 3 | 3 | 0 | 0 | 0 | 3 | 1.13 | 2.27 |
| 23 | 3 | 0 | 1 | 3 | 0 | 0 | 0 | 3 | 1.25 | 2.30 |
| 24 | 1 | 0 | 6 | 1 | 0 | 0 | 1 | 6 | 1.88 | 4.44 |
| 25 | 0 | 0 | 0 | 0 | 0 | 0 | 0 | 0 | 0.00 | 0.00 |
| 26 | 0 | 0 | 6 | 3 | 0 | 1 | 0 | 6 | 2.00 | 4.47 |
| 27 | 0 | 0 | 6 | 3 | 0 | 0 | 0 | 6 | 1.88 | 4.44 |
| 28 | 0 | 0 | 6 | 3 | 3 | 0 | 0 | 6 | 2.25 | 4.53 |
| 29 | 0 | 0 | 0 | 0 | 0 | 0 | 0 | 0 | 0.00 | 0.00 |
| 30 | 1 | 0 | 6 | 0 | 0 | 0 | 0 | 6 | 1.63 | 4.40 |
| 31 | 0 | 0 | 3 | 3 | 0 | 0 | 0 | 3 | 1.13 | 2.27 |
| 32 | 0 | 0 | 0 | 3 | 0 | 0 | 0 | 3 | 0.75 | 2.19 |
| 33 | 0 | 0 | 6 | 3 | 0 | 0 | 0 | 6 | 1.88 | 4.44 |
| 34 | 0 | 0 | 6 | 3 | 0 | 0 | 0 | 6 | 1.88 | 4.44 |
| 35 | 0 | 0 | 10 | 3 | 0 | 0 | 0 | 10 | 2.88 | 7.36 |
| 36 | 0 | 0 | 3 | 3 | 0 | 0 | 0 | 3 | 1.13 | 2.27 |
| Sample Point | Non-Carcinogenic Risk | Carcinogenic Risk | Total Health Risk | |||||||
|---|---|---|---|---|---|---|---|---|---|---|
| Cr | Cu | Fe | Mn | Pb | Zn | As | Cr | As | ||
| 1 | 5.54 × 10⁻¹⁰ | 1.63 × 10⁻¹⁰ | 1.95 × 10⁻¹¹ | 4.95 × 10⁻¹⁰ | 1.67 × 10⁻¹⁰ | 1.65 × 10⁻¹¹ | 1.80 × 10⁻¹¹ | 6.79 × 10⁻⁵ | 5.39 × 10⁻⁶ | 7.33 × 10⁻⁵ |
| 2 | 3.44 × 10⁻¹⁰ | 1.17 × 10⁻¹¹ | 5.80 × 10⁻¹¹ | 4.77 × 10⁻¹⁰ | 8.02 × 10⁻¹¹ | 1.32 × 10⁻¹¹ | 1.12 × 10⁻¹¹ | 4.23 × 10⁻⁵ | 3.37 × 10⁻⁶ | 4.56 × 10⁻⁵ |
| 3 | 2.99 × 10⁻¹¹ | 2.42 × 10⁻¹¹ | 1.81 × 10⁻¹⁰ | 1.98 × 10⁻¹⁰ | 0 | 5.52 × 10⁻¹² | 2.02 × 10⁻¹¹ | 3.68 × 10⁻⁶ | 6.06 × 10⁻⁶ | 9.74 × 10⁻⁶ |
| 4 | 5.99 × 10⁻¹¹ | 0 | 2.38 × 10⁻¹¹ | 1.60 × 10⁻¹² | 7.38 × 10⁻¹¹ | 1.93 × 10⁻¹¹ | 1.80 × 10⁻¹¹ | 7.36 × 10⁻⁶ | 5.39 × 10⁻⁶ | 1.27 × 10⁻⁵ |
| 5 | 2.10 × 10⁻¹⁰ | 3.35 × 10⁻¹¹ | 5.09 × 10⁻¹² | 1.80 × 10⁻¹¹ | 1.54 × 10⁻¹⁰ | 1.34 × 10⁻¹¹ | 1.12 × 10⁻¹¹ | 2.57 × 10⁻⁵ | 3.37 × 10⁻⁶ | 2.91 × 10⁻⁵ |
| 6 | 5.86 × 10⁻¹⁰ | 3.16 × 10⁻¹⁰ | 4.49 × 10⁻¹³ | 7.09 × 10⁻¹⁰ | 1.92 × 10⁻¹⁰ | 1.04 × 10⁻¹¹ | 0 | 7.19 × 10⁻⁵ | 0 | 7.19 × 10⁻⁵ |
| 7 | 6.49 × 10⁻¹⁰ | 5.40 × 10⁻¹¹ | 3.14 × 10⁻¹² | 2.89 × 10⁻¹¹ | 1.41 × 10⁻¹⁰ | 1.10 × 10⁻¹¹ | 8.98 × 10⁻¹² | 7.96 × 10⁻⁵ | 2.69 × 10⁻⁶ | 8.23 × 10⁻⁵ |
| 8 | 4.49 × 10⁻¹¹ | 3.20 × 10⁻¹¹ | 2.63 × 10⁻¹⁰ | 6.47 × 10⁻¹⁰ | 5.45 × 10⁻¹¹ | 1.25 × 10⁻¹¹ | 2.02 × 10⁻¹¹ | 5.52 × 10⁻⁶ | 6.06 × 10⁻⁶ | 1.16 × 10⁻⁵ |
| 9 | 5.34 × 10⁻¹⁰ | 1.09 × 10⁻¹⁰ | 1.04 × 10⁻¹⁰ | 2.08 × 10⁻¹¹ | 0 | 1.32 × 10⁻¹¹ | 1.12 × 10⁻¹¹ | 6.56 × 10⁻⁵ | 3.37 × 10⁻⁶ | 6.89 × 10⁻⁵ |
| 10 | 5.70 × 10⁻¹⁰ | 6.12 × 10⁻¹¹ | 2.97 × 10⁻¹⁰ | 7.32 × 10⁻¹⁰ | 6.09 × 10⁻¹¹ | 7.23 × 10⁻¹² | 0 | 6.99 × 10⁻⁵ | 0 | 6.99 × 10⁻⁵ |
| 11 | 1.88 × 10⁻⁹ | 1.92 × 10⁻⁹ | 7.97 × 10⁻⁹ | 5.13 × 10⁻⁹ | 0 | 8.51 × 10⁻¹¹ | 0 | 2.29 × 10⁻⁴ | 0 | 2.29 × 10⁻⁴ |
| 12 | 7.02 × 10⁻⁹ | 1.33 × 10⁻¹⁰ | 9.20 × 10⁻⁹ | 7.43 × 10⁻⁹ | 2.89 × 10⁻¹¹ | 4.41 × 10⁻¹¹ | 5.61 × 10⁻¹¹ | 8.37 × 10⁻⁴ | 1.68 × 10⁻⁵ | 8.54 × 10⁻⁴ |
| 13 | 1.50 × 10⁻¹¹ | 1.06 × 10⁻⁹ | 4.09 × 10⁻¹⁰ | 1.02 × 10⁻⁹ | 0 | 4.73 × 10⁻¹¹ | 2.47 × 10⁻¹¹ | 1.84 × 10⁻⁶ | 7.41 × 10⁻⁶ | 9.25 × 10⁻⁶ |
| 14 | 1.00 × 10⁻⁹ | 3.95 × 10⁻¹¹ | 2.62 × 10⁻⁹ | 9.05 × 10⁻¹⁰ | 1.92 × 10⁻¹⁰ | 3.20 × 10⁻¹³ | 0 | 1.23 × 10⁻⁴ | 0 | 1.23 × 10⁻⁴ |
| 15 | 8.50 × 10⁻¹⁰ | 4.85 × 10⁻¹¹ | 1.67 × 10⁻⁹ | 5.97 × 10⁻¹⁰ | 0 | 7.47 × 10⁻¹⁰ | 1.57 × 10⁻¹¹ | 1.04 × 10⁻⁴ | 4.71 × 10⁻⁶ | 1.09 × 10⁻⁴ |
| 16 | 4.79 × 10⁻¹⁰ | 9.43 × 10⁻¹¹ | 6.13 × 10⁻¹⁰ | 4.39 × 10⁻¹⁰ | 0 | 1.57 × 10⁻¹¹ | 1.80 × 10⁻¹¹ | 5.88 × 10⁻⁵ | 5.39 × 10⁻⁶ | 6.42 × 10⁻⁵ |
| 17 | 3.14 × 10⁻¹⁰ | 1.44 × 10⁻¹¹ | 2.02 × 10⁻¹⁰ | 1.26 × 10⁻¹⁰ | 6.38 × 10⁻¹¹ | 1.83 × 10⁻¹¹ | 8.98 × 10⁻¹² | 3.86 × 10⁻⁵ | 2.69 × 10⁻⁶ | 4.13 × 10⁻⁵ |
| 18 | 9.47 × 10⁻¹⁰ | 6.11 × 10⁻¹¹ | 5.24 × 10⁻⁹ | 4.18 × 10⁻¹⁰ | 6.16 × 10⁻¹¹ | 5.14 × 10⁻¹¹ | 2.02 × 10⁻¹¹ | 1.16 × 10⁻⁴ | 6.06 × 10⁻⁶ | 1.22 × 10⁻⁴ |
| 19 | 2.99 × 10⁻¹¹ | 2.07 × 10⁻¹¹ | 2.00 × 10⁻⁹ | 8.09 × 10⁻¹⁰ | 6.67 × 10⁻¹¹ | 6.23 × 10⁻¹³ | 8.98 × 10⁻¹² | 3.68 × 10⁻⁶ | 2.69 × 10⁻⁶ | 6.38 × 10⁻⁶ |
| 20 | 1.31 × 10⁻⁹ | 4.76 × 10⁻¹¹ | 2.17 × 10⁻⁹ | 6.85 × 10⁻¹⁰ | 3.21 × 10⁻¹⁰ | 8.48 × 10⁻¹² | 8.98 × 10⁻¹² | 1.60 × 10⁻⁴ | 2.69 × 10⁻⁶ | 1.63 × 10⁻⁴ |
| 21 | 3.14 × 10⁻¹⁰ | 1.39 × 10⁻¹⁰ | 9.50 × 10⁻¹⁰ | 5.05 × 10⁻¹⁰ | 6.64 × 10⁻¹⁰ | 1.86 × 10⁻¹¹ | 0 | 3.86 × 10⁻⁵ | 0 | 3.86 × 10⁻⁵ |
| 22 | 4.49 × 10⁻¹¹ | 7.81 × 10⁻¹¹ | 3.32 × 10⁻¹⁰ | 5.58 × 10⁻¹⁰ | 1.71 × 10⁻¹⁰ | 1.79 × 10⁻¹¹ | 0 | 5.52 × 10⁻⁶ | 0 | 5.52 × 10⁻⁶ |
| 23 | 1.81 × 10⁻⁹ | 1.63 × 10⁻¹⁰ | 2.76 × 10⁻¹⁰ | 1.69 × 10⁻⁹ | 0 | 5.60 × 10⁻¹² | 1.80 × 10⁻¹¹ | 2.21 × 10⁻⁴ | 5.39 × 10⁻⁶ | 2.27 × 10⁻⁴ |
| 24 | 8.89 × 10⁻¹⁰ | 1.17 × 10⁻¹¹ | 1.06 × 10⁻⁹ | 2.75 × 10⁻¹⁰ | 0 | 2.55 × 10⁻¹¹ | 2.24 × 10⁻¹¹ | 1.09 × 10⁻⁴ | 6.73 × 10⁻⁶ | 1.16 × 10⁻⁴ |
| 25 | 1.80 × 10⁻¹⁰ | 2.42 × 10⁻¹¹ | 6.73 × 10⁻¹² | 1.20 × 10⁻¹⁰ | 1.60 × 10⁻¹⁰ | 6.36 × 10⁻¹¹ | 1.35 × 10⁻¹¹ | 2.21 × 10⁻⁵ | 4.04 × 10⁻⁶ | 2.61 × 10⁻⁵ |
| 26 | 7.48 × 10⁻¹¹ | 1.29 × 10⁻¹⁰ | 1.99 × 10⁻⁹ | 9.31 × 10⁻¹⁰ | 0 | 2.61 × 10⁻¹⁰ | 1.35 × 10⁻¹¹ | 9.20 × 10⁻⁶ | 4.04 × 10⁻⁶ | 1.32 × 10⁻⁵ |
| 27 | 1.20 × 10⁻¹⁰ | 1.03 × 10⁻¹⁰ | 6.20 × 10⁻¹⁰ | 3.38 × 10⁻¹⁰ | 0 | 1.53 × 10⁻¹¹ | 2.02 × 10⁻¹¹ | 1.47 × 10⁻⁵ | 6.06 × 10⁻⁶ | 2.08 × 10⁻⁵ |
| 28 | 5.32 × 10⁻¹⁰ | 1.45 × 10⁻¹⁰ | 2.02 × 10⁻⁹ | 3.57 × 10⁻¹⁰ | 2.13 × 10⁻⁹ | 1.12 × 10⁻¹¹ | 2.24 × 10⁻¹² | 6.52 × 10⁻⁵ | 6.73 × 10⁻⁷ | 6.59 × 10⁻⁵ |
| 29 | 4.49 × 10⁻¹¹ | 3.85 × 10⁻¹¹ | 1.39 × 10⁻¹⁰ | 1.03 × 10⁻¹¹ | 0 | 2.25 × 10⁻¹² | 8.98 × 10⁻¹² | 5.52 × 10⁻⁶ | 2.69 × 10⁻⁶ | 8.22 × 10⁻⁶ |
| 30 | 9.46 × 10⁻¹⁰ | 9.48 × 10⁻¹¹ | 4.72 × 10⁻¹⁰ | 4.31 × 10⁻¹¹ | 5.10 × 10⁻¹¹ | 7.74 × 10⁻¹² | 1.12 × 10⁻¹¹ | 1.16 × 10⁻⁴ | 3.37 × 10⁻⁶ | 1.19 × 10⁻⁴ |
| 31 | 4.49 × 10⁻¹¹ | 7.41 × 10⁻¹¹ | 4.04 × 10⁻¹⁰ | 5.13 × 10⁻¹⁰ | 8.21 × 10⁻¹¹ | 5.03 × 10⁻¹² | 6.73 × 10⁻¹² | 5.52 × 10⁻⁶ | 2.02 × 10⁻⁶ | 7.54 × 10⁻⁶ |
| 32 | 0 | 7.30 × 10⁻¹¹ | 1.14 × 10⁻¹⁰ | 9.42 × 10⁻¹⁰ | 2.74 × 10⁻¹⁰ | 3.64 × 10⁻¹² | 8.98 × 10⁻¹² | 0 | 2.69 × 10⁻⁶ | 2.70 × 10⁻⁶ |
| 33 | 0 | 9.10 × 10⁻¹¹ | 2.82 × 10⁻⁹ | 1.23 × 10⁻⁹ | 0 | 7.73 × 10⁻¹² | 1.80 × 10⁻¹¹ | 0 | 5.39 × 10⁻⁶ | 5.39 × 10⁻⁶ |
| 34 | 5.42 × 10⁻¹⁰ | 1.76 × 10⁻¹⁰ | 1.01 × 10⁻⁹ | 5.82 × 10⁻¹⁰ | 5.45 × 10⁻¹¹ | 1.86 × 10⁻¹¹ | 1.12 × 10⁻¹¹ | 6.65 × 10⁻⁵ | 3.37 × 10⁻⁶ | 6.99 × 10⁻⁵ |
| 35 | 1.50 × 10⁻¹¹ | 5.28 × 10⁻¹¹ | 4.02 × 10⁻⁹ | 1.11 × 10⁻⁹ | 6.54 × 10⁻¹¹ | 5.13 × 10⁻¹¹ | 0 | 1.84 × 10⁻⁶ | 0 | 1.85 × 10⁻⁶ |
| 36 | 4.49 × 10⁻¹¹ | 2.22 × 10⁻¹¹ | 3.82 × 10⁻¹⁰ | 6.24 × 10⁻¹⁰ | 6.93 × 10⁻¹¹ | 2.47 × 10⁻¹¹ | 8.98 × 10⁻¹² | 5.52 × 10⁻⁶ | 2.69 × 10⁻⁶ | 8.22 × 10⁻⁶ |
| Mean | 6.40 × 10⁻¹⁰ | 1.57 × 10⁻¹⁰ | 1.38 × 10⁻⁹ | 8.53 × 10⁻¹⁰ | 1.49 × 10⁻¹⁰ | 4.67 × 10⁻¹¹ | 1.23 × 10⁻¹¹ | 7.77 × 10⁻⁵ | 3.70 × 10⁻⁶ | 8.14 × 10⁻⁵ |
Publisher’s Note: MDPI stays neutral with regard to jurisdictional claims in published maps and institutional affiliations. |
© 2022 by the authors. Licensee MDPI, Basel, Switzerland. This article is an open access article distributed under the terms and conditions of the Creative Commons Attribution (CC BY) license (https://creativecommons.org/licenses/by/4.0/).
Share and Cite
Wang, L.; Tao, Y.; Su, B.; Wang, L.; Liu, P. Environmental and Health Risks Posed by Heavy Metal Contamination of Groundwater in the Sunan Coal Mine, China. Toxics 2022, 10, 390. https://doi.org/10.3390/toxics10070390
Wang L, Tao Y, Su B, Wang L, Liu P. Environmental and Health Risks Posed by Heavy Metal Contamination of Groundwater in the Sunan Coal Mine, China. Toxics. 2022; 10(7):390. https://doi.org/10.3390/toxics10070390
Chicago/Turabian StyleWang, Lijuan, Yuezan Tao, Bin Su, Lijun Wang, and Peigui Liu. 2022. "Environmental and Health Risks Posed by Heavy Metal Contamination of Groundwater in the Sunan Coal Mine, China" Toxics 10, no. 7: 390. https://doi.org/10.3390/toxics10070390
APA StyleWang, L., Tao, Y., Su, B., Wang, L., & Liu, P. (2022). Environmental and Health Risks Posed by Heavy Metal Contamination of Groundwater in the Sunan Coal Mine, China. Toxics, 10(7), 390. https://doi.org/10.3390/toxics10070390