Article

Assessing the Impacts of Green Logistics on Sustainable Business Performance: An Application of a Hybrid SEM-GM(1,1) Approach

1
Faculty of Logistics, Thu Dau Mot University, Ho Chi Minh City 700000, Vietnam
2
Faculty of Business Administration, Lac Hong University, Dong Nai 810000, Vietnam
*
Authors to whom correspondence should be addressed.
Logistics 2026, 10(3), 52; https://doi.org/10.3390/logistics10030052
Submission received: 18 January 2026 / Revised: 14 February 2026 / Accepted: 18 February 2026 / Published: 24 February 2026
(This article belongs to the Section Sustainable Supply Chains and Logistics)

Abstract

Background: Amid global sustainability imperatives, the logistics sector serves as a key economic enabler while remaining a major contributor to greenhouse gas emissions. This study investigates the causal relationships between green logistics practices and sustainable business performance in Vietnamese small- and medium-sized enterprises, mediated by competitiveness, and forecasts future trends to inform transitions aligned with net-zero goals. Methods: A mixed-methods design integrates structural equation modeling with the gray model. Primary data were collected via Likert-scale questionnaires administered to 350 managers to measure latent variables. Secondary financial metrics (revenue, costs, assets, profits) from 15 firms spanning 2021–2024 enabled forecasting. Results: SEM, employing bootstrapping for path estimation, revealed positive direct effects, with the strongest effects for green transportation and weaker effects for technology, packaging, and warehousing. Mediation via competitiveness yielded mixed indirect effects: positive for warehousing and transportation, but negative for technology. GM(1,1) projected moderate performance growth under conditions of data uncertainty. Conclusions: The hybrid framework advances the resource-based view in emerging market contexts, recommending prioritization of transportation and technology initiatives alongside policy incentives to align with sustainable development goals and enhance resilience in Vietnam’s logistics sector.

1. Introduction

In the context of the global transition toward sustainable development, the logistics sector has emerged as a dual pillar: a key driver of economic growth and, simultaneously, a major source of significant negative environmental impacts [1]. Logistics plays a pivotal role in optimizing the flows of goods, information, and finance across the entire supply chain.
However, traditional logistics operations, particularly road freight transport, warehousing, and materials handling, consume substantial amounts of fossil energy, resulting in high greenhouse gas emissions. These activities contribute substantially to climate change, biodiversity loss, and urban pollution. According to international reports from the OECD, the UN, and the ITF, the broader transport sector (including passenger and freight) accounts for approximately 20–24% of global energy-related CO2 emissions in recent years. Within this, freight transport (particularly road freight) is a dominant contributor, often responsible for over 40% of total transport CO2 emissions globally, with even higher proportions in many emerging economies due to rapid growth in road-based goods movement [2].
Mounting pressure from international commitments has accelerated the shift to-ward green logistics, a concept that integrates policies, practices, and technologies to minimize environmental impacts while preserving economic and social efficiency. Unlike traditional approaches, which prioritize cost and time optimization, green logistics explicitly balances the three pillars of sustainability, economic, social, and environmental, through measures such as route optimization, transition to renewable energy sources, waste reduction, and the adoption of digital technologies.
Theoretical and empirical studies demonstrate that green logistics is not merely a passive response to regulatory pressures; rather, it represents a proactive strategic approach to enhancing competitive advantage. By reducing supply chain risks, improving resource efficiency, and meeting the evolving expectations of stakeholders, firms can achieve long-term resilience and differentiation in increasingly sustainability-oriented markets.
At the global level, institutional frameworks such as the 2015 Paris Agreement on climate change and the UN sustainable development goals impose legal and ethical pressures on the logistics sector. New-generation free trade agreements (FTAs), including the CPTPP and EVFTA, incorporate environmental sustainability provisions that mandate transparency in carbon emissions and adherence to green certifications such as ISO 14001 [3]. Multinational corporations and international buyers increasingly favor logistics partners that demonstrate green capabilities via ESG reporting and carbon neutral supply chains. Consequently, green logistics has evolved from an optional strategy to a prerequisite for integration into global value chains, particularly in advanced markets like Europe, North America, and Japan, where regulations such as the European Green Deal enforce stringent emission thresholds.
In developing economies, the shift to green logistics encounters a growth paradox: the imperative to expand logistics infrastructure for industrialization and global integration often conflicts with demands for pollution mitigation and resource efficiency. In this context, green logistics serves not only as an emission-reduction tool but also as a resilience mechanism against climate risks, including floods and weather-induced supply chain disruptions. Vietnam exemplifies this dynamic, with its rapidly expanding logistics sector facing persistent challenges. Vietnam’s COP26 pledge to reach net-zero emissions by 2050 positions logistics as central to its green transition. Key policies promote electric vehicles, multimodal transport optimization, and IoT applications in supply chain management. Advancing green logistics in Vietnam not only boosts firm competitiveness but also aligns with national sustainable development objectives.
A defining feature of Vietnam’s logistics industry is the dominance of SMEs, comprising 90% of logistics firms [4]. These SMEs mainly provide domestic transportation, warehousing, and ancillary services, playing a vital role in linking local supply chains. However, they grapple with constraints such as limited capital, obsolete technology, and inadequate managerial expertise. Adopting green logistics demands substantial upfront investment, extended ROI periods, and sophisticated organizational capabilities, whereas SMEs typically focus on short-term cost competition. Nonetheless, external pressures compel action: global clients require green certifications, supply chain partners enforce hazardous substance restrictions, and communities demand heightened corporate social responsibility.
According to institutional theory and stakeholder theory, SMEs’ adoption of green logistics stems not only from internal strategies but also from regulative, normative, and cognitive isomorphic pressures, as well as expectations of key stakeholders. In practice, however, implementation remains fragmented and largely reactive, confined to isolated tactics such as route optimization or reduced plastic packaging to satisfy immediate customer demands.
In the global transition toward sustainable development, green logistics has become a core strategy for reconciling economic, social, and environmental performance, especially in emerging economies such as Vietnam, where the COP26 net-zero commitment by 2050 places logistics at the center of national decarbonization efforts. Yet rigorous empirical evidence on how green logistics affects sustainable business performance in logistics SMEs, which constitute 90% of the sector through competitive mediators, remains scarce, particularly under conditions of limited and uncertain data. To address this gap and the inherent tension between infrastructure expansion and emission reduction, the present study employs a hybrid SEM-GM(1,1) framework: structural equation modeling to capture complex interrelationships among green logistics practices, competitiveness, and firm performance, combined with gray-model forecasting to handle small-sample, noisy data. By integrating and extending institutional and stakeholder theories within sustainable supply-chain management, this research advances theoretical understanding while delivering actionable insights for Vietnamese policymakers, strengthening SMEs’ global integration capacity, and supporting evidence-based strategies for green growth.

2. Literature Review

The field of green logistics has emerged as a critical nexus between environmental sustainability and supply chain management, propelled by intensifying global imperatives to mitigate ecological degradation while optimizing operational efficiency. This review synthesizes findings from a bibliometric analysis of 156 scholarly articles indexed in the Scopus database, utilizing keyword co-occurrence, co-citation analysis, and bibliographic coupling to map the intellectual structure, prevailing theoretical frameworks, and research clusters within the domain. The resulting visualization uncovers a fragmented yet dynamic landscape, marked by disparate research streams that insufficiently link green logistics practices to competitive capabilities and firm performance outcomes. This lacuna is especially evident among SMEs in developing economies, highlighting the imperative for more integrative models that bridge these interconnected dimensions.
  • Intellectual Structure through Keyword Co-Occurrence:
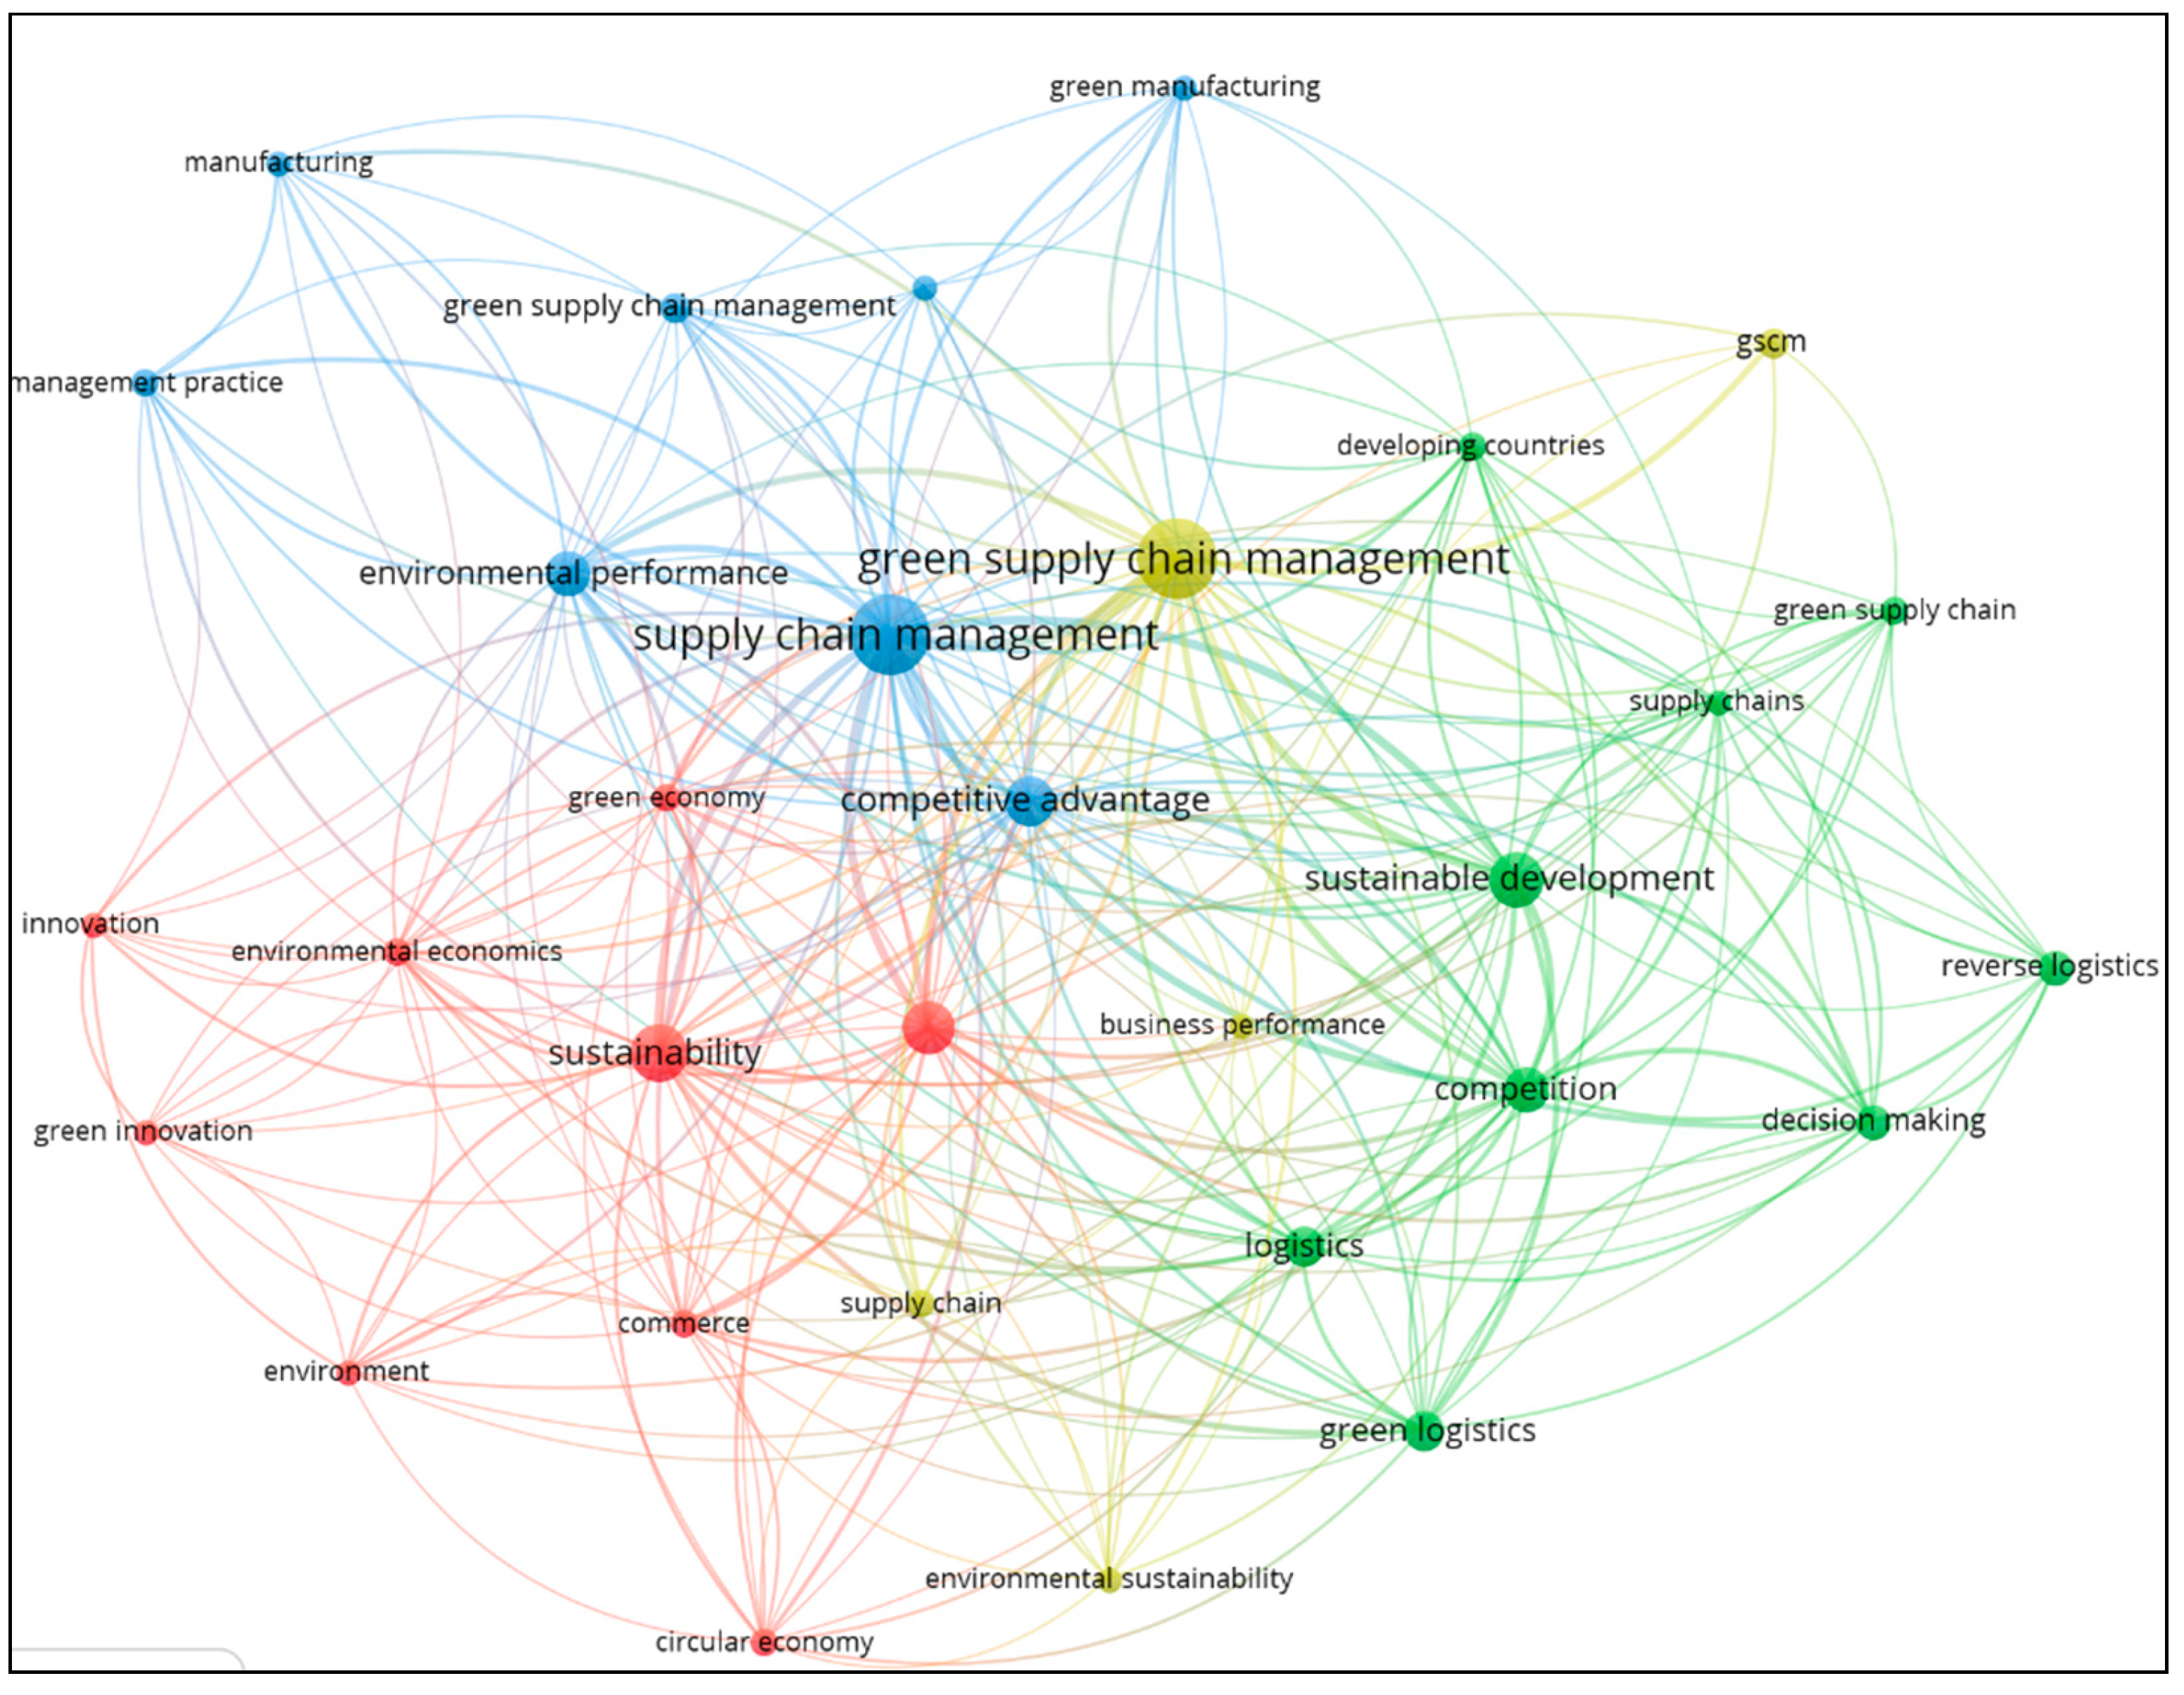
To delineate the thematic structure of green logistics research, a keyword co-occurrence analysis was performed on terms extracted from the selected corpus. After normalization and removal of redundant or semantically irrelevant terms, 31 keywords satisfied the minimum occurrence threshold of five, thereby ensuring analytical robustness. Employing VOSviewer version 1.6.20 software, the resultant network visualized interconnections among these keywords, revealing four distinct clusters that capture the dominant research trajectories (Figure 1).
The first cluster centers on business performance and competitive advantage, featuring prominent keywords such as “competitive advantage,” “competition,” and “business performance.” This cluster underscores the increasing acknowledgment of green logistics as a strategic lever for bolstering firm competitiveness. However, connections between these performance-oriented terms and core green logistics concepts remain tenuous, indicating that competitive advantages are often regarded as secondary outcomes rather than rigorously examined mediators. Empirical studies in this domain commonly assert that adopting environmentally sustainable practices can foster market differentiation, yet they infrequently unpack the underlying mechanisms by which such practices convert into enduring economic benefits, such as optimized cost structures or elevated brand equity.
In contrast, the second cluster focuses on sustainability and environmental management, with high frequency and densely interconnected keywords including “sustainability,” “sustainable development,” “environmental management,” and “environmental performance.” This focus positions green logistics within the broader paradigm of sustainable development, frequently drawing on the triple bottom line framework to balance economic, social, and environmental dimensions. Research within this cluster primarily assesses the ecological impacts of logistics operations, such as carbon emission reductions or waste minimization. Nevertheless, a key limitation endures: these investigations seldom progress beyond mere impact evaluation to probe how environmental benefits generate competitive advantages or measurable business performance enhancements, thus leaving the processes of value creation underexplored.
Occupying the network’s core, the third cluster revolves around green logistics and supply chain management, dominated by keywords such as “green supply chain management,” “supply chain management,” and “green logistics.” This cluster embodies the most influential research stream, conceptualizing green logistics as an integrated set of managerial practices spanning the supply chain, including reverse logistics, green procurement, and eco-friendly manufacturing [5,6,7]. Despite its centrality, the literature in this area tends toward descriptive and measurement-oriented inquiries, quantifying the adoption of these practices without sufficiently exploring their contributions to competitive capabilities. For instance, although metrics for green performance are well established, analyses of how these practices foster dynamic capabilities, such as adaptability to regulatory shifts or innovation in resource utilization, remain underdeveloped.
Emerging as a nascent yet promising trajectory, the fourth cluster connects innovation with the green economy, featuring keywords like “innovation,” “green economy,” “circular economy,” and “developing countries.” Although smaller in scale and less interconnected than other clusters, this grouping signals a pivot toward dynamic perspectives, embedding green logistics within transformative economic models, particularly in emerging markets. It highlights the potential for innovation-driven strategies to promote circularity, wherein waste is repurposed as resources, thereby aligning logistics with broader developmental goals. However, the relative isolation of this cluster points to opportunities for greater integration with established themes, especially in contexts where resource constraints in developing nations heighten the need for innovative green solutions.
Collectively, the keyword co-occurrence network depicts a field characterized by siloed research streams, with limited synthesis among green logistics practices, competitive capabilities, and business performance outcomes. This fragmentation is particularly acute in settings such as SMEs in Southeast Asia, where contextual factors, like constrained capital for green investments or evolving regulatory frameworks, necessitate context-specific inquiries. The identified gaps furnish a robust scholarly foundation for advancing integrated models that examine these interrelationships, as undertaken in the present study.
  • Dominant Theoretical Frameworks via Co-Citation Analysis:
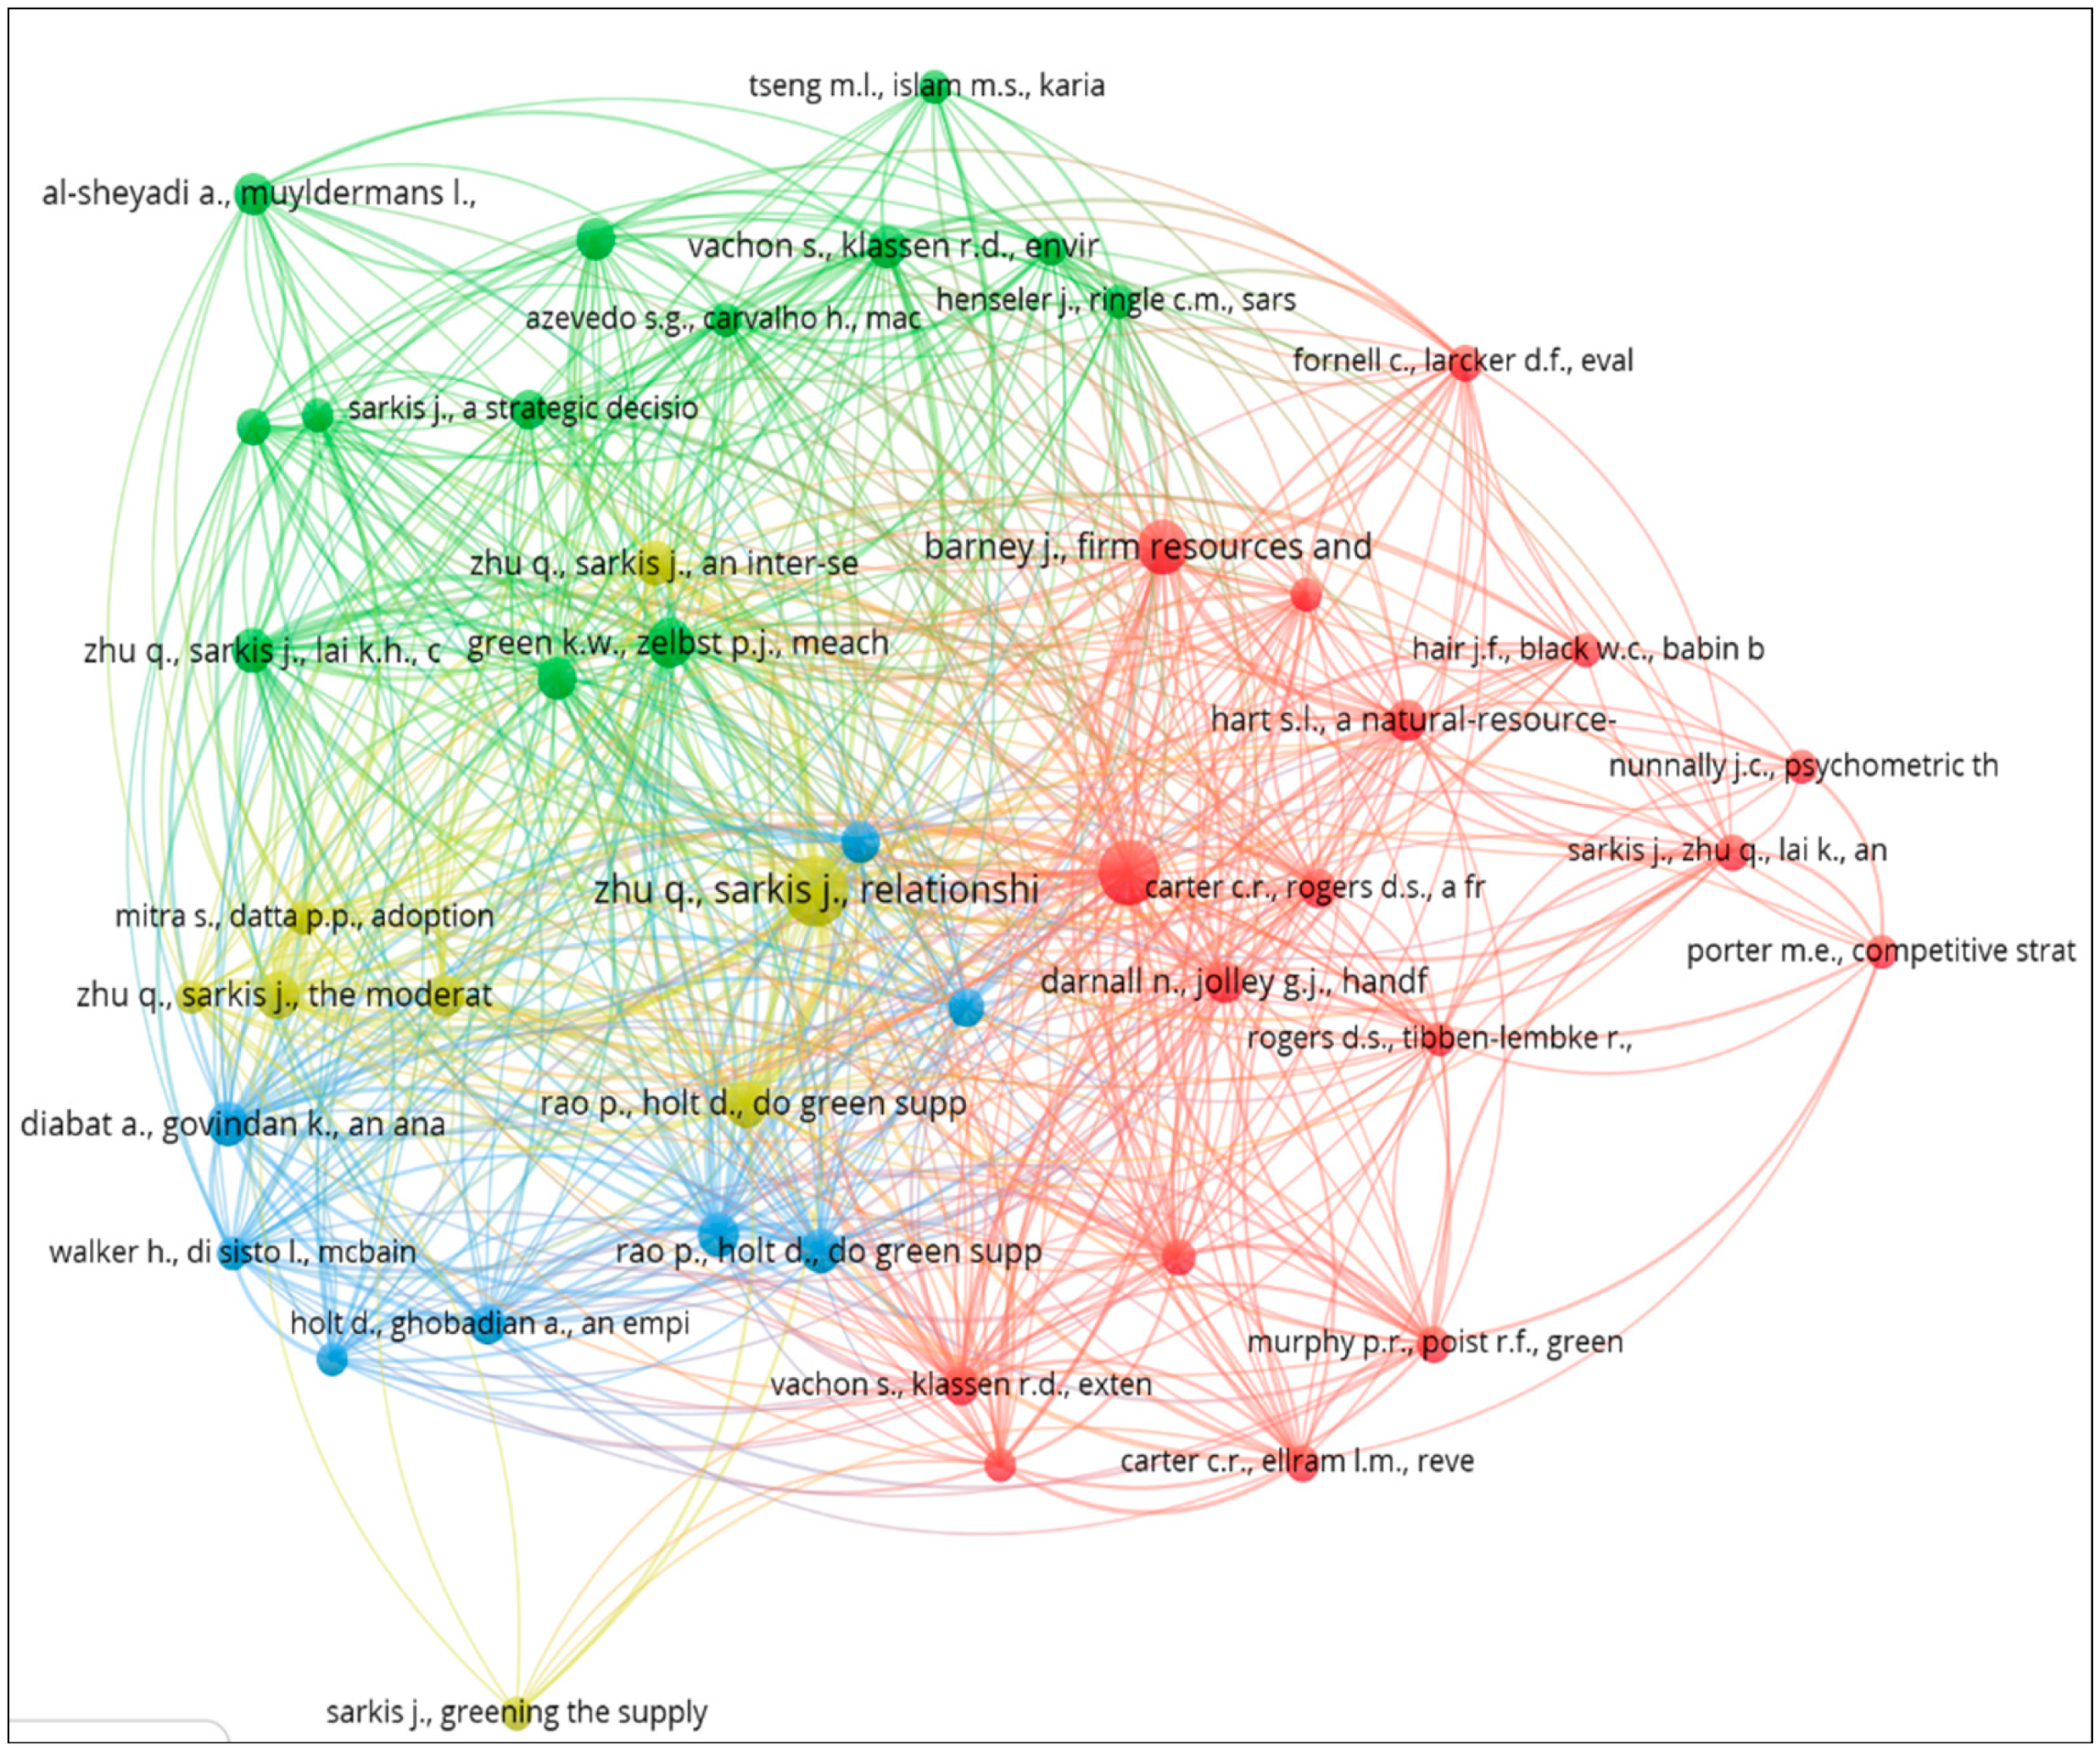
Co-citation analysis further elucidates the foundational theories underpinning green logistics scholarship by identifying clusters of frequently co-referenced works that denote intellectual cohesion (Figure 2). The analysis uncovers three predominant frameworks: the resource-based view, the triple bottom line, and sustainable supply chain management. Key contributors include Carter and Rogers (2008), who conceptualize sustainable supply chain management as an integrative paradigm; Sarkis (2012), who emphasizes environmental performance metrics; Zhu and Sarkis (2004), who examine green supply chain practices in manufacturing contexts; and Hart (1995), who advances the natural resource-based view as a pathway to competitive advantage [8,9,10,11].
The resource-based view posits that firms achieve sustained competitive advantage through unique, valuable, rare, and inimitable resources, including environmentally oriented capabilities. In green logistics contexts, this theory frames practices such as efficient reverse logistics as strategic assets that bolster operational resilience. The triple bottom line extends this perspective by advocating a holistic performance assessment across people, planet, and profit dimensions, thereby positioning green logistics as a mechanism for balanced sustainability. Sustainable supply chain management integrates these elements, promoting environmentally conscious coordination among supply chain partners to minimize ecological footprints while optimizing value creation.
Despite their prominence, applications of these frameworks reveal geographical and contextual biases. A majority of studies focus on large enterprises in developed economies, with limited attention to small and SMEs in regions such as Southeast Asia. This gap is evident in the underexplored influence of resource constraints or institutional voids on theoretical efficacy. For instance, while the RBV effectively explains competitive gains in resource-rich settings, its applicability to emerging markets, where external collaborations may offset internal deficiencies, remains insufficiently examined. Similarly, triple bottom line applications often emphasize environmental metrics at the expense of integrated performance outcomes, impeding comprehensive insights into value creation pathways.
  • Research Communities Identified through Bibliographic Coupling:
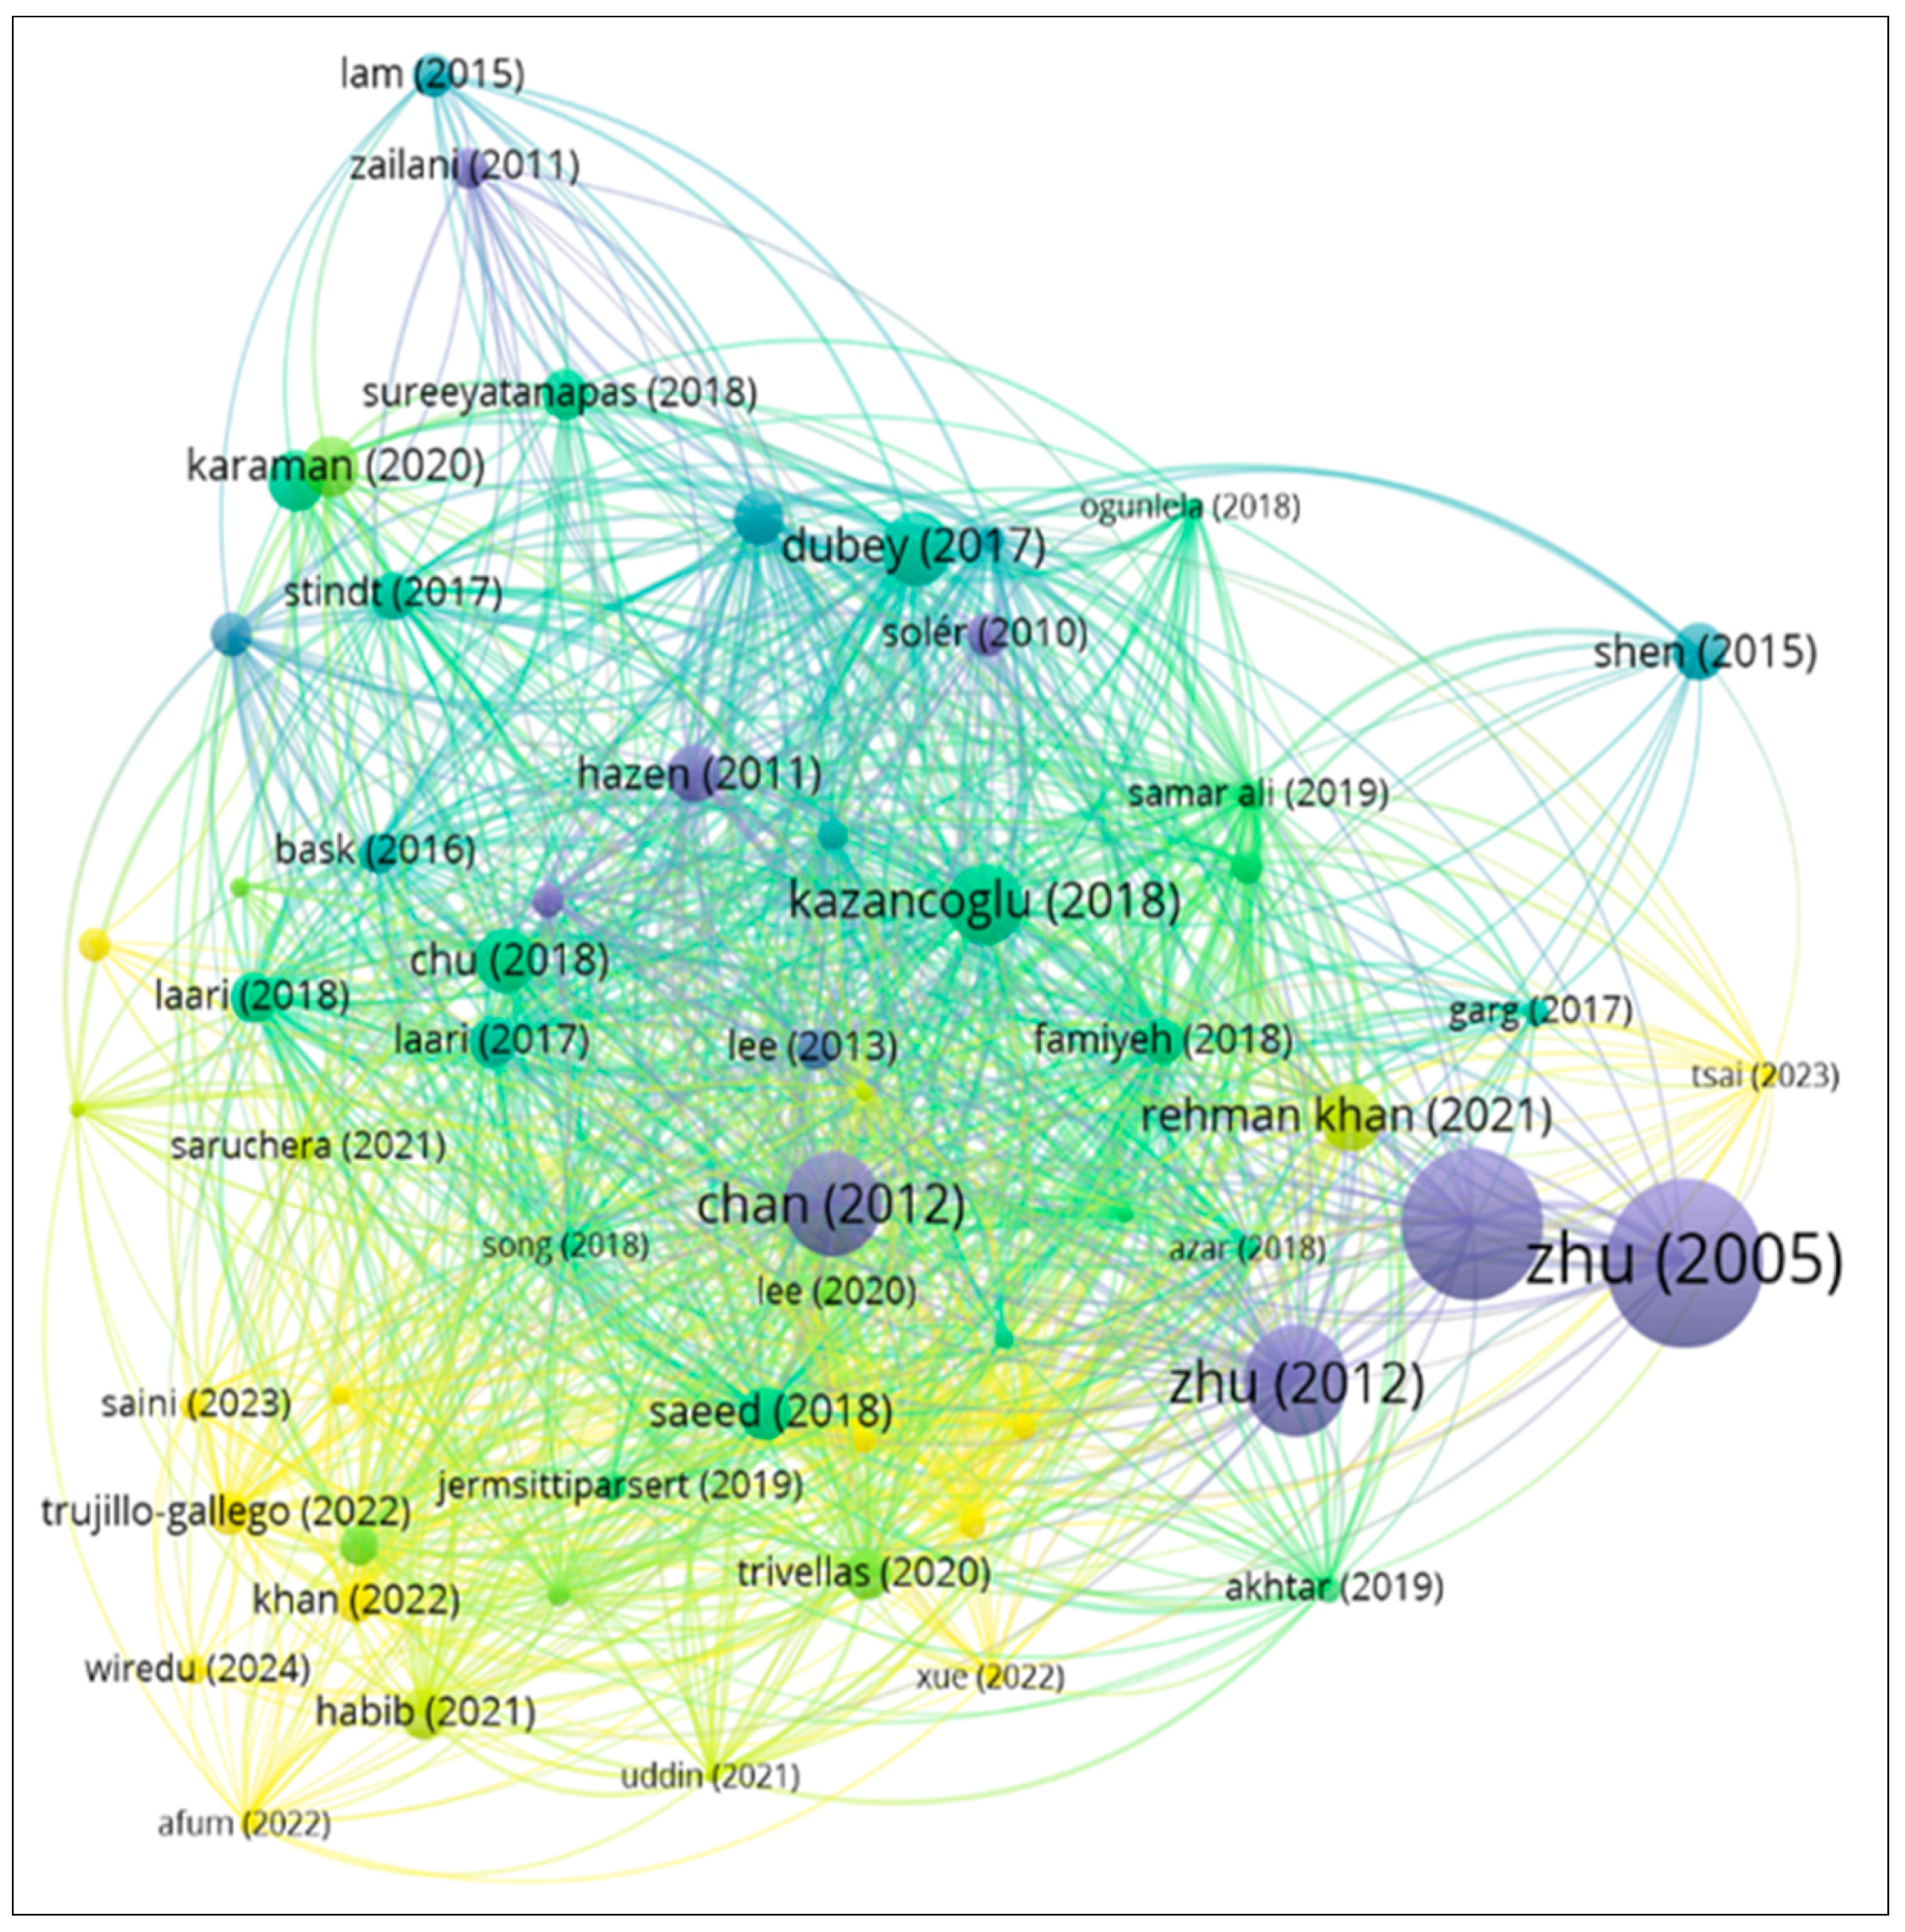
Bibliographic coupling complements the preceding analyses by clustering articles based on shared references, revealing three major research communities that function with relative independence (Figure 3). The first community utilizes quantitative methodologies, primarily structural equation modeling and partial least squares approaches, to examine relationships between green supply chain management and performance indicators. These studies offer empirical rigor, confirming causal linkages between green practices and outcomes such as cost reductions or market share growth. Nevertheless, they often neglect mediating variables, such as competitive capabilities, which could clarify indirect effects.
The second community emphasizes green technologies and analytical tools, including lifecycle assessment and optimization algorithms, for logistics networks. This research stream promotes practical applications, such as carbon footprint modeling or route optimization software, to improve environmental efficiency. However, its technical focus frequently disconnects from broader strategic dimensions, such as the contributions of these tools to firm-level competitiveness.
The third research community focuses on policy and institutional dimensions, scrutinizing green logistics through the lens of global initiatives such as the Belt and Road Initiative or net-zero commitments. This perspective underscores regulatory influences on adoption, emphasizing macro-level enablers like incentives and standards. Nevertheless, it infrequently intersects with micro-level analyses of firm performance, thereby perpetuating disciplinary silos.
A salient gap across these communities lies in the underrepresentation of mediating roles for competitive capabilities within the green logistics business performance nexus. Few studies empirically test how capabilities such as innovation agility or supply chain responsiveness mediate the impacts of environmental practices on performance, particularly in developing contexts. This oversight constrains theoretical advancement and practical guidance for enterprises navigating sustainability transitions.
In summary, this bibliometric review highlights the maturity of green logistics as a field while exposing persistent fragmentations. By integrating disparate streams, future research can develop more robust models, especially for SMEs in emerging economies, thereby fostering a synthesis of sustainability, competitiveness, and performance. The integrated framework proposed in this study addresses these gaps, contributing to both theory and practice in sustainable supply chain management.

3. Research Development

3.1. Research Process

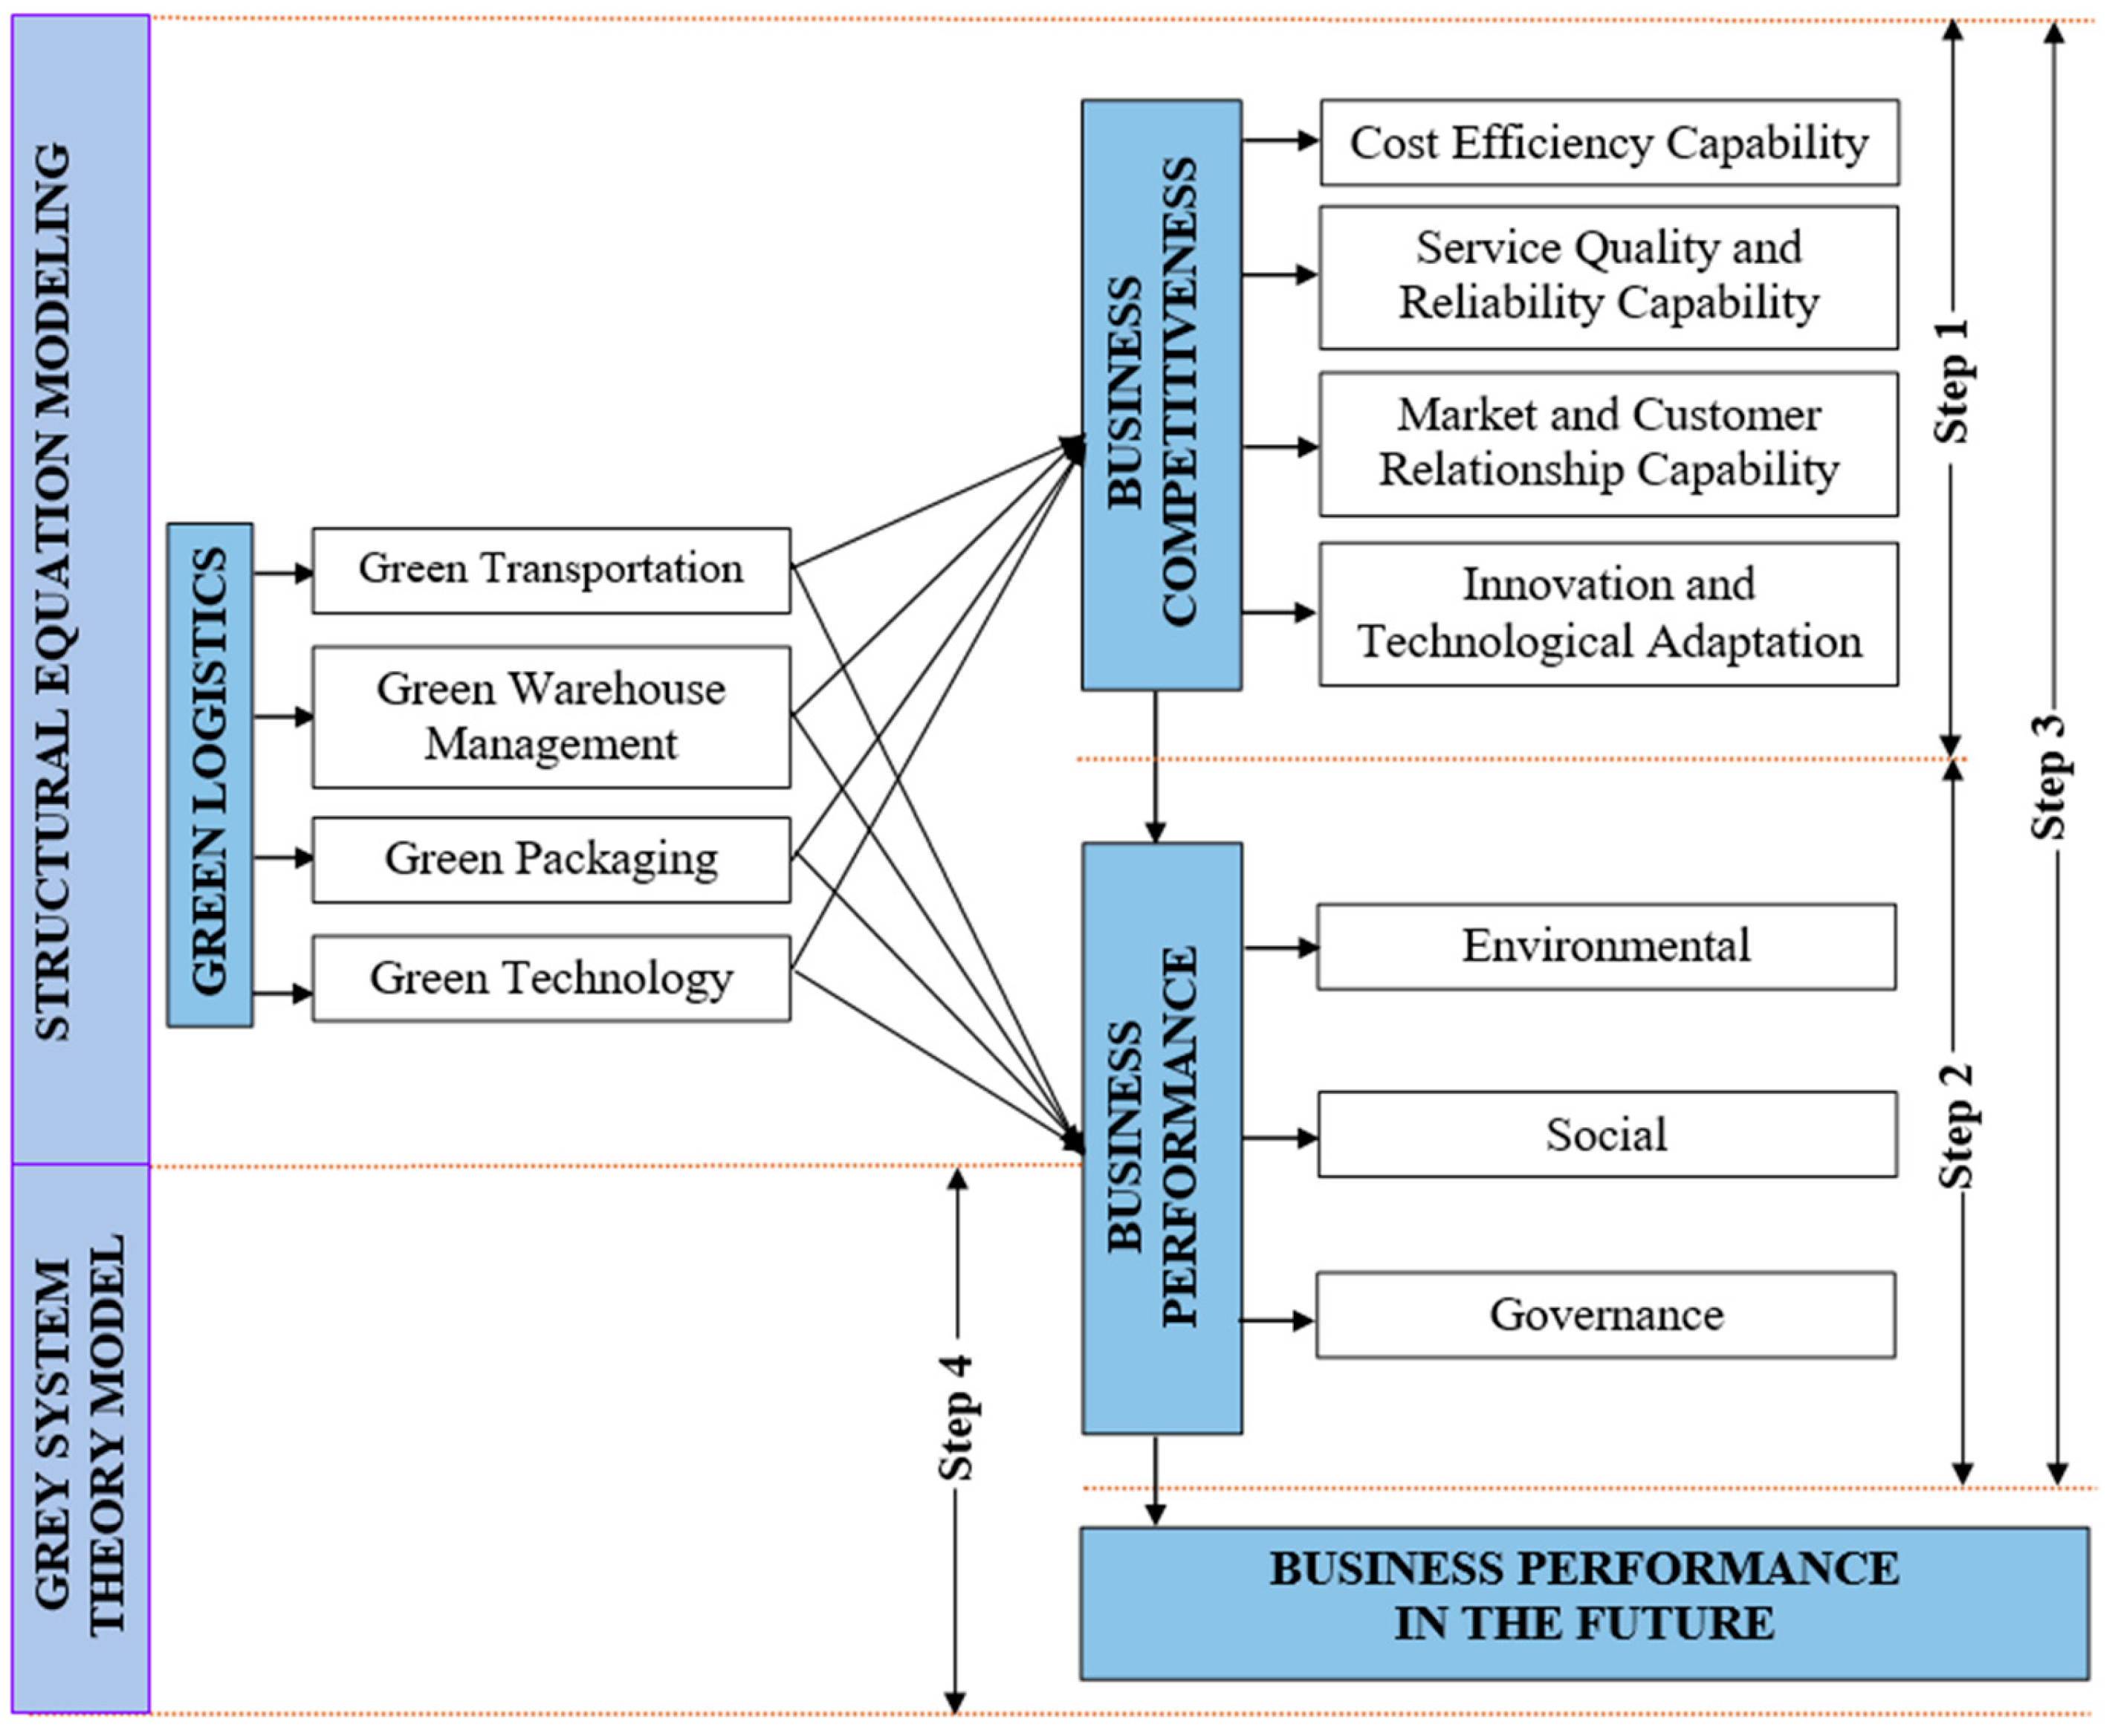
In this study, the authors employ a coherent SEM framework, from theoretical grounding to long-term forecasting, to assess the impact of green logistics on the sustainable business performance of logistics enterprises in Vietnam (Figure 4). SEM, integrated with EFA and path analysis, facilitates the simultaneous estimation of direct and indirect relationships via mediating variables. Model fit is evaluated using established indices, including RMSEA < 0.08, CFI > 0.95, and TLI > 0.95, confirming adequate to excellent fit [12].
Subsequently, the GM(1,1) is applied to forecast future business performance. This hybrid approach not only furnishes robust empirical evidence supporting the resource-based view of sustainable competitive advantage and green economy principles, but also offers practical guidance for managerial decision making, such as optimizing supply chains to minimize CO2 emissions and align with sustainable development goals, thereby contributing to broader global economic sustainability.
Specifically, the proposed model comprises four core components:
(1)
Green logistics as an exogenous latent variable;
(2)
Business competitiveness as a mediating variable;
(3)
Sustainable business performance as an endogenous variable;
(4)
Long-term forecasting of future business performance using time-series data.
  • Step 1: Theoretical foundation and measurement model
This study first establishes the theoretical foundation and develops the measurement model for green logistics and business competitiveness. Green logistics is operationalized as a latent construct, assessed through four reflective indicators: green transportation, green warehousing, green packaging, and green technology adoption. This phase evaluates the hypothesized positive effect of green logistics on the mediator, which is measured by four indicators: cost-effectiveness, service quality and reliability, customer–market relationships, and technological innovation.
  • Step 2: Extension to the endogenous construct
Building upon the aforementioned theoretical framework, the model establishes a direct linkage between green logistics and sustainable business performance, operationalized as an endogenous latent variable within the ESG paradigm and assessed via three reflective indicators: environmental performance, social performance, and governance performance. This phase evaluates the direct impact of green logistics on the sustainable performance of logistics enterprises in Vietnam.
  • Step 3: Full SEM with mediation
A complete structural model is then specified and estimated using SEM to examine the mediating role of business competitiveness in the relationship between green logistics and sustainable business performance. Drawing on Porter’s (1985) competitive advantage framework and Barney’s (1991) resource-based view of sustainable competitive advantage, the indirect effects are rigorously tested via bootstrapping [13,14]. Multi-group analysis across firm subgroups enhances generalizability. Collectively, these findings advance green economy theory and inform sustainable development policies in Vietnam, where enhanced green logistics practices contribute to improving the trade balance within ASEAN.
  • Step 4: Gray forecasting of future performance
Finally, actual financial data from Vietnamese logistics enterprises (2021–2024) are utilized to construct the GM(1,1). The dataset includes four input-related factors (total assets, cost of goods sold, selling expenses, and administrative expenses) and two output-related factors (sales revenue and after-tax profit), sourced from firms’ financial statements. This limited time-series forecasting supports managerial strategic decisions, including optimization of sustainable supply chains, mitigation of climate-related risks, and alignment with the SDGs.
Research hypotheses:
H1: 
Green logistics practices, encompassing green transportation, warehouse management, packaging, and technology, exert a positive effect on business performance as manifested through ESG dimensions.
H2: 
Green logistics practices positively influence business competitiveness via augmented capabilities in cost efficiency, service quality and reliability, market and customer relationships, and innovation and technological adaptation.
H3: 
ESG-driven business performance positively impacts future business performance in logistics enterprises.
H4: 
Enhanced business competitiveness positively affects future business performance, underscoring the mediating role of capability development in sustainable value creation.
In this study, SEM and the GM(1,1) are integrated to harness SEM’s strengths in causal inference and GM(1,1)’s efficacy in forecasting under uncertainty. SEM provides the cross-sectional framework, wherein green logistics (an exogenous latent variable with reflective indicators: transportation, warehousing, packaging, technology) influences competitiveness (a mediator with indicators: cost-efficiency, service quality, market relations, innovation) and sustainable performance (an endogenous ESG), evaluated via bootstrapped path coefficients. GM(1,1) extends this temporally by forecasting longitudinal financial metrics from 2021–2024 data (inputs: assets, costs, expenses; outputs: revenue, profit) amid gray uncertainty (small n = 4 periods, incomplete information), employing accumulated sequences to derive differential equations for moderate growth projections (H3, H4). This hybrid approach addresses SEM’s static limitations, yielding dynamic policy insights, with SEM coefficients initializing GM(1,1) parameters to enhance predictive accuracy in data-scarce emerging contexts. SEM provides robust structural insights derived from cross-sectional data, thereby overcoming several inherent limitations of the GM(1,1), which relies exclusively on short time series (typically 4–10 observations) and is specifically designed for systems characterized by incomplete or uncertain information. By leveraging the path coefficients (β) obtained from SEM to initialize or optimize the GM(1,1) parameters (a: development coefficient; b: gray action quantity), the hybrid approach effectively integrates prior causal knowledge from structural relationships. This integration substantially reduces forecasting errors in data-scarce environments, where conventional statistical methods are highly susceptible to bias and large variance.

3.2. Data Collection Methods

  • Primary Data Collection:
Drawing on established theoretical frameworks in green logistics and sustainable development, this study designed a structured questionnaire tailored to the distinctive operational context of the logistics sector. The instrument was administered to 350 senior managers and decision makers in logistics firms, yielding primary data for latent construct measurement. The key measured constructs are defined as follows:
Green Transportation: Deployment of low-emission vehicles, advanced route optimization algorithms, alternative low-carbon fuels, and eco-driving protocols aimed at substantially reducing CO2 emissions, energy intensity, and overall environmental externalities in freight and passenger transport operations.
Green Warehouse Management: Adoption of energy-efficient technologies, on-site renewable energy generation, systematic waste minimization strategies, and spatially optimized storage configurations to lower energy consumption, greenhouse gas emissions, and resource depletion in warehousing activities.
Green Packaging: Utilization of recyclable, biodegradable, reusable, or source-reduced materials, coupled with deliberate minimization of packaging volume and weight, to mitigate resource extraction, post-consumer waste, and lifecycle emissions across the supply chain.
Green Technology: Strategic integration of Industry 4.0 digital solutions including IoT-enabled real-time monitoring, AI-driven predictive analytics, blockchain for traceability, and big data for process optimization to elevate environmental performance and resource productivity in logistics systems.
Cost Efficiency Capability: Organizational capacity to achieve superior cost control through lean process redesign, fuel optimization, waste elimination, economies of scale, and rigorous resource productivity, while preserving acceptable service standards.
Service Quality and Reliability Capability: Sustained ability to deliver on-time performance, order accuracy, zero-damage transport, real-time shipment visibility, and rapid responsiveness, thereby generating high levels of operational dependability and customer satisfaction.
Market and Customer Relationship Capability: Development of enduring strategic partnerships, deep understanding of clients’ sustainability expectations, proactive provision of green logistics solutions, and cultivation of long-term loyalty via transparent dialog and mutual value creation.
Innovation and Technological Adaptation Capability: Firm-level competence in assimilating, customizing, and deploying cutting-edge technologies and sustainable practices to continuously enhance operational processes, secure competitive differentiation, and adapt to evolving market and regulatory pressures.
Environmental Pillar (ESG): Systematic efforts to reduce ecological impacts through aggressive emission abatement, resource conservation, waste hierarchy implementation, biodiversity safeguards, and proactive climate risk mitigation across business activities.
Social Pillar (ESG): Commitment to upholding human rights, fair labor practices, employee health and safety, workforce diversity, community investment, and equitable value sharing throughout the extended supply chain.
Governance Pillar (ESG): Establishment of robust ethical governance structures, including transparent reporting, anti-corruption safeguards, independent board oversight, integrated risk management, full regulatory compliance, and accountable decision-making processes [15,16,17,18].
Secondary Data Collection: Complementing the survey data, secondary financial information was extracted from the audited annual reports of the sampled logistics enterprises. Six key performance indicators were collected consistently for the period 2021–2024: total revenue, cost of goods sold, total assets, selling expenses, administrative expenses, and net profit after tax. These metrics provide objective, longitudinal evidence of economic and financial sustainability outcomes.

3.3. Data Processing

This investigation adopts a dual-methodological paradigm, integrating perceptual survey data with objective financial metrics to elucidate the dynamics of green logistics and sustainable performance in Vietnam’s logistics sector.
Primary Data Acquisition and Structural Equation Modeling: A cross-sectional survey design was deployed, utilizing a meticulously validated questionnaire administered to 350 senior executives and managers from Vietnamese logistics firms. The instrument incorporated 30 manifest indicators, calibrated on a five-point Likert continuum, to gauge latent constructs pertaining to green logistics practices, organizational capabilities, ESG factors, and sustainable outcomes.
Post collection, data underwent rigorous screening for outliers, normality, and common method variance. Partial Least Squares Structural Equation Modeling (PLS-SEM) was employed as the analytical cornerstone, leveraging its variance-based estimation for predictive analytics, handling non-normal distributions, and accommodating formative-reflective hierarchies in nascent theoretical domains. PLS-SEM facilitated simultaneous estimation of measurement and structural models, rigorously testing seven hypotheses via bootstrapped path coefficients, assessing direct effects, mediation through capabilities, and moderation by ESG dimensions.
Secondary Data Extraction and Gray Forecasting: Complementarily, longitudinal secondary data, encompassing sales revenue and post-tax profits, were sourced from audited financial reports of 15 emblematic Vietnamese logistics enterprises spanning 2021–2024.
These time-series were modeled using the GM(1,1), a first-order univariate accumulator rooted in gray systems theory, adept at extrapolating trends from sparse, uncertain datasets without parametric assumptions. The procedure entailed accumulated generating operation, parameter estimation via least squares, and inverse transformation to yield forecasts. The calibrated GM(1,1) projected key performance indicators for 2025–2028, with model fidelity verified through mean absolute percentage error (MAPE) and residual diagnostics, furnishing robust foresight for strategic resilience amid sectoral uncertainties.

4. Methods and Materials

4.1. Structural Equation Modeling

SEM is a robust multivariate statistical framework widely employed in econometrics, management, and social sciences to investigate complex relationships between observed and latent variables. PLS-SEM, a variance-based variant, is particularly suitable for assessing the impact of green logistics practices on sustainable performance in seaport operations. In contrast to covariance-based SEM (CB-SEM), PLS-SEM excels in predictive modeling, and accommodates small sample sizes, non-normal data distributions, and formative constructs (features commonly encountered in logistics research).
In the present study, PLS-SEM was selected for its robustness against multicollinearity, its capacity to maximize R2 values for endogenous constructs, and its predictive orientation. It effectively evaluates how latent factors, such as eco-innovation and resource efficiency, influence environmental, economic, and social sustainability outcomes through direct and indirect pathways, without imposing stringent normality assumptions.
The assumptions underlying PLS-SEM are minimal: linearity in relationships, absence of severe multicollinearity (VIF < 5), and adequate indicator coverage. Validation criteria focus on measurement model reliability (Cronbach’s α > 0.7; composite reliability > 0.7) and validity (AVE > 0.5 for convergent validity; Fornell–Larcker criterion or HTMT < 0.85 for discriminant validity). Structural model evaluation encompasses path coefficients, effect sizes (f2 > 0.02), and predictive relevance (Q2 > 0). This rigorous approach ensures empirical validity in complex, real-world logistics scenarios.

4.2. Gray Forecasting Procedure

The GM(1,1), introduced by Deng Julong in 1982 as part of gray system theory, is specifically designed for forecasting in systems characterized by uncertainty, small sample sizes, and incomplete information [19,20,21,22]. In this study, the GM(1,1) model is applied to forecast revenue and net profit after tax for 15 Vietnamese logistics enterprises over the period of 2025–2028, based on historical financial data from 2021 to 2024. The methodology entails model estimation followed by validation of predictive accuracy using standard error metrics:
Preliminary data inspection to confirm suitability for the GM(1,1) model:
δ i = x ( 0 ) ( i 1 ) x ( 0 ) ( i ) ;   ( δ ( i ) I ^ ( e 2 n + 1 ;   e 2 n + 1 ) ,   i = 2 ;   3 ;   ;   n )
Construction and parameter estimation of the GM(1,1) model:
dx ( 1 ) ( k ) dk + ax ( 1 ) ( k ) = b
Generation of the original data sequence:
X ( 0 ) = ( X ( 1 ) ( 0 ) ,   X ( 2 ) ( 0 ) ,   ,   X ( n ) ( 0 ) ) ;   ( n 4 )
Application of the 1-AGO to the original data sequence to generate the accumulated generating sequence [23]:
X ( 1 ) = ( X ( 1 ) ( 1 ) ,   X ( 2 ) ( 1 ) ,   ,   X ( n ) ( 1 ) ) ;   ( n 4 )
Computation of the consecutive neighbor mean sequence:
Z ( 1 ) = ( Z ( 1 ) ( 1 ) ,   Z ( 2 ) ( 1 ) ,   ,   Z ( n ) ( 1 ) ) ;   ( n 4 )
Z ( k ) ( 1 ) = 0.5 × ( X ( k ) ( 1 ) + X ( k 1 ) ( 1 ) ) ;   ( k = 2 ,   3 ,   n )
Establishment of the gray differential equation for the GM(1,1) model:
dX ( k ) ( 1 ) dk + aX ( k ) ( 1 ) = b ;
Parameter estimation a and b using the ordinary least squares method:
a ^ = a b T = ( B T B ) 1 B T Y ¯ N ;
where
B = α Z ( 2 ) ( 1 ) 1 α Z ( n ) ( 1 ) 1 ;   Y N = X ( 2 ) ( 0 ) X ( n ) ( 0 )
Derivation of the time response function:
X ^ ( k + 1 ) ( 1 ) = ( x ( 1 ) ( 0 ) b a ) × e a k + b a   ( k = 1 ,   2 ,   3 ,   )
Restoration of the predicted values in the original data domain via the IAGO:
X ^ ( k + 1 ) ( 0 ) = x ^ ( k + 1 ) ( 1 ) x ^ ( k ) ( 1 ) ;   ( x ^ 1 ( 0 ) = x ( 1 ) ( 0 ) ) ;   ( k = 1 ,   2 ,   3 ,   ,   n )

4.3. Evaluation of Volatility Forecasts

Model accuracy is assessed using the MAPE (ε), a widely accepted metric in forecasting statistics for measuring the relative deviation between actual and predicted values. The MAPE is calculated as follows:
ε = 1 n i = 1 n A i F i A i × 100
ε < 10%: excellent; ε ∈ 10–20%: good; ε ∈ 20–50%: reasonable; ε > 50%: inaccurate [24].

4.4. Secondary Data Collection

  • Secondary Data: Financial Performance Metrics
To objectively assess the economic dimension of sustainable performance in Vietnamese logistics enterprises, the following key indicators were systematically extracted and analyzed for the period 2021–2024:
  • IP1: Reflecting the scale of resource endowment and capital intensity of operations.
  • IP2: Cost of Goods Sold: Capturing direct operational costs associated with service delivery.
  • IP3: Encompassing marketing, distribution, and customer-facing expenditures.
  • IP4: Including overhead costs related to management, governance, and support functions.
  • OP1: Measuring the top-line economic output of logistics activities.
  • OP2: Serving as the primary indicator of bottom-line financial sustainability and value creation after accounting for all costs, taxes, and regulatory obligations.
All monetary values are reported in USD (1000 USD) and are presented in Table 1, Table 2, Table 3 and Table 4, providing a transparent, longitudinal, and verifiable financial dataset that complements the perceptual primary data and supports robust triangulation in the assessment of triple-bottom-line sustainability performance in Vietnam’s logistics industry.

5. Results

5.1. SEM Results

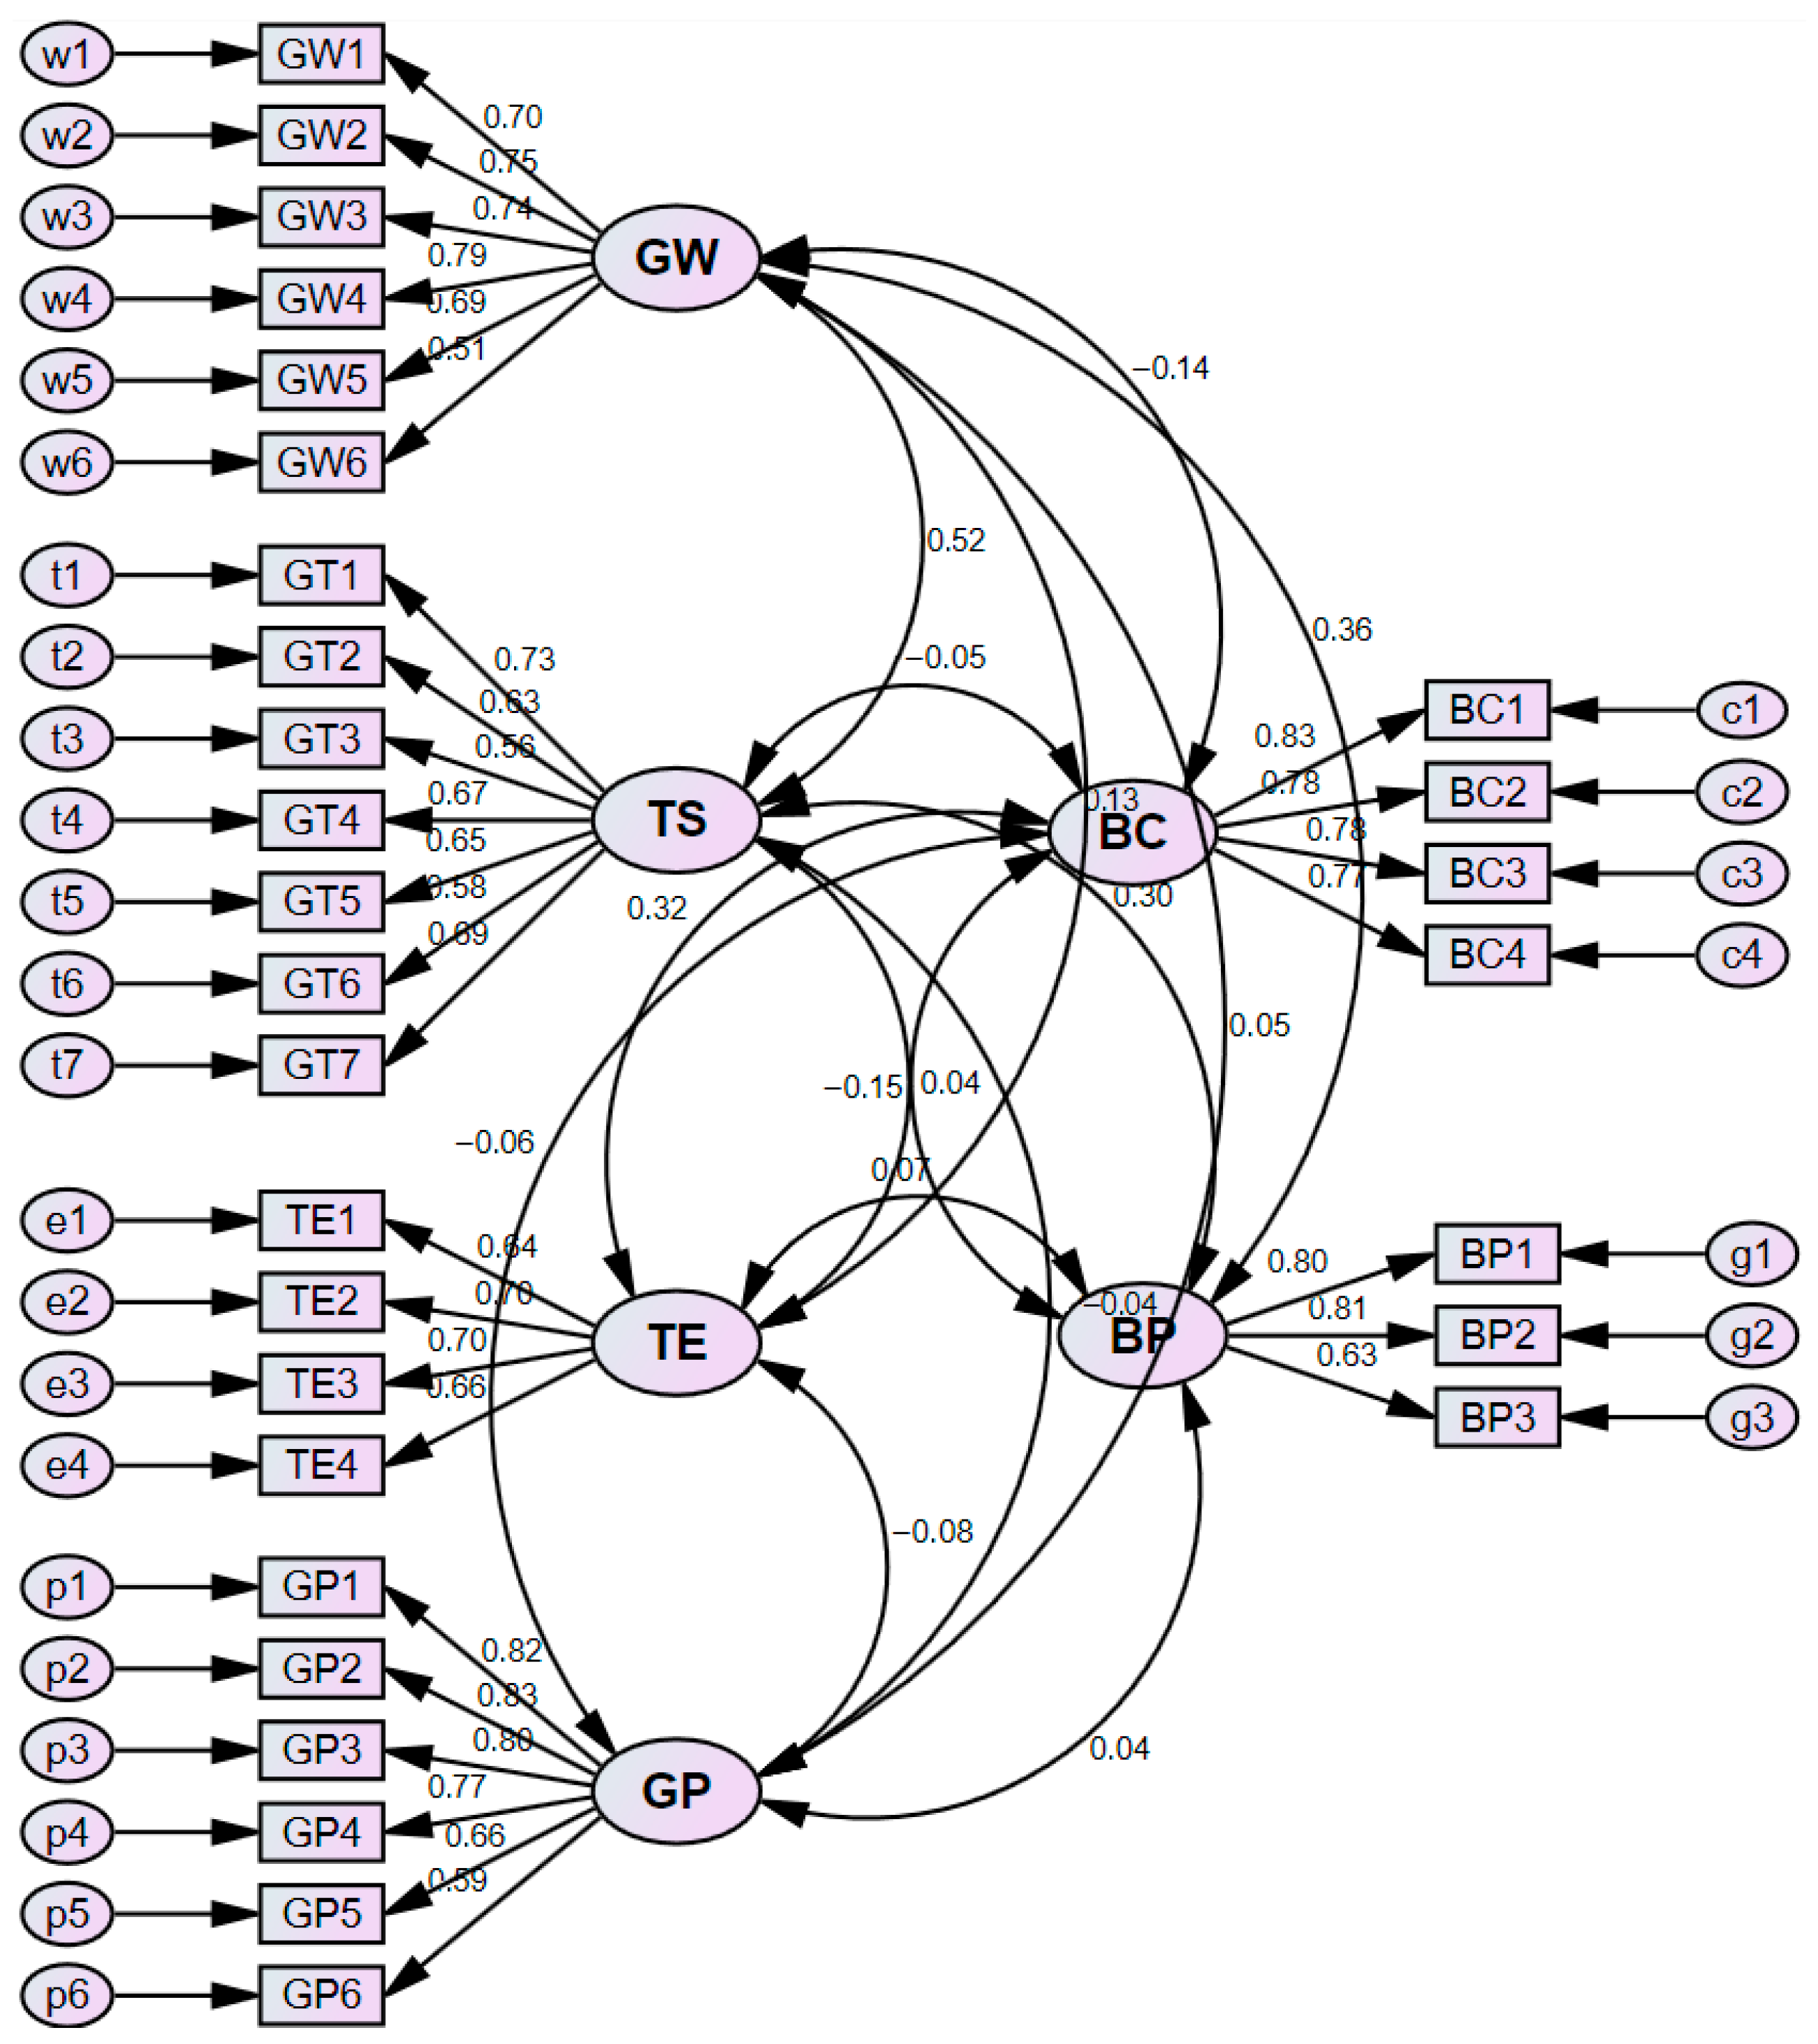
The model demonstrates an acceptable fit, as evidenced by the following goodness-of-fit indices: χ2/df < 3; RMSEA < 0.08; CFI > 0.95; and TLI > 0.95. Green logistics is conceptualized as a higher-order exogenous latent construct comprising four first-order latent variables: green warehouse management (GW), green transportation (TS), green packaging (GP), and green technology (TE). This higher-order construct positively impacts business competitiveness (BC) and, through mediation, sustainable business performance (BP) within the ESG framework (Figure 5).
The measurement model exhibits strong convergent validity, with standardized factor loadings (λ) across all indicators being positive and ranging from 0.510 to 0.833, and the majority exceeding 0.60. Average variance extracted values exceed 0.50 for all constructs, confirming reliability and construct coherence.
Green Warehouse Management (GW): Operationalized by six reflective indicators (GW1–GW6), with loadings from 0.510 to 0.790. The highest loading is for GW4 (space optimization and layout: rational warehouse design and smart racking to minimize travel distance), λ = 0.790, emphasizing efficiency in reducing energy use and costs. GW2 (energy and water management: renewable sources like solar power and LED lighting), λ = 0.746, highlights emission reductions (typically 10–30% through integrated practices). GW3 (waste management and reverse logistics: recycling programs), λ = 0.737, supports circular economy principles with material cost savings of 20–40%. GW1 (sustainable design: eco-friendly materials), λ = 0.704; GW5 (human resources and culture: environmental training), λ = 0.692; and GW6 (natural light and insulation), λ = 0.510, contribute solidly but with lesser unique variance for GW6 (Table 5). Overall, GW enhances operational efficiency, reduces waste, and supports ESG outcomes via lower environmental impacts and costs (15–25% savings in green implementations).
Green Transportation (TS): Measured by seven reflective indicators (GT1–GT7), with loadings from 0.559 to 0.734. GT1 (minimization: load and route optimization), λ = 0.734, underscores the “reduce” principle, yielding 10–30% fuel savings via GPS-enabled systems. GT7 (cooperation and awareness: community engagement and inter-business collaboration), λ = 0.694, aligns with resource-based view (RBV) theory for sustainable networks. GT4 (policies and legislation: government incentives), λ = 0.667; GT5 (daily green practices and leadership commitment), λ = 0.652; GT2 (green vehicles: EVs, hybrids, biofuels), λ = 0.630; GT6 (fuel and emission reduction strategies), λ = 0.584; and GT3 (technology and innovation: management software), λ = 0.559, indicate technological and relational factors. TS extends beyond emissions to improve service reliability and competitiveness through cost advantages and regulatory compliance.
Green Packaging (GP): Assessed by six reflective indicators (GP1–GP6), with loadings from 0.587 to 0.833. GP2 (reuse: reusable packaging systems), λ = 0.833, emphasizes the “reuse” principle, reducing waste by 30–50% over lifecycles. GP1 (minimize materials: weight/volume reduction), λ = 0.817; GP3 (recycle: recycled content), λ = 0.802; GP4 (sustainable materials: biodegradable alternatives), λ = 0.774; GP5 (return/recycle design), λ = 0.664; and GP6 (circular economy: closed-loop lifecycles), λ = 0.587, promote material efficiency. GP minimizes emissions via lighter loads, strengthens brand image, and aligns with circular principles for cost efficiencies and ESG governance.
Green Technology (TE): Evaluated by four reflective indicators (TE1–TE4), with loadings from 0.635 to 0.702. TE3 (regulation and collaboration: compliance and stakeholder partnerships), λ = 0.702, highlights institutional factors. TE2 (supply chain management and tracking software: real-time tools), λ = 0.695; TE4 (optimizing CO2 reduction routes: emission-focused algorithms), λ = 0.657; and TE1 (high-efficiency vehicles and clean fuels), λ = 0.635, emphasize digital integration (AI/IoT) for 15–25% waste reductions. TE enables predictive maintenance and innovation, advancing ESG through efficiency and governance.
Business Competitiveness (BC): Measured by four reflective indicators (BC1–BC4), with loadings from 0.774 to 0.829. BC1 (cost-saving capacity: operational reductions), λ = 0.829; BC2 (service quality and reliability: delivery consistency), λ = 0.779; BC3 (market and customer relationships: positioning and ties), λ = 0.777; and BC4 (technological innovation and adaptation), λ = 0.774, illustrate multifaceted advantages.
Sustainable Business Performance (BP): Operationalized by three ESG-reflective indicators (BP1–BP3), with loadings from 0.632 to 0.810. BP1 (environmental: emission reductions), λ = 0.800; BP2 (social: labor/community improvements), λ = 0.810; and BP3 (governance: transparency/ethics), λ = 0.632, confirm coherence.
Direct effects of GL components on sustainable BP: As illustrated in Table 6, green transportation exerts the strongest direct effect, with a standardized path coefficient (β) of 0.298. This underscores a positive association between adopting eco-friendly transportation practices such as electric vehicles and route optimization to minimize CO2 emissions and sustainable business performance. Green technology follows with β = 0.073, highlighting the role of digital innovations in bolstering sustainability, though moderated by high upfront costs. Green packaging and green warehouse management exhibit weaker effects (β = 0.044 and β = 0.046, respectively), likely because they emphasize waste reduction over direct value creation. Overall, these results affirm positive but heterogeneous direct effects, with green transportation emerging as the dominant predictor in the multivariate model:
BP = β1GT + β2Gtech + β3Gpack + β4GWM + ϵ
where β1 is the largest, GT denotes green transportation, GTech green technology, GPack green packaging, GWM green warehouse management, and ε the error term.
The SEM analyses confirm H1, revealing that green logistics practices, comprising green transportation, warehouse management, packaging, and technology, positively influence business performance via ESG dimensions, as evidenced by aggregate path coefficients indicating resource synergies.
The SEM analyses confirm H2, demonstrating that green logistics practices enhance business competitiveness through augmented capabilities in cost efficiency, service quality and reliability, market and customer relationships, and innovation and technological adaptation.
The SEM analyses confirm H3, with ESG-driven business performance exerting a positive effect on prospective business performance in logistics firms, underscoring longitudinal sustainability linkages.
The SEM analyses confirm H4, wherein elevated business competitiveness positively impacts future business performance, highlighting the mediating function of capability enhancement in fostering sustainable value creation.
These findings recommend prioritizing green transportation for robust direct impacts on sustainable business performance, alongside green technology investments to foster competitiveness. Policymakers could incentivize adoption through tax rebates and digital transformation initiatives, ensuring long-term viability in the logistics sector.
In the realm of sustainable logistics management, executives in the sector should prioritize integrating GPS optimized routing algorithms and adopting electric vehicles, achieving fuel efficiency improvements of 10% to 30%. This strategy empirically supports the resource-based view theory by harnessing firm-specific resources for competitive advantage, while enhancing operational resilience, ensuring regulatory compliance, and fostering long-term sustainable competitiveness in emerging economies through unified green transportation frameworks.
The implementation of reusable and biodegradable packaging systems has been shown to reduce waste by 30% to 50%, advancing circular economy principles. This research highlights alignment with ESG criteria, yielding cost efficiencies, enhanced brand equity, and innovations in materials science, all converging to bolster supply chain sustainability amid market volatility. Leveraging AI and IoT technologies for real-time inventory tracking and emission monitoring can diminish environmental footprints by 15% to 25%, effectively bridging institutional pressures with digital innovations. This study enriches ESG governance literature by outlining pathways for predictive maintenance and multi-stakeholder collaborations, thereby supporting enduring organizational performance and ethical sustainability.

5.2. Gray Model Results

The GM(1,1) was employed to predict the future business performance over the period 2025–2028. To illustrate the computational procedure, total assets (IP1) of DMU4 is used as an example in this section (Table 7).
Generation of the original data sequence:
X(0) = (54.444.491; 59.914.472; 60.890.096; 60.929.635)
Application of the 1-AGO to the original data sequence to generate the accumulated generating sequence:
X(1) = (54.444.491; 114.358.964; 175.249.060; 236.178.695)
Computation of the consecutive neighbor mean sequence:
z ( 2 ) ( 1 ) = 84401727 ;   z ( 3 ) ( 1 ) = 144804012 ;   z ( 4 ) ( 1 ) = 205713877
To find a and b,
59.914.472 + a × 84401727 = b 60.890.096 + a × 144804012 = b 60.929.635 + a × 205713877 = b
B = 84401727 1 144804012 1 205713877 1 ;   Y N = 59.914.472 60.890.096 60.929.635
a b T = θ ^ = ( B T B ) 1 B T Y N = 0.0084 59366471.7203
Establishment of the grey differential equation for the GM(1,1) model:
d x ( 1 ) d k + 0.0084 × x ( 1 ) = 59366471.7203
Find the prediction model from the equation:
X ^ ( k + 1 ) ( 1 ) = [ x ( 1 ) ( 0 ) b a ] × e a k + b a = [ 54.444.491 + 59366471.7203 0.0084 ] × e 0.0084   k 59366471.7203 0.0084
Substitute k to obtain the values of X(1)(k) (in Table 8):
Apply the AGO to obtain the predicted values (in Table 9):
Identical to the above process, we have the following result (Table 10, Table 11, Table 12 and Table 13):
In this study, MAPE is employed to evaluate forecast accuracy, ensuring the appropriateness of the predictive method and providing a reliable basis for subsequent assessments. The results are as follows (Table 14):
MAPE values range from 1.05% (DMU 8) to 8.83% (DMU 9), with an arithmetic mean of 5.00% and a median of 5.37%. The standard deviation of 2.77% indicates moderate variability, suggesting that the GM(1,1) exhibits acceptable stability across the sample. Notably, six decision-making units (DMUs 1, 3, 4, 5, 8, and 10) yield MAPE values below 5%, consistent with highly accurate forecasting benchmarks. The remaining six DMUs (2, 6, 7, 9, 11, and 12) show MAPE between 5% and 10%, classified as good/accurate forecasts according to widely accepted criteria. All MAPE values remain below 10%, confirming the model’s suitability for medium-term projections (2025–2028), a period expected to feature post-pandemic recovery and accelerated digitalization in logistics.


6. Discussion

The empirical results from the SEM analysis reveal significant relationships between green logistics practices and sustainable performance in Vietnamese logistics firms. Among the factors examined, green transportation exhibited a positive association (β = 0.298), underscoring its efficacy in enhancing sustainable business performance through reduced emissions and improved operational efficiency. This finding aligns with the resource-based view theory, wherein ecological innovations foster distinctive competitive resources. In contrast, green technology (β = 0.073), green packaging (β = 0.044), and green warehouse management (β = 0.046) demonstrate comparatively weaker direct impacts, indicating that their contributions are primarily supportive. These elements aid in cost management despite substantial initial investments or facilitate waste minimization without necessitating immediate structural economic changes. The mediating role of competitiveness introduces additional nuance: the negative path coefficient from competitiveness to performance (β = −0.153) indicates that, in the short term, heightened competitiveness may elevate the costs associated with environmental compliance. Furthermore, the indirect effects vary across practices: positive for green warehouse management (0.021) and green transportation (0.008), yet negative for green technology (−0.049), suggesting that upfront green investments can initially diminish short-term returns but ultimately enhance long-term resilience by mitigating competitive pressures. The GM(1,1) complements these insights by projecting performance trajectories from 2025 to 2028, leveraging sparse 2021–2024 financial data with low mean absolute percentage error (MAPE ≈ 5.00%), affirming its robustness for uncertain systems without parametric assumptions. Forecasts indicate moderate growth in revenue and profits, assuming sustained green adoption amid post-pandemic recovery. The integration of SEM and GM(1,1) aims to elucidate causality while providing predictive insights, thereby facilitating the formulation of business strategies. SEM’s path analysis delineates interdependencies among latent constructs, accounting for endogeneity and measurement error, whereas GM(1,1), grounded in gray systems theory, addresses data incompleteness in emerging markets through accumulated generating operations, enabling unbiased projections where conventional forecasting models may underperform. This integration addresses SEM’s temporal constraints and GM(1,1)’s limited multivariate scope, potentially enhancing analytical robustness and promoting synergy between econometrics and systems mathematics. It illustrates the augmentation of incomplete-data frameworks for refined inference, contributing to sustainable supply chain scholarship in resource-limited settings. Findings suggest that Vietnamese SMEs prioritize transportation and technology for ESG integration, while policymakers may foster digitalization through targeted subsidies to bolster sector resilience.

7. Conclusions

In the context of escalating climate change, the European Union’s green economy standards, combined with SEM, have proven instrumental in elucidating causal relationships between green logistics inputs and sustainable business performance as outputs, with competitiveness serving as a mediator. This framework offers a robust empirical foundation, enabling logistics firms to systematically refine their strategies. Practically, it facilitates evidence-based decision making, mitigates financial risks from environmental sanctions, and leverages opportunities in the burgeoning green market particularly in Southeast Asia, where the logistics sector grows at an average annual rate of 8%. This not only bolsters competitive positioning but also drives industry-wide sustainable transitions, aligning with global green economy objectives.
The integration of SEM and the gray model GM(1,1) represents an advanced hybrid methodology, advancing analysis from causal inference to quantitative forecasting specifically for projecting logistics firm performance from 2025 to 2028. SEM yields reliable path coefficients as inputs, while GM(1,1), grounded in gray system theory, adeptly manages sparse or highly stochastic data without stringent probabilistic assumptions required by traditional models like ARIMA or time-series regression. This synergy addresses individual limitations: SEM provides causal depth but lacks temporal forecasting, whereas GM(1,1) excels in prediction yet struggles with complex structural interdependencies. Consequently, the approach enhances reliability, reduces forecast bias amid uncertainty, and fosters hybrid modeling in econometrics. It contributes to economic forecasting theory, especially in sustainable logistics, by illustrating how incomplete-data models can be augmented with structural insights for superior predictions. Moreover, it stimulates interdisciplinary research merging economics with gray systems mathematics, unlocking applications in fields like digital economics or climate risk management. This integration equips strategic management with potent tools, redefines scientific inquiry in green logistics, and supports global sustainable development goals. In increasingly complex econometric landscapes featuring latent variables such as sustainability perceptions or environmental risks, this model promotes cross-disciplinary collaboration among economics, environmental management, and statistics. It also paves new research paths, including evaluations of long-term exogenous impacts on green logistics systems, thereby enriching applied econometric theory amid globalization and digital transformation.

Author Contributions

Methodology, software, validation, formal analysis, data curation: K.H.N. Conceptualization, investigation, writing—original draft preparation: T.V.V. All authors have read and agreed to the published version of the manuscript.

Funding

This research received no external funding.

Institutional Review Board Statement

This study is waived for ethical review as the study does not involve vulnerable populations, such as minors, prisoners, or individuals with impaired decision-making capacity, there are no foreseeable risks greater than those encountered in daily life or routine physical/psychological examinations, and data collection procedures ensure anonymity or confidentiality, with no identifiable information linked to participants by Institution Committee.

Informed Consent Statement

Informed consent for participation was obtained from all subjects involved in the study.

Data Availability Statement

The raw data supporting the conclusions of this article will be made available by the authors on request.

Conflicts of Interest

The authors declare no conflicts of interest.

References

  1. Rodrigue, J.-P.; Slack, B.; Comtois, C. Green logistics. In Handbook of Logistics and Supply-Chain Management; Emerald Group Publishing Limited: Bingley, UK, 2017; Volume 2, pp. 339–350. [Google Scholar] [CrossRef] [Scilit]
  2. Solaymani, S.; Botero, J. Reducing Carbon Emissions from Transport Sector: Experience and Policy Design Considerations. Sustainability 2025, 17, 3762. [Google Scholar] [CrossRef] [Scilit]
  3. Dent, C.M. Trade, Climate and Energy: A New Study on Climate Action through Free Trade Agreements. Energies 2021, 14, 4363. [Google Scholar] [CrossRef] [Scilit]
  4. Ngo, Q.H. The Adoption of Green Market Orientation in Logistic Industries—Empirical Evidence from Vietnamese SMEs. J. Open Innov. Technol. Mark. Complex. 2022, 8, 199. [Google Scholar] [CrossRef] [Scilit]
  5. Nguyen, T.B.L. Digital transformation in Vietnam logistics enterprises. Int. J. Eng. Invent. 2024, 13, 117–122. [Google Scholar]
  6. Nguyen, H.K. Application of mathematical models to assess the impact of the COVID-19 pandemic on logistics businesses and recovery solutions for sustainable development. Mathematics 2021, 9, 1977. [Google Scholar] [CrossRef] [Scilit]
  7. Wang, C.-N.; Cahilig, G. Algorithmic efficiency analysis in innovation-driven labor markets: A Super-SBM and Malmquist productivity index approach. Algorithms 2025, 18, 518. [Google Scholar] [CrossRef] [Scilit]
  8. Carter, C.R.; Rogers, D.S. A framework of sustainable supply chain management: Moving toward new theory. Int. J. Phys. Distrib. Logist. Manag. 2008, 38, 360–387. [Google Scholar] [CrossRef] [Scilit]
  9. Hart, S.L. A natural-resource-based view of the firm. Acad. Manag. Rev. 1995, 20, 986–1014. [Google Scholar] [CrossRef] [Scilit]
  10. Sarkis, J. A boundaries and flows perspective of green supply chain management. Supply Chain. Manag. Int. J. 2012, 17, 202–216. [Google Scholar] [CrossRef] [Scilit]
  11. Zhu, Q.; Sarkis, J. Relationships between operational practices and performance among early adopters of green supply chain management practices in Chinese manufacturing enterprises. J. Oper. Manag. 2004, 22, 265–289. [Google Scholar] [CrossRef]
  12. Hu, L.T.; Bentler, P.M. Cutoff criteria for fit indexes in covariance structure analysis: Conventional criteria versus new alternatives. Struct. Equ. Model. Multidiscip. J. 1999, 6, 1–55. [Google Scholar] [CrossRef] [Scilit]
  13. Porter, M.E. Competitive Advantage: Creating and Sustaining Superior Performance; Free Press: New York, NY, USA, 1985. [Google Scholar]
  14. Barney, J.B. Firm resources and sustained competitive advantage. J. Manag. 1991, 17, 99–120. [Google Scholar] [CrossRef] [Scilit]
  15. Sarkis, J.; Zhu, Q.; Lai, K.-H. An organizational theoretic review of green supply chain management literature. Int. J. Prod. Econ. 2011, 130, 1–15. [Google Scholar] [CrossRef] [Scilit]
  16. Zhu, Q.; Sarkis, J.; Lai, K.-H. Confirmation of a measurement model for green supply chain management practices implementation. Int. J. Prod. Econ. 2008, 111, 261–273. [Google Scholar] [CrossRef] [Scilit]
  17. Bai, C.; Sarkis, J. Integrating sustainability into supplier selection with grey system and rough set methodologies. Int. J. Prod. Econ. 2010, 124, 252–264. [Google Scholar] [CrossRef] [Scilit]
  18. Montabon, F.; Pagell, M.; Wu, Z. Making sustainability sustainable. J. Supply Chain Manag. 2016, 52, 11–27. [Google Scholar] [CrossRef] [Scilit]
  19. Deng, J. Control problems of grey systems. Syst. Control Lett. 1982, 1, 288–294. [Google Scholar] [CrossRef] [Scilit]
  20. Deng, J. Introduction to grey system theory. J. Grey Syst. 1989, 1, 1–24. [Google Scholar]
  21. Liu, S.; Lin, Y. Grey Systems: Theory and Applications; Springer: Berlin/Heidelberg, Germany, 2010. [Google Scholar] [CrossRef] [Scilit]
  22. Wu, L.; Liu, S.; Fang, Z.; Xu, H. Properties of the GM(1,1) with fractional order accumulation. Appl. Math. Comput. 2015, 252, 287–293. [Google Scholar] [CrossRef] [Scilit]
  23. Shan, X.; Cao, Y. Forecasting Guangdong’s Marine Science and Technology, Marine Economy, and Employed Persons by Coastal Regions-Based on Rolling Grey MGM(1,m) Model. Water 2022, 14, 824. [Google Scholar] [CrossRef] [Scilit]
  24. Li, Q.; Zhang, X. Neural Multivariate Grey Model and Its Applications. Appl. Sci. 2024, 14, 1219. [Google Scholar] [CrossRef] [Scilit]
Figure 1. Intellectual structure through keyword co-occurrence.
Logistics 10 00052 g001
Figure 2. Dominant theoretical frameworks via co-citation analysis.
Logistics 10 00052 g002
Figure 3. Research communities through bibliographic coupling.
Logistics 10 00052 g003
Figure 4. Research development.
Logistics 10 00052 g004
Figure 5. SEM results.
Logistics 10 00052 g005
Table 1. Data in 2021.
DMUsIP1IP2IP3IP4OP1OP2
DMU182.15220.7851983.97827.7241.341
DMU29.6264.1559621476.244940
DMU326.0486.039475210.1453.257
DMU454.44413.9131471.64620.3412.953
DMU549.85858.5701981.41462.6342.151
DMU635.84162.1162.91974271.0816.719
DMU7103.04092.0833.5255.151110.8079.468
DMU834.05937.7029682.37145.5174.356
DMU921.26715.1613232.55028.4908.584
DMU10125.39049.5101.8523.11772.63515.885
DMU1143.83323.9667091.84634.2626.172
DMU12411.94779.2515.91711.316123.08227.661
Table 2. Data in 2022.
DMUsIP1IP2IP3IP4OP1OP2
DMU1116.35161.9923217.52875.9975.844
DMU29.8074.1171.4952016.462639
DMU327.0255.32013290410.1243.479
DMU459.91414.6161532.13322.3803.711
DMU557.34964.4831822.01070.8143.117
DMU638.25056.9342.88788866.1958.231
DMU7106.87383.9663.0744.978101.3159.734
DMU831.35943.1611.2712.60152.0184.793
DMU919.21714.4813962.66028.2509.105
DMU10167.63251.7723.0404.04677.05915.092
DMU1147.53426.9607542.12740.9818.990
DMU12500.21783.6925.45820.132149.64544.579
Table 3. Data in 2023.
DMUsIP1IP2IP3IP4OP1OP2
DMU1117.08764.1434756.64173.7161.037
DMU210.2663.9411.7632596.613638
DMU325.9166.7626795311.7583.781
DMU460.89012.3271452.22220.4043.988
DMU558.40861.8521831.92767.7613.251
DMU634.19832.2972.87890939.0613.959
DMU7110.12257.8612.8704.98268.9305.784
DMU836.10349.5271.3502.69458.7115.160
DMU921.29213.9254562.90826.9408.322
DMU10199.26858.5993.6115.10183.7217.640
DMU1152.18128.3468152.04744.80811.308
DMU12520.00179.3794.20521.189147.63297.272
Table 4. Data in 2024.
DMUsIP1IP2IP3IP4OP1OP2
DMU1125.56261.8256727.63773.5522.053
DMU210.0793.6191.5452436.117623
DMU326.1697.029431.23112.3833.806
DMU460.93011.7431601.79619.0473.962
DMU564.96378.9412122.63886.2573.864
DMU635.35335.8002.73083441.7573.009
DMU7117.16679.0943.1385.81994.2167.825
DMU842.63553.0801.1742.82562.6175.613
DMU928.44019.4418043.50035.34110.228
DMU10299.23774.6435.8677.008107.02216.297
DMU1159.45232.1978552.34951.33613.330
DMU12690.896103.5149.48922.067185.49073.842
Table 5. Standardized regression weights.
Estimate Estimate Estimate
GW3GW0.737GP2GP0.833GW6GW0.510
GW2GW0.746GP1GP0.817GT4TS0.667
GW1GW0.704BP1BP0.800GT5TS0.652
TE3TE0.702BP2BP0.810GT6TS0.584
TE2TE0.695BP3BP0.631GT7TS0.694
TE1TE0.635BC1BC0.829TE4TE0.657
GT3TS0.559BC2BC0.779GP4GP0.774
GT2TS0.630BC3BC0.777GP5GP0.664
GT1TS0.734GW4GW0.790BC4BC0.774
GP3GP0.802GW5GW0.692GP6 GP0.587
Table 6. Covariances.
Estimate Estimate Estimate
GWTS0.523TETS0.042TEBP0.073
GWTE0.129TSGP−0.039TEBC0.320
GWGP0.046TSBC−0.053GPBP0.044
GWBC−0.136TSBP0.298BPBC−0.153
GWBP0.355TEGP−0.081GPBC−0.062
Table 7. Total assets (IP1) of DMU4.
Year2021202220232024
IP154.444.49159.914.47260.890.09660.929.635
Table 8. Values of X(1)(k).
KX(1)(1–4)KX(1)(5–8)
054,444,4914297,774,981
1114,516,6505359,889,267
2175,092,9576422,524,839
3236,177,6467485,686,075
Table 9. Values of X(0)(k).
KX(0)(1–4)KX(0)(5–8)
054,444,491461,597,336—forecast of 2025
160,072,158562,114,285—forecast of 2026
260,676,308662,635,573—forecast of 2027
361,084,688763,161,236—forecast of 2028
Table 10. Result forecast of 2025.
DMUsIP1IP2IP3IP4OP1OP2
DMU1129.26462.4899467.38471.997395
DMU210.3233.4221.6492786.065618
DMU325.5188.204221.41213.8234.023
DMU461.59710.2151611.74717.4734.140
DMU568.36484.9122252.93792.5154.244
DMU633.06122.8672.68082527.3711.459
DMU7122.12168.3543.0946.17980.4835.829
DMU849.47059.2121.1742.93969.0656.064
DMU934.10621.9111.1223.97538.38410.457
DMU10393.25888.6307.9979.097124.37814.570
DMU1166.15634.8629142.41357.11916.200
DMU12796.797111.69312.30523.131201.682100.473
Table 11. Result forecast of 2026.
DMUsIP1IP2IP3IP4OP1OP2
DMU1134.39262.4061.3567.44270.819166
DMU210.4623.2121.6733035.907611
DMU325.1049.342121.66515.2374.203
DMU462.1149.1161651.61516.1104.274
DMU572.89394.8622443.419103.0694.747
DMU631.72317.2312.60780120.788831
DMU7127.92965.8763.1276.70876.9395.068
DMU857.73965.5061.1313.06475.6386.564
DMU941.97325.8551.6734.57843.44711.148
DMU10536.051107.13011.45112.045147.83015.434
DMU1174.08038.1839722.54364.03419.632
DMU12948.576125.63217.88124.213226.487119.252
Table 12. Result forecast of 2027.
DMUsIP1IP2IP3IP4OP1OP2
DMU1139.72362.3241.9427.50169.66070
DMU210.6033.0141.6993305.752603
DMU324.69710.63871.96216.7964.392
DMU462.6368.1351691.49214.8534.412
DMU577.723105.9772643.981114.8275.310
DMU630.44012.9842.53777715.788473
DMU7134.01363.4883.1627.28273.5524.406
DMU867.39072.4681.0903.19482.8387.106
DMU951.65330.5082.4945.27349.17811.884
DMU10730.69412916.39715.948175.70516.349
DMU1182.95341.8211.0352.68171.78623.790
DMU121.129.267141.31025.98425.345254.343141.539
Table 13. Result forecast of 2028.
DMUsIP1IP2IP3IP4OP1OP2
DMU1145.26562.2422.7827.56068.52029
DMU210.7462.8281.7243605.602596
DMU324.29612.11442.31318.5154.588
DMU463.1617.2601731.37913.6954.555
DMU582.872118.3952854.634127.9265.939
DMU629.2089.7842.46875411.991270
DMU7140.38661.1873.1967.90470.3133.831
DMU878.65480.1701.0513.32990.7237.692
DMU963.56635.9983.7186.07455.66612.669
DMU10996.013156.52123.48021.115208.83517.318
DMU1192.88945.8041.1012.82680.47828.830
DMU121.344.377158.94537.75826.531285.625167.992
Table 14. MAPE.
Table 14. MAPE.
DMUs123456
MAPE (%)2.458.643.631.801.205.82
DMUs789101112
MAPE (%)7.241.058.834.927.132.35
Disclaimer/Publisher’s Note: The statements, opinions and data contained in all publications are solely those of the individual author(s) and contributor(s) and not of MDPI and/or the editor(s). MDPI and/or the editor(s) disclaim responsibility for any injury to people or property resulting from any ideas, methods, instructions or products referred to in the content.