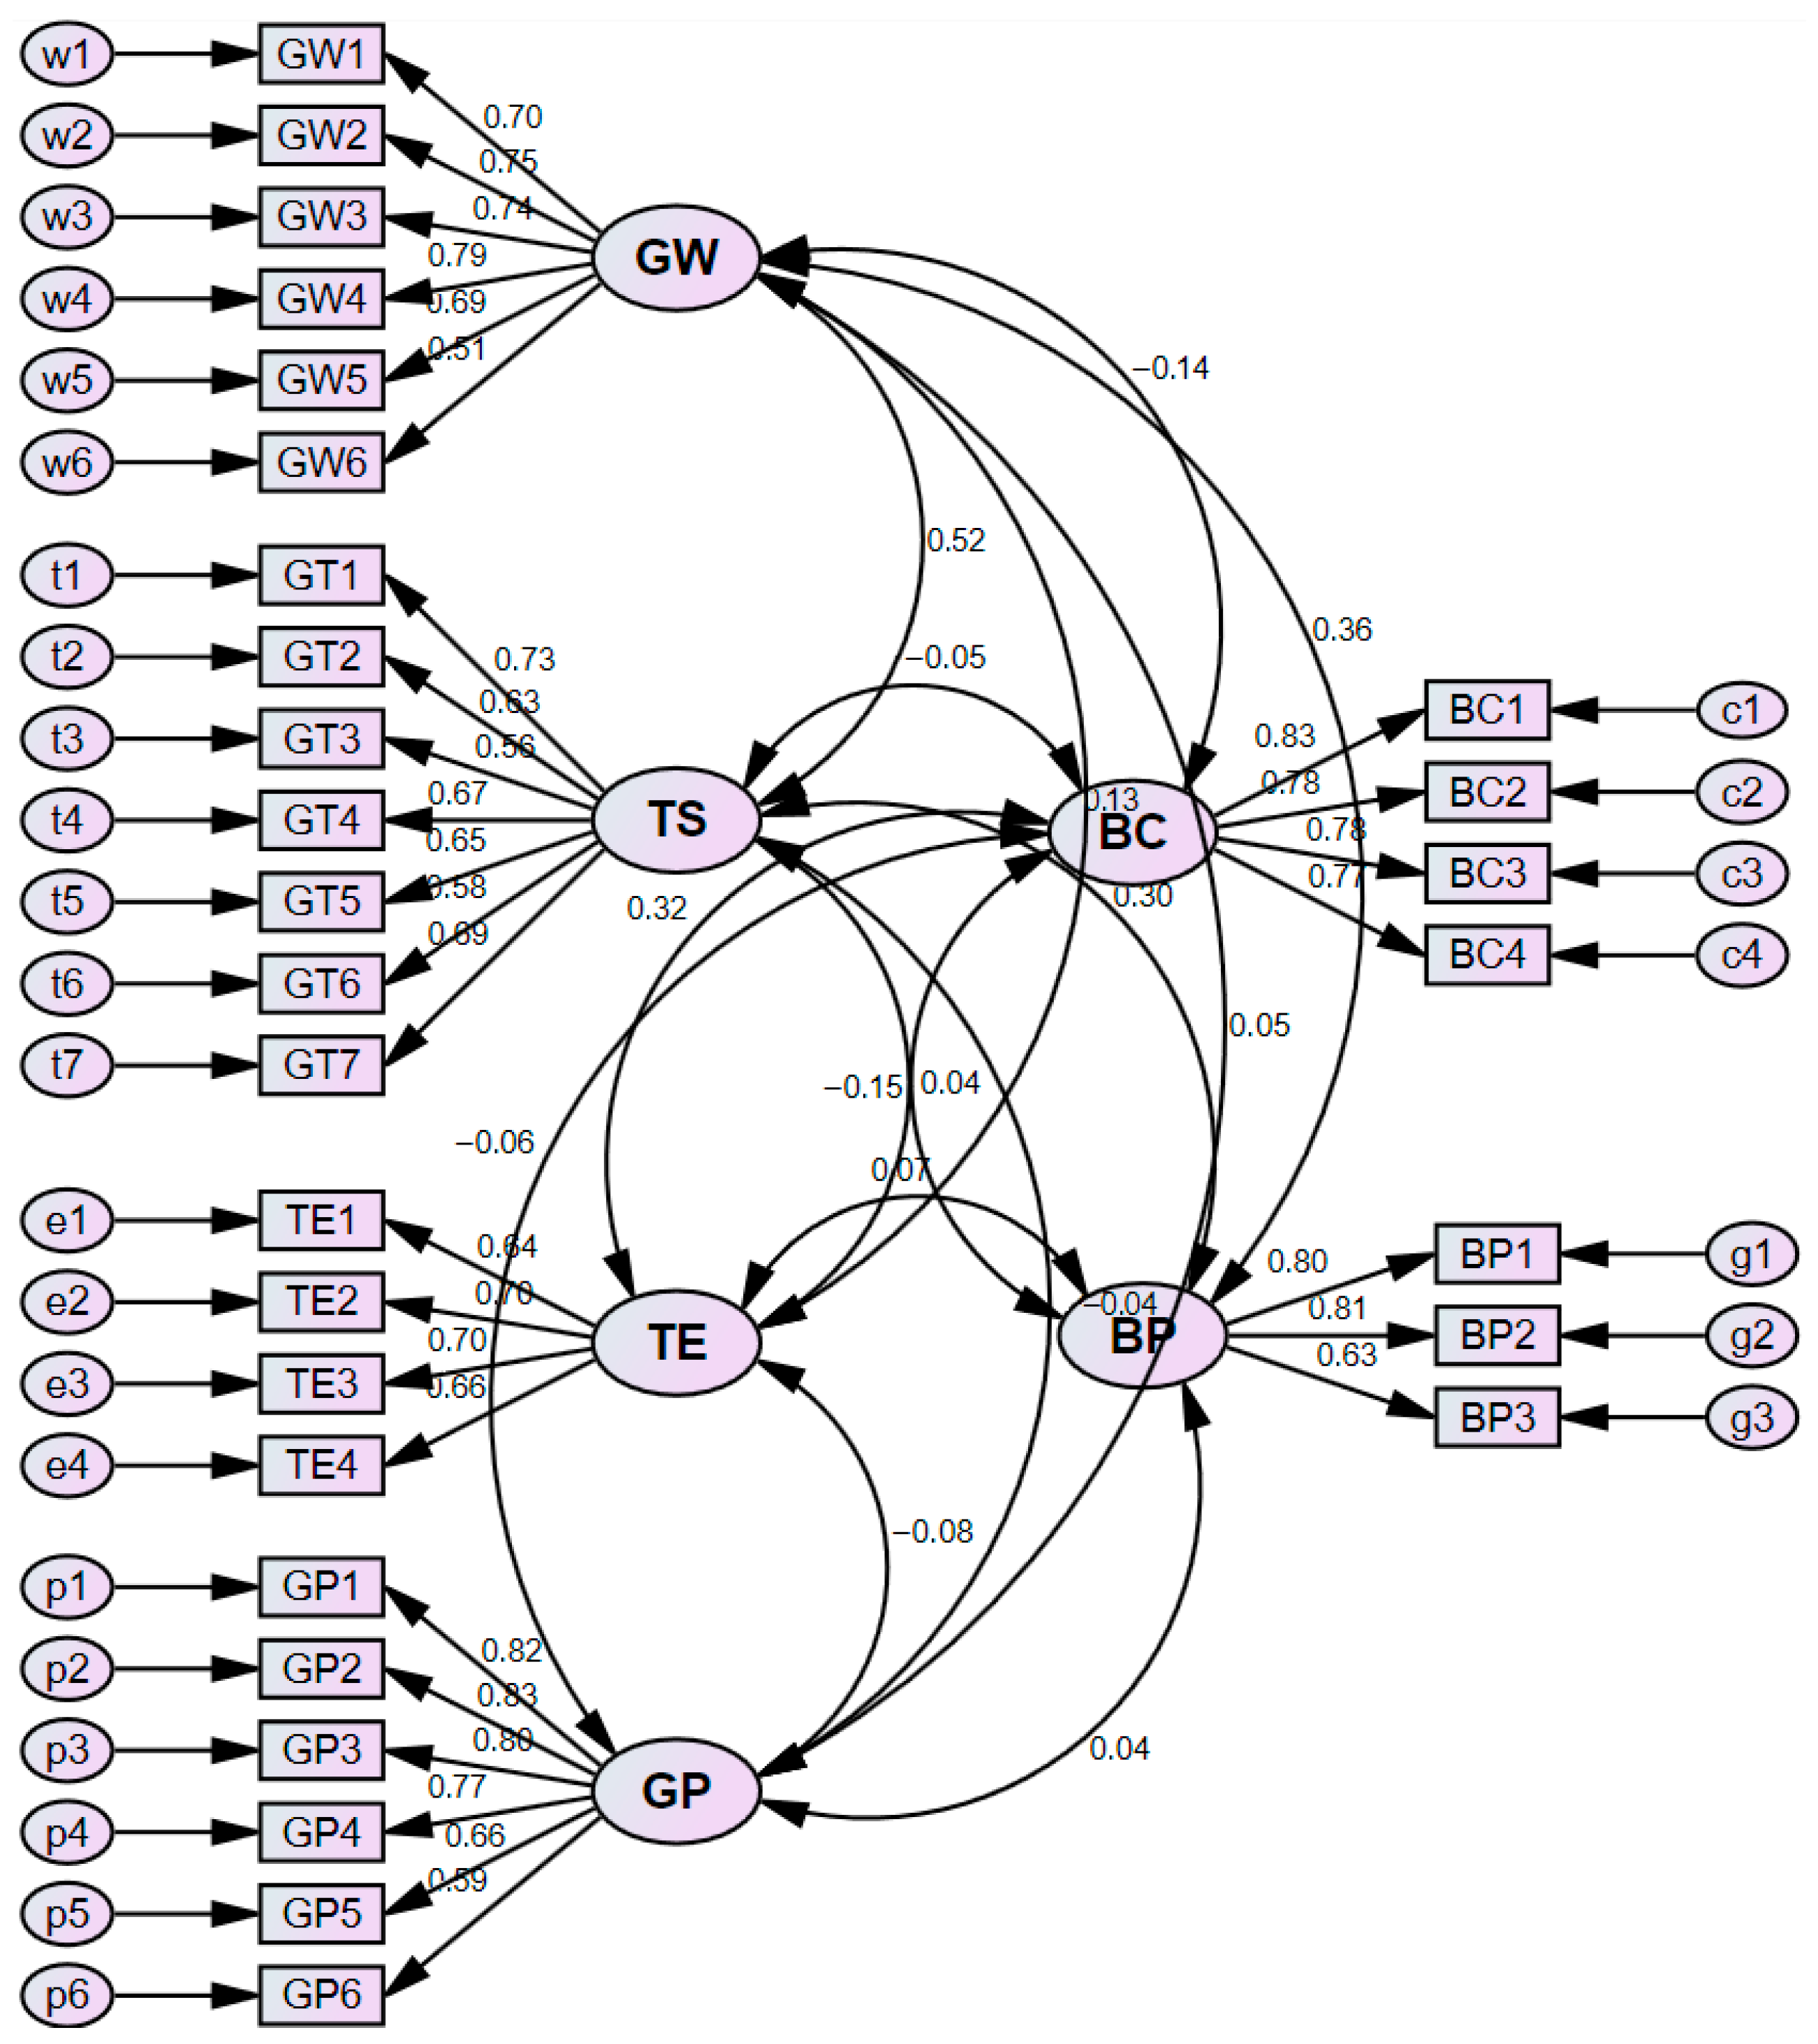
5.1. SEM Results
The model demonstrates an acceptable fit, as evidenced by the following goodness-of-fit indices: χ
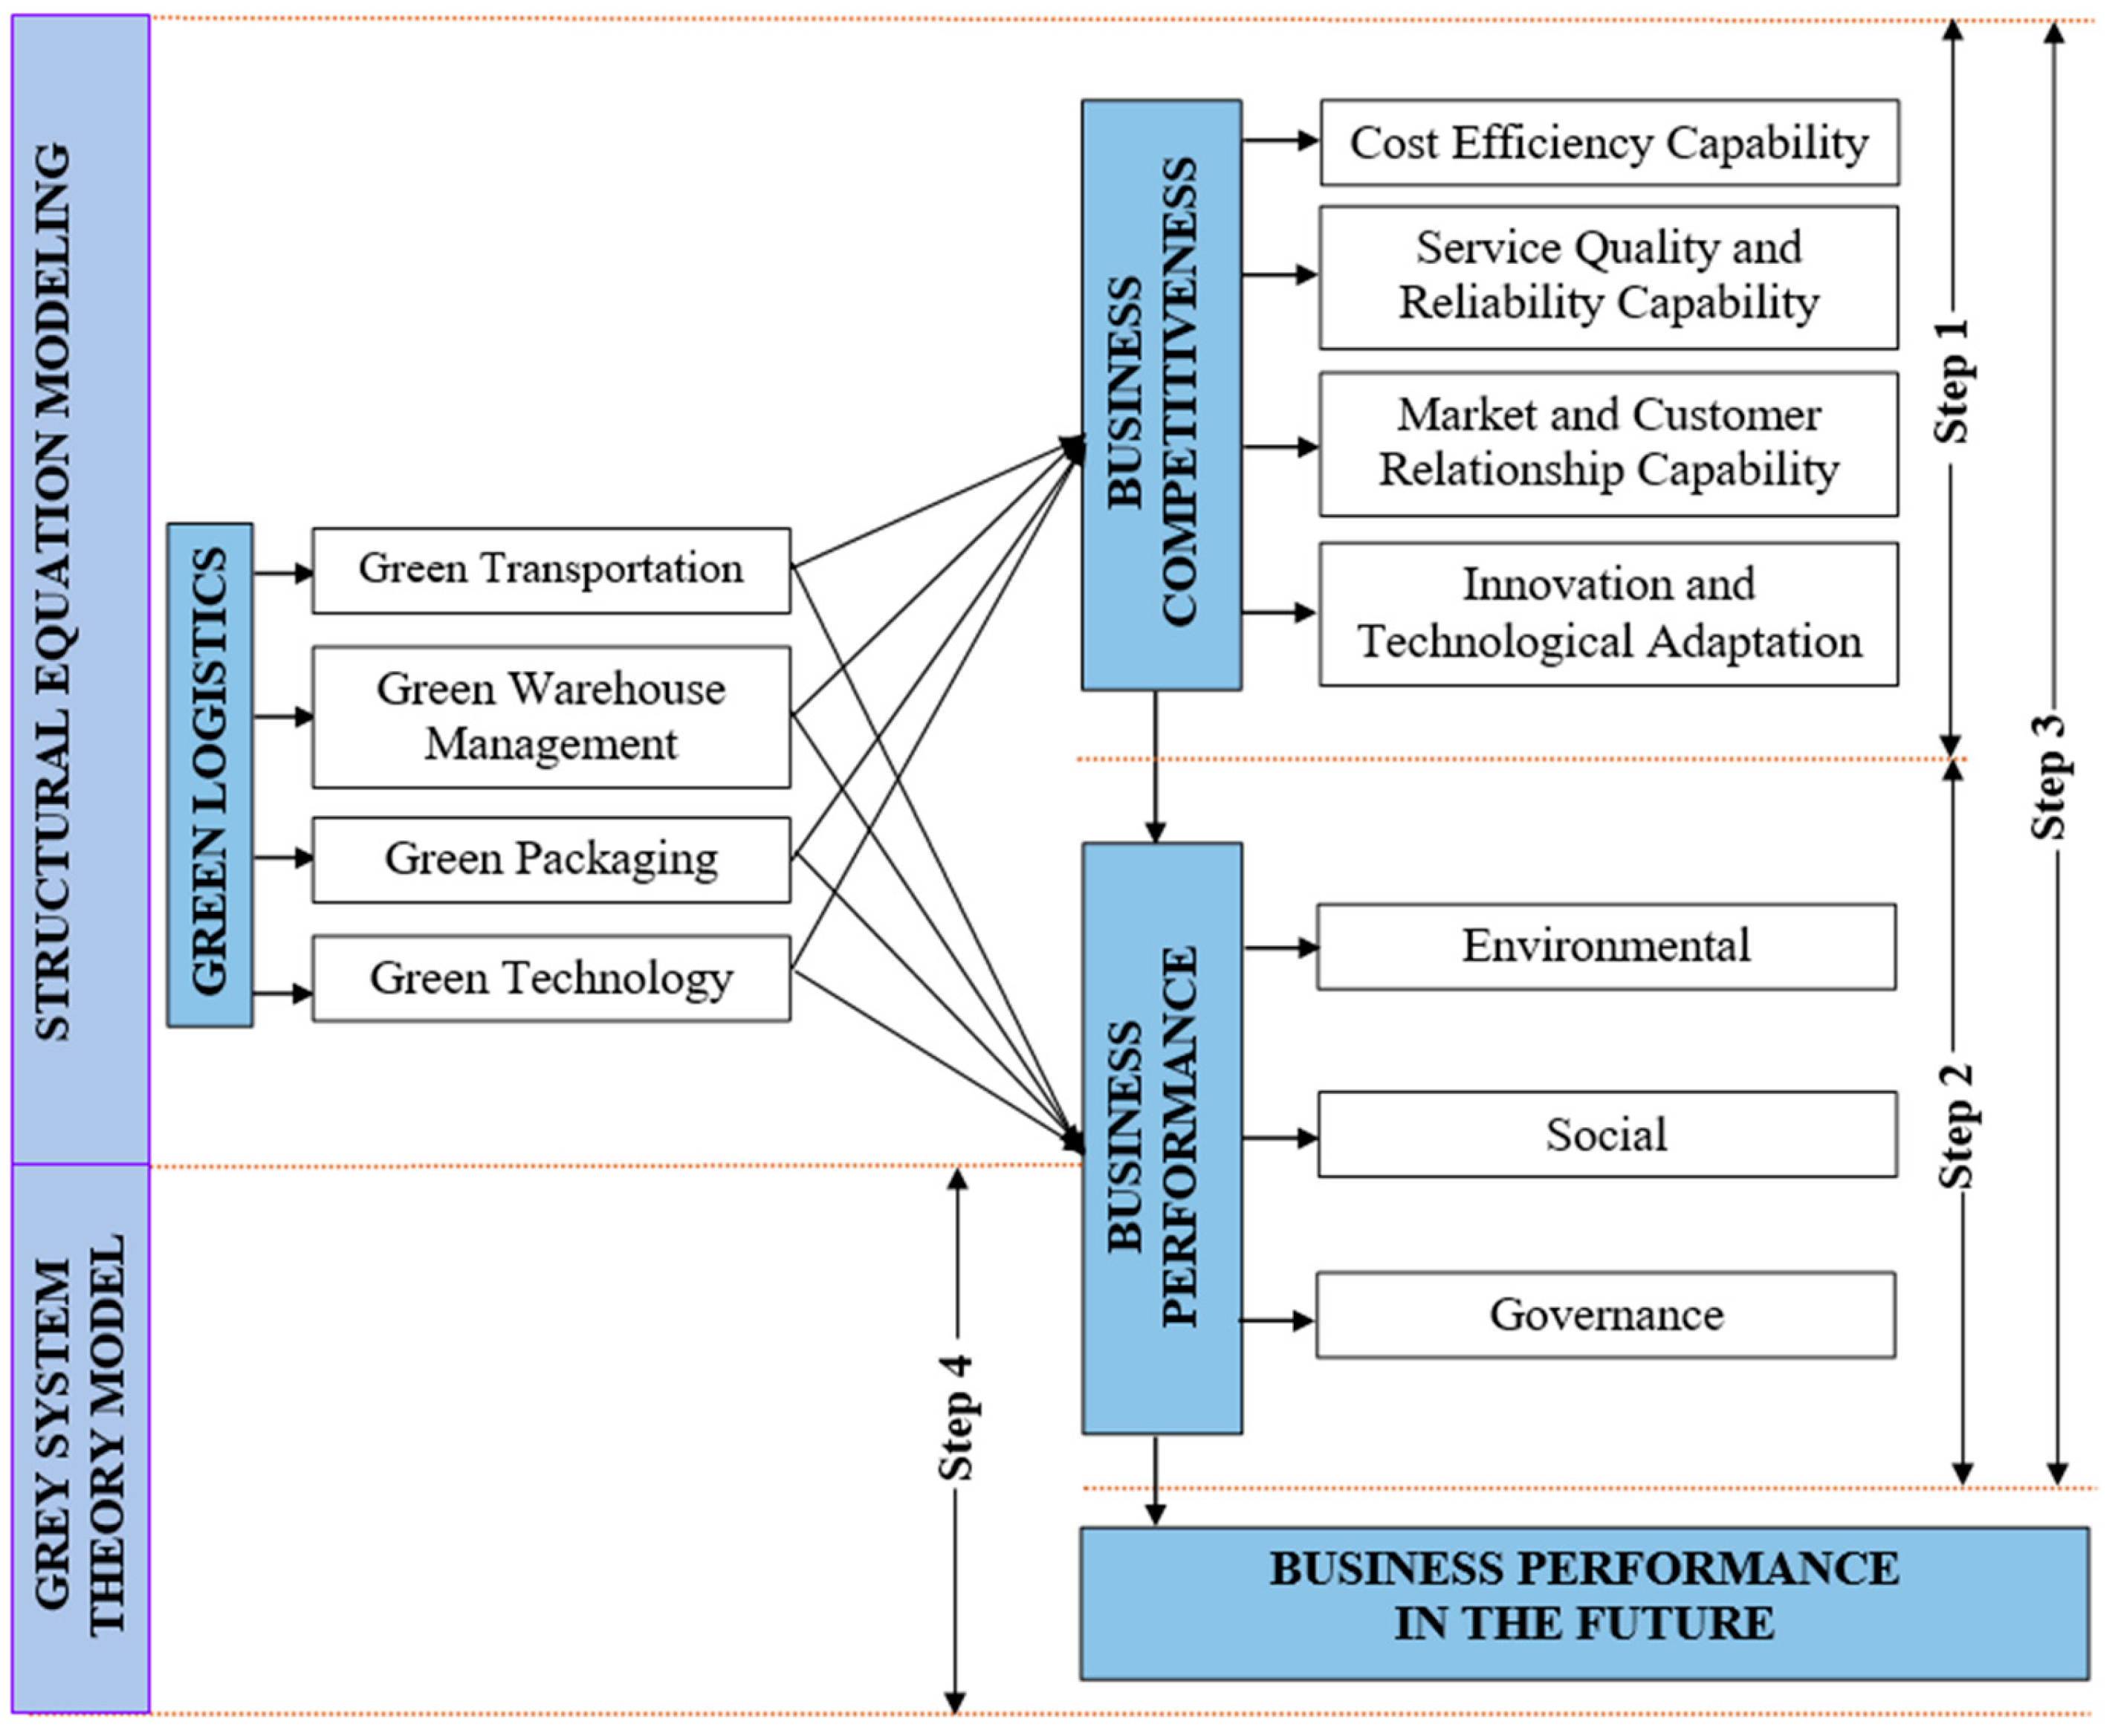
2/df < 3; RMSEA < 0.08; CFI > 0.95; and TLI > 0.95. Green logistics is conceptualized as a higher-order exogenous latent construct comprising four first-order latent variables: green warehouse management (GW), green transportation (TS), green packaging (GP), and green technology (TE). This higher-order construct positively impacts business competitiveness (BC) and, through mediation, sustainable business performance (BP) within the ESG framework (
Figure 5).
The measurement model exhibits strong convergent validity, with standardized factor loadings (λ) across all indicators being positive and ranging from 0.510 to 0.833, and the majority exceeding 0.60. Average variance extracted values exceed 0.50 for all constructs, confirming reliability and construct coherence.
Green Warehouse Management (GW): Operationalized by six reflective indicators (GW1–GW6), with loadings from 0.510 to 0.790. The highest loading is for GW4 (space optimization and layout: rational warehouse design and smart racking to minimize travel distance), λ = 0.790, emphasizing efficiency in reducing energy use and costs. GW2 (energy and water management: renewable sources like solar power and LED lighting), λ = 0.746, highlights emission reductions (typically 10–30% through integrated practices). GW3 (waste management and reverse logistics: recycling programs), λ = 0.737, supports circular economy principles with material cost savings of 20–40%. GW1 (sustainable design: eco-friendly materials), λ = 0.704; GW5 (human resources and culture: environmental training), λ = 0.692; and GW6 (natural light and insulation), λ = 0.510, contribute solidly but with lesser unique variance for GW6 (
Table 5). Overall, GW enhances operational efficiency, reduces waste, and supports ESG outcomes via lower environmental impacts and costs (15–25% savings in green implementations).
Green Transportation (TS): Measured by seven reflective indicators (GT1–GT7), with loadings from 0.559 to 0.734. GT1 (minimization: load and route optimization), λ = 0.734, underscores the “reduce” principle, yielding 10–30% fuel savings via GPS-enabled systems. GT7 (cooperation and awareness: community engagement and inter-business collaboration), λ = 0.694, aligns with resource-based view (RBV) theory for sustainable networks. GT4 (policies and legislation: government incentives), λ = 0.667; GT5 (daily green practices and leadership commitment), λ = 0.652; GT2 (green vehicles: EVs, hybrids, biofuels), λ = 0.630; GT6 (fuel and emission reduction strategies), λ = 0.584; and GT3 (technology and innovation: management software), λ = 0.559, indicate technological and relational factors. TS extends beyond emissions to improve service reliability and competitiveness through cost advantages and regulatory compliance.
Green Packaging (GP): Assessed by six reflective indicators (GP1–GP6), with loadings from 0.587 to 0.833. GP2 (reuse: reusable packaging systems), λ = 0.833, emphasizes the “reuse” principle, reducing waste by 30–50% over lifecycles. GP1 (minimize materials: weight/volume reduction), λ = 0.817; GP3 (recycle: recycled content), λ = 0.802; GP4 (sustainable materials: biodegradable alternatives), λ = 0.774; GP5 (return/recycle design), λ = 0.664; and GP6 (circular economy: closed-loop lifecycles), λ = 0.587, promote material efficiency. GP minimizes emissions via lighter loads, strengthens brand image, and aligns with circular principles for cost efficiencies and ESG governance.
Green Technology (TE): Evaluated by four reflective indicators (TE1–TE4), with loadings from 0.635 to 0.702. TE3 (regulation and collaboration: compliance and stakeholder partnerships), λ = 0.702, highlights institutional factors. TE2 (supply chain management and tracking software: real-time tools), λ = 0.695; TE4 (optimizing CO2 reduction routes: emission-focused algorithms), λ = 0.657; and TE1 (high-efficiency vehicles and clean fuels), λ = 0.635, emphasize digital integration (AI/IoT) for 15–25% waste reductions. TE enables predictive maintenance and innovation, advancing ESG through efficiency and governance.
Business Competitiveness (BC): Measured by four reflective indicators (BC1–BC4), with loadings from 0.774 to 0.829. BC1 (cost-saving capacity: operational reductions), λ = 0.829; BC2 (service quality and reliability: delivery consistency), λ = 0.779; BC3 (market and customer relationships: positioning and ties), λ = 0.777; and BC4 (technological innovation and adaptation), λ = 0.774, illustrate multifaceted advantages.
Sustainable Business Performance (BP): Operationalized by three ESG-reflective indicators (BP1–BP3), with loadings from 0.632 to 0.810. BP1 (environmental: emission reductions), λ = 0.800; BP2 (social: labor/community improvements), λ = 0.810; and BP3 (governance: transparency/ethics), λ = 0.632, confirm coherence.
Direct effects of GL components on sustainable BP: As illustrated in
Table 6, green transportation exerts the strongest direct effect, with a standardized path coefficient (β) of 0.298. This underscores a positive association between adopting eco-friendly transportation practices such as electric vehicles and route optimization to minimize CO
2 emissions and sustainable business performance. Green technology follows with β = 0.073, highlighting the role of digital innovations in bolstering sustainability, though moderated by high upfront costs. Green packaging and green warehouse management exhibit weaker effects (β = 0.044 and β = 0.046, respectively), likely because they emphasize waste reduction over direct value creation. Overall, these results affirm positive but heterogeneous direct effects, with green transportation emerging as the dominant predictor in the multivariate model:
where
β1 is the largest, GT denotes green transportation, GTech green technology, GPack green packaging, GWM green warehouse management, and ε the error term.
The SEM analyses confirm H1, revealing that green logistics practices, comprising green transportation, warehouse management, packaging, and technology, positively influence business performance via ESG dimensions, as evidenced by aggregate path coefficients indicating resource synergies.
The SEM analyses confirm H2, demonstrating that green logistics practices enhance business competitiveness through augmented capabilities in cost efficiency, service quality and reliability, market and customer relationships, and innovation and technological adaptation.
The SEM analyses confirm H3, with ESG-driven business performance exerting a positive effect on prospective business performance in logistics firms, underscoring longitudinal sustainability linkages.
The SEM analyses confirm H4, wherein elevated business competitiveness positively impacts future business performance, highlighting the mediating function of capability enhancement in fostering sustainable value creation.
These findings recommend prioritizing green transportation for robust direct impacts on sustainable business performance, alongside green technology investments to foster competitiveness. Policymakers could incentivize adoption through tax rebates and digital transformation initiatives, ensuring long-term viability in the logistics sector.
In the realm of sustainable logistics management, executives in the sector should prioritize integrating GPS optimized routing algorithms and adopting electric vehicles, achieving fuel efficiency improvements of 10% to 30%. This strategy empirically supports the resource-based view theory by harnessing firm-specific resources for competitive advantage, while enhancing operational resilience, ensuring regulatory compliance, and fostering long-term sustainable competitiveness in emerging economies through unified green transportation frameworks.
The implementation of reusable and biodegradable packaging systems has been shown to reduce waste by 30% to 50%, advancing circular economy principles. This research highlights alignment with ESG criteria, yielding cost efficiencies, enhanced brand equity, and innovations in materials science, all converging to bolster supply chain sustainability amid market volatility. Leveraging AI and IoT technologies for real-time inventory tracking and emission monitoring can diminish environmental footprints by 15% to 25%, effectively bridging institutional pressures with digital innovations. This study enriches ESG governance literature by outlining pathways for predictive maintenance and multi-stakeholder collaborations, thereby supporting enduring organizational performance and ethical sustainability.
5.2. Gray Model Results
The GM(1,1) was employed to predict the future business performance over the period 2025–2028. To illustrate the computational procedure, total assets (IP1) of DMU4 is used as an example in this section (
Table 7).
Generation of the original data sequence:
Application of the 1-AGO to the original data sequence to generate the accumulated generating sequence:
Computation of the consecutive neighbor mean sequence:
Establishment of the grey differential equation for the GM(1,1) model:
Find the prediction model from the equation:
Substitute
k to obtain the values of X
(1)(k) (in
Table 8):
Apply the AGO to obtain the predicted values (in
Table 9):
In this study, MAPE is employed to evaluate forecast accuracy, ensuring the appropriateness of the predictive method and providing a reliable basis for subsequent assessments. The results are as follows (
Table 14):
MAPE values range from 1.05% (DMU 8) to 8.83% (DMU 9), with an arithmetic mean of 5.00% and a median of 5.37%. The standard deviation of 2.77% indicates moderate variability, suggesting that the GM(1,1) exhibits acceptable stability across the sample. Notably, six decision-making units (DMUs 1, 3, 4, 5, 8, and 10) yield MAPE values below 5%, consistent with highly accurate forecasting benchmarks. The remaining six DMUs (2, 6, 7, 9, 11, and 12) show MAPE between 5% and 10%, classified as good/accurate forecasts according to widely accepted criteria. All MAPE values remain below 10%, confirming the model’s suitability for medium-term projections (2025–2028), a period expected to feature post-pandemic recovery and accelerated digitalization in logistics.