Associations between Psycho-Hedonic Responses to Sweet and Savoury Tastes with Diet and Body Composition in a Sample of Asian Females


Abstract
1. Introduction
2. Materials and Methods
2.1. Experimental Overview
2.2. Sample Size Calculation
2.3. Study Participants
2.4. Taste Preference Assessment
2.4.1. Staircase Paired Preference Method—Sweetness and Savouriness Preferences
2.4.2. Sweet-Liker Phenotypes Classification Method
2.5. Dietary Assessment
Dietary “Taste Clusters” Method
2.6. Anthropometric and Physical Activity Assessment
2.7. Data Analysis
3. Results
3.1. Participants Characterisics
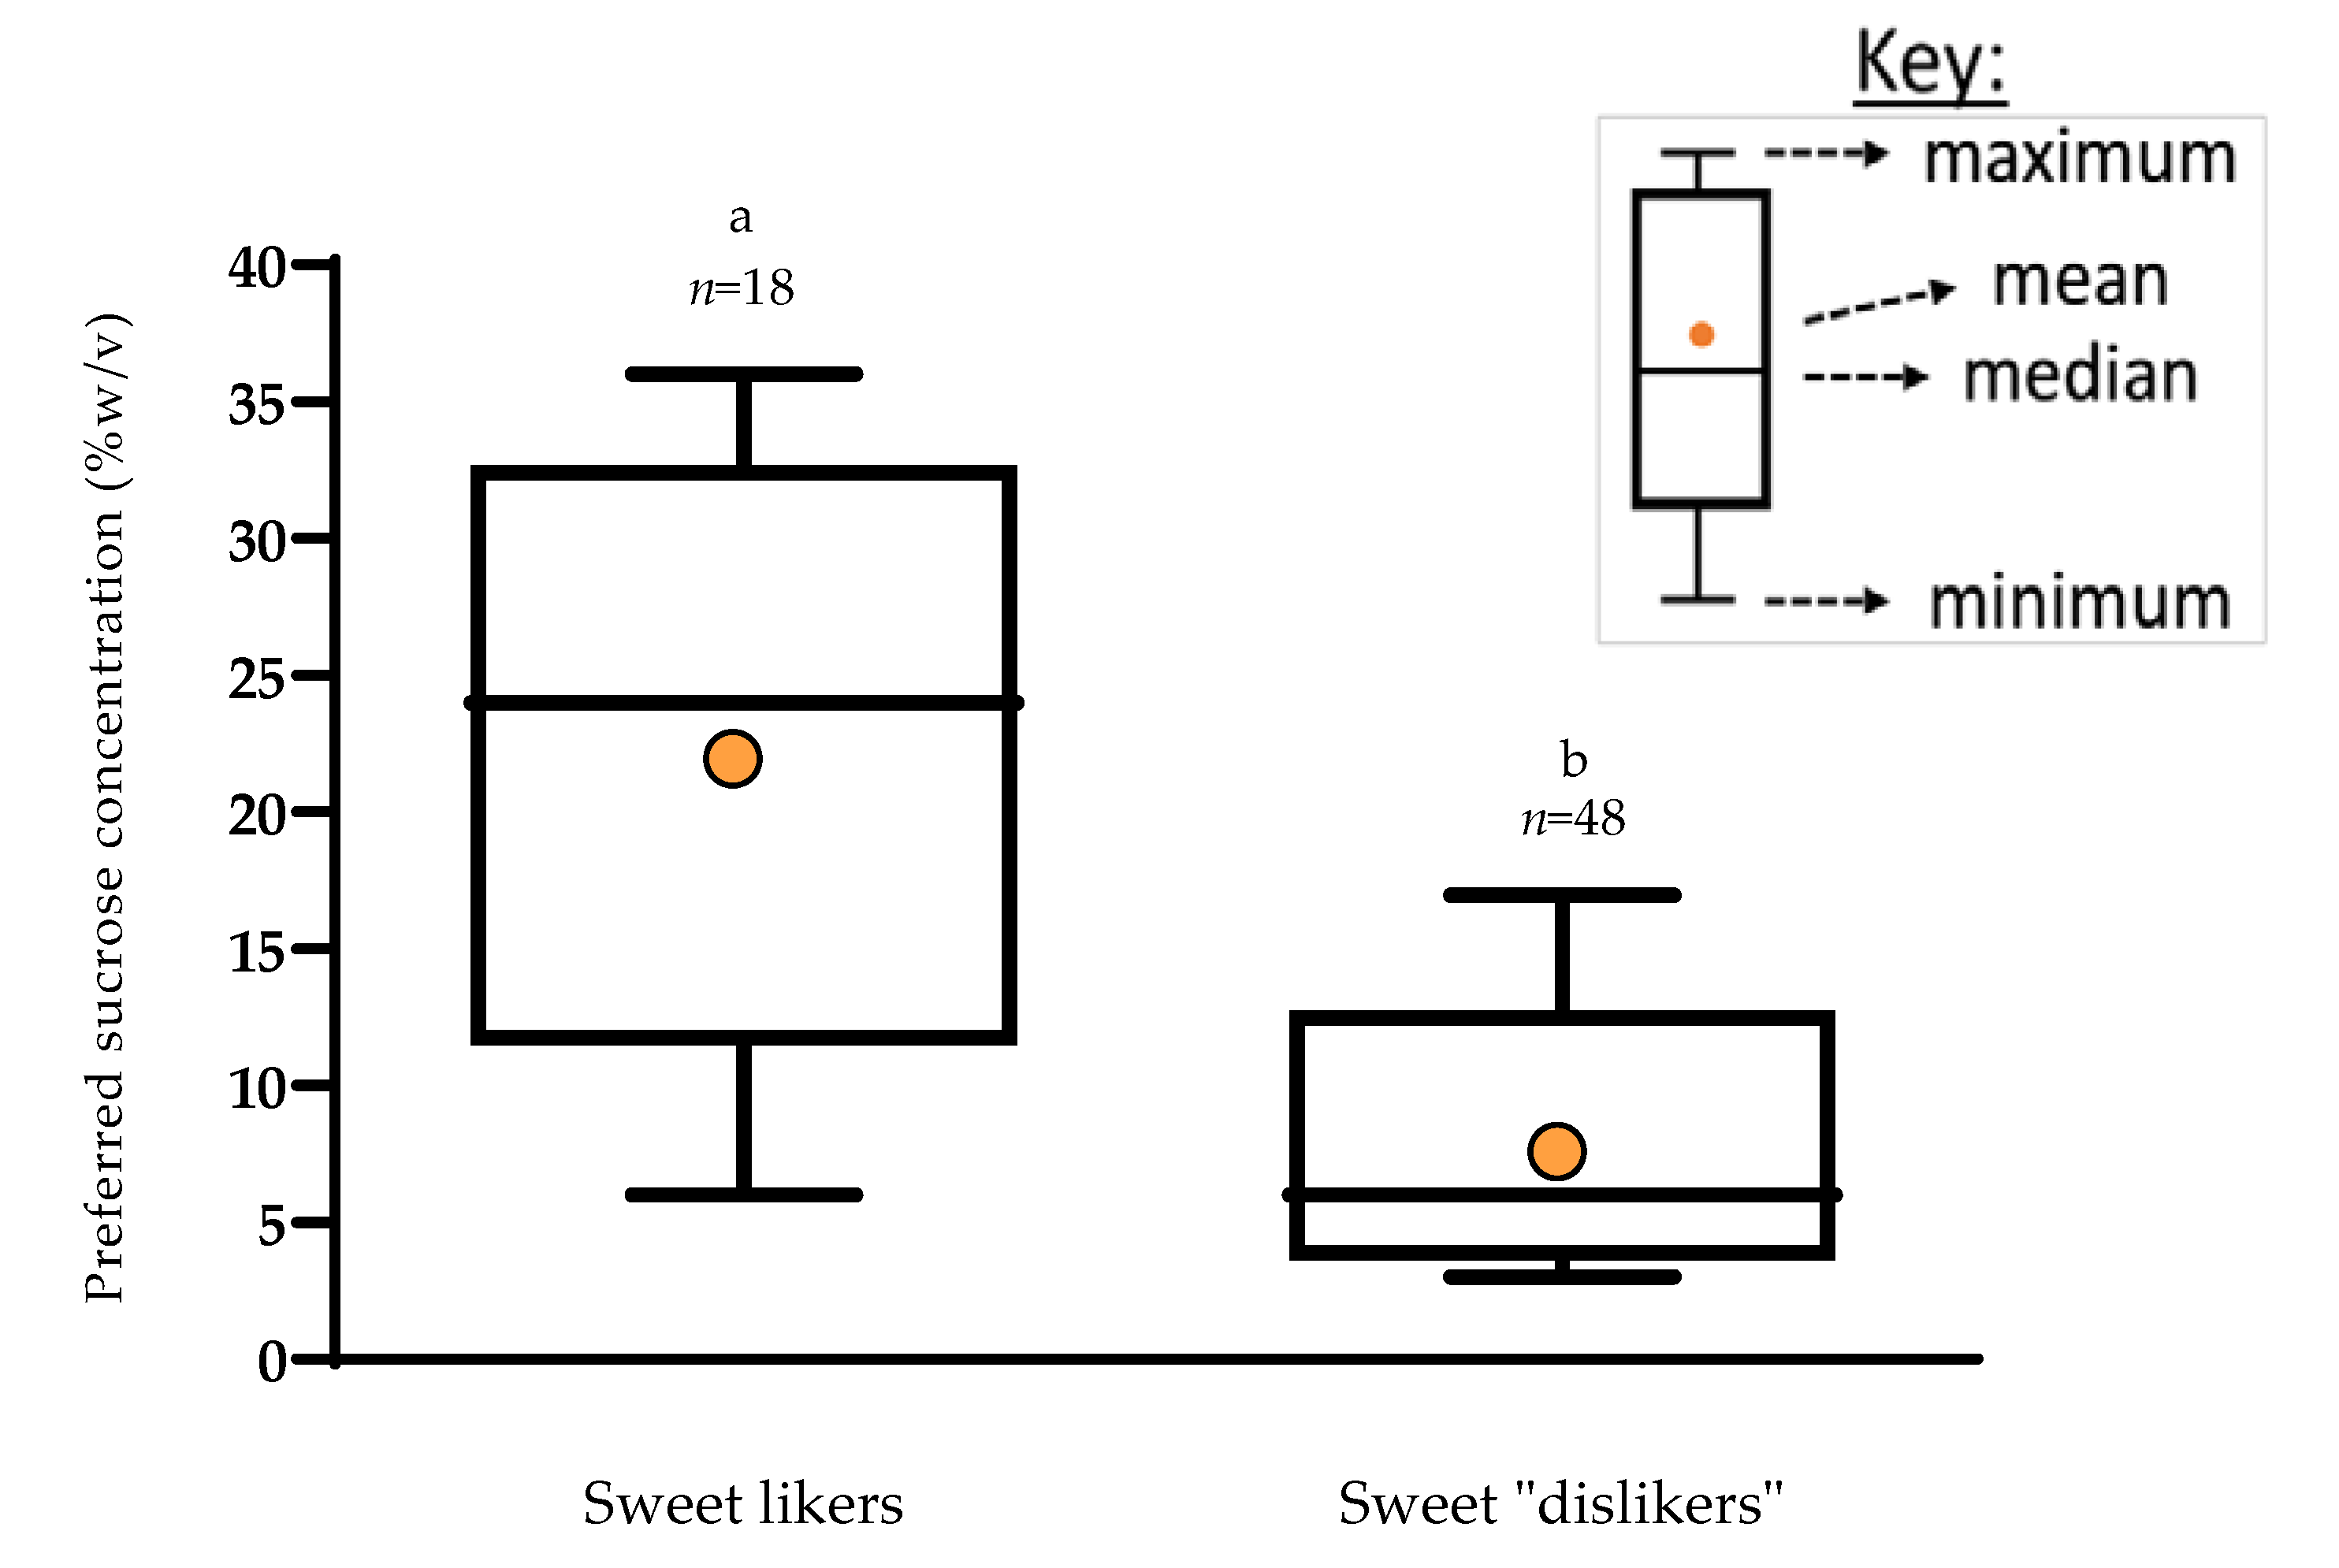
3.2. Correspondence between Sweet-Liker Status and Paired Preference Optimum Concentration for Sucrose
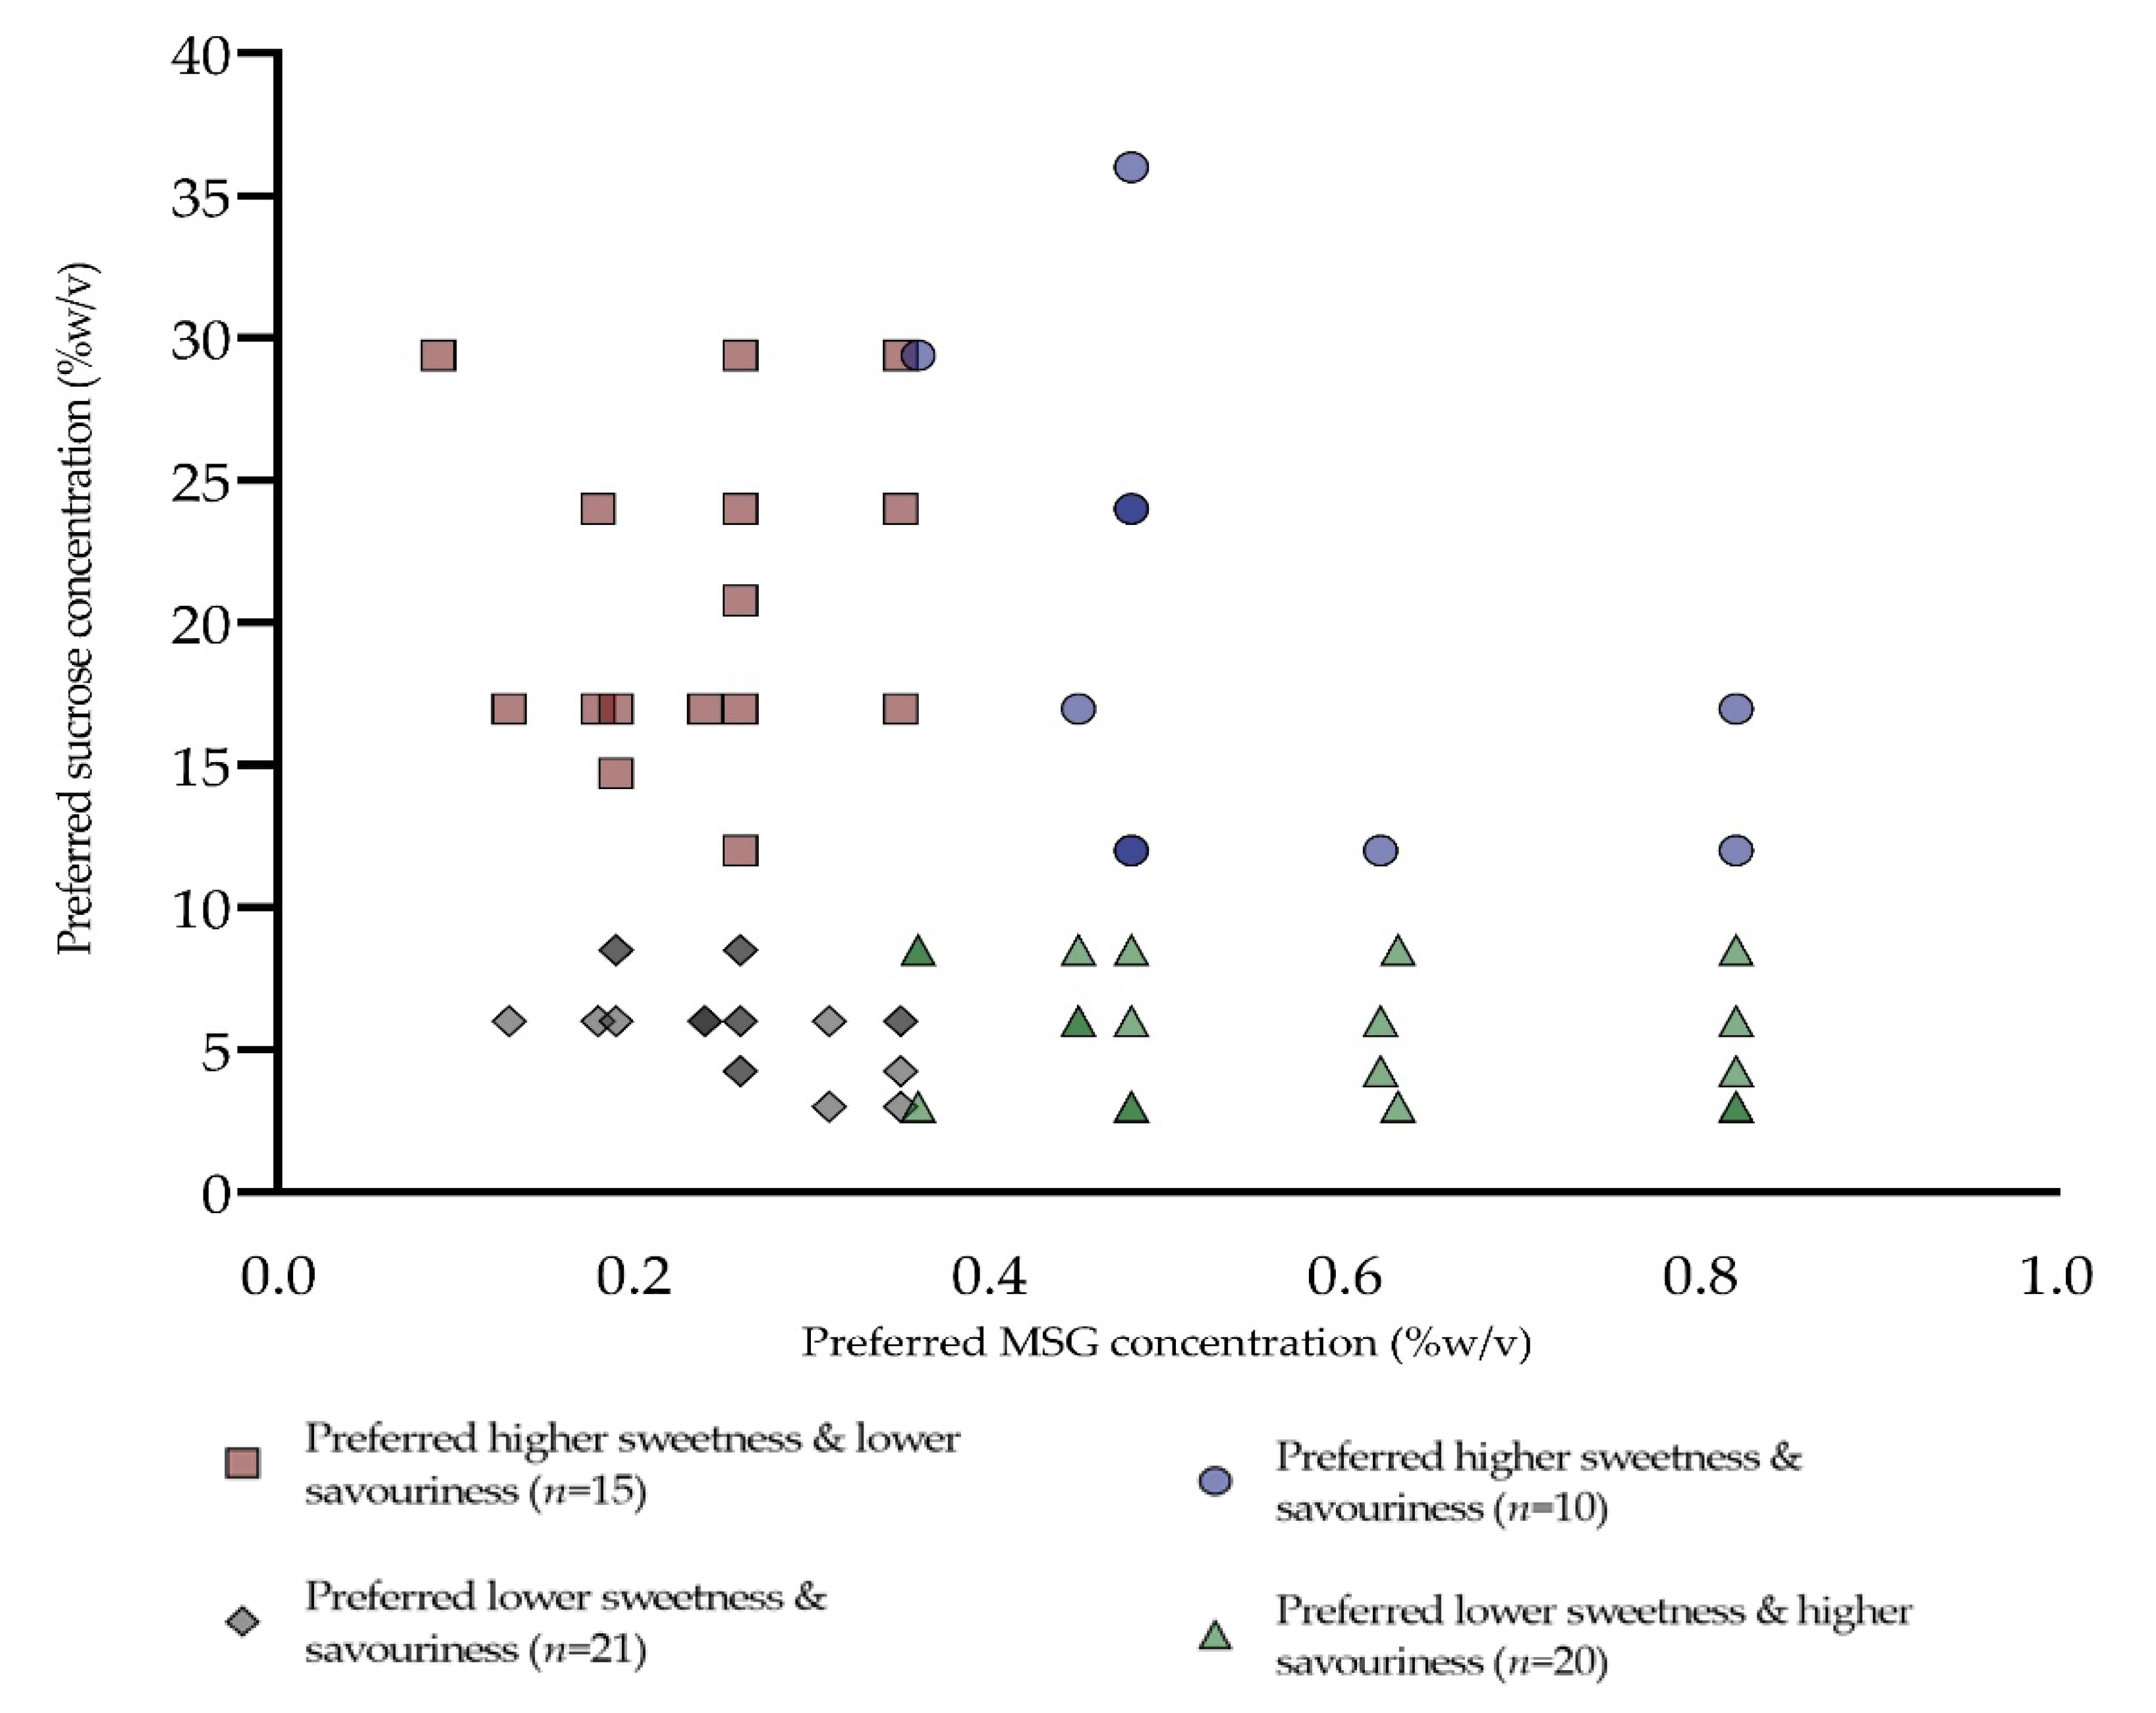
3.3. Overlap between Sweet and Savoury Taste Preferences
3.4. Associations between Sweet and Savoury Taste Preferences, Energy Intake and % Energy from Macronutrients and Total Sugar
3.5. Associations between Sweet and Savoury Taste Preferences and % Energy from “Taste Clusters” and Discretionary Foods
3.6. Associations between Sweet-Liker Phenotype, Sweet and Savoury Taste Preference and Body Composition
4. Discussion
5. Conclusions
Author Contributions
Funding
Acknowledgments
Conflicts of Interest
References
- Drewnowski, A. Taste preferences and food intake. Annu. Rev. Nutr. 1997, 17, 237–253. [Google Scholar] [CrossRef] [PubMed]
- Tan, S.-Y.; Tucker, R.M. Sweet taste as a predictor of dietary intake: A systematic review. Nutrients 2019, 11, 94. [Google Scholar] [CrossRef] [PubMed]
- de Graaf, C.; van Staveren, W.; Burema, J. Psychophysical and psychohedonic functions of four common food flavours in elderly subjects. Chem. Senses 1996, 21, 293–302. [Google Scholar] [CrossRef] [PubMed][Green Version]
- Murphy, C.; Withee, J. Age-related differences in the pleasantness of chemosensory stimuli. Psychol. Aging 1986, 1, 312. [Google Scholar] [CrossRef]
- de Graaf, C.; Polet, P.; van Staveren, W.A. Sensory perception and pleasantness of food flavors in elderly subjects. J. Gerontol. 1994, 49, P93–P99. [Google Scholar] [CrossRef]
- Mattes, R.D. Gustation as a determinant of ingestion: Methodological issues. Am. J. Clin. Nutr. 1985, 41, 672–683. [Google Scholar] [CrossRef] [PubMed]
- Teo, P.S.; van Langeveld, A.W.; de Graaf, C.; Yan, S.W.; Mars, M. A comparison of dietary taste patterns between Malaysia and The Netherlands. Appetite 2018, 130, 317–318. [Google Scholar] [CrossRef]
- Zhao, G.Q.; Zhang, Y.; Hoon, M.A.; Chandrashekar, J.; Erlenbach, I.; Ryba, N.J.; Zuker, C.S. The receptors for mammalian sweet and umami taste. Cell 2003, 115, 255–266. [Google Scholar] [CrossRef]
- Jayasinghe, S.N.; Kruger, R.; Walsh, D.C.I.; Cao, G.; Rivers, S.; Richter, M.; Breier, B.H. Is sweet taste perception associated with sweet food liking and intake? Nutrients 2017, 9, 750. [Google Scholar] [CrossRef] [PubMed]
- Pangborn, R.M.; Giovanni, M.E. Dietary intake of sweet foods and of dairy fats and resultant gustatory responses to sugar in lemonade and to fat in milk. Appetite 1984, 5, 317–327. [Google Scholar] [CrossRef]
- Mattes, R.D.; Mela, D.J. Relationships between and among selected measures of sweet-taste preference and dietary intake. Chem. Senses 1986, 11, 523–539. [Google Scholar] [CrossRef]
- Cicerale, S.; Riddell, L.J.; Keast, R.S. The association between perceived sweetness intensity and dietary intake in young adults. J. Food Sci. 2012, 77, H31–H35. [Google Scholar] [CrossRef] [PubMed]
- Iatridi, V.; Hayes, J.E.; Yeomans, M.R. Quantifying sweet taste liker phenotypes: Time for some consistency in the classification criteria. Nutrients 2019, 11, 129. [Google Scholar] [CrossRef]
- Bartoshuk, L.M.; Duffy, V.B.; Hayes, J.E.; Moskowitz, H.R.; Snyder, D.J. Psychophysics of sweet and fat perception in obesity: Problems, solutions and new perspectives. Philos. Trans. Royal Soc. B Biol. Sci. 2006, 361, 1137–1148. [Google Scholar] [CrossRef]
- Pepino, M.Y.; Finkbeiner, S.; Beauchamp, G.K.; Mennella, J.A. Obese women have lower monosodium glutamate taste sensitivity and prefer higher concentrations than do normal-weight women. Obesity 2010, 18, 959–965. [Google Scholar] [CrossRef]
- He, K.; Zhao, L.; Daviglus, M.L.; Dyer, A.R.; Van Horn, L.; Garside, D.; Zhu, L.; Guo, D.; Wu, Y.; Zhou, B.; et al. Association of monosodium glutamate intake with overweight in Chinese adults: The INTERMAP Study. Obesity 2008, 16, 1875–1880. [Google Scholar] [CrossRef]
- van Dongen, M.V.; van den Berg, M.C.; Vink, N.; Kok, F.J.; de Graaf, C. Taste–nutrient relationships in commonly consumed foods. Br. J. Nutr. 2012, 108, 140–147. [Google Scholar] [CrossRef]
- Griffioen-Roose, S.; Mars, M.; Siebelink, E.; Finlayson, G.; Tomé, D.; de Graaf, C. Protein status elicits compensatory changes in food intake and food preferences. Am. J. Clin. Nutr. 2012, 95, 32–38. [Google Scholar] [CrossRef]
- Buckley, C.M.; Stuijfzand, B.G.; Rogers, P.J. Fooled by savouriness? Investigating the relationship between savoury taste and protein content in familiar foods. Physiol. Behav. 2018, 192, 30–36. [Google Scholar] [CrossRef] [PubMed]
- Liem, D.G.; Russell, C.G. The influence of taste liking on the consumption of nutrient rich and nutrient poor foods. Front. Nutr. 2019, 6. [Google Scholar] [CrossRef] [PubMed]
- Lease, H.; Hendrie, G.A.; Poelman, A.A.; Delahunty, C.; Cox, D.N. A Sensory-Diet database: A tool to characterise the sensory qualities of diets. Food Qual. Prefer. 2016, 49, 20–32. [Google Scholar] [CrossRef]
- Teo, P.S.; van Langeveld, A.W.; Pol, K.; Siebelink, E.; de Graaf, C.; Martin, C.; Issanchou, S.; Yan, S.W.; Mars, M. Training of a Dutch and Malaysian sensory panel to assess intensities of basic tastes and fat sensation of commonly consumed foods. Food Qual. Prefer. 2018, 65, 49–59. [Google Scholar] [CrossRef]
- Teo, P.S.; van Langeveld, A.W.; Pol, K.; Siebelink, E.; de Graaf, C.; Yan, S.W.; Mars, M. Similar taste-nutrient relationships in commonly consumed Dutch and Malaysian foods. Appetite 2018, 125, 32–41. [Google Scholar] [CrossRef] [PubMed]
- van Langeveld, A.W.; Teo, P.S.; de Vries, J.H.; Feskens, E.J.; de Graaf, C.; Mars, M. Dietary taste patterns by sex and weight status in the Netherlands. Br. J. Nutr. 2018, 119, 1195–1206. [Google Scholar] [CrossRef] [PubMed]
- Allison, D.B.; Baskin, M.L. Handbook of Assessment Methods for Eating Behaviors and Weight-Related Problems: Measures, Theory, and Research; Sage Publications, Inc.: Los Angeles, CA, USA, 2009; pp. 371–373. [Google Scholar] [CrossRef]
- Tremblay, A.; Sévigny, J.; Leblanc, C.; Bouchard, C. The reproducibility of a three-day dietary record. Nutr. Res. 1983, 3, 819–830. [Google Scholar] [CrossRef]
- Schröder, H.; Covas, M.I.; Marrugat, J.; Vila, J.; Pena, A.; Alcántara, M.; Masiá, R. Use of a three-day estimated food record, a 72-hour recall and a food-frequency questionnaire for dietary assessment in a Mediterranean Spanish population. Clin. Nutr. 2001, 20, 429–437. [Google Scholar] [CrossRef]
- Yang, Y.J.; Kim, M.K.; Hwang, S.H.; Ahn, Y.; Shim, J.E.; Kim, D.H. Relative validities of 3-day food records and the food frequency questionnaire. Nutr. Res. Pract. 2010, 4, 142–148. [Google Scholar] [CrossRef]
- van Langeveld, A.W.B.; Gibbons, S.; Koelliker, Y.; Civille, G.V.; de Vries, J.H.M.; de Graaf, C.; Mars, M. The relationship between taste and nutrient content in commercially available foods from the United States. Food Qual. Prefer. 2017, 57, 1–7. [Google Scholar] [CrossRef]
- Martin, C.; Visalli, M.; Lange, C.; Schlich, P.; Issanchou, S. Creation of a food taste database using an in-home “taste” profile method. Food Qual. Prefer. 2014, 36, 70–80. [Google Scholar] [CrossRef]
- WHO Expert Consultation. Appropriate body-mass index for Asian populations and its implications for policy and intervention strategies. Lancet 2004, 363, 157–163. [Google Scholar] [CrossRef]
- Sallis, J.F.; Buono, M.J.; Roby, J.J.; Micale, F.G.; Nelson, J.A. Seven-day recall and other physical activity self-reports in children and adolescents. Med. Sci. Sports Exerc. 1993, 25, 99–108. [Google Scholar] [CrossRef] [PubMed]
- Bratteby, L.E.; Sandhagen, B.; Fan, H.; Samuelson, G. A 7-day activity diary for assessment of daily energy expenditure validated by the doubly labelled water method in adolescents. Eur. J. Clin. Nutr. 1997, 51, 585–591. [Google Scholar] [CrossRef] [PubMed]
- Ainsworth, B.E.; Haskell, W.L.; Whitt, M.C.; Irwin, M.L.; Swartz, A.M.; Strath, S.J.; O Brien, W.L.; Bassett, D.R.; Schmitz, K.H.; Emplaincourt, P.O.; et al. Compendium of physical activities: An update of activity codes and MET intensities. Med. Sci. Sports Exerc. 2000, 32, S498–S504. [Google Scholar] [CrossRef] [PubMed]
- Mennella, J.A.; Finkbeiner, S.; Lipchock, S.V.; Hwang, L.-D.; Reed, D.R. Preferences for salty and sweet tastes are elevated and related to each other during childhood. PLoS ONE 2014, 9. [Google Scholar] [CrossRef]
- Methven, L.; Xiao, C.; Cai, M.; Prescott, J. Rejection thresholds (RjT) of sweet likers and dislikers. Food Qual. Prefer. 2016, 52, 74–80. [Google Scholar] [CrossRef]
- Leong, C.S.-F.; Forde, C.G.; Tey, S.L.; Henry, C.J. Taste sensitivities and diet of Chinese and Indians in Singapore. Asia Pac. J. Clin. Nutr. 2018, 27. [Google Scholar] [CrossRef]
- Leong, C.S.-F.; Forde, C.G.; Tey, S.L.; Henry, C.J. Taste perception and diet in people of Chinese ancestry. Asia Pac. J. Clin. Nutr. 2018, 27, 478. [Google Scholar] [CrossRef]
- Garneau, N.L.; Nuessle, T.M.; Mendelsberg, B.J.; Shepard, S.; Tucker, R.M. Sweet liker status in children and adults: Consequences for beverage intake in adults. Food Qual. Prefer. 2018, 65, 175–180. [Google Scholar] [CrossRef]
- Chung, L.; Chung, S.-J.; Kim, J.-Y.; Kim, K.-O.; O’Mahony, M.; Vickers, Z.; Cha, S.-M.; Ishii, R.; Baures, K.; Kim, H.-R. Comparing the liking for Korean style salad dressings and beverages between US and Korean consumers: Effects of sensory and non-sensory factors. Food Qual. Prefer. 2012, 26, 105–118. [Google Scholar] [CrossRef]
- Holt, S.H.A.; Cobiac, L.; Beaumont-Smith, N.E.; Easton, K.; Best, D.J. Dietary habits and the perception and liking of sweetness among Australian and Malaysian students: A cross-cultural study. Food Qual. Prefer. 2000, 11, 299–312. [Google Scholar] [CrossRef]
- Tuorila, H.; Keskitalo-Vuokko, K.; Perola, M.; Spector, T.; Kaprio, J. Affective responses to sweet products and sweet solution in British and Finnish adults. Food Qual. Prefer. 2017, 62, 128–136. [Google Scholar] [CrossRef]
- Hajeb, P.; Jinap, S. Umami taste components and their sources in Asian foods. Crit. Rev. Food Sci. Nutr. 2015, 55, 778–791. [Google Scholar] [CrossRef] [PubMed]
- Masic, U.; Yeomans, M.R. Does acute or habitual protein deprivation influence liking for monosodium glutamate? Physiol. Behav. 2017, 171, 79–86. [Google Scholar] [CrossRef] [PubMed]
- Masic, U.; Yeomans, M.R. Umami flavor enhances appetite but also increases satiety. Am. J. Clin. Nutr. 2014, 100, 532–538. [Google Scholar] [CrossRef] [PubMed]
- Masic, U.; Yeomans, M.R. Monosodium glutamate delivered in a protein-rich soup improves subsequent energy compensation. J. Nutr. Sci. 2014, 3, e15. [Google Scholar] [CrossRef]
- Deurenberg-Yap, M.; Schmidt, G.; van Staveren, W.A.; Deurenberg, P. The paradox of low body mass index and high body fat percentage among Chinese, Malays and Indians in Singapore. Int. J. Obes. 2000, 24, 1011–1017. [Google Scholar] [CrossRef]
- Goh, V.H.H.; Tain, C.F.; Tong, T.Y.Y.; Mok, H.P.P.; Wong, M.T. Are BMI and other anthropometric measures appropriate as indices for obesity? A study in an Asian population. J. Lipid Res. 2004, 45, 1892–1898. [Google Scholar] [CrossRef]
- Yeomans, M.R.; Tepper, B.J.; Rietzschel, J.; Prescott, J. Human hedonic responses to sweetness: Role of taste genetics and anatomy. Physiol. Behav. 2007, 91, 264–273. [Google Scholar] [CrossRef]
- Frijters, J.E.; Rasmussen-Conrad, E.L. Sensory discrimination, intensity perception, and affective judgment of sucrose-sweetness in the overweight. J. Gen. Psychol. 1982, 107, 233–247. [Google Scholar] [CrossRef]
- Malcolm, R.; O’Neil, P.M.; Hirsch, A.A.; Currey, H.S.; Moskowitz, G. Taste hedonics and thresholds in obesity. Int. J. Obes. 1980, 4, 203–212. [Google Scholar]
- Cox, D.N.; Perry, L.; Moore, P.B.; Vallis, L.; Mela, D.J. Sensory and hedonic associations with macronutrient and energy intakes of lean and obese consumers. Int. J. Obes. 1999, 23, 403–410. [Google Scholar] [CrossRef] [PubMed]
- Donaldson, L.F.; Bennett, L.; Baic, S.; Melichar, J.K. Taste and weight: Is there a link? Am. J. Clin. Nutr. 2009, 90, 800S–803S. [Google Scholar] [CrossRef] [PubMed]
- Buckley, C.M.; Austin, S.; Corfe, B.M.; Green, M.A.; Johnstone, A.M.; Stevenson, E.J.; Williams, E.A.; Brunstrom, J.M. Protein valuation in food choice is positively associated with lean mass in older adults. J. Nutr. 2019, 149, 2056–2064. [Google Scholar] [CrossRef] [PubMed]
- Appleton, K.M.; Tuorila, H.; Bertenshaw, E.J.; de Graaf, C.; Mela, D.J. Sweet taste exposure and the subsequent acceptance and preference for sweet taste in the diet: Systematic review of the published literature. Am. J. Clin. Nutr. 2018, 107, 405–419. [Google Scholar] [CrossRef]
- Rolls, B.J.; Rolls, E.T.; Rowe, E.A.; Sweeney, K. Sensory specific satiety in man. Physiol. Behav. 1981, 27, 137–142. [Google Scholar] [CrossRef]
- Blechert, J.; Naumann, E.; Schmitz, J.; Herbert, B.M.; Tuschen-Caffier, B. Startling sweet temptations: Hedonic chocolate deprivation modulates experience, eating behavior, and eyeblink startle. PLoS ONE 2014, 9, e85679. [Google Scholar] [CrossRef]
- Rogers, P.J.; Hogenkamp, P.S.; de Graaf, C.; Higgs, S.; Lluch, A.; Ness, A.R.; Penfold, C.; Perry, R.; Putz, P.; Yeomans, M.R.; et al. Does low-energy sweetener consumption affect energy intake and body weight? A systematic review, including meta-analyses, of the evidence from human and animal studies. Int. J. Obes. 2016, 40, 381–394. [Google Scholar] [CrossRef]
- Shim, J.-S.; Oh, K.; Kim, H.C. Dietary assessment methods in epidemiologic studies. Epidemiol. Health 2014, 36, e2014009. [Google Scholar] [CrossRef]


| Participant Characteristics | |
|---|---|
| Age, years | 29.47 (8.44) |
| Sweet likers, n (%) 2 | 18 (27.27) |
| Sweet “dislikers”, n (%) 2 | 48 (72.73) |
| Preferred higher concentration of sweetness, n (%) 3 | 25 (37.88) |
| Preferred lower concentration of sweetness, n (%) 3 | 41 (62.12) |
| Preferred higher concentration of savouriness, n (%) 3 | 30 (45.45) |
| Preferred lower concentration of savouriness, n (%) 3 | 36 (54.55) |
| Height, (m) | 1.61 (0.57) |
| Body weight, (kg) | 56.04 (11.50) |
| Mean Body Mass Index, BMI, (kg/m2) | 21.38 (4.34) |
| Underweight BMI < 18.5, n (%) | 13 (19.70) |
| Normal weight BMI 18.5–22.9, n (%) | 35 (53.03) |
| Overweight BMI 23.0–27.4, n (%) | 13 (19.70) |
| Obese BMI ≥ 27.5, n (%) | 5 (7.58) |
| Percentage of body fat, % | 28.29 (7.42) |
| Total 1 (n = 66) | Sweetness Preference 2 | Savouriness Preference 2 | |||||
|---|---|---|---|---|---|---|---|
| Higher (n = 25) | Lower (n = 41) | p-Value [95% CI] | Higher (n = 30) | Lower (n = 36) | p-Value [95% CI] | ||
| Energy intake (kcal/day) | 1739.70 (46.80) | 1809.52 (74.06) | 1697.12 (57.83) | 0.236 [−75.38, 300.18] | 1721.46 (68.32) | 1754.89 (62.36) | 0.719 [−218.31, 151.44] |
| % energy | |||||||
| Carbohydrates | 46.99 (0.89) | 47.17 (1.41) | 46.88 (1.11) | 0.872 [−3.30, 3.88] | 47.34 (1.29) | 46.70 (1.18) | 0.713 [−2.85, 4.14] |
| Fat | 33.63 (0.74) | 33.89 (1.18) | 33.47 (0.92) | 0.777 [−2.56, 3.41] | 33.38 (1.08) | 33.84 (0.98) | 0.753 [−3.37, 2.45] |
| Protein | 18.41 (0.60) | 18.08 (0.97) | 18.61 (0.76) | 0.673 [−2.99, 1.94] | 18.53 (0.89) | 18.30 (0.81) | 0.851 [−2.18, 2.63] |
| Total Sugar | 9.68 (0.61) | 10.27 (0.99) | 9.31 (0.77) | 0.451 [−1.56, 3.47] | 8.41 (0.88) | 10.73 (0.81) | 0.057 [−4.72, 0.07] |
| % Energy | Total 1 (n = 66) | Sweetness Preference 2 | Savouriness Preference 2 | ||||
|---|---|---|---|---|---|---|---|
| Higher (n = 25) | Lower (n = 41) | p-Value [95% CI] | Higher (n = 30) | Lower (n = 36) | p-Value [95% CI] | ||
| Savoury fatty taste cluster | 58.57 (1.83) | 56.87 (2.93) | 59.61 (2.29) | 0.463 | 56.75 (2.67) | 60.09 (2.43) | 0.359 |
| [−10.16, 4.68] | [−10.55, 3.88] | ||||||
| Neutral taste cluster | 20.55 (1.48) | 20.39 (2.39) | 20.65 (1.86) | 0.932 | 23.79 (2.11) | 17.84 (1.92) | 0.041 * |
| [−6.31, 5.79] | [0.25, 11.66] | ||||||
| Sweet fatty taste cluster | 12.46 (1.17) | 13.76 (1.89) | 11.66 (1.48) | 0.384 | 12.19 (1.74) | 12.68 (1.59) | 0.835 |
| [−2.70, 6.91] | [−5.20, 4.22] | ||||||
| Sweet sour taste cluster | 6.05 (0.69) | 6.15 (1.10) | 5.99 (0.86) | 0.907 | 4.69 (0.98) | 7.18 (0.90) | 0.066 |
| [−2.63, 2.96] | [−5.14, 0.17] | ||||||
| Bitter taste cluster | 2.15 (0.45) | 2.66 (0.72) | 183 (0.56) | 0.369 | 2.30 (0.66) | 2.02 (0.60) | 0.755 |
| [−1.00, 2.65] | [−1.50, 2.07] | ||||||
| Total discretionary foods | 31.41 (1.77) | 33.38 (2.78) | 30.21 (2.17) | 0.371 | 30.37 (2.55) | 32.28 (2.32) | 0.583 |
| [−3.86, 10.22] | [−8.79, 4.98] | ||||||
| Sweet discretionary foods | 17.96 (1.30) | 19.56 (2.12) | 16.99 (1.66) | 0.345 | 16.27 (1.93) | 19.38 (1.76) | 0.240 |
| [−2.82, 7.95] | [−8.33, 2.12] | ||||||
| Savoury discretionary foods | 4.80 (0.65) | 5.05 (1.07) | 4.65 (0.84) | 0.769 | 4.12 (0.97) | 5.37 (0.89) | 0.346 |
| [−2.31, 3.11] | [−3.87, 1.38] | ||||||
| Sweet-Liker Phenotypes | Staircase Paired Preference Method | ||||||||
|---|---|---|---|---|---|---|---|---|---|
| Sweetness Preference | Savouriness Preference | ||||||||
| Sweet Likers (n = 18) | Sweet “Dislikers” (n = 48) | p-Value [95% CI] | Higher (n = 25) | Lower (n = 41) | p-Value [95% CI] | Higher (n = 30) | Lower (n = 36) | p-Value [95% CI] | |
| Body weight, kg | 58.22 (2.56) | 55.22 | 0.322 | 57.86 (2.15) | 54.93 (1.68) | 0.287 | 56.94 (1.98) | 55.29 (1.81) | 0.541 |
| (1.56) | [−0.38, 7.31] | [−2.53, 8.39] | [−3.72, 7.02] | ||||||
| Body Mass Index, BMI, kg/m2 | 22.56 (0.95) | 20.94 | 0.150 | 22.07 (0.81) | 20.96 (0.63) | 0.279 | 21.63 (0.74) | 21.17 (0.68) | 0.650 |
| (0.58) | [−0.61, 3.85] | [−0.93, 3.16] | [−2.47, 1.55] | ||||||
| Percentage body fat, % | 30.81 (1.64) | 27.34 | 0.076 | 29.52 (1.40) | 27.54 (1.09) | 0.270 | 28.19 (1.30) | 28.37 (1.18) | 0.916 |
| (1.00) | [−3.01, 9.00] | [−1.58, 5.53] | [−3.70, 3.33] | ||||||
© 2020 by the authors. Licensee MDPI, Basel, Switzerland. This article is an open access article distributed under the terms and conditions of the Creative Commons Attribution (CC BY) license (http://creativecommons.org/licenses/by/4.0/).
Share and Cite
Lim, A.J.; Teo, P.S.; Tan, V.W.K.; Forde, C.G. Associations between Psycho-Hedonic Responses to Sweet and Savoury Tastes with Diet and Body Composition in a Sample of Asian Females. Foods 2020, 9, 1318. https://doi.org/10.3390/foods9091318
Lim AJ, Teo PS, Tan VWK, Forde CG. Associations between Psycho-Hedonic Responses to Sweet and Savoury Tastes with Diet and Body Composition in a Sample of Asian Females. Foods. 2020; 9(9):1318. https://doi.org/10.3390/foods9091318
Chicago/Turabian StyleLim, Amanda JiaYing, Pey Sze Teo, Vicki Wei Kee Tan, and Ciarán G. Forde. 2020. "Associations between Psycho-Hedonic Responses to Sweet and Savoury Tastes with Diet and Body Composition in a Sample of Asian Females" Foods 9, no. 9: 1318. https://doi.org/10.3390/foods9091318
APA StyleLim, A. J., Teo, P. S., Tan, V. W. K., & Forde, C. G. (2020). Associations between Psycho-Hedonic Responses to Sweet and Savoury Tastes with Diet and Body Composition in a Sample of Asian Females. Foods, 9(9), 1318. https://doi.org/10.3390/foods9091318