Comparison of Phenolic Compounds, Carotenoids, Amino Acid Composition, In Vitro Antioxidant and Anti-Diabetic Activities in the Leaves of Seven Cowpea (Vigna unguiculata) Cultivars

 , , ,
, , ,  and
and 
Abstract
:
1. Introduction
2. Materials and Methods
2.1. Chemicals
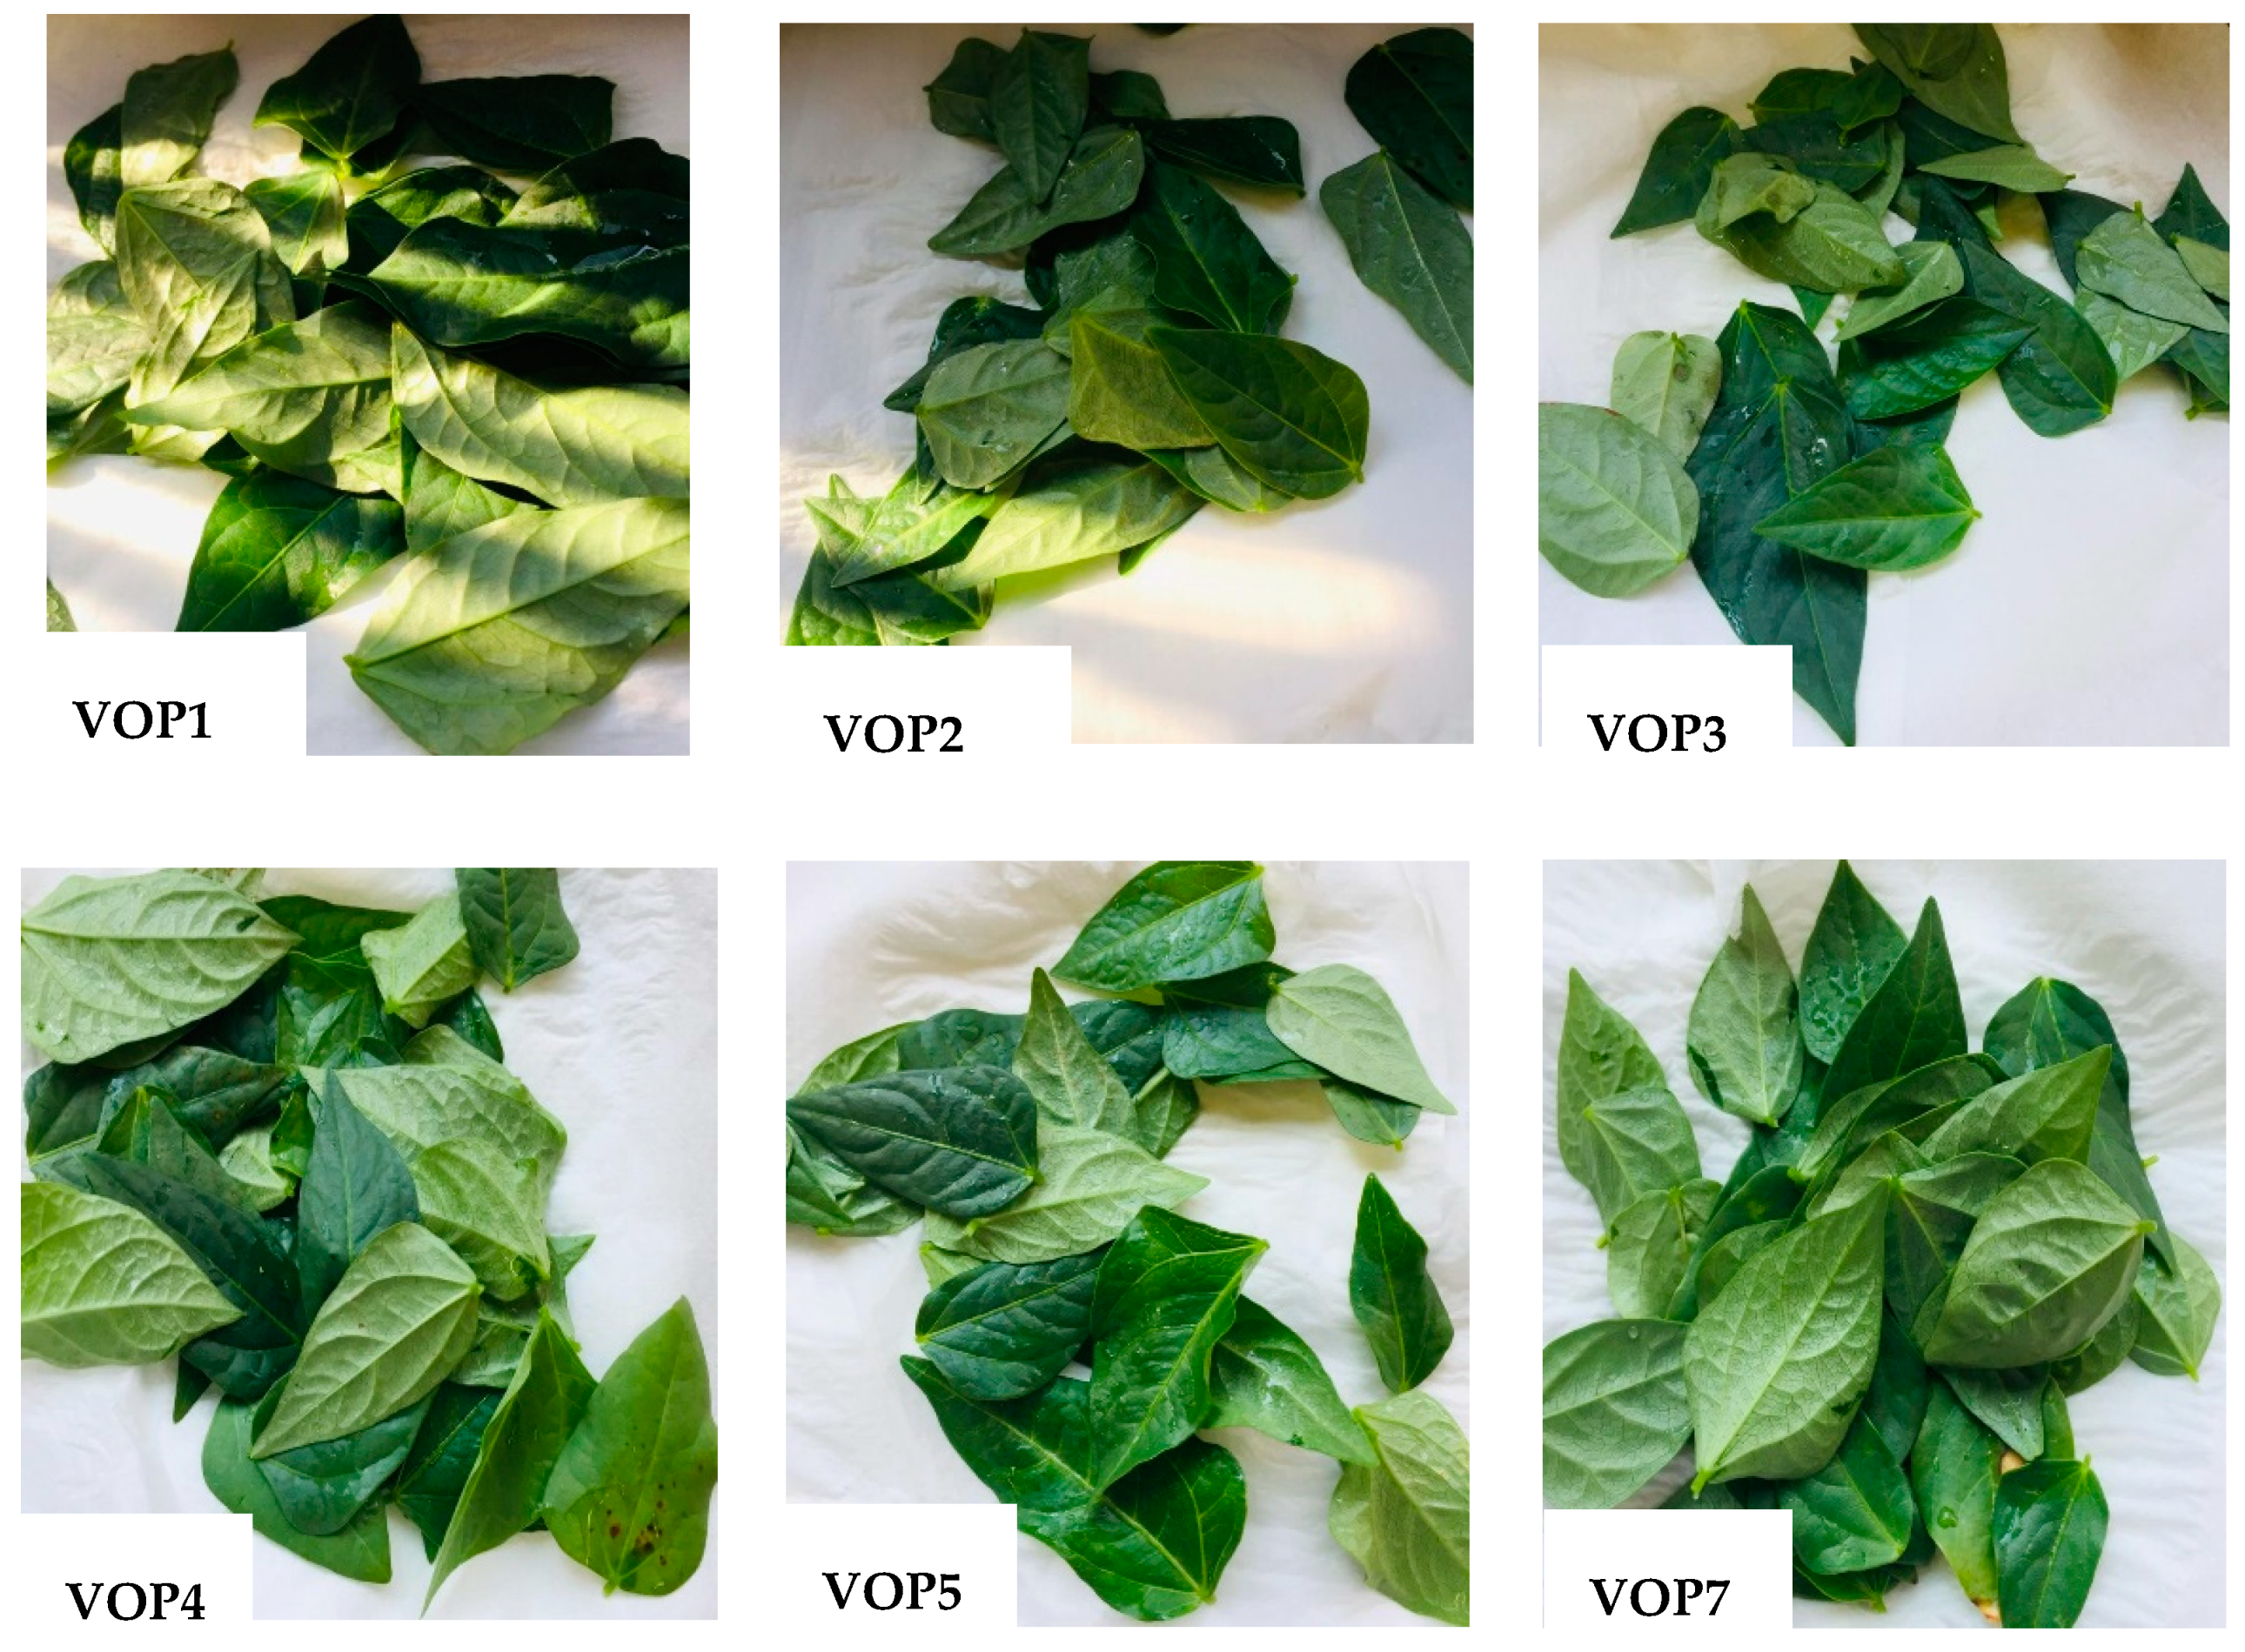
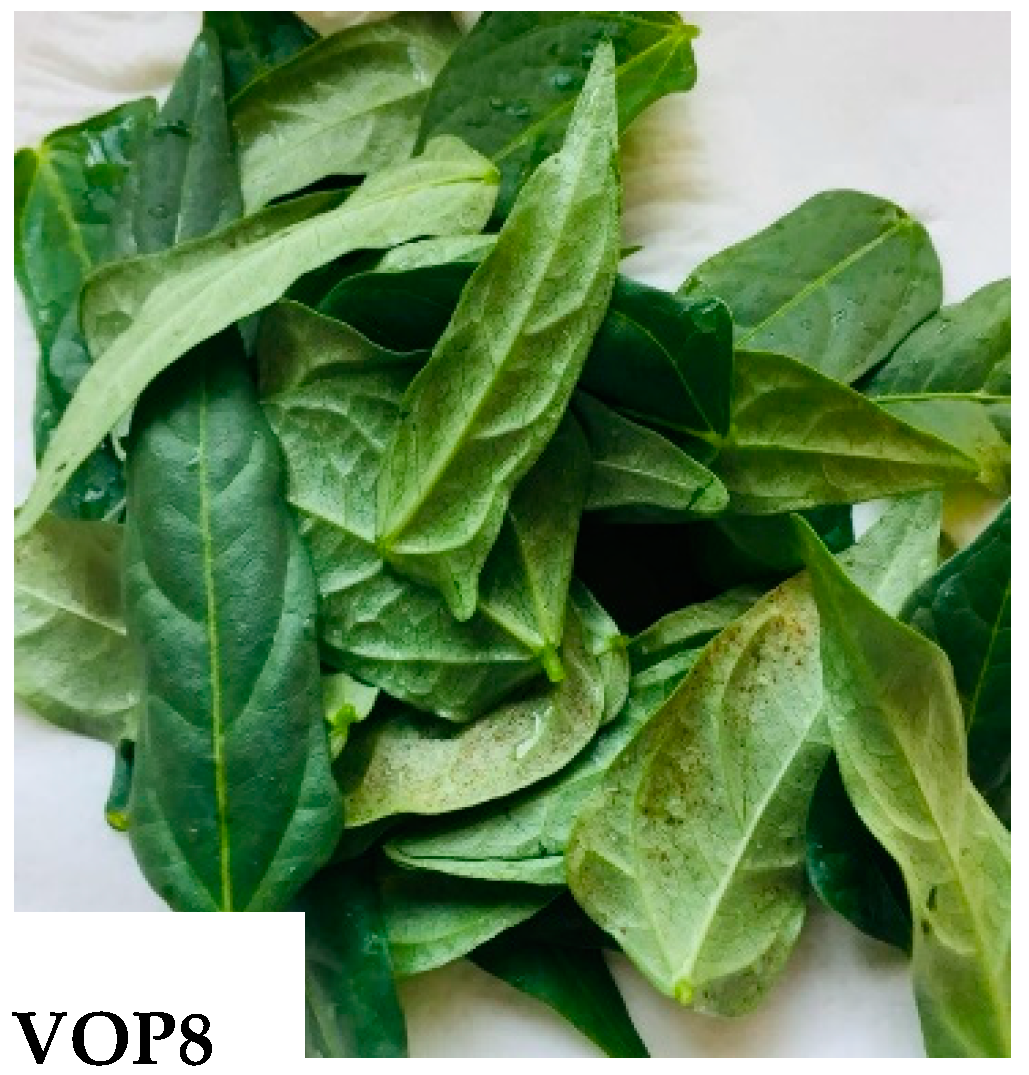
2.2. Plant Material
2.3. Predominant Phenolic Metabolic Profile
2.4. Trolox Equivalent Antioxidant Capacity (TEAC) FRAP Assay
2.5. Antidiabetic Activity
2.5.1. α-Glucosidase Inhibition Assay
2.5.2. α-Amylase Inhibition Assay
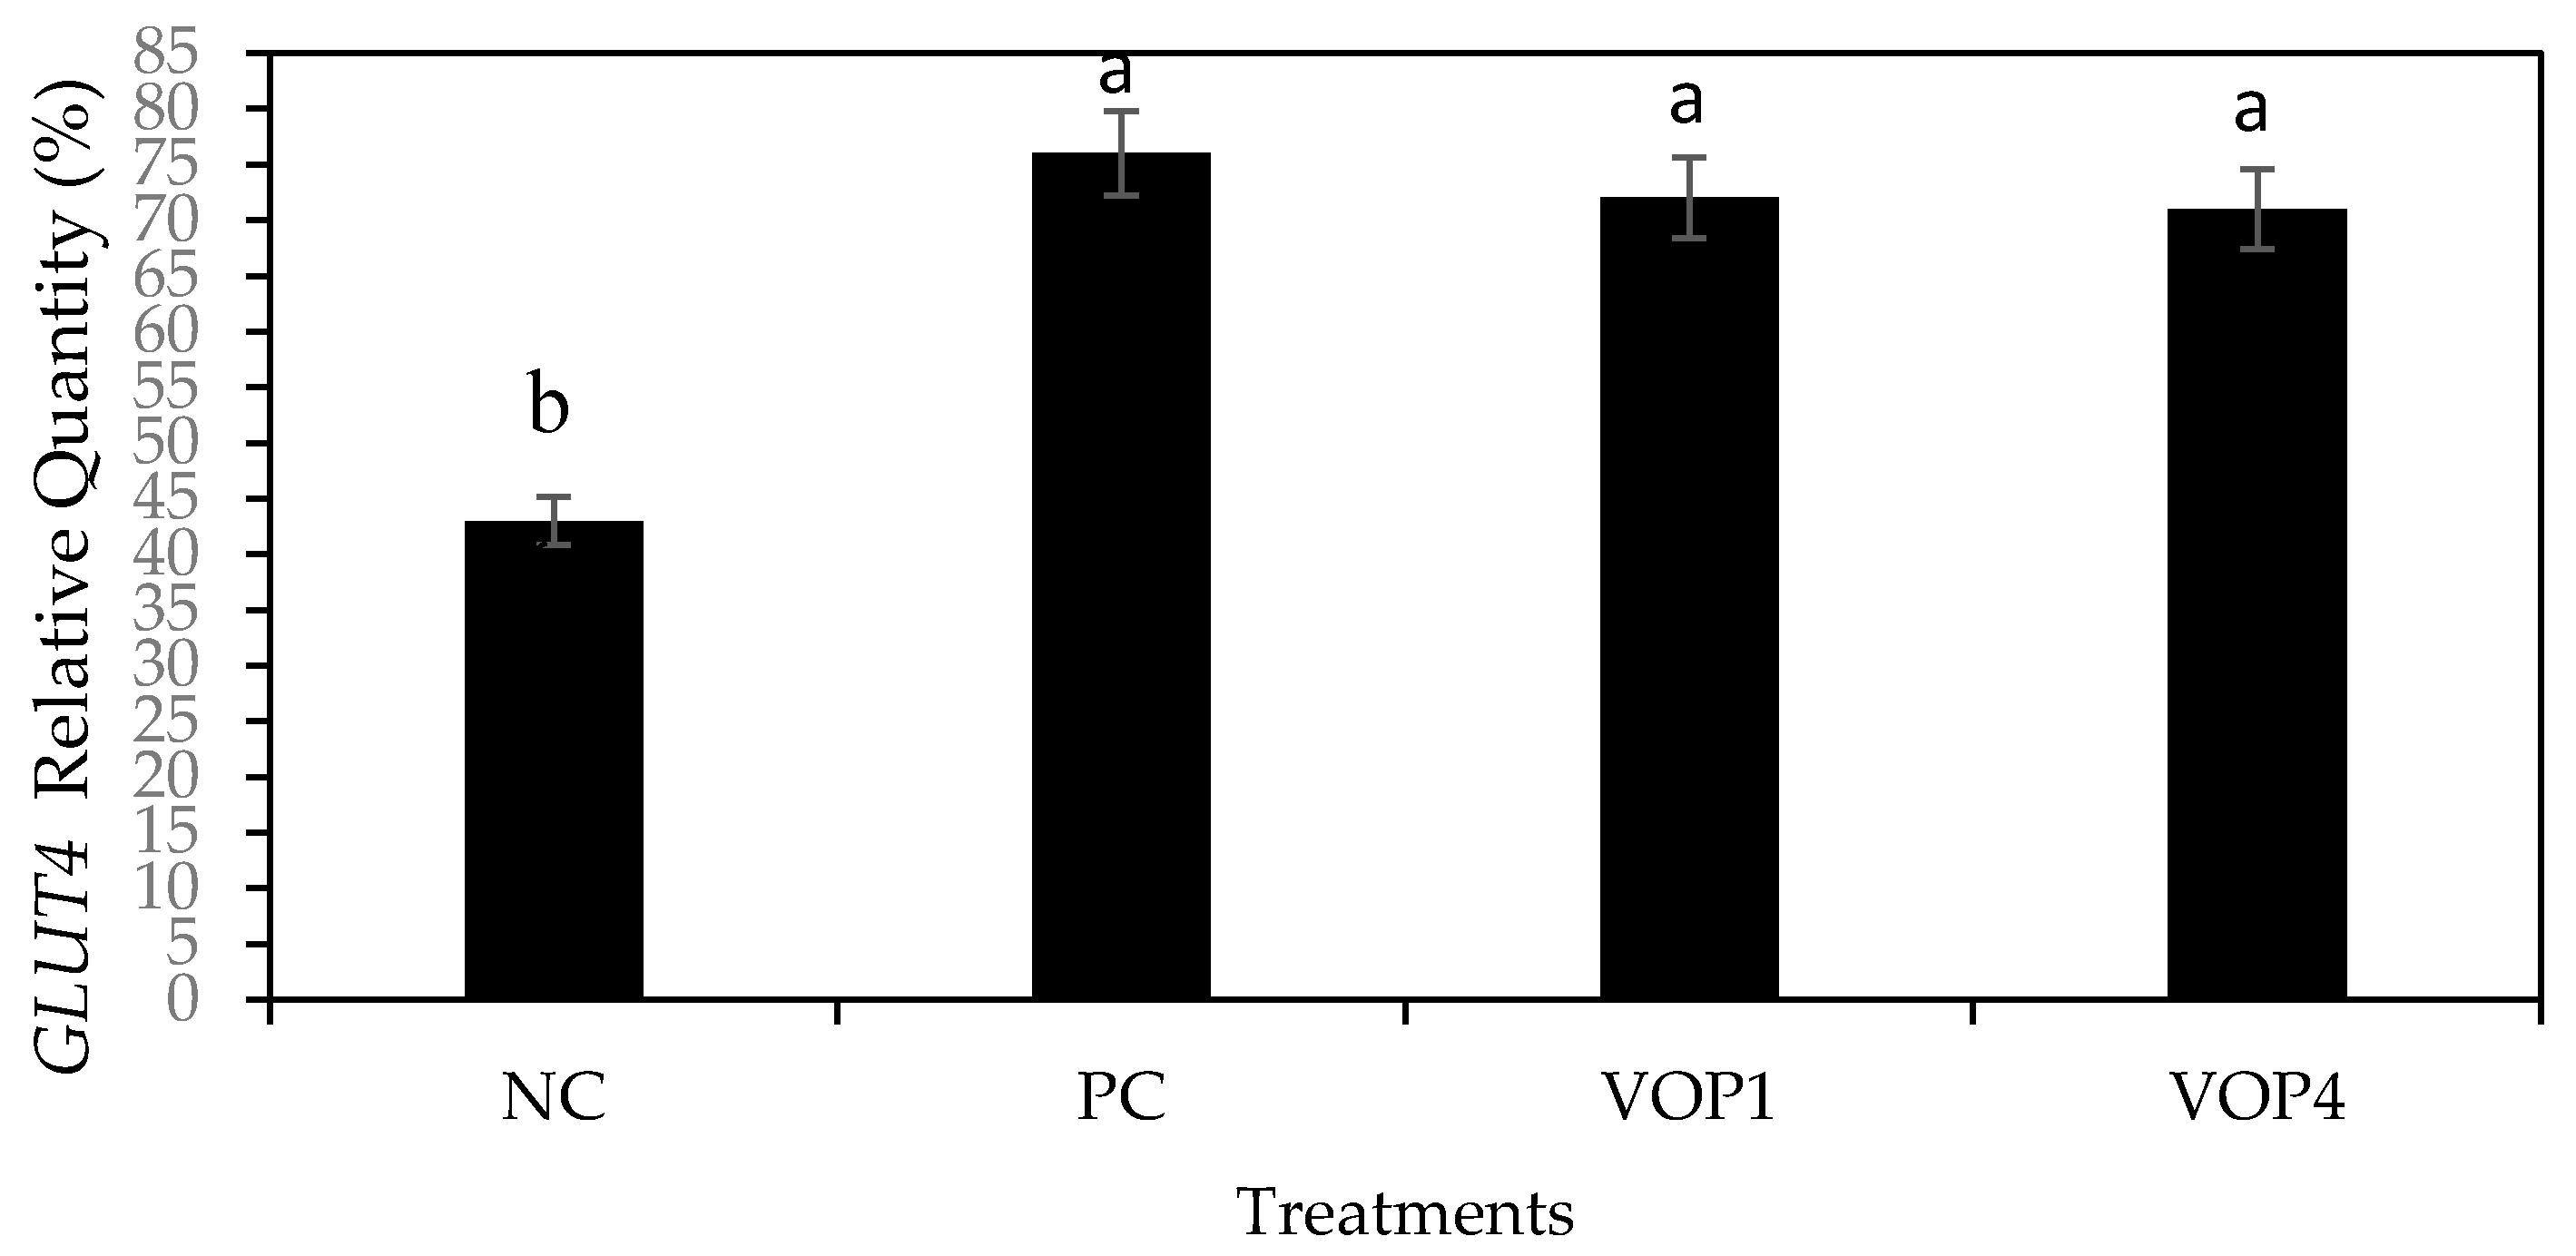
2.5.3. Gene Expression of GLUT-4
2.6. Cell Cytotoxicity Using MTT Assay
2.7. Carotenoids
2.8. Amino Acids
2.9. Statistical Analysis
3. Results and Discussion
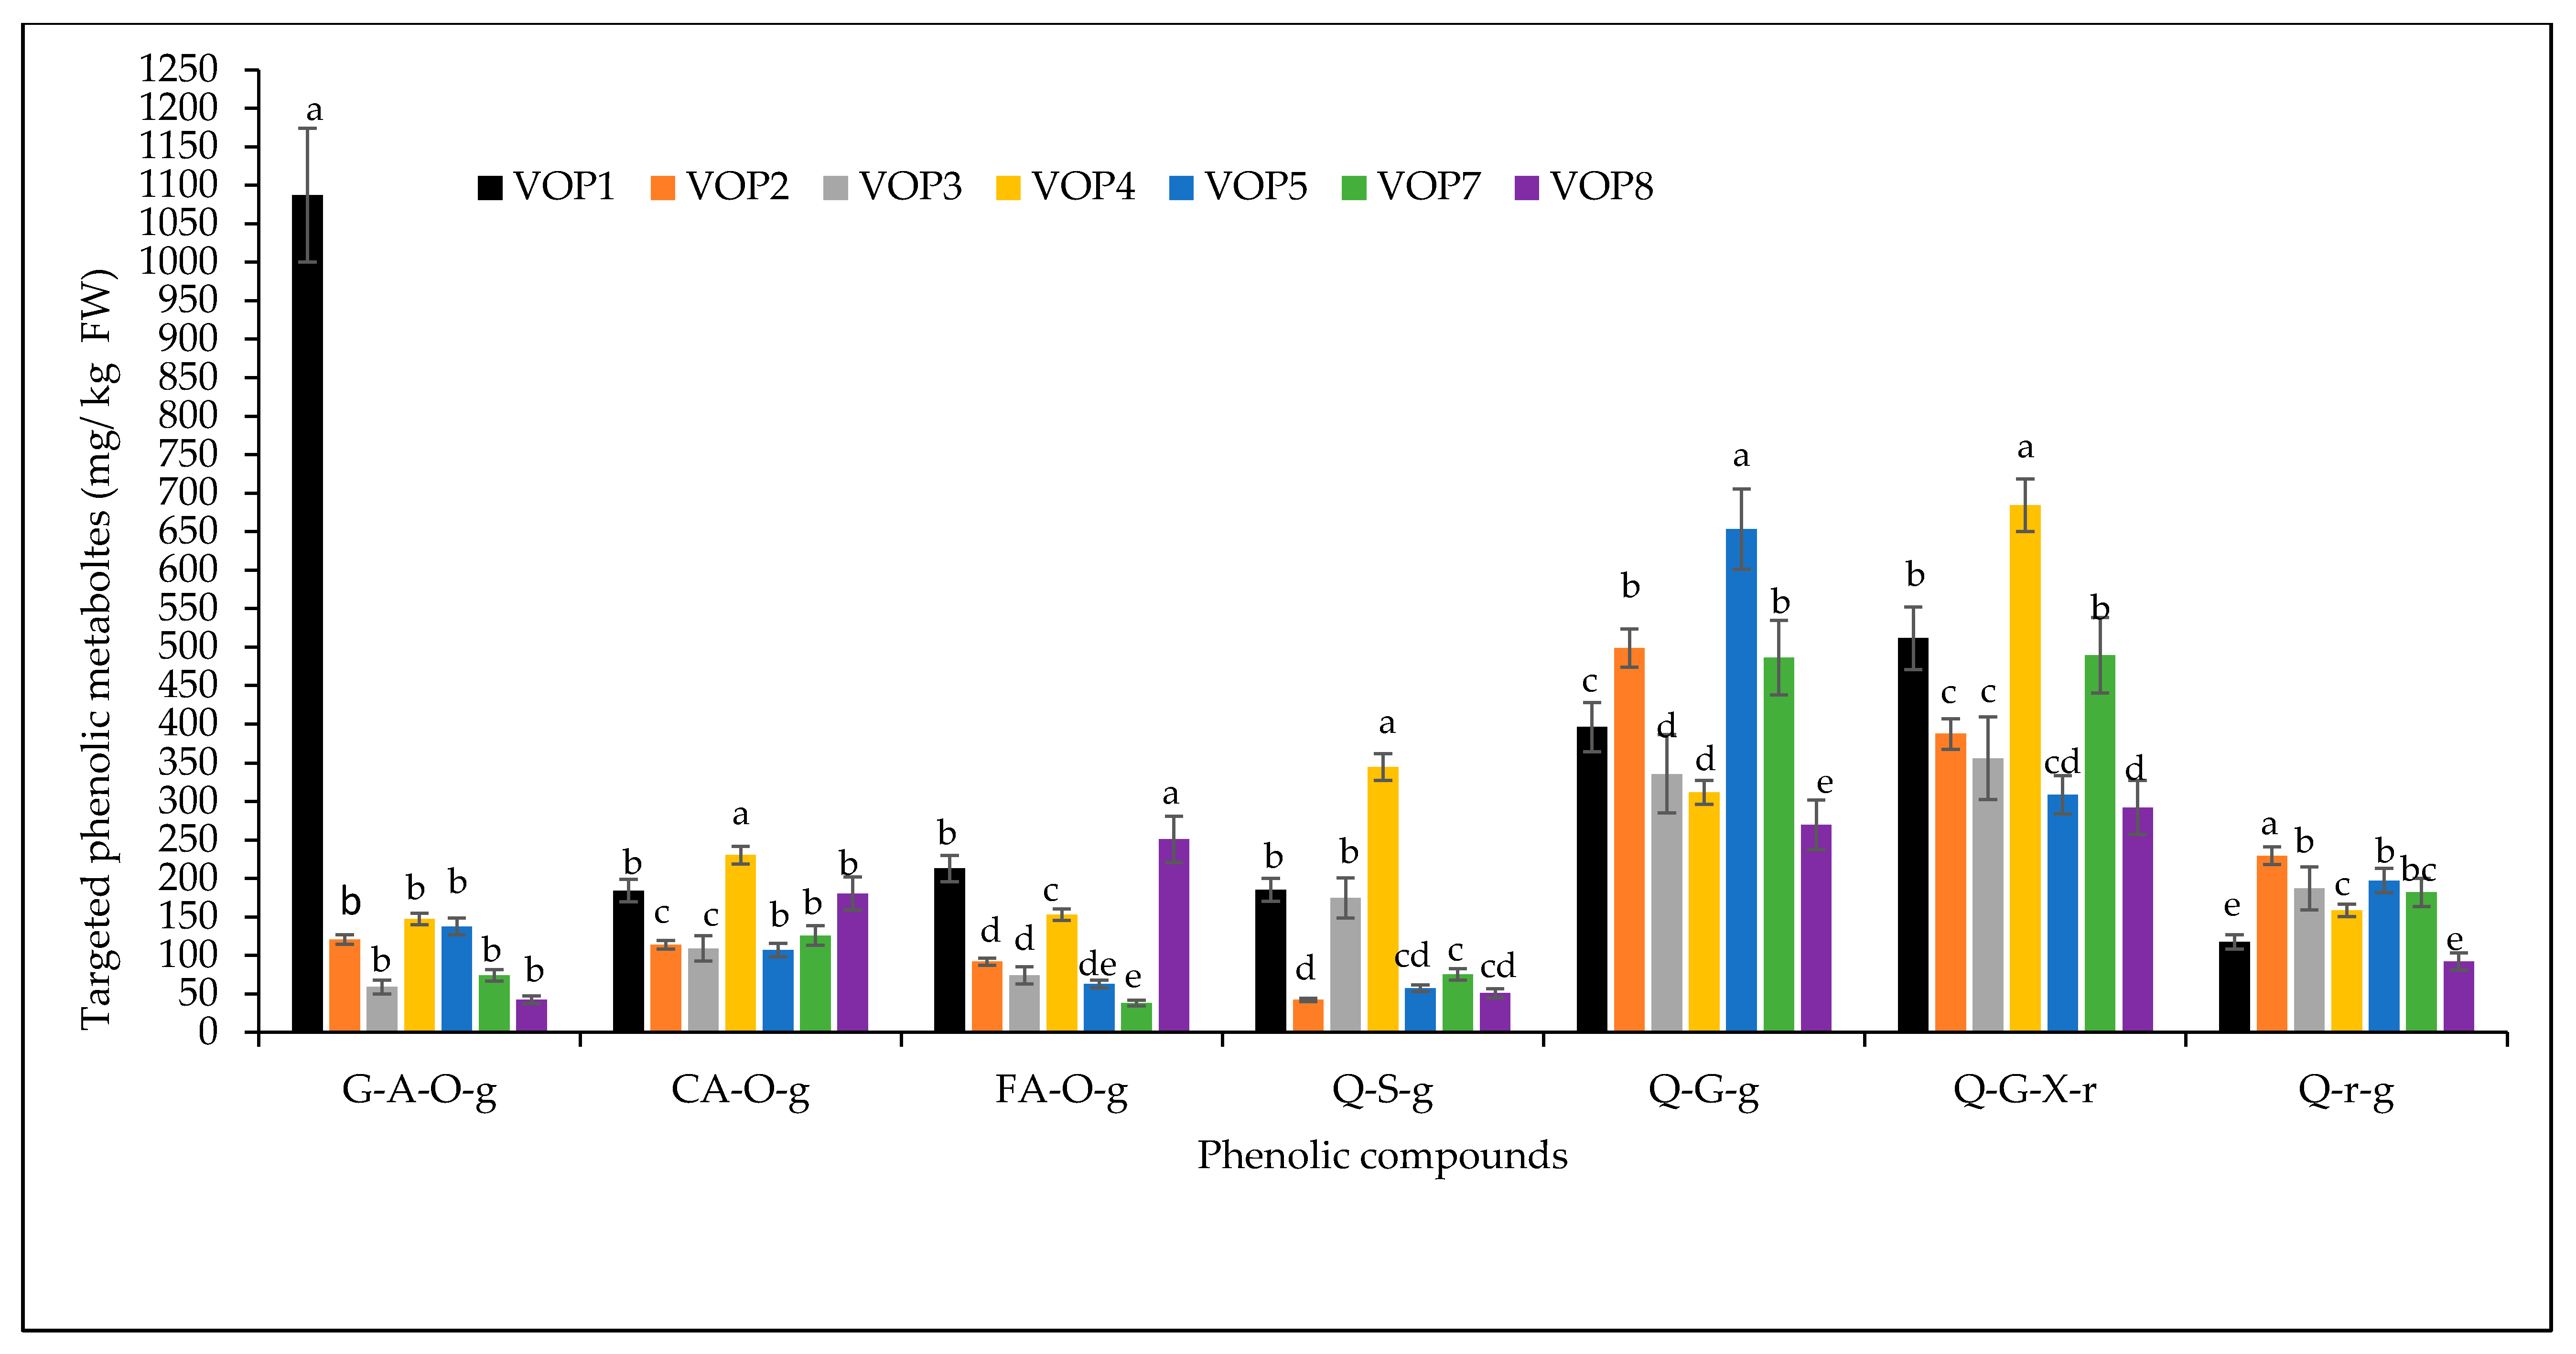
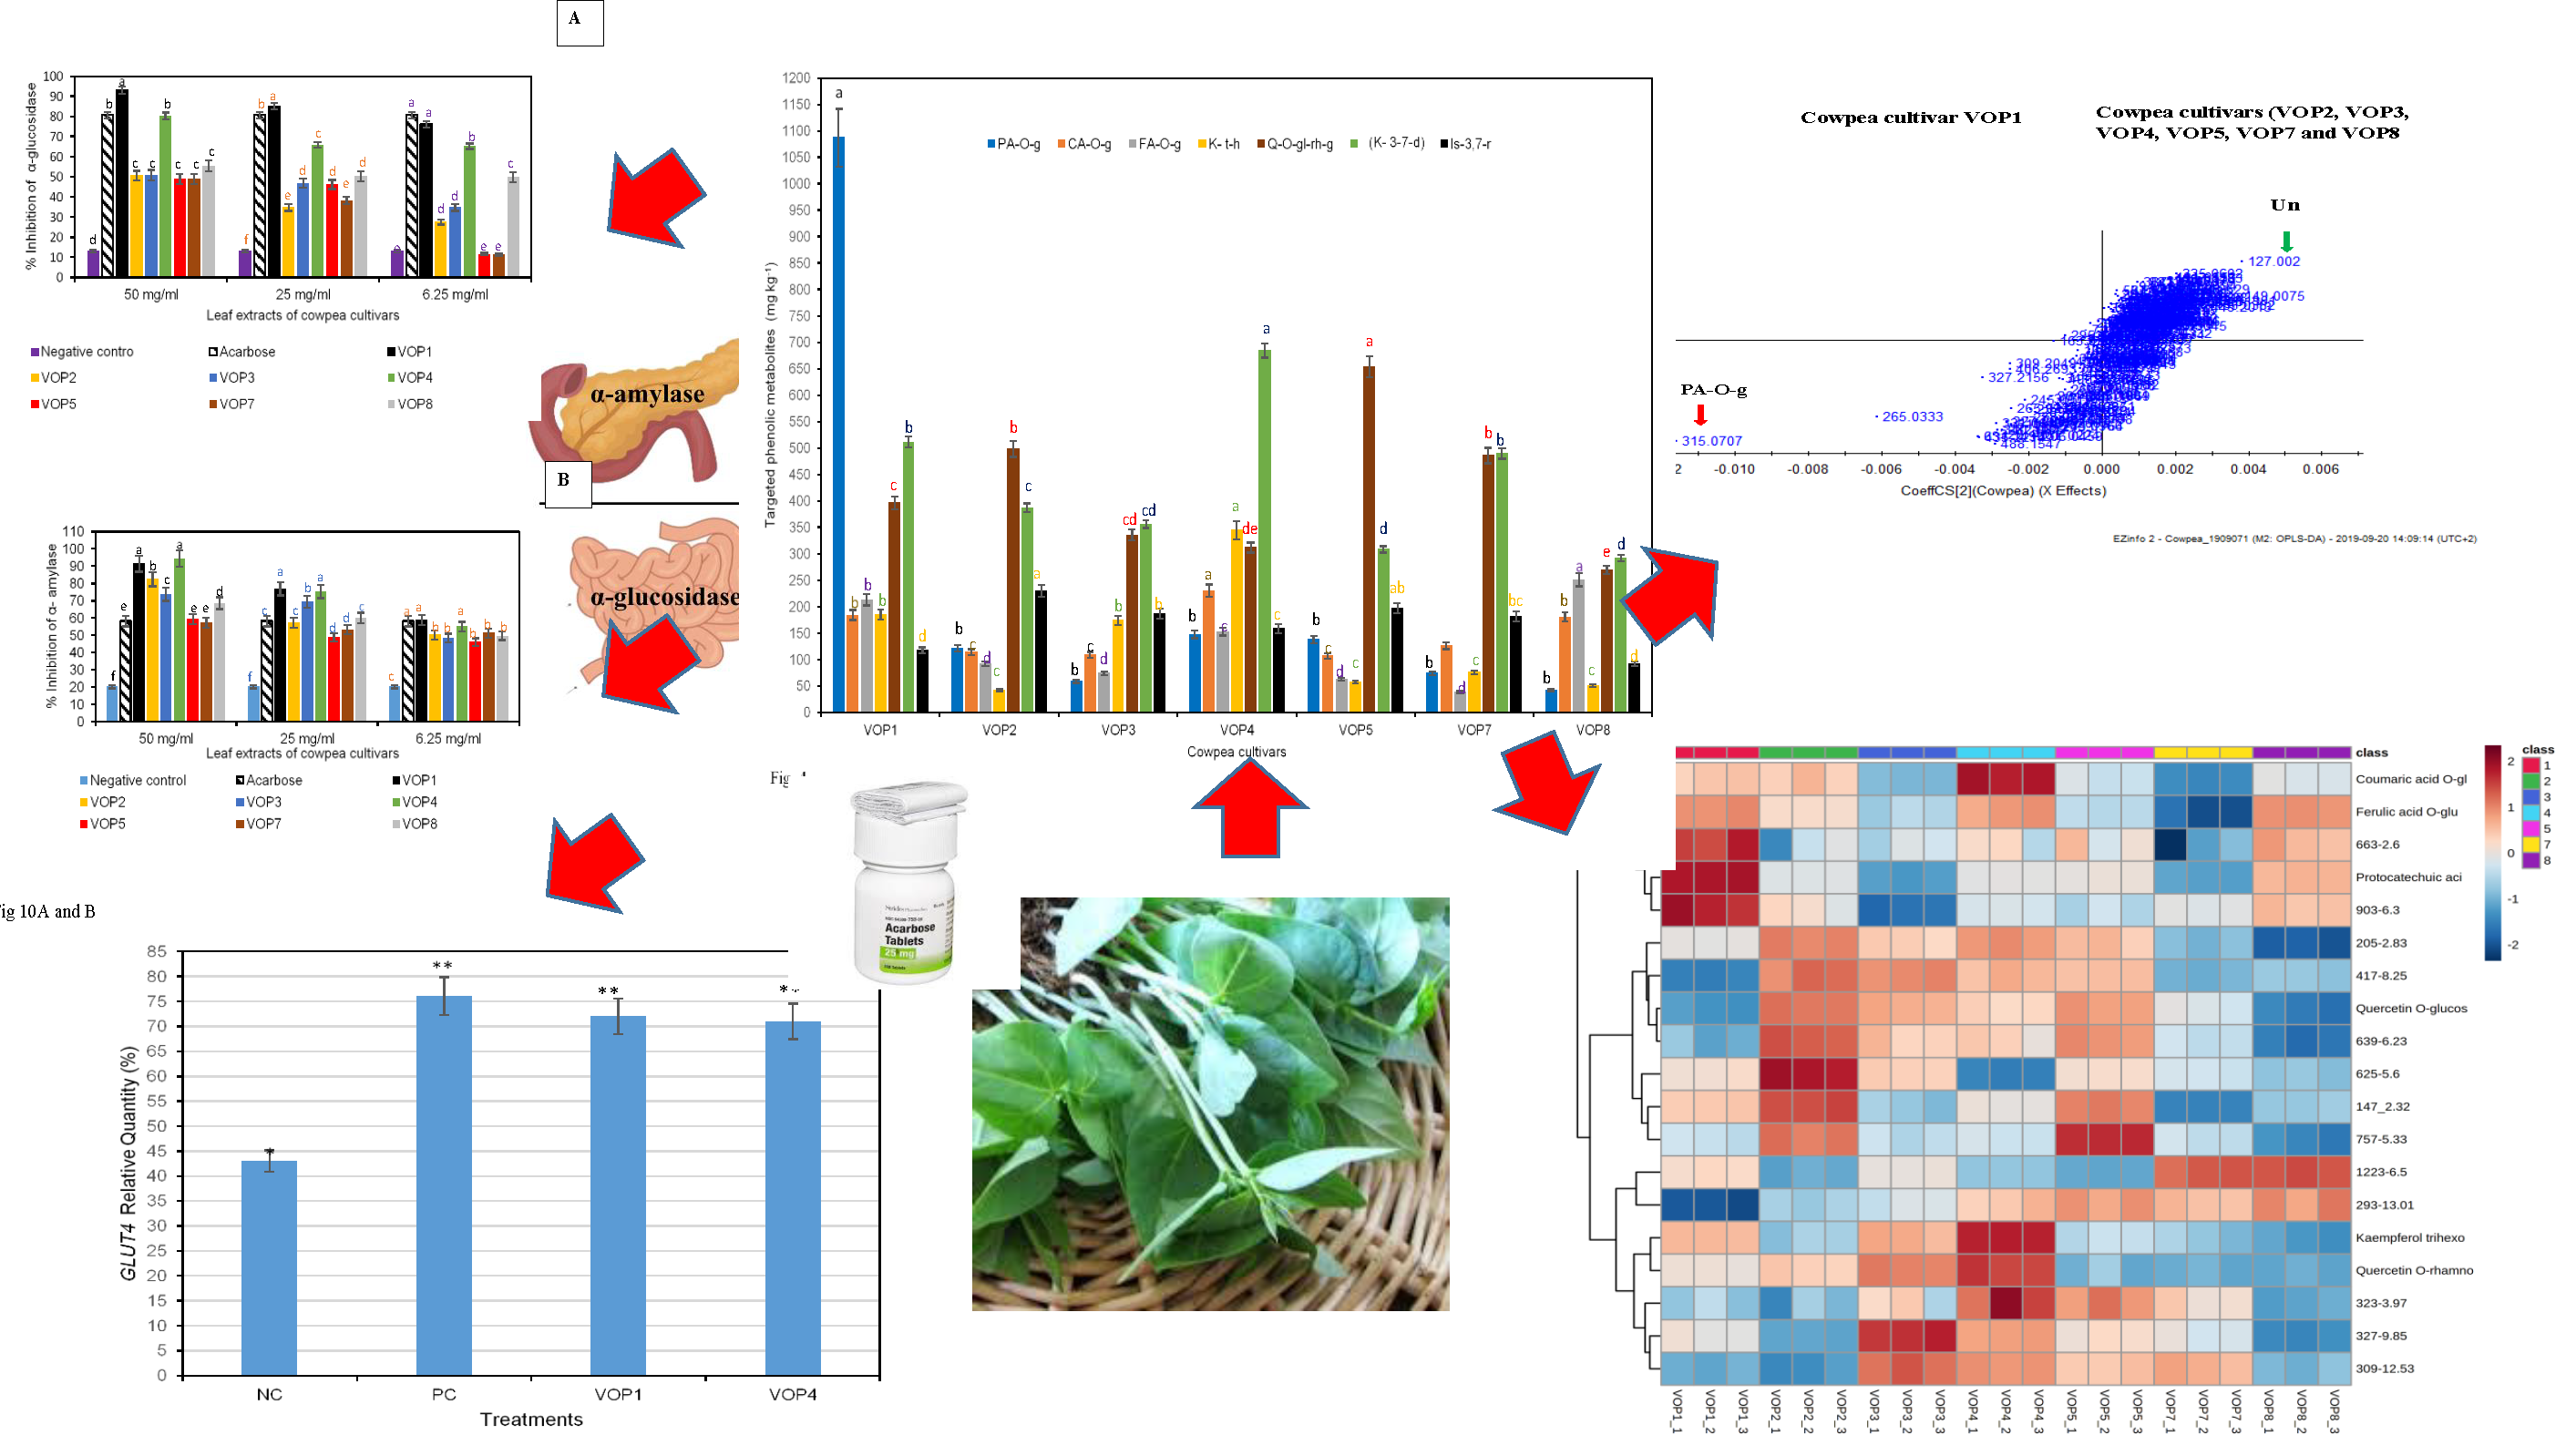
3.1. Quantification of Targeted Phenolic Metabolites in Cowpea Cultivars
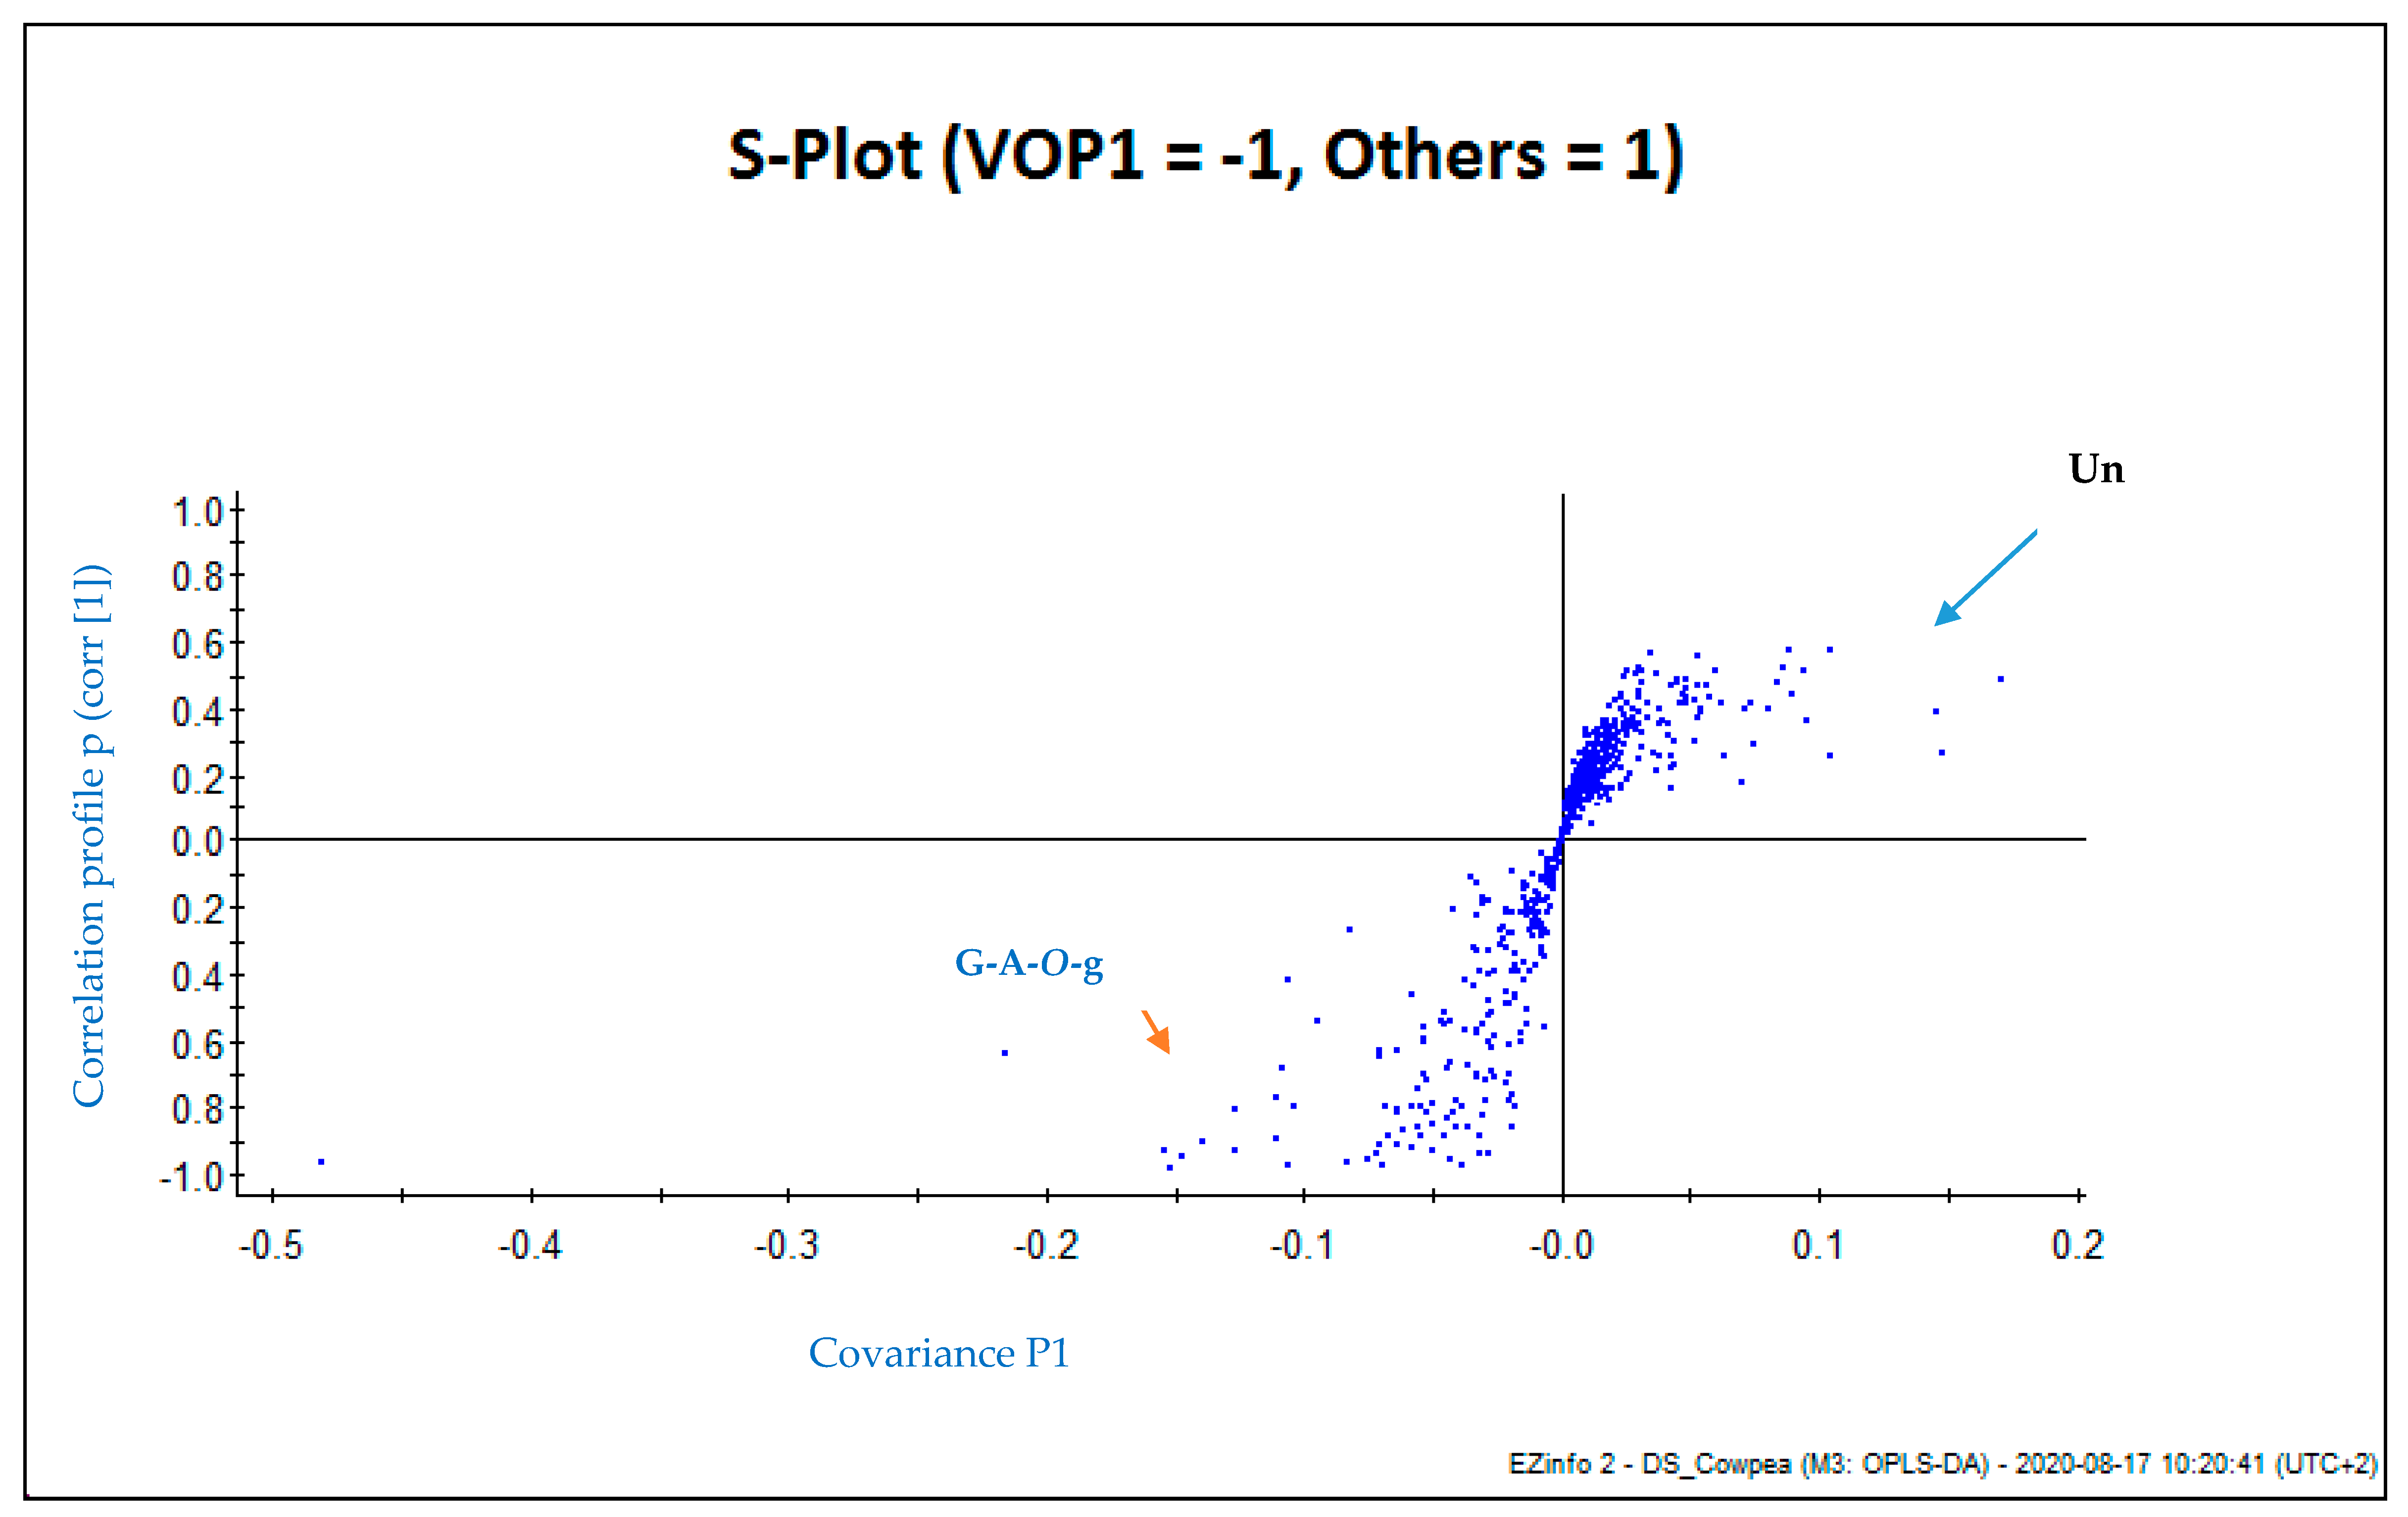
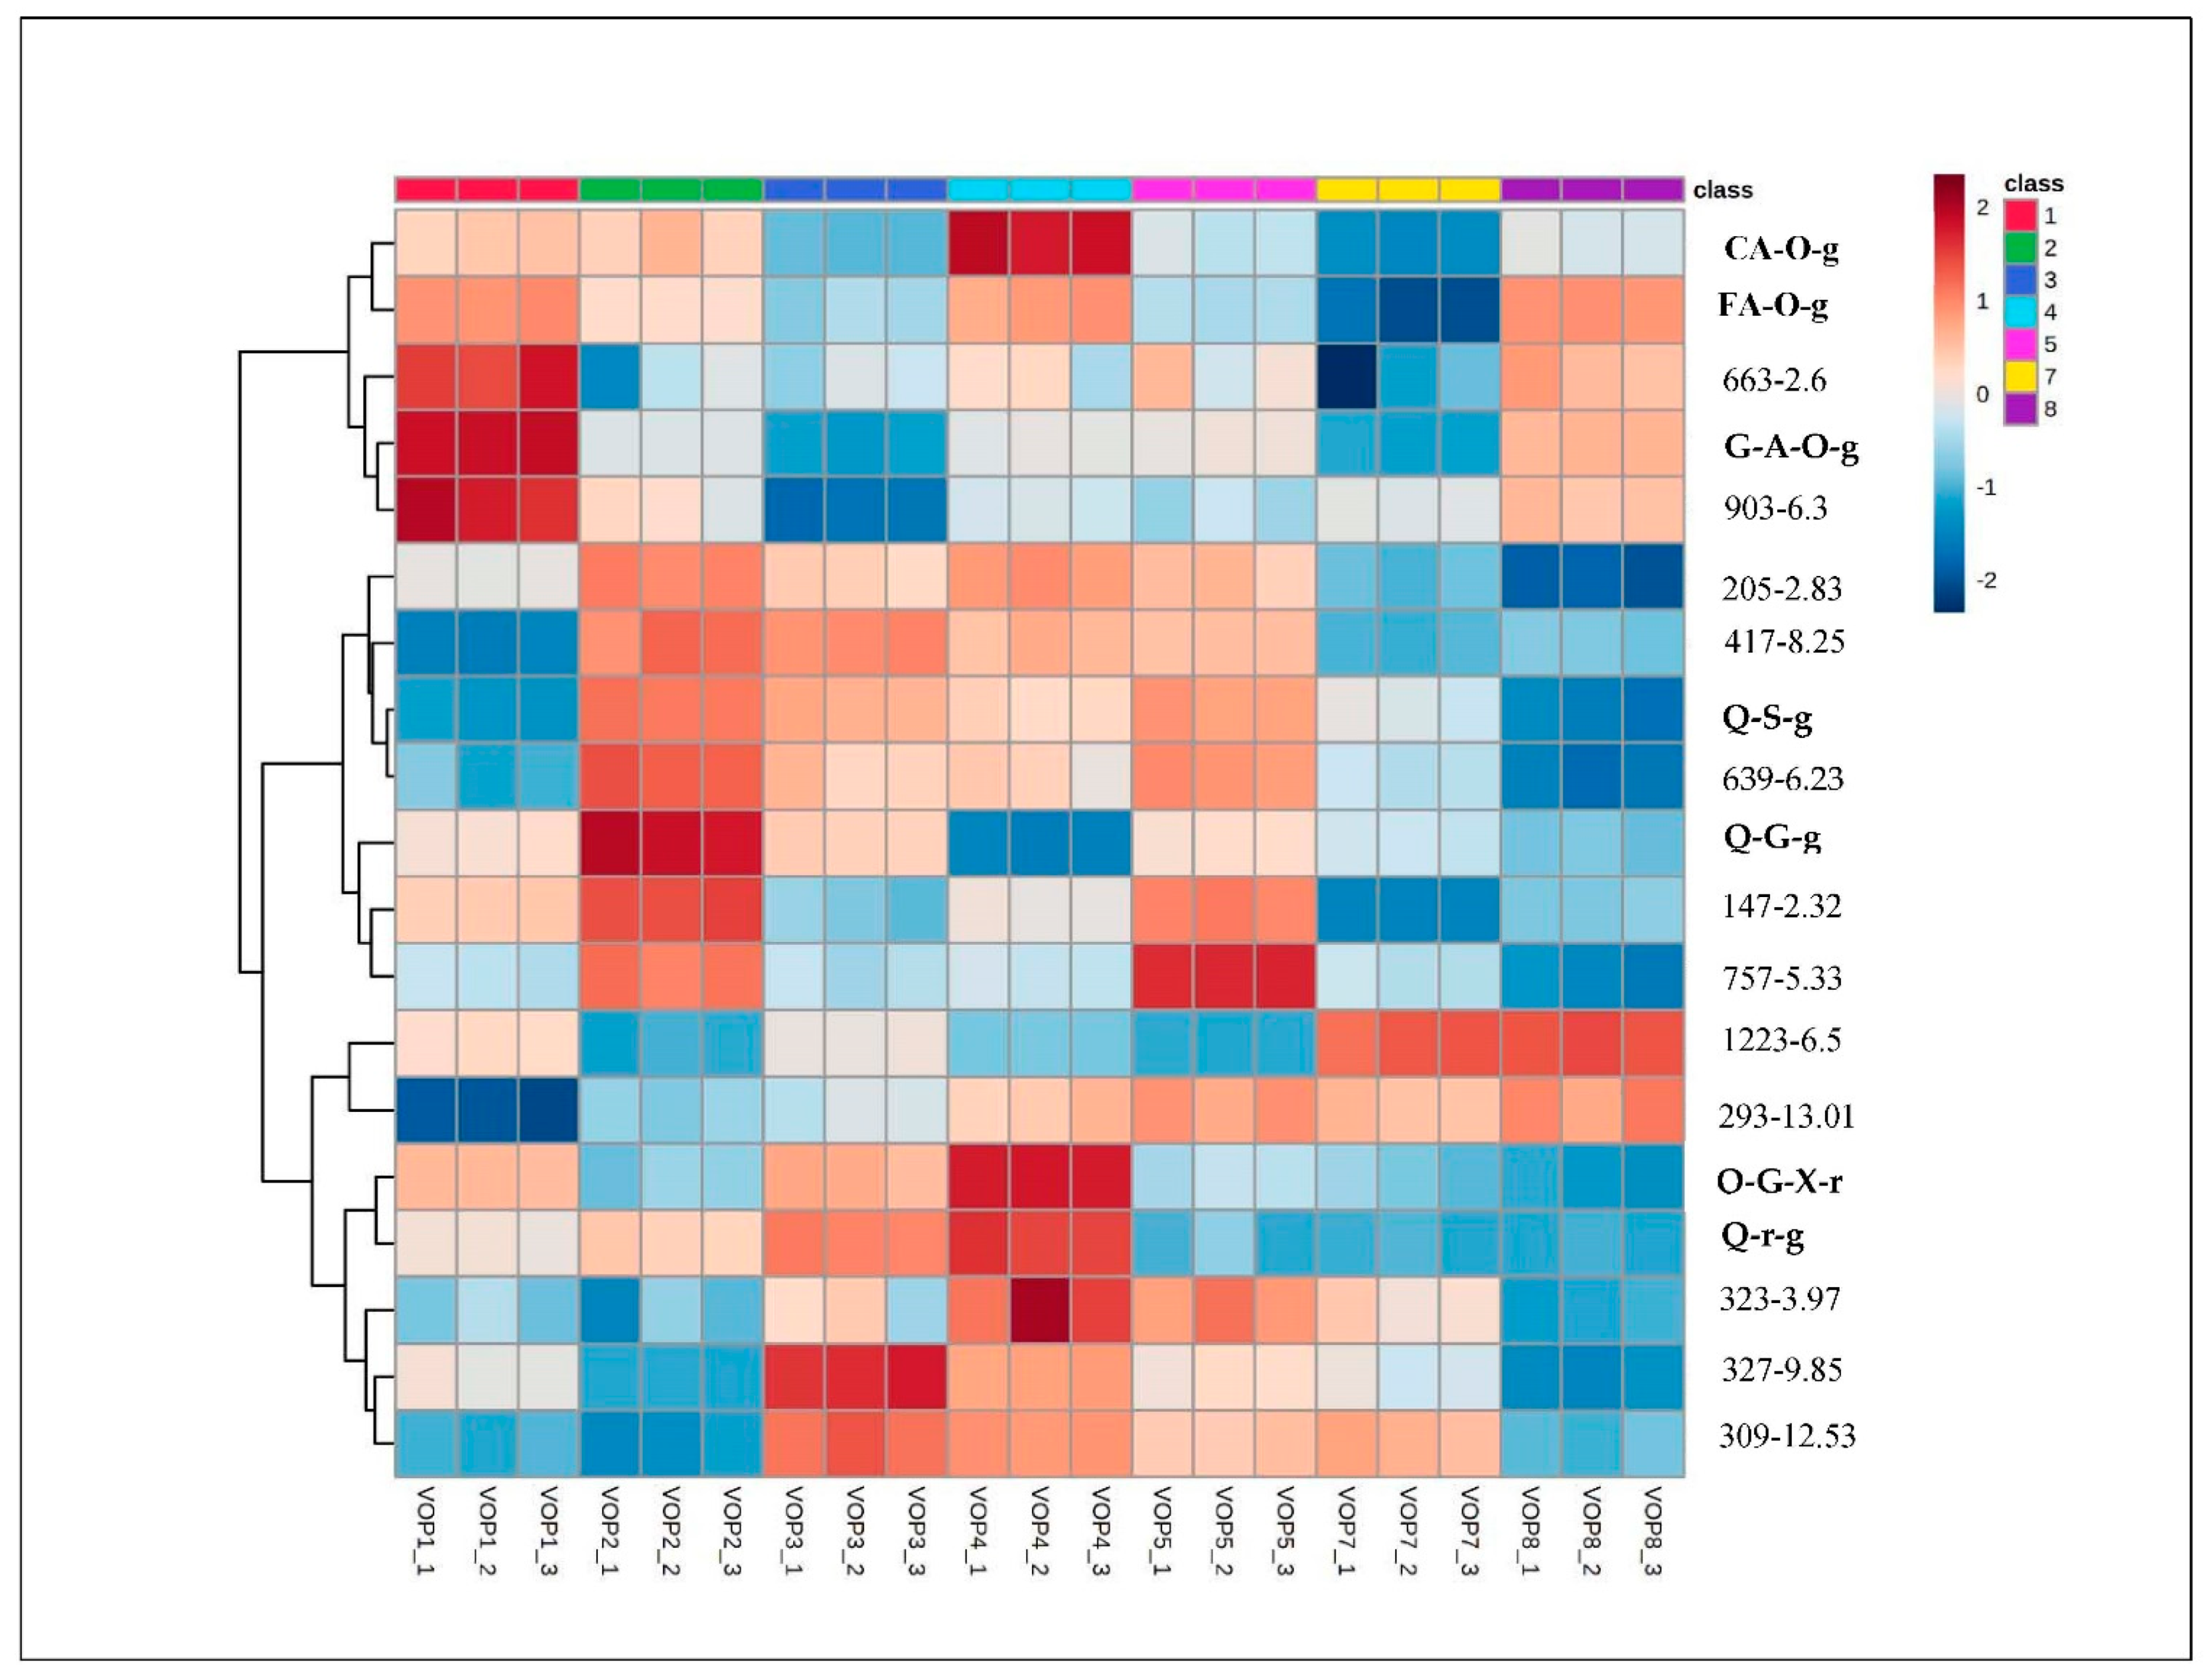
3.2. Multivariate Analysis
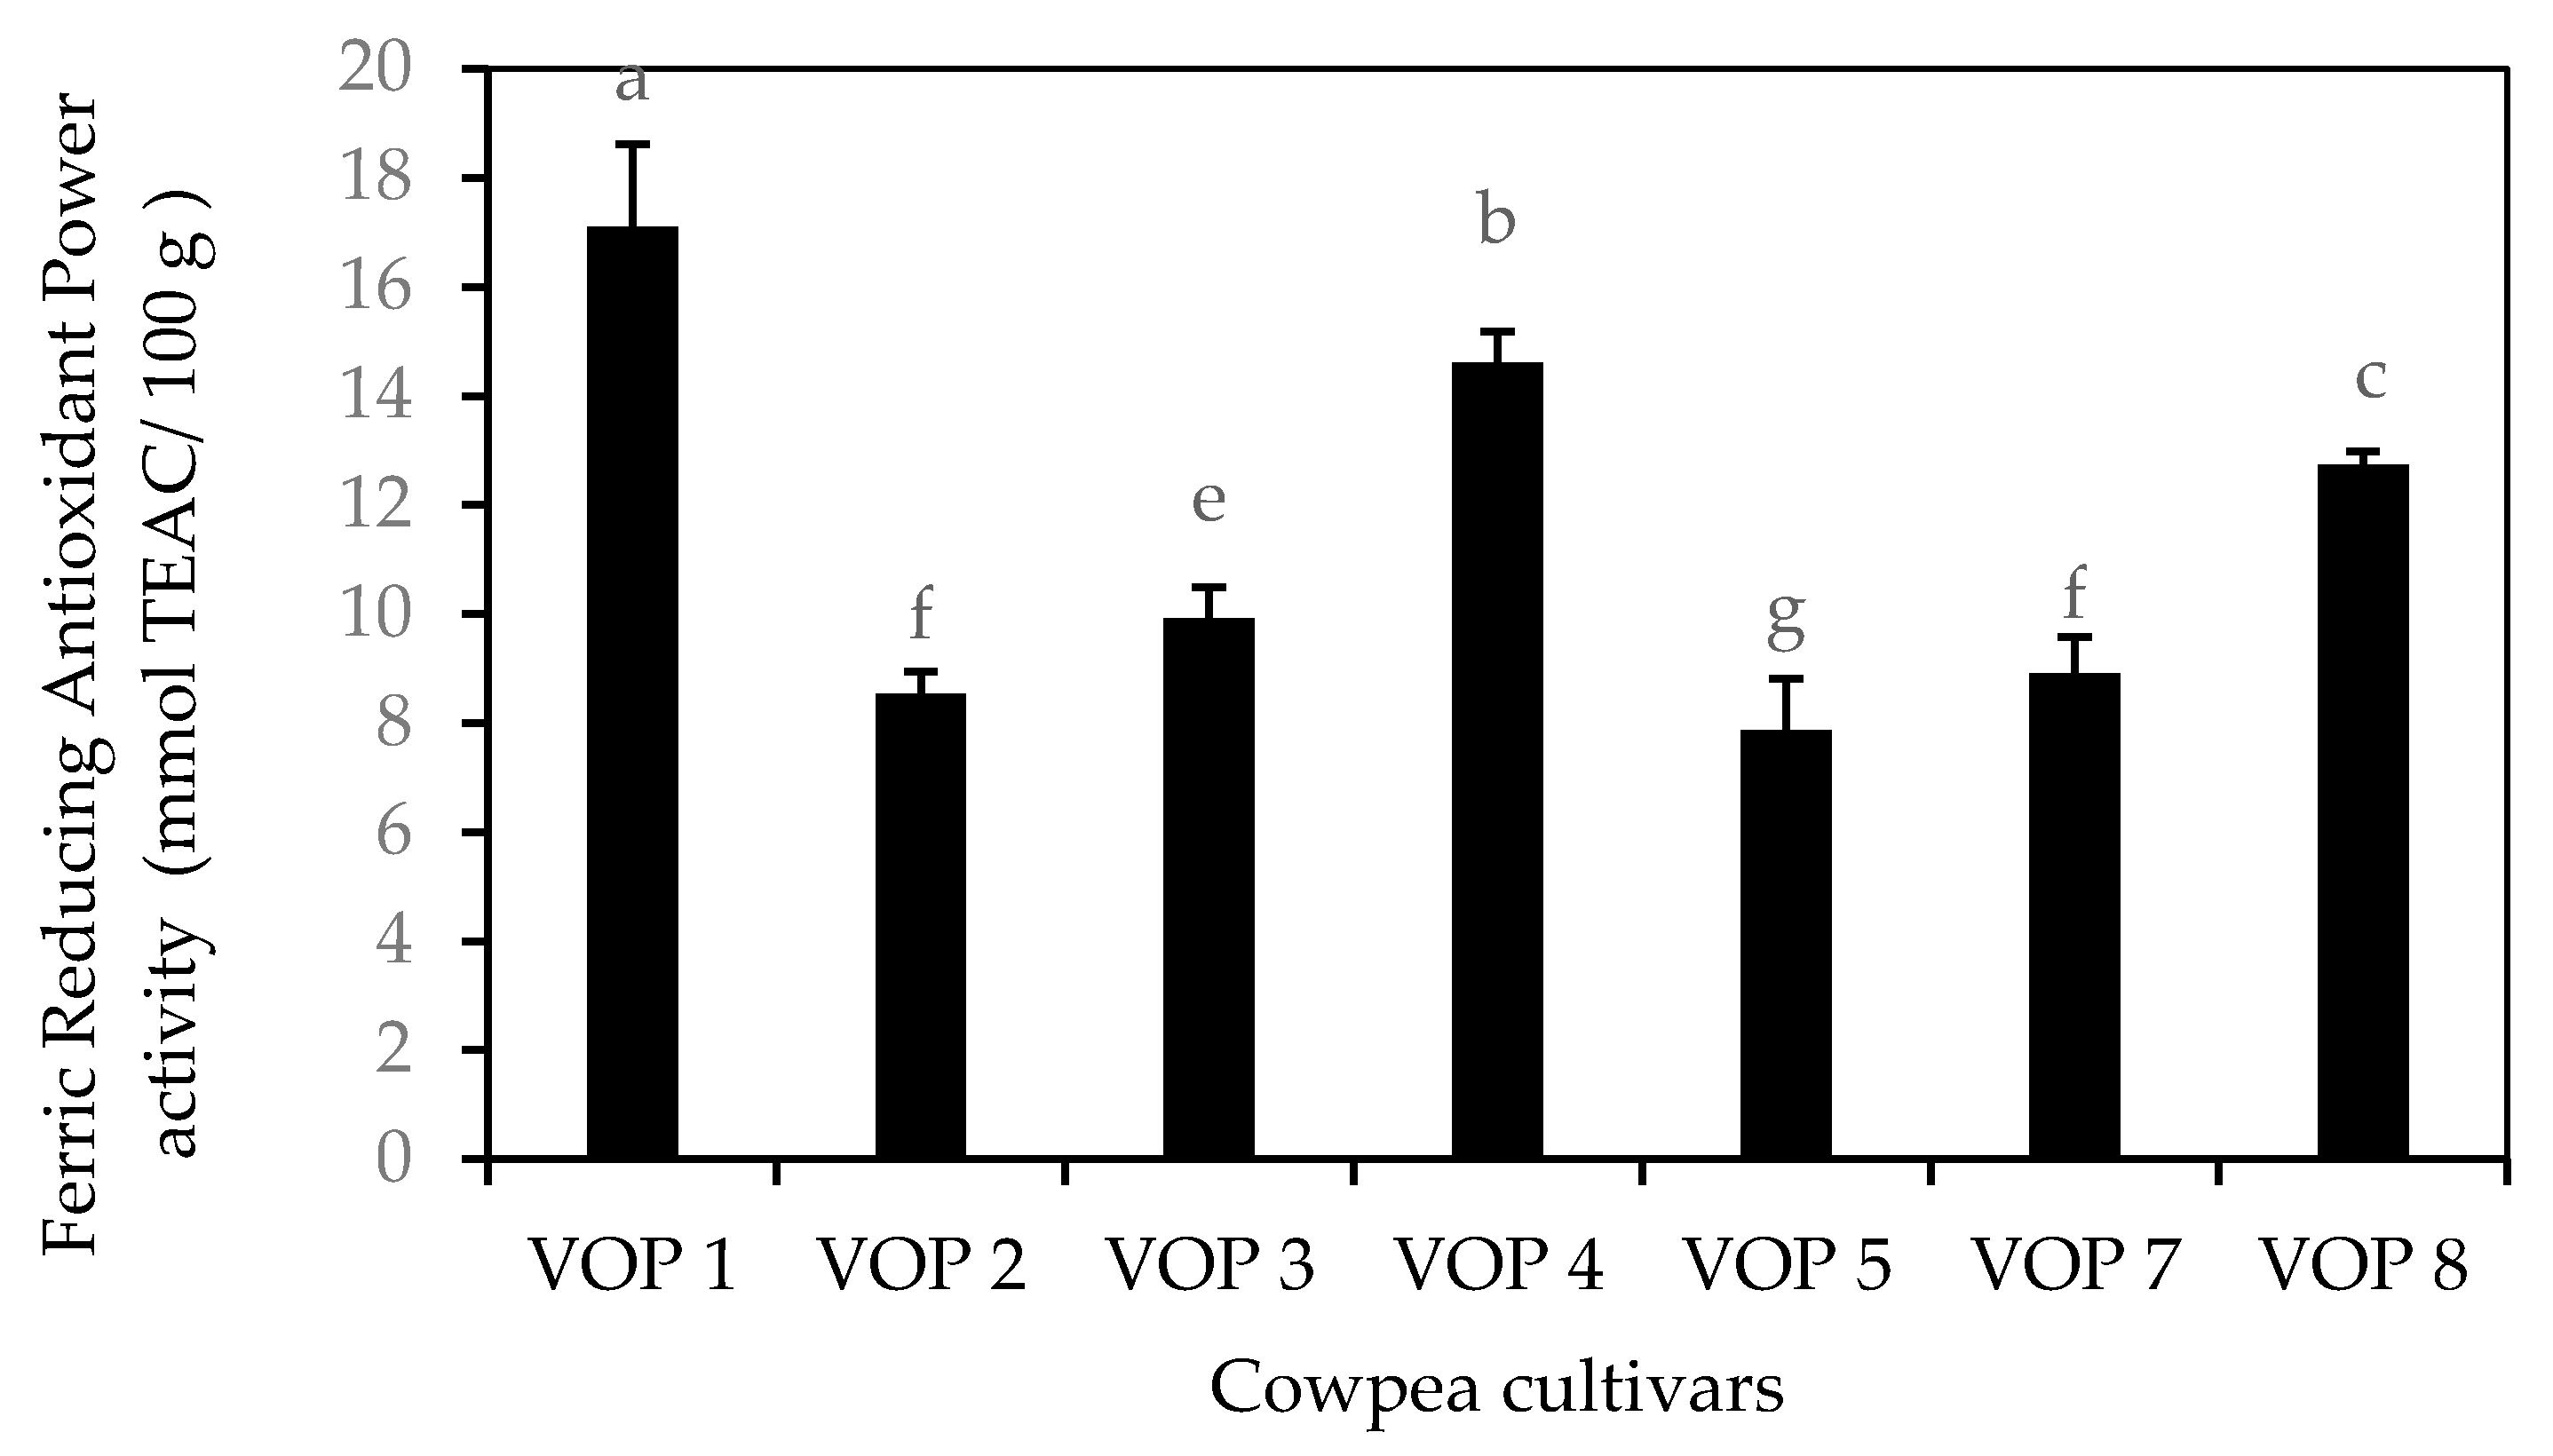
3.3. In Vitro Antioxidant Capacity
3.4. In Vitro Cytotoxic Effect
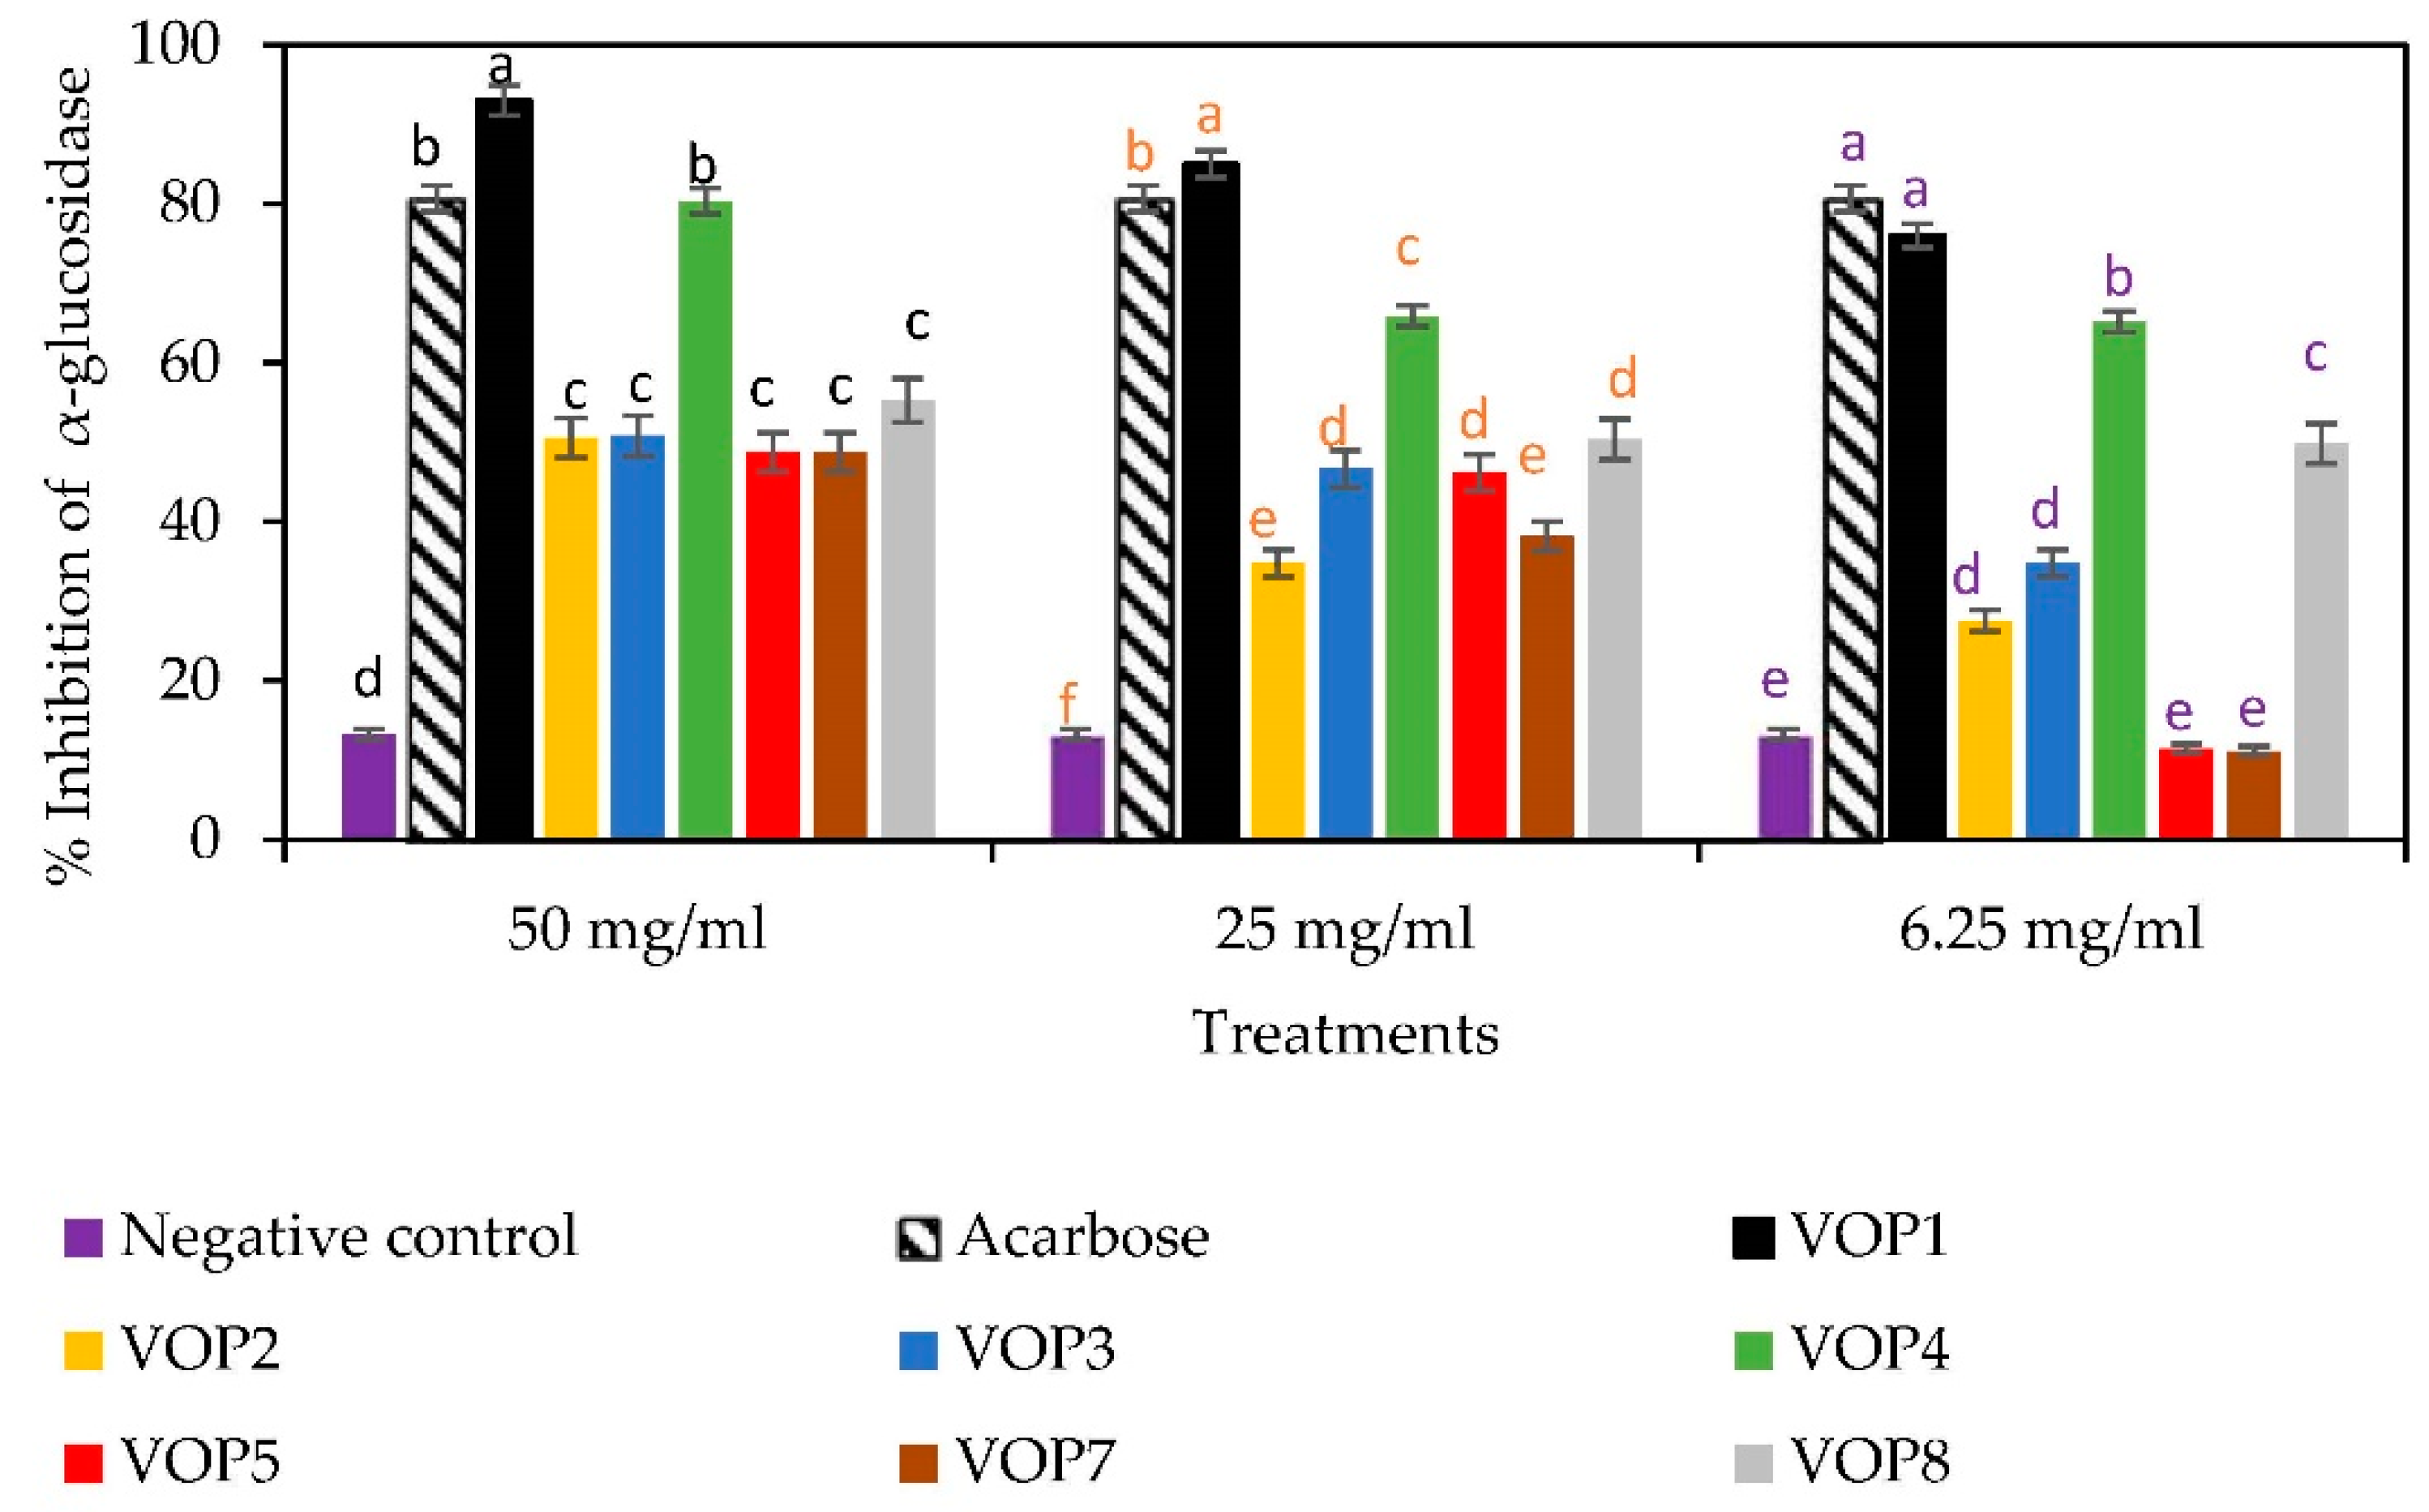
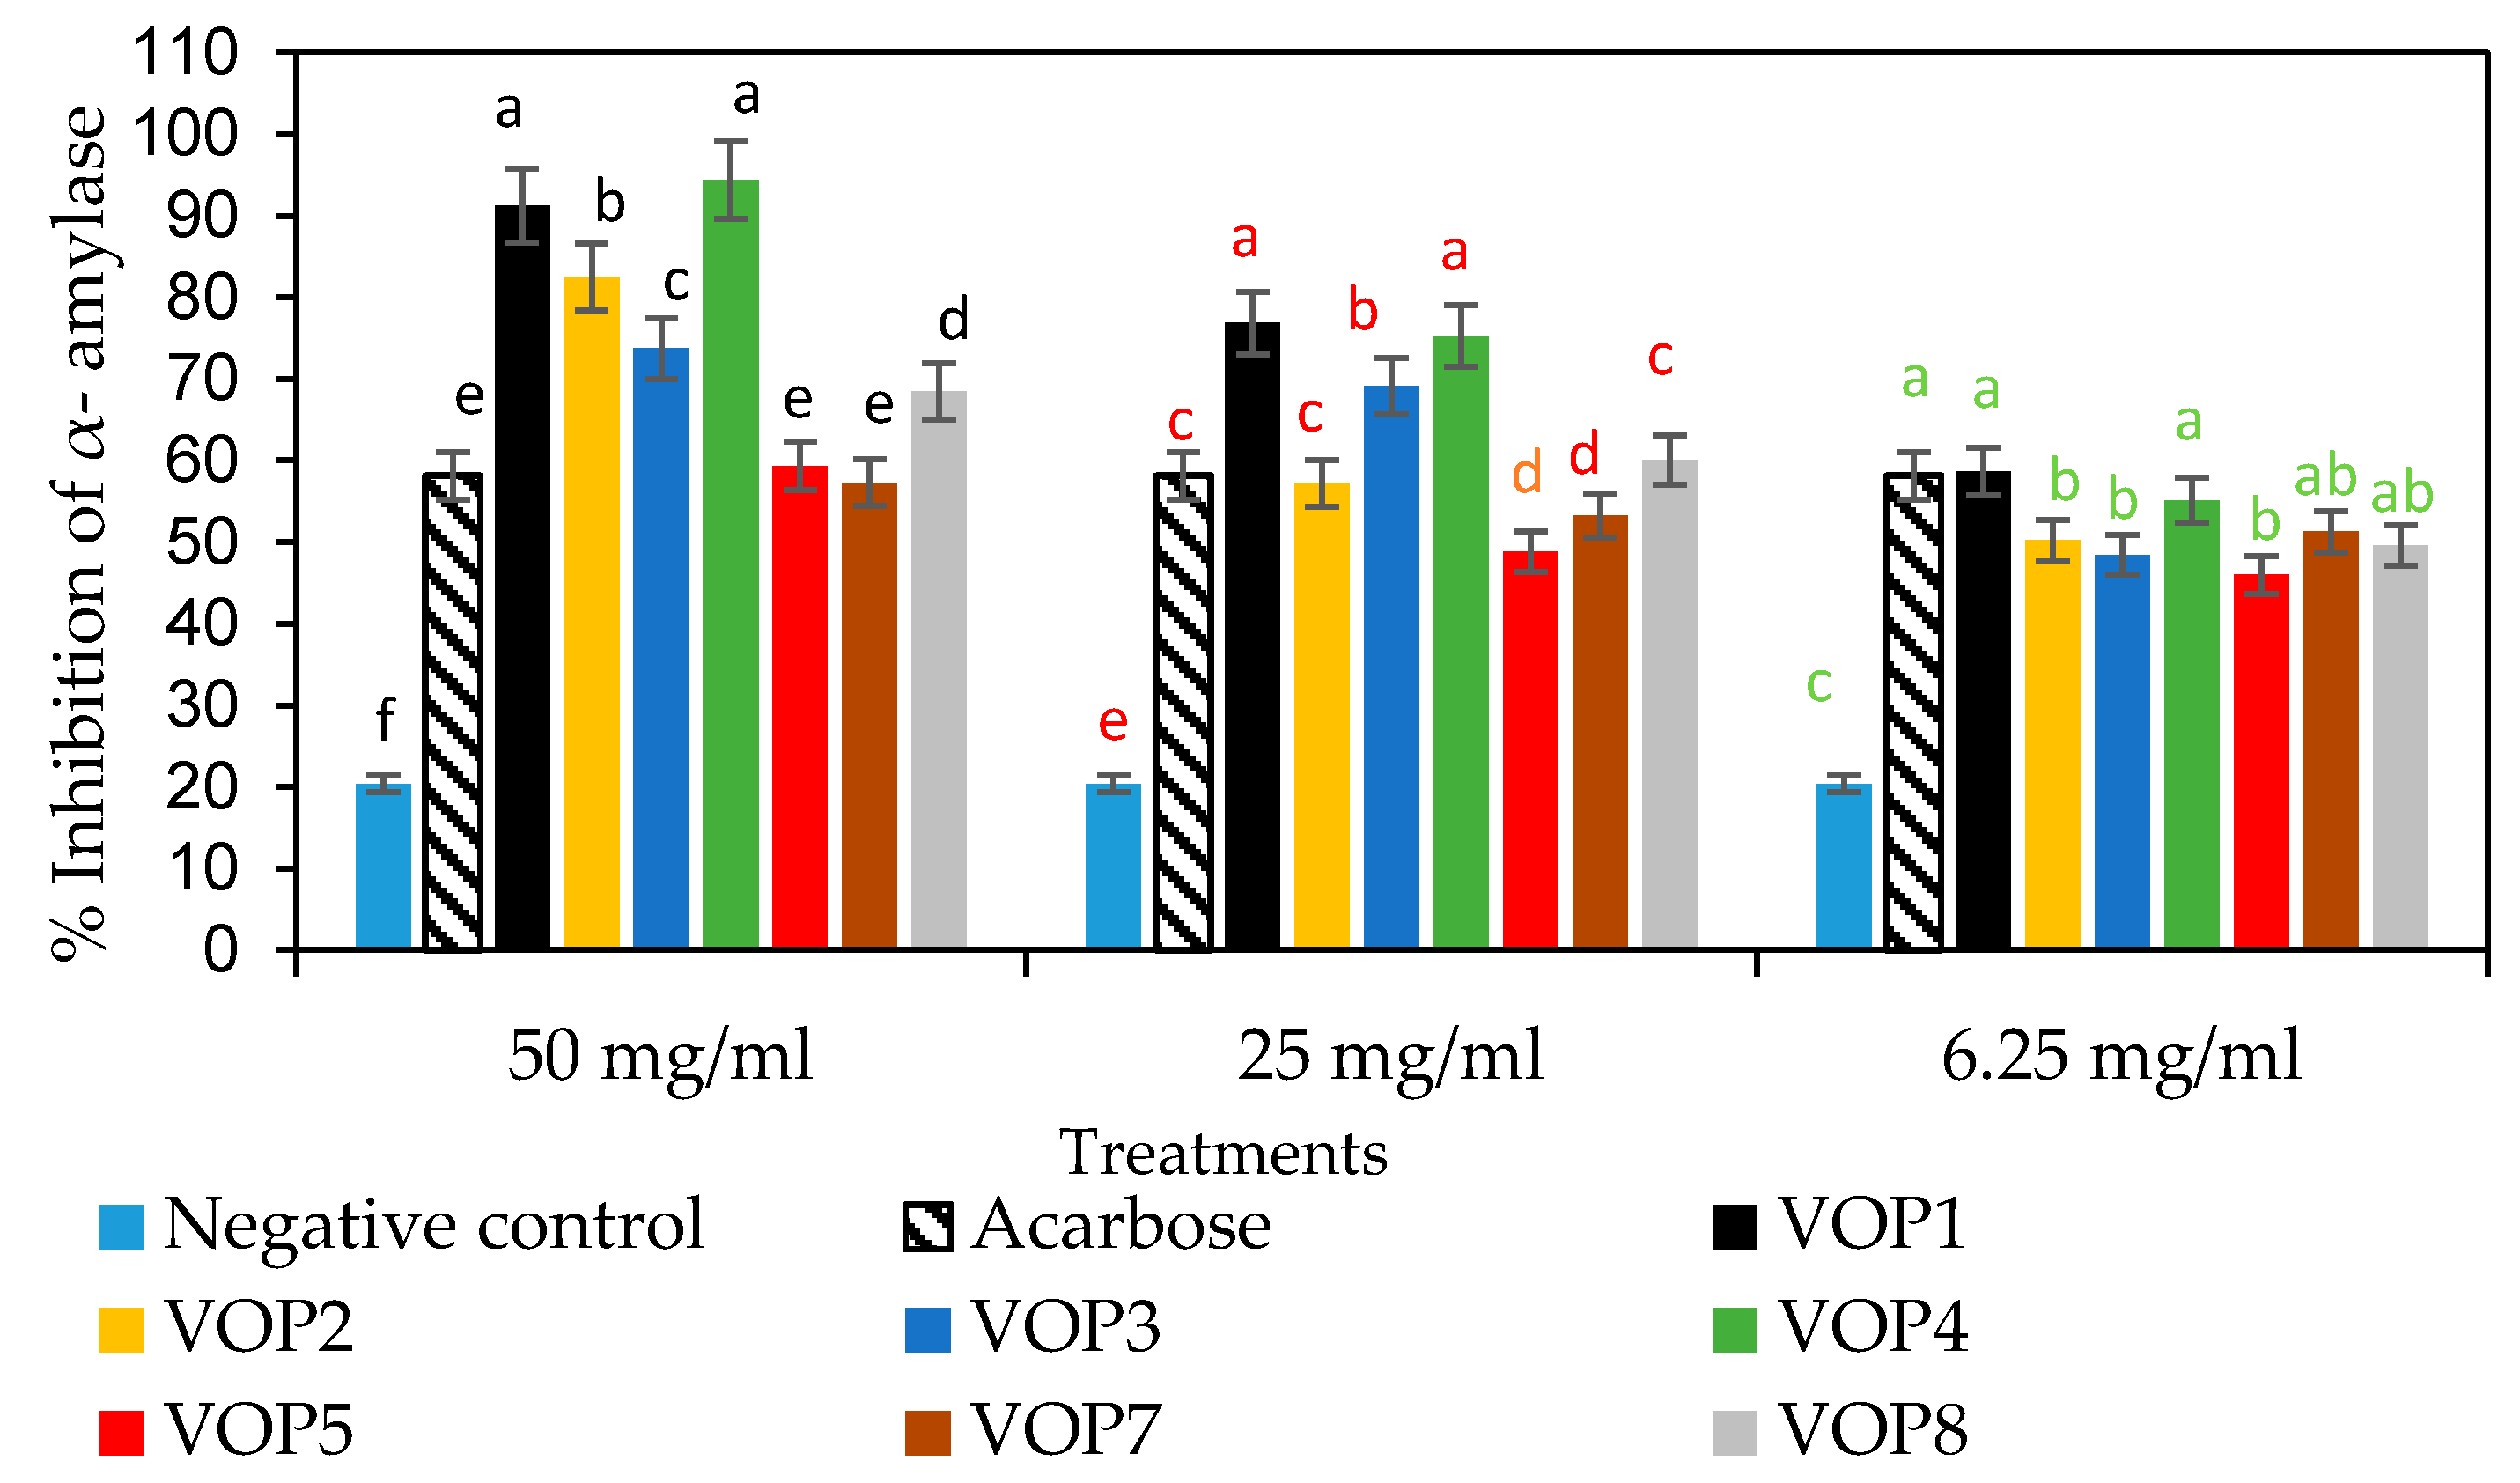
3.5. Antidiabetic Effects and GLUT4 mRNA Levels
3.6. Pearson’s Correlation Analysis
3.7. Carotenoid Profile in Cowpea Cultivars
3.8. Amino Acid Components in Cowpea Cultivars
4. Conclusions
Supplementary Materials
Author Contributions
Funding
Conflicts of Interest
References
- Owade, J.O.; Abong, G.; Okoth, M.; Mwanģombe, A.W. A review of the contribution of cowpea leaves to food and nutrition security in East Africa. Food Sci. Nutr. 2020, 8, 36–47. [Google Scholar] [CrossRef] [PubMed] [Green Version]
- Nair, M.K.; Augustine, L.; Konapur, A. Food-Based Interventions to Modify Diet Quality and Diversity to Address Multiple Micronutrient Deficiency. Front. Public Health 2015, 277. [Google Scholar] [CrossRef] [PubMed] [Green Version]
- Jayathilake, C.; Visvanathan, R.; Deen, A.; Bangamuwage, R.; Jayawardana, B.C.; Nammi, S.; Liyanage, R. Cowpea: An overview on its nutritional facts and health benefits: Nutritional and health properties of cowpea. J. Sci. Food Agric. 2018, 98, 4793–4806. [Google Scholar] [CrossRef] [PubMed]
- Gonçalves, A.; Goufo, P.; Barros, A.; Domínguez-Perles, R.; Trindade, H.; Rosa, E.A.; Ferreira, L.; Rodrigues, M. Cowpea (Vigna unguiculata L. Walp), a renewed multipurpose crop for a more sustainable agri-food system: Nutritional advantages and constraints. J. Sci. Food Agric. 2016, 96, 2941–2951. [Google Scholar] [CrossRef]
- Kahlon, T.S.; Chapman, M.H.; Smith, G.E. In vitro binding of bile acids by spinach, kale, brussels sprouts, broccoli, mustard greens, green bell pepper, cabbage and collards. Food Chem. 2007, 100, 1531–1536. [Google Scholar] [CrossRef]
- Van Jaarsveld, P.; Faber, M.; van Heerden, I.; Wenhold, F.; Jansen van Rensburg, W.; van Averbeke, W. Nutrient content of eight African leafy vegetables and their potential contribution to dietary reference intakes. J. Food Compos. Anal. 2014, 33, 77–84. [Google Scholar] [CrossRef] [Green Version]
- RDA Vitamin A. Available online: https://www.nal.usda.gov/fnic/vitamins-and-mineralse (accessed on 25 August 2020).
- RDA Fe. Available online: https://ods.od.nih.gov/factsheets/Iron-HealthProfessional (accessed on 25 August 2020).
- Zhang, B.; Deng, Z.; Ramdath, D.D.; Tang, Y.; Chen, P.X.; Liu, R.; Liu, Q.; Tsao, R. Phenolic profiles of 20 Canadian lentil cultivars and their contribution to antioxidant activity and inhibitory effects on α-glucosidase and pancreatic lipase. Food Chem. 2015, 172, 862–872. [Google Scholar] [CrossRef]
- Lankatillake, C.; Huynh, T.; Dias, D.A. Understanding glycaemic control and current approaches for screening antidiabetic natural products from evidence-based medicinal plants. Plant Methods 2019, 15, 105. [Google Scholar] [CrossRef] [Green Version]
- Huang, S.; Czech, M.P. The GLUT4 glucose transporter. Cell Metab. 2007, 4, 237–252. [Google Scholar] [CrossRef] [Green Version]
- Peer, N.; Kengne, A.P.; Motala, A.A.; Mbanya, J.C. Diabetes in the African region: An update. Diabetes Res. Clin. 2014, 103, 197–205. [Google Scholar] [CrossRef]
- Farag, M.A.; Khattab, A.R.; Maamoun, A.A.; Heiss, A.G. UPLC-MS metabolome based classification of Lupinus and Lens seeds: A prospect for phyto-equivalency of its different accessions. Food Res. Int. 2019, 115, 379–392. [Google Scholar] [CrossRef] [PubMed]
- Ndou, A.; Tinyani, P.P.; Slabbert, R.M.; Sultanbawa, Y.; Sivakumar, D. An integrated approach for harvesting Natal plum (Carissa macrocarpa) for quality and functional compounds related to maturity stages. Food Chem. 2019, 293, 499–510. [Google Scholar] [CrossRef] [PubMed]
- Managa, G.M.; Remize, F.; Garcia, C.; Sivakumar, D. Effect of moist cooking blanching on colour, phenolic metabolites and glucosinolate content in Chinese cabbage (Brassica rapa L. subsp. chinensis). Foods 2019, 8, 399. [Google Scholar] [CrossRef] [PubMed] [Green Version]
- Mpai, S.; du Preez, R.; Sultanbawa, Y.; Sivakumar, D. Phytochemicals and nutritional composition in accessions of Kei-apple (Dovyalis caffra): Southern African indigenous fruit. Food Chem. 2018, 253, 37–45. [Google Scholar] [CrossRef] [PubMed] [Green Version]
- Sagbo, I.J.; van de Venter, M.; Koekemoer, T.; Bradley, G. In Vitro Antidiabetic Activity and Mechanism of Action of Brachylaena elliptica (Thunb.) DC. Evid. Based Complementary Altern. Med. 2018, 1–13. [Google Scholar] [CrossRef] [PubMed]
- Seabi, I.M.; Motaung, S.C.K.M.; Ssemakalu, C.C.; Mokgotho, M.P.; Mogale, A.M.; Shai, L.J. Effects of Cassia abbreviata Oliv. and Helinus integrifolius (Lam.) Kuntze on Glucose Uptake, Glut-4 Expression and Translocation in Muscle (C2C12 Mouse Myoblasts) Cells. Int. J. Pharmacogn. 2016, 8, 1003–1009. [Google Scholar]
- Djuikwo, V.; Ejoh, A.; Inocent, G.; Mbofung, C.; Tanumihardjo, S. Determination of Major Carotenoids in Processed Tropical Leafy Vegetables Indigenous to Africa. Food Sci. Nutr. 2011, 2, 793–802. [Google Scholar] [CrossRef] [Green Version]
- Abu-Reidah, I.M.; Arráez-Román, D.; Lozano-Sánchez, J.; Segura-Carretero, A.; Fernández-Gutiérrez, A. Phytochemical characterisation of green beans (Phaseolus vulgaris L.) by using highperformance liquid chromatography coupled with time-of-flight mass spectrometry. Phytochem. Anal. 2013, 24, 105–116. [Google Scholar] [CrossRef]
- Price, K.R.; Colquhoun, I.J.; Barnes, K.A.; Rhodes, M.J.C. Composition and content of flavonol glycosides in green beans and their fate during processing. J. Agric. Food Chem. 1998, 46, 4898–4903. [Google Scholar] [CrossRef]
- Plumb, G.W.; Price, K.R.; Williamson, G. Antioxidant properties of flavonol glycosides from green beans. Redox Rep. 1999, 4, 123–127. [Google Scholar] [CrossRef]
- Shivanagoudra, S.R.; Perera, W.H.; Perez, J.L.; Athrey, G.; Sunc, Y.; Wu, C.S.; Jayaprakasha, G.K.; Patil, B.S. In vitro and in silico elucidation of antidiabetic and anti-inflammatory activities of bioactive compounds from Momordica charantia L. Bioorg. Med. Chem. Lett. 2019, 27, 3097–3109. [Google Scholar] [CrossRef] [PubMed]
- Pereiraa, G.A.; Arruda, H.S.; de Morais, D.R.; Peixoto Araujo, N.M.; Pastore, G.M. Mutamba (Guazuma ulmifolia Lam.) fruit as a novel source of dietary fibre and phenolic compounds. Food Chem. 2020, 25, 125857. [Google Scholar] [CrossRef] [PubMed]
- Aherne, S.A.; O’Brien, N.M. Dietary flavonols: Chemistry, food content, and metabolism. Nutrition 2002, 18, 75–81. [Google Scholar] [CrossRef]
- Hollman, P.C.H.; de Vries, J.H.M.; van Leeuwen, S.D.; Mengelers, M.J.B.; Katan, M.B. Absorption of dietary quercetin glycosides and quercetin in healthy ileostomy volunteers. Am. J. Clin. Nutr. 1995, 62, 1276–1282. [Google Scholar] [CrossRef] [PubMed] [Green Version]
- Manach, C.; Williamson, G.; Morand, C.; Scalbert, A.; Rémés, C. Bioavailability and bioefficacy of polyphenols in humans. I. Review of 97 bioavailability studies1–3. Am. J. Clin. Nutr. 2005, 81, 230S–242S. [Google Scholar] [CrossRef] [Green Version]
- Stangeland, T.; Remberg, S.F.; Lye, K.A. Total antioxidant activity in 35 Ugandan fruits and vegetable. Food Chem. 2009, 113, 85–91. [Google Scholar] [CrossRef]
- Rybiński, W.; Karamać, M.; Sulewska, K.; Amarowicz, R. Antioxidant Activity of Faba Bean Extracts. Available online: https://www.intechopen.com/books/plant-extracts/antioxidant-activity-of-faba-bean-extracts (accessed on 26 August 2020). [CrossRef] [Green Version]
- Ademiluyi, A.O.; Aladeselu, O.H.; Oboh, G.; Boligon, A.A. Drying alters the phenolic constituents, antioxidant properties, α-amylase, and α-glucosidase inhibitory properties of Moringa (Moringa oleifera) leaf. Food Sci. Nutr. 2018, 6, 2123–2133. [Google Scholar] [CrossRef] [Green Version]
- Johnson, M.H.; Lucius, A.; Meyer, T.; de Mejia, E.G. Cultivar evaluation and effect of fermentation on antioxidant capacity and in vitro inhibition of α-amylase and α-glucosidase by highbush blueberry (Vaccinium corombosum). J. Agric. Food Chem. 2016, 59, 8923–8930. [Google Scholar] [CrossRef]
- Rasouli, H.; Hosseini-Ghazvini, S.M.; Adibi, H.; Khodarahmi, R. Differential α-amylase/α-glucosidase inhibitory activities of plant-derived phenolic compounds: A virtual screening perspective for the treatment of obesity and diabetes. Food Funct. 2017, 8, 1942–1954. [Google Scholar] [CrossRef]
- Pei, K.; Ou, J.; Huang, J.; Ou, S. p-Coumaric acid and its conjugates: Dietary sources, pharmacokinetic properties and biological activities. J. Sci. Food Agric. 2016, 96, 2952–2962. [Google Scholar] [CrossRef]
- Grussu, D.; Stewart, D.; McDougall, G.J. Berry polyphenols inhibit α-amylase in vitro: Identifying active components in rowanberry and raspberry. J. Agric. Food Chem. 2011, 59, 2324–2331. [Google Scholar] [CrossRef] [PubMed]
- Boue, S.M.; Daigle, K.W.; Chen, M.H.; Cao, H.; Heiman, M. Anti-diabetic Potential of Purple and Red Rice (Oryza sativa L.) Bran Extracts. J. Agric. Food Chem. 2016, 53, 2760–2766. [Google Scholar] [CrossRef]
- Nomura, S.; Monobe, M.; Matsunaga, A.; Maeda-Yamamoto, M.; Horie, H. Effects of flavonol-rich green tea (Camellia sinensis L. cv. Sofu) on blood glucose and insulin levels in diabetic mice. Integr. Obes. Diabetes 2015, 1, 109–111. [Google Scholar] [CrossRef]
- Dhyani, P.; Bhatt, I.D.; Bahukhandi, A.; RAWAL, R.S. Variation in polyphenolics and antioxidant activity of traditional apple cultivars from west Himalaya, Uttarakhand. Hortic. Plant J. 2018, 4, 151–157. [Google Scholar] [CrossRef]
- Aruna, G.; Mamatha, B.S.; Baskaran, V. Lutein content of selected Indian vegetables and vegetable oils determined by HPLC. J. Food Compost. Anal. 2009, 22, 632–636. [Google Scholar] [CrossRef]
- Raju, M.; Varakumar, S.; Lakshminarayana, R.; Krishnakantha, T.P.; Baskaran, V. Carotenoid composition and vitamin A activity of medicinally important green leafy vegetables. Food Chem. 2007, 101, 1598–1605. [Google Scholar] [CrossRef]
- Leong, S.; Oey, Y. Effects of processing on anthocyanins, carotenoids and vitamin C in summer fruits and vegetables. Food Chem. 2012, 133, 1577–1587. [Google Scholar] [CrossRef]
- Mamatha, B.S.; Aarunkumar, R.; Baskaran, V. Effect of processing on major carotenoid levels in corn (Zea mays) and selected vegetables: Bioavailability of lutein and zeaxanthin from processed corn in mice. Food Bioproc. Tech. 2012, 5, 1355–1363. [Google Scholar] [CrossRef]
- Landrum, J.T.; Bone, R.A.; Joa, H.; Kilburn, M.D.; Moore, L.L.; Sprague, K.E. A one year study of the macular pigment: The effect of 140 days of a lutein supplement. Exp. Eye Res. 1997, 65, 57–62. [Google Scholar] [CrossRef]
- Lutein and Zeaxanthin for Vision–WebMD. Available online: https://www.webmd.com/eye-health/lutein-zeaxanthin-vision (accessed on 23 August 2020).
- Ernawita, Z.; Wahyuono, R.A.; Hesse-Macabata, J.; Hipler, U.C.; Elsner, P.; Böhm, W. Carotenoids of indigenous citrus species from Aceh and its in vitro antioxidant, anti-diabetic and antibacterial activities. Eur. Food Res. Technol. 2016, 242, 1869–1881. [Google Scholar] [CrossRef]
- Bohn, T.; Desmarchelier, C.; El, S.N.; Keijer, J.; van Schothorst, E.; Rühl, R.; Borel, P. β-Carotene in the human body: Metabolic bioactivation pathways—From digestion to tissue distribution and excretion. Proc. Nutr. Soc. 2019, 78, 68–87. [Google Scholar] [CrossRef] [PubMed] [Green Version]
- Levin, G.; Mokady, S. Antioxidant activity of 9-cis compared to all-trans beta-carotene in vitro. Free Radic. Biol. Med. 1994, 17, 77–82. [Google Scholar] [CrossRef]
- Fukuji, A.Y.S.; Constantino, L.V.; Zeffa, M.D.; de Andrade, F.A.; da Silva, M.B.; Gonçalves, L.S.A. Amino acid concentration, total phenolic compound content and antioxidant activity of snap bean genotypes. Braz. J. Food Technol. 2019, 22, 1–6. [Google Scholar] [CrossRef] [Green Version]

| Peak | Retention Time | M-H | M-H Formula | ppm Error | MSE Fragments | UV | Identification |
|---|---|---|---|---|---|---|---|
| 1 | 3.29 | 315.0697 | C13H15O9 | −5.1 | 152,108 | 152,108 | Gentisic acid 5-O-glucoside |
| 2 | 4.51 | 325.0889 | C15H17O8 | −1.2 | 163,145,119 | 289 | Coumaric acid O-glucoside |
| 3 | 4.84 | 355.1024 | C16H19O9 | −1.4 | 261,243,193,175,160,134 | 321 | Ferulic acid O-glucoside |
| 4 | 5.33 | 757.1812 | C57H25O3 | 1.1 | 301,271,197 | 255,351 | Quercetin 3-sambubioside-3′-glucoside |
| 5 | 5.60 | 625.1356 | C34H25O12 | 1.6 | 301,284,271,255,178,155 | 255 | Quercetin 3-glucosyl-(1->2)-galactoside |
| 6 | 5.70 | 741.1879 | C32H37O20 | 0.1 | 625,443,355,285 | 265,335 | Quercetin 3-(2G-xylosylrutinoside) |
| 7 | 5.95 | 609.1493 | C27H29O16 | 3.8 | 595,361,301,271,255 | 257,333 | Quercetin 3-O-rhamnoside 7-O-glucoside |
| Cowpea Cultivars | Violaxanthin | Lutein | Zeaxanthin | All-Trans-Beta-Carotene | 9-Cis-Beta-Carotene | Total Carotenoids |
|---|---|---|---|---|---|---|
| mg/100 g DW | ||||||
| VPO1 | 17.8 ± 1.5 *,c | 109.1 ± 8.6d | 0.04 ± 0.01d | 92.6 ± 1.7a | 3.2 ± 0.2b | 222.7 ± 1.0b |
| VPO2 | 20.4 ± 0.7b | 124.6 ± 1.8a | 0.06 ± 0.02c | 71.1 ± 1.7d | 3.0 ± 2.6c | 220.7 ± 1.6c |
| VPO3 | 24.9 ± 6.0a | 111.2 ± 1.7c | 0.04 ± 0.01d | 84.7 ± 5.9c | 3.6 ± 0.3a | 224.5 ± 1.0a |
| VPO4 | 16.9 ± 0.7d | 99.9 ± 9.5e | 0.06 ± 0.01c | 59.3 ± 8.7e | 3.3 ± 0.2b | 179.6 ± 1.5e |
| VPO5 | 8.4 ± 1.3f | 74.5 ± 1.0g | 0.10 ± 0.03a | 43.0 ± 4.9f | 2.4 ± 0.1e | 129.7 ± 1.5f |
| VPO7 | 15.2 ± 1.9e | 94.3 ± 1.0f | 0.04 ± 0.04d | 70.3 ± 1.3d | 2.7 ± 0.1d | 181.8 ± 1.0d |
| VPO8 | 15.5 ± 1.1e | 116.5 ± 1.2b | 0.09 ± 0.01b | 87.2 ± 5.2b | 2.9 ± 0.1d | 222.2 ± 1.5b |
| Cowpea Cultivars | Total Protein (g/100 g DW) | % Non-Essential Amino Acids | % Essential Amino Acids | % Branched-Chain Amino Acids |
|---|---|---|---|---|
| VOP1 | 28.4 ± 0.1 *,d | 63.61 ± 0.2a | 36.7 ± 0.2c | 17.0 ± 0.2d |
| VOP2 | 25.1 ± 0.1f | 59.20 ± 0.1d | 40.8 ± 0.1a | 19.8 ± 0.0a |
| VOP3 | 30.2 ± 0.2b | 59.40 ± 0.1d | 40.6 ± 0.1a | 18.4 ± 0.3bc |
| VOP4 | 31.3 ± 0.3a | 61.30 ± 0.7c | 38.7 ± 0.7b | 18.1 ± 0.6c |
| VOP5 | 29.3 ± 0.2c | 62.50 ± 0.3b | 37.5 ± 0.3c | 18.6 ± 0.3bc |
| VOP7 | 28.3 ± 0.2d | 59.50 ± 0.2d | 40.5 ± 0.2a | 19.2 ± 0.1ab |
| VOP8 | 27.2 ± 0.3e | 61.50 ± 0.3bc | 38.5 ± 0.3b | 17.9 ± 0.2b |
| Non-Essential Amino Acids (g/100 g DW) | ||||||||
| Cowpea cultivars | Ser | Arg | Gly | Asp | Glu | Ala | Pro | Try |
| VOP1 | 1.38 ± 0.41b | 1.92 ± 0.20c | 1.33 ± 0.26c | 5.96 ± 0.31a | 3.28 ± 0.12bc | 1.44 ± 0.34c | 1.32 ± 0.25b | 1.30 ± 0.14b |
| VOP2 | 1.29 ± 0.23b | 1.96 ± 0.12c | 1.28 ± 0.17c | 3.46 ± 0.10c | 3.07 ± 0.38c | 1.42 ± 0.21c | 1.13 ± 0.34c | 1.20 ± 0.21b |
| VOP3 | 1.60 ± 0.30a | 2.42 ± 0.25a | 1.71 ± 0.11a | 3.49 ± 0.26c | 3.67 ± 0.40a | 1.56 ± 0.16b | 1.43 ± 0.31a | 1.91 ± 0.30a |
| VOP4 | 1.70 ± 0.34a | 2.52 ± 0.20a | 1.62 ± 0.20a | 4.80 ± 0.21b | 3.47 ± 0.51b | 1.58 ± 0.24b | 1.45 ± 0.11a | 2.01 ± 0.42a |
| VOP5 | 1.42 ± 0.20b | 2.20 ± 0.31b | 1.53 ± 0.15b | 4.96 ± 0.18b | 3.88 ± 0.12a | 1.64 ± 0.10ab | 1.46 ± 0.20a | 1.24 ± 0.20b |
| VOP7 | 1.40 ± 0.42b | 1.82 ± 0.40c | 1.50 ± 0.31b | 3.92 ± 0.11c | 3.73 ± 0.11a | 1.74 ± 0.50a | 1.44 ± 0.23a | 1.27 ± 0.10b |
| VOP8 | 1.37 ± 0.21b | 1.80 ± 0.30c | 1.36 ± 0.20bc | 4.63 ± 0.09b | 3.42 ± 0.27b | 1.53 ± 0.34bc | 1.25 ± 0.12b | 1.36 ± 0.20b |
| Essential amino acids (g/100 g DW) | ||||||||
| His | Thr | Lys | Met | Val | lle | Leu | phe | |
| VOP1 | 0.50 ± 0.16b | 1.41 ± 0.27bc | 1.75 ± 0.20c | 0.31 ± 0.70 ** | 1.26 ± 0.51c | 1.41 ± 0.32c | 2.13 ± 0.32cd | 1.60 ± 0.10b |
| VOP2 | 0.51 ± 0.29b | 1.31 ± 0.10c | 1.71 ± 0.17c | 0.30 ± 0.50 | 1.28 ± 0.41c | 1.22 ± 0.17d | 2.05 ± 0.17d | 1.41 ± 0.20c |
| VOP3 | 0.72 ± 0.20a | 1.67 ± 0.30a | 1.51 ± 0.41d | 0.32 ± 0.14 | 1.56 ± 0.12a | 1.54 ± 0.12b | 2.46 ± 0.15a | 2.45 ± 0.23a |
| VOP4 | 0.66 ± 0.18a | 1.65 ± 0.25a | 1.39 ± 0.32e | 0.25 ± 0.28 | 1.55 ± 0.30a | 1.66 ± 0.25a | 2.44 ± 0.31ab | 2.46 ± 0.16a |
| VOP5 | 0.45 ± 0.10b | 1.39 ± 0.60bc | 1.91 ± 0.50b | 0.29 ± 0.12 | 1.54 ± 0.18a | 1.58 ± 0.50ab | 2.35 ± 0.40b | 1.48 ± 0.17c |
| VOP7 | 0.46 ± 0.38b | 1.49 ± 0.10b | 2.04 ± 0.27a | 0.38 ± 0.32 | 1.53 ± 0.10a | 1.41 ± 0.12c | 2.47 ± 0.51a | 1.65 ± 0.32b |
| VOP8 | 0.51 ± 0.41b | 1.40 ± 0.31bc | 1.92 ± 0.15b | 0.27 ± 0.41 | 1.39 ± 0.21b | 1.30 ± 0.10d | 2.19 ± 0.30c | 1.49 ± 0.12b |
© 2020 by the authors. Licensee MDPI, Basel, Switzerland. This article is an open access article distributed under the terms and conditions of the Creative Commons Attribution (CC BY) license (http://creativecommons.org/licenses/by/4.0/).
Share and Cite
Moloto, M.R.; Phan, A.D.T.; Shai, J.L.; Sultanbawa, Y.; Sivakumar, D. Comparison of Phenolic Compounds, Carotenoids, Amino Acid Composition, In Vitro Antioxidant and Anti-Diabetic Activities in the Leaves of Seven Cowpea (Vigna unguiculata) Cultivars. Foods 2020, 9, 1285. https://doi.org/10.3390/foods9091285
Moloto MR, Phan ADT, Shai JL, Sultanbawa Y, Sivakumar D. Comparison of Phenolic Compounds, Carotenoids, Amino Acid Composition, In Vitro Antioxidant and Anti-Diabetic Activities in the Leaves of Seven Cowpea (Vigna unguiculata) Cultivars. Foods. 2020; 9(9):1285. https://doi.org/10.3390/foods9091285
Chicago/Turabian StyleMoloto, Mapula R., Anh Dao T. Phan, Jerry L. Shai, Yasmina Sultanbawa, and Dharini Sivakumar. 2020. "Comparison of Phenolic Compounds, Carotenoids, Amino Acid Composition, In Vitro Antioxidant and Anti-Diabetic Activities in the Leaves of Seven Cowpea (Vigna unguiculata) Cultivars" Foods 9, no. 9: 1285. https://doi.org/10.3390/foods9091285
APA StyleMoloto, M. R., Phan, A. D. T., Shai, J. L., Sultanbawa, Y., & Sivakumar, D. (2020). Comparison of Phenolic Compounds, Carotenoids, Amino Acid Composition, In Vitro Antioxidant and Anti-Diabetic Activities in the Leaves of Seven Cowpea (Vigna unguiculata) Cultivars. Foods, 9(9), 1285. https://doi.org/10.3390/foods9091285