Chemical Characterization and Bioaccessibility of Bioactive Compounds from Saponin-Rich Extracts and Their Acid-Hydrolysates Obtained from Fenugreek and Quinoa


Abstract
:
1. Introduction
2. Materials and Methods
2.1. Reagents and Materials
2.2. Obtention of the Saponin-Rich Extracts by Ultrasound-Assisted Extraction (UAE)
2.3. Preparation of the Sapogenin-Rich Extracts
2.4. Characterization of the Extracts by High Performance Liquid Chromatography-Diode Array Detection
2.5. Characterization of the Extracts by Gas Chromatography-Mass Spectrometry
2.6. In Vitro Gastrointestinal Digestion
2.7. Determination of the Bioaccessibility of Bioactive Compounds
2.8. Statistical Analysis
3. Results & Discussion
3.1. Extraction Yield
3.2. Saponin and Sapogenin Content on the Extracts
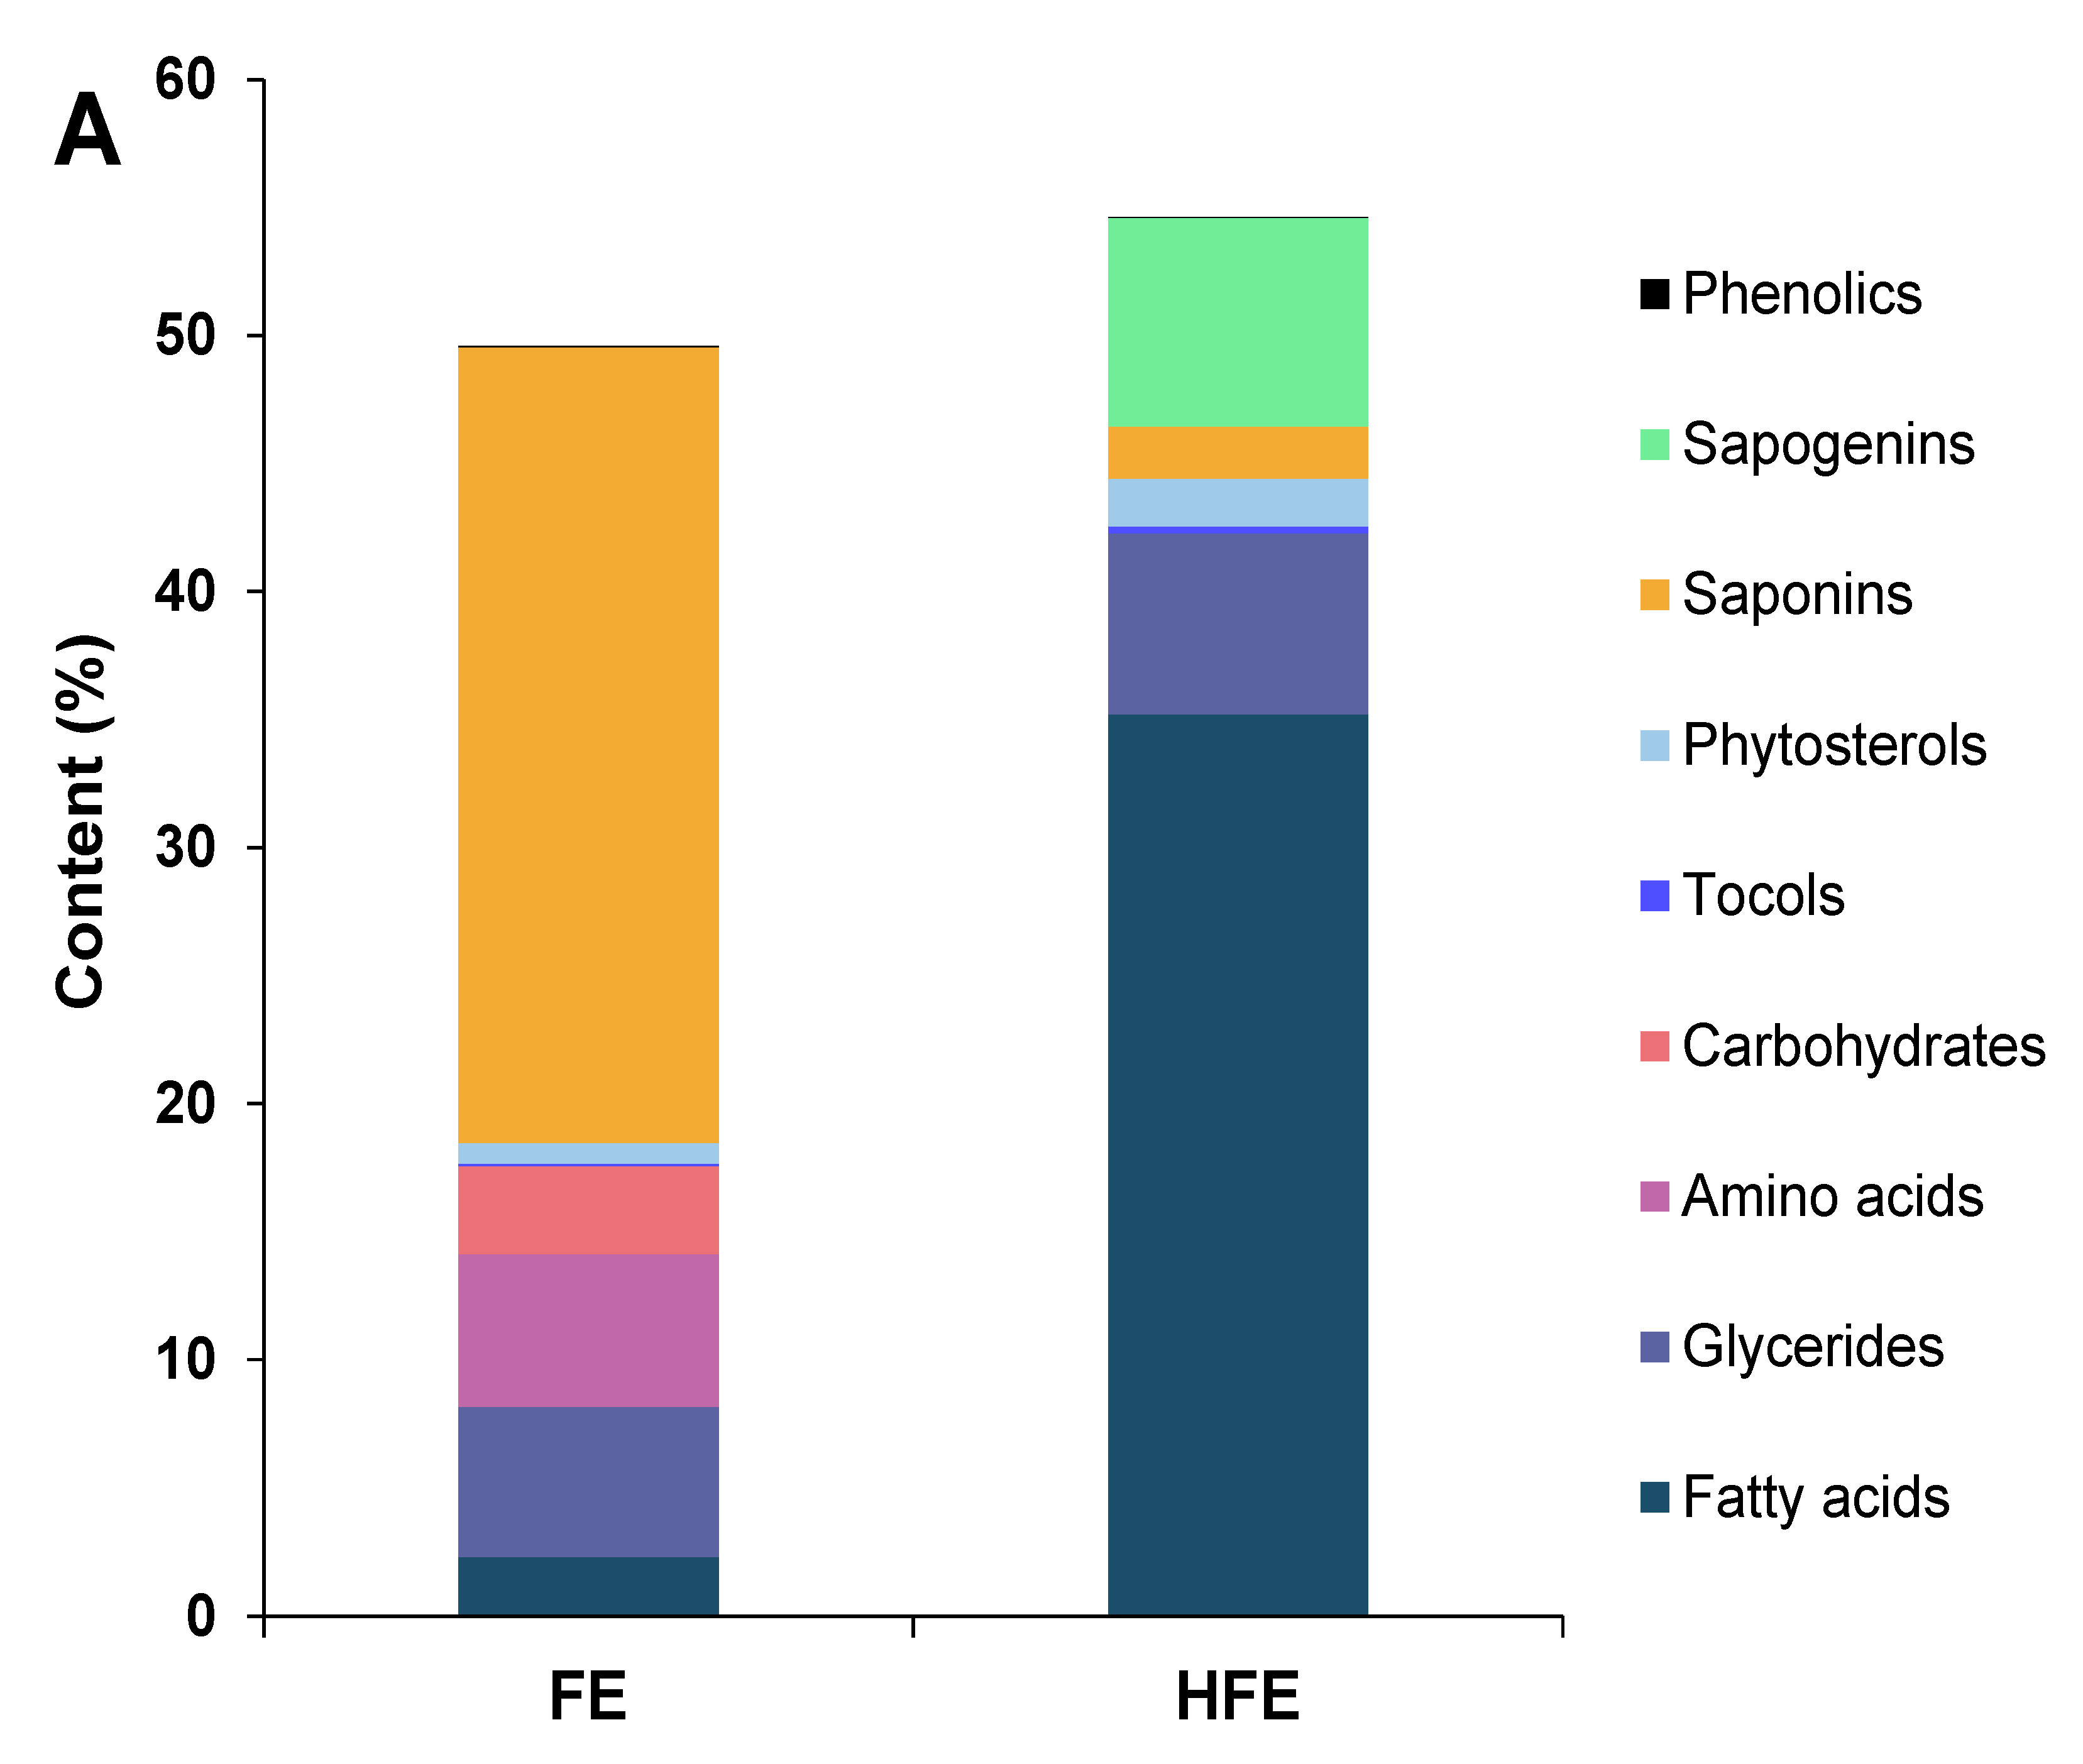
3.3. Characterization of Other Compounds in the Extracts
3.3.1. Fenugreek Extracts
3.3.2. Quinoa Extracts
3.4. Bioaccessibility of Bioactive Compounds
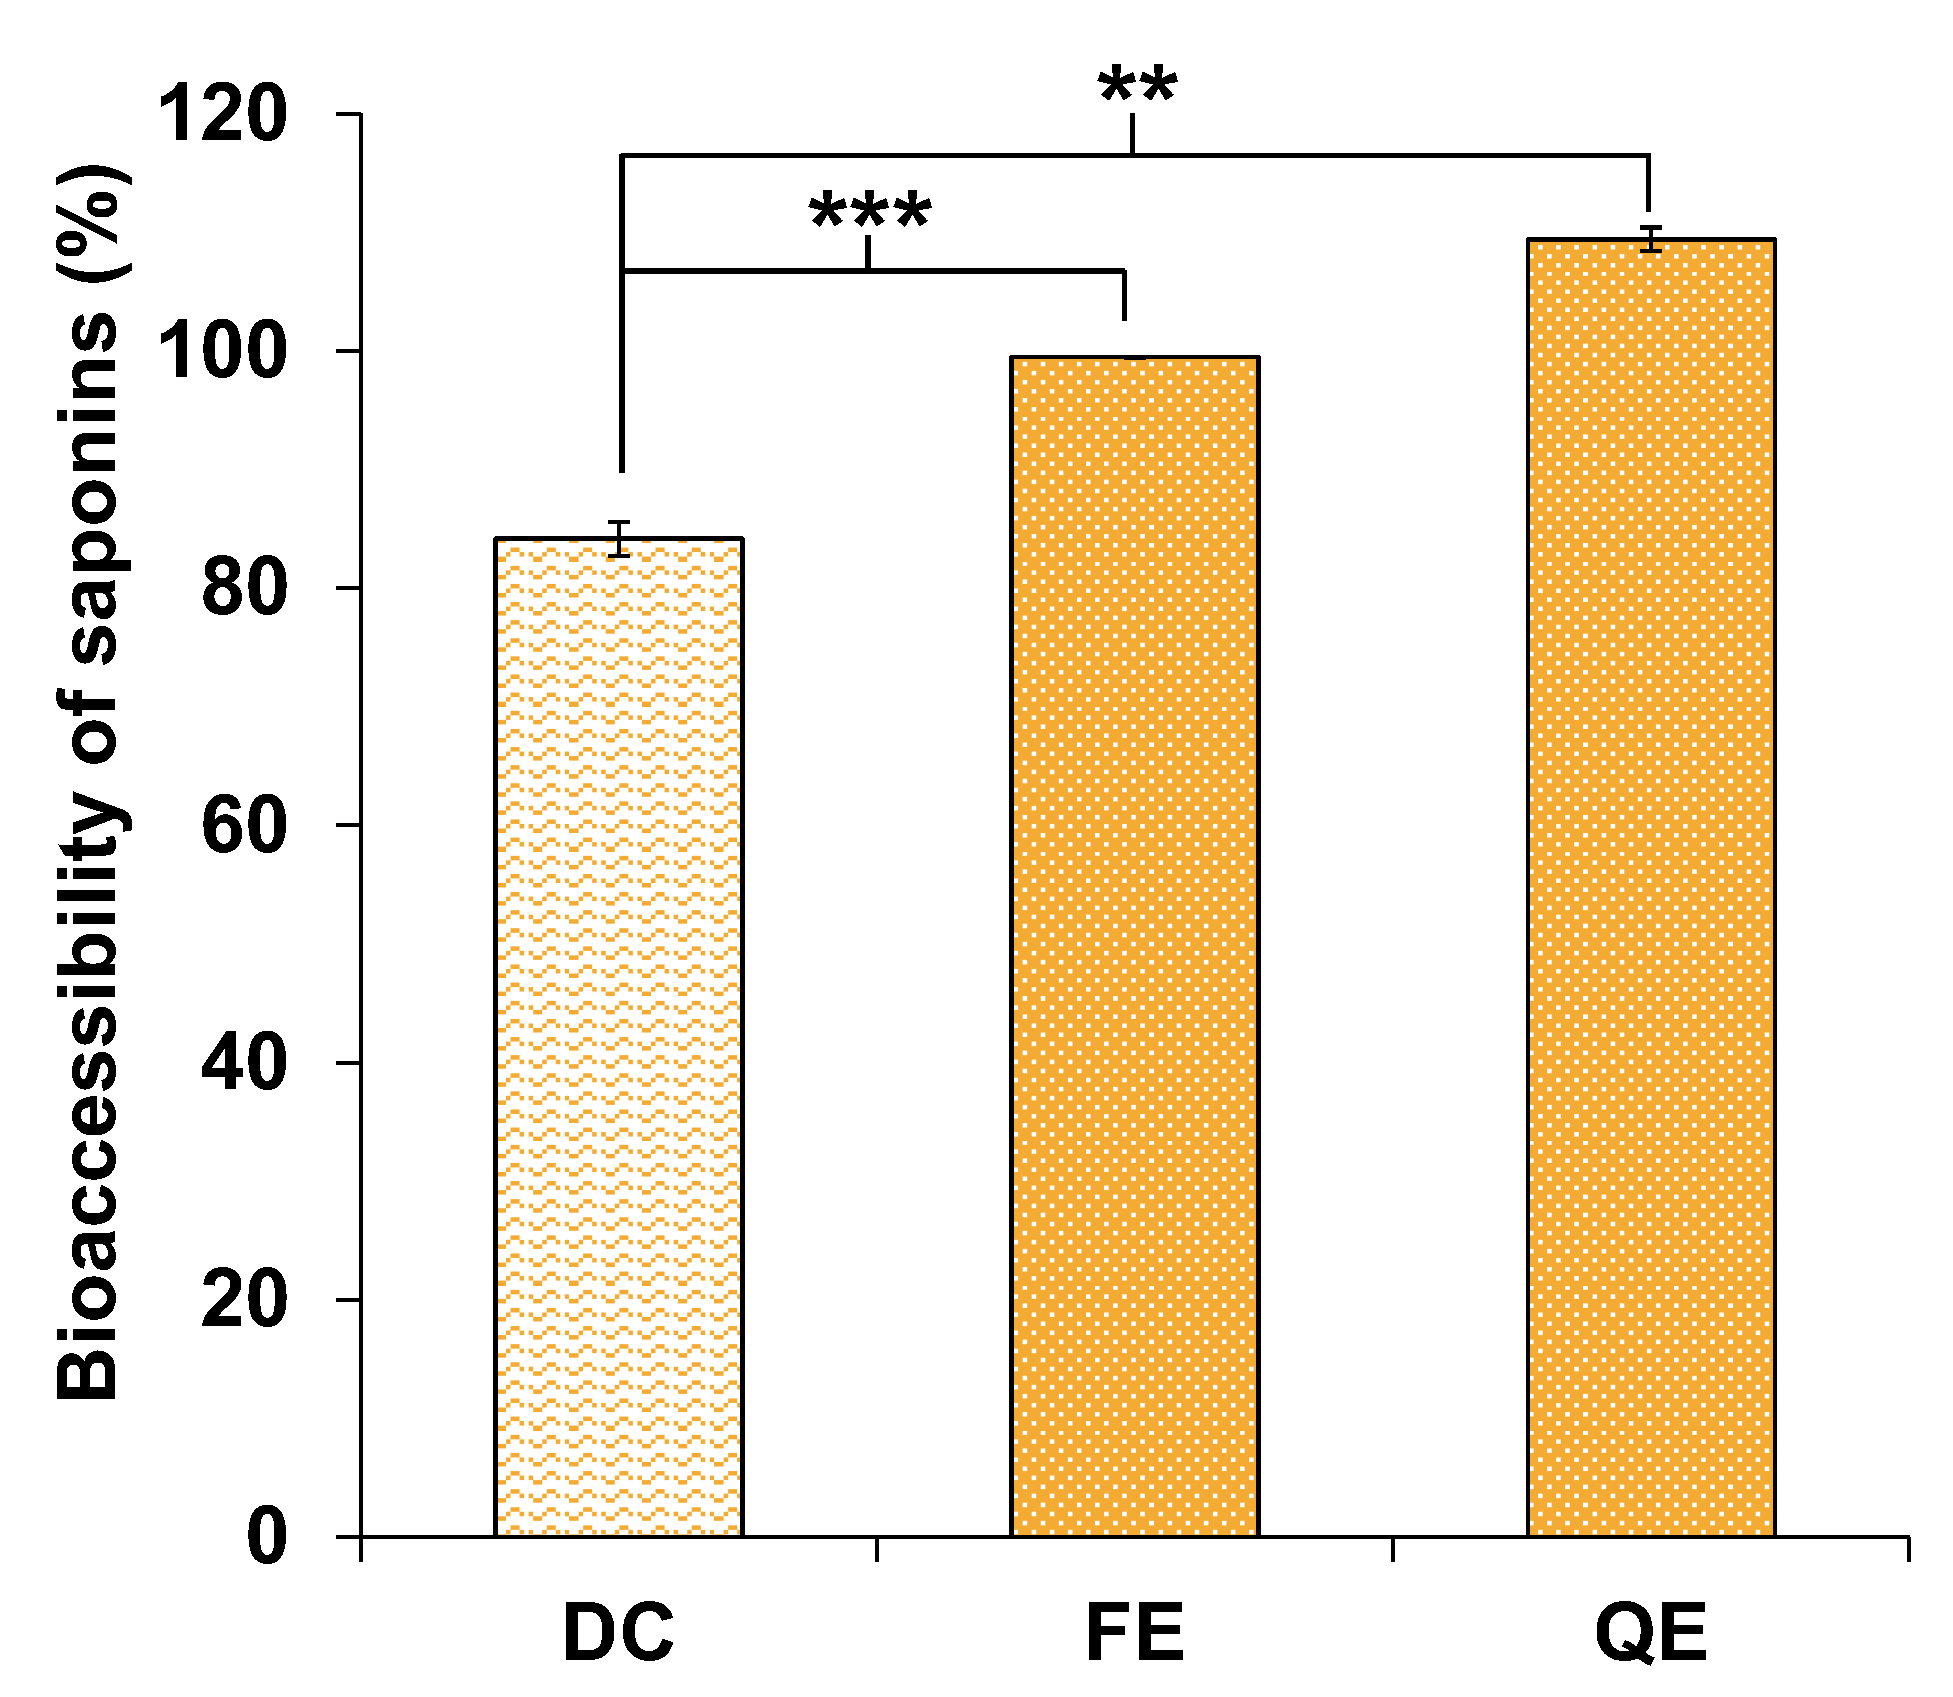
3.4.1. Saponins
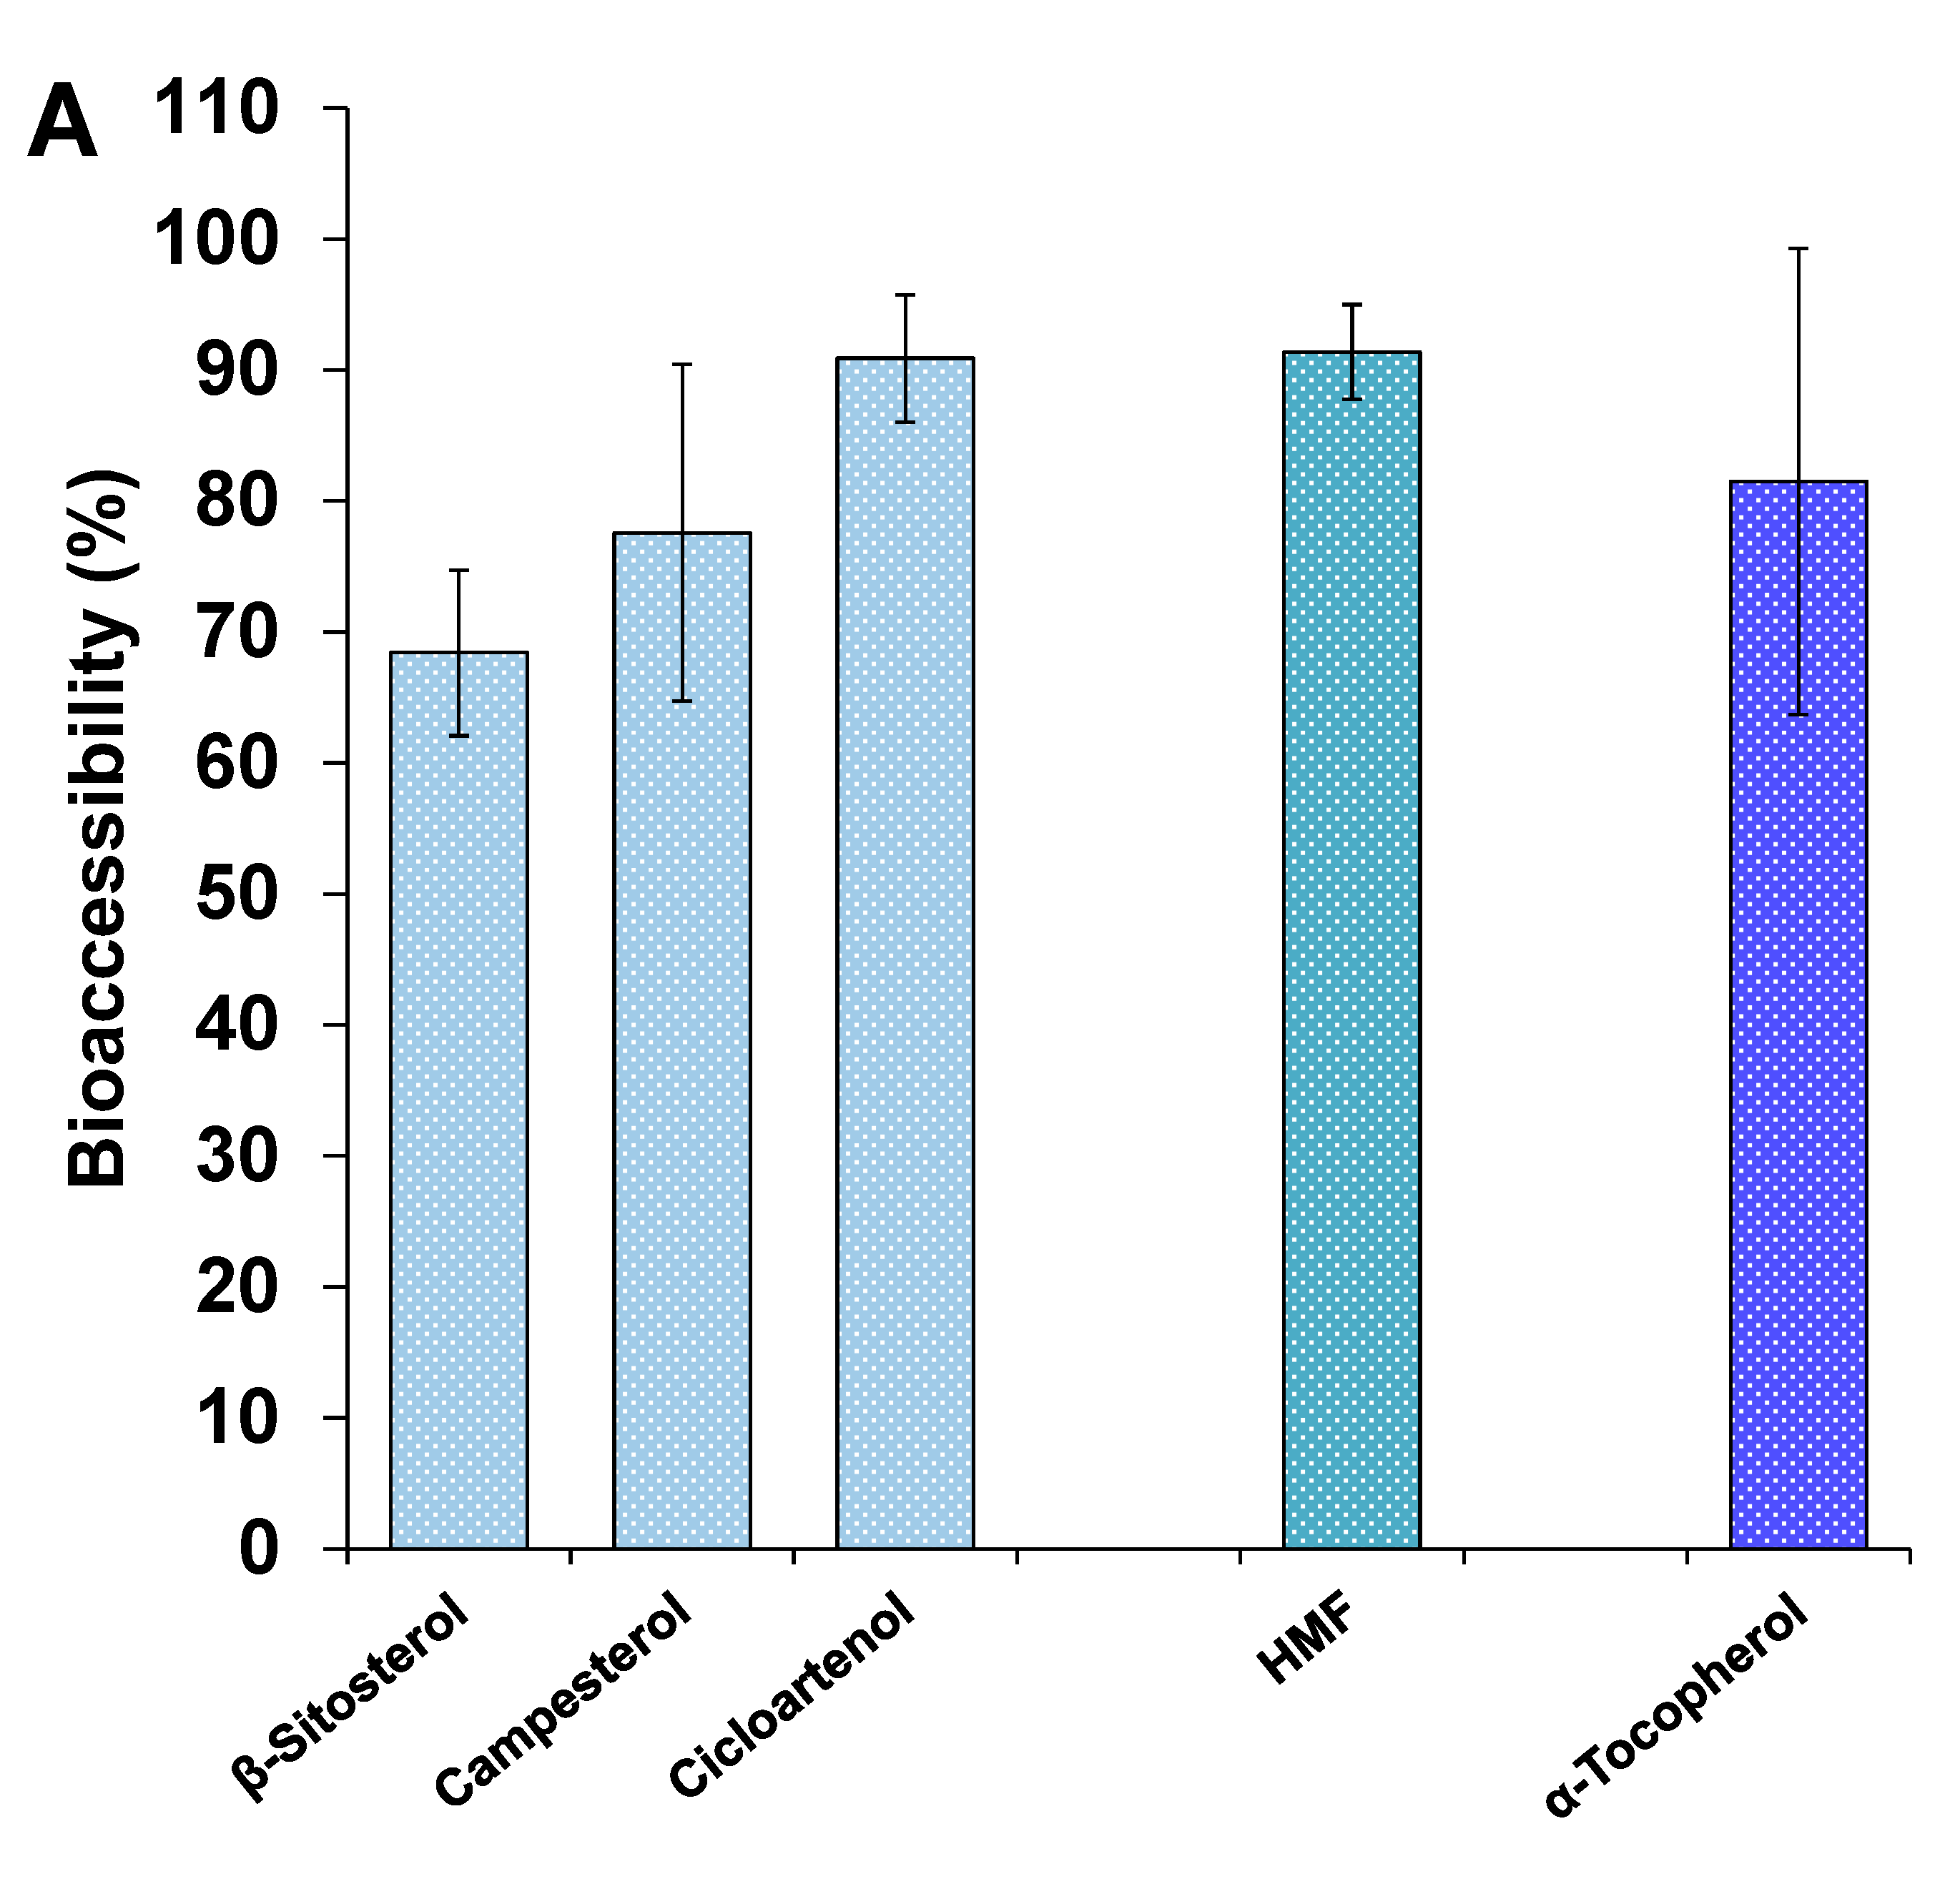
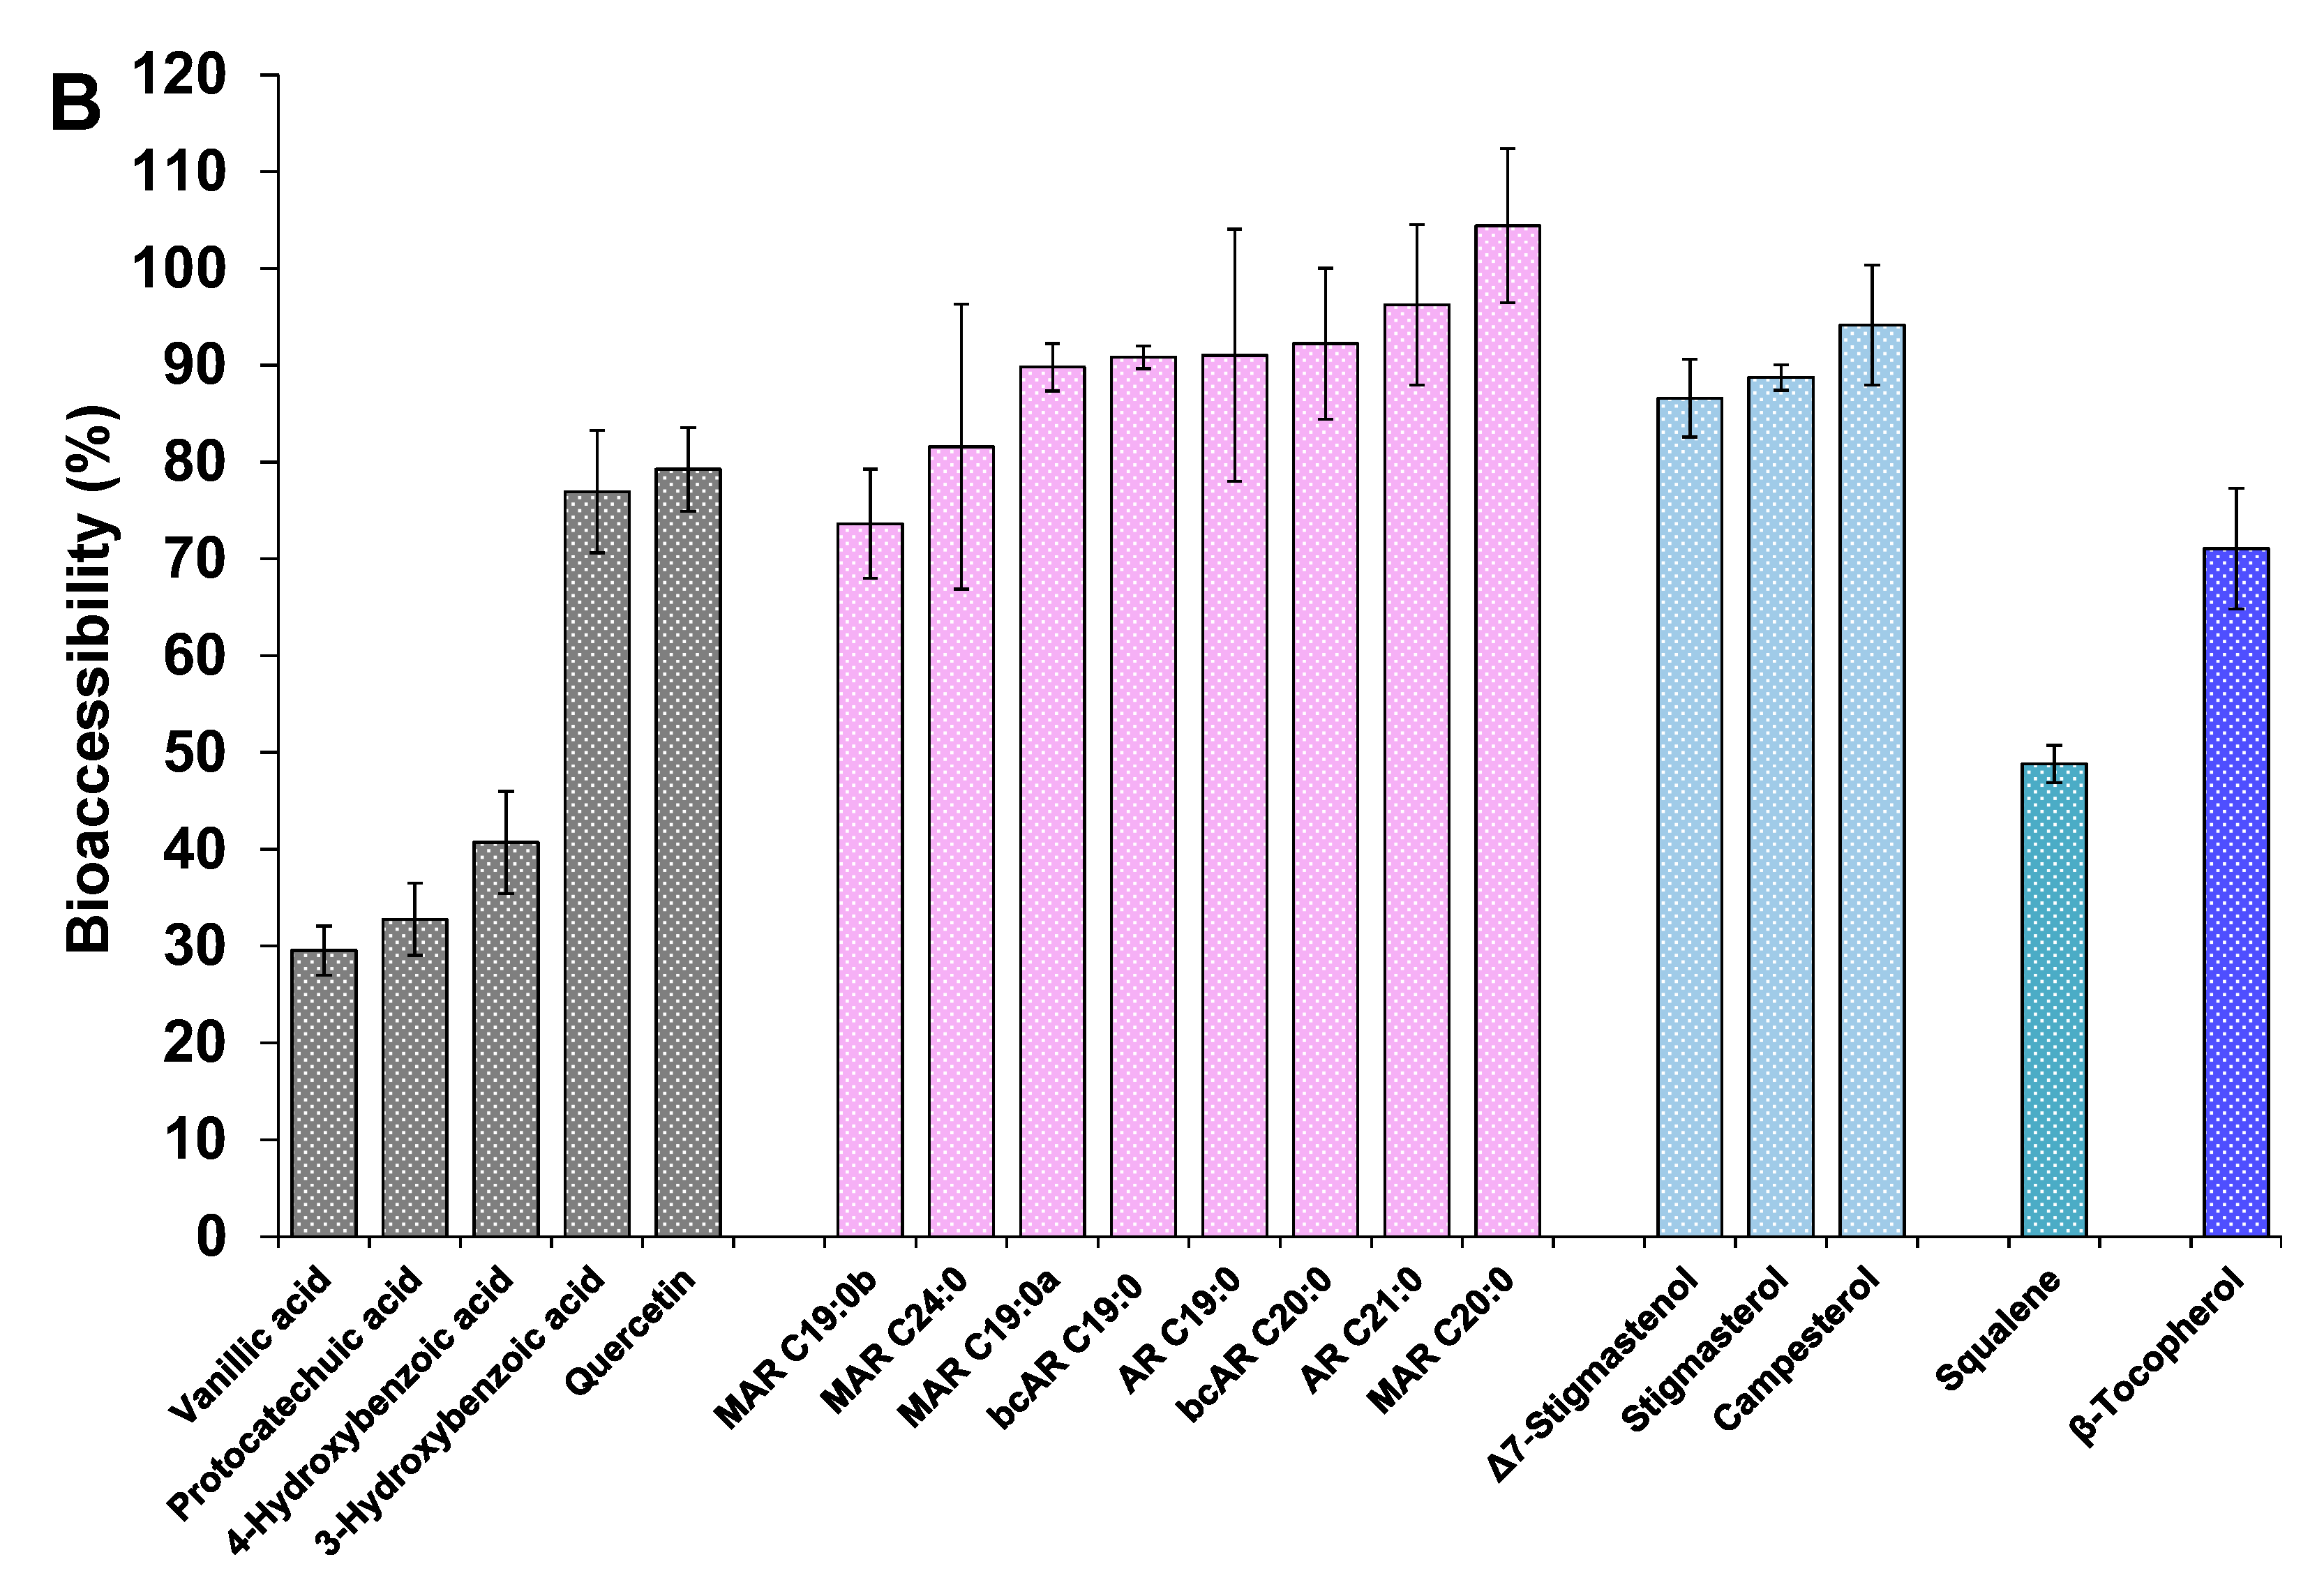
3.4.2. Sapogenins
3.4.3. Other Minor Bioactive Compounds of the Extracts
Supplementary Materials
Author Contributions
Funding
Acknowledgments
Conflicts of Interest
References
- Faostat-Crops. Available online: http://www.fao.org/faostat/en/#data/QC (accessed on 29 July 2020).
- Indian Production of Fenugreek. Available online: http://agriexchange.apeda.gov.in/indiaproduction/India_Productions.aspx?cat=Spices&hscode=1105 (accessed on 29 July 2020).
- El Hazzam, K.; Hafsa, J.; Sobeh, M.; Mhada, M.; Taourirte, M.; El Kacimi, K.; Yasri, A. An Insight into Saponins from Quinoa (Chenopodium quinoa Willd): A Review. Molecules 2020, 25, 1059. [Google Scholar] [CrossRef] [PubMed] [Green Version]
- Basu, T.K.; Srichamroen, A. Health benefits of fenugreek (Trigonella foenum-graecum leguminosse). In Bioactive Foods in Promoting Health, 1st ed.; Watson, R., Preedy, V., Eds.; Elsevier: Amsterdam, The Netherlands, 2010; pp. 425–435. [Google Scholar] [CrossRef]
- Yao, D.; Zhang, B.; Zhu, J.; Zhang, Q.; Hu, Y.; Wang, S.; Wang, Y.; Cao, H.; Xiao, J. Advances on application of fenugreek seeds as functional foods: Pharmacology, clinical application, products, patents and market. Crit. Rev. Food Sci. Nutr. 2019, 60, 1–11. [Google Scholar] [CrossRef] [PubMed]
- Ballester-Sánchez, J.; Millán-Linares, M.C.; Fernández-Espinar, M.T.; Haros, C.M. Development of Healthy, Nutritious Bakery Products by Incorporation of Quinoa. Foods 2019, 8, 379. [Google Scholar] [CrossRef] [PubMed] [Green Version]
- Valencia-Chamorro, S.A. Quinoa. In Reference Module in Food Science; Elsevier: Amsterdam, The Netherlands, 2016. [Google Scholar]
- Aasim, M.; Baloch, F.S.; Nadeem, M.A.; Bakhsh, A.; Sameeullah, M.; Day, S. Fenugreek (Trigonella foenum-graecum L.): An Underutilized Edible Plant of Modern World. In Global Perspectives on Underutilized Crops; Ozturk, M., Hakeem, K.R., Ashraf, M., Ahmad, M.S.A., Eds.; Springer International Publishing: Cham, Switzerland, 2018; pp. 381–408. [Google Scholar] [CrossRef]
- Hernández-Ledesma, B. Quinoa (Chenopodium quinoa Willd.) as source of bioactive compounds: A review. Bioact. Compd. Health Dis. 2019, 2, 27. [Google Scholar] [CrossRef]
- Güçlü-Üstündağ, Ö.; Mazza, G. Saponins: Properties, applications and processing. Crit. Rev. Food Sci. Nutr. 2007, 47, 231–258. [Google Scholar] [CrossRef] [PubMed]
- Rao, V.; Gurfinkel, D.M. The bioactivity of saponins: Triterpenoid and steroidal glycosides. Drug Metabol. Drug Interact. 2000, 17, 211–235. [Google Scholar] [CrossRef]
- Francis, G.; Kerem, Z.; Makkar, H.P.S.; Becker, K. The biological action of saponins in animal systems: A review. Br. J. Nutr. 2002, 88, 587–605. [Google Scholar] [CrossRef]
- Sparg, S.G.; Light, M.E.; van Staden, J. Biological activities and distribution of plant saponins. J. Ethnopharmacol. 2004, 94, 219–243. [Google Scholar] [CrossRef]
- Wen, C.; Zhang, J.; Zhang, H.; Dzah, C.S.; Zandile, M.; Duan, Y.; Ma, H.; Luo, X. Advances in ultrasound assisted extraction of bioactive compounds from cash crops–A review. Ultrason. Sonochem. 2018, 48, 538–549. [Google Scholar] [CrossRef]
- Navarro del Hierro, J.; Herrera, T.; García-Risco, M.R.; Fornari, T.; Reglero, G.; Martin, D. Ultrasound-assisted extraction and bioaccessibility of saponins from edible seeds: Quinoa, lentil, fenugreek, soybean and lupin. Food Res. Int. 2018, 109, 440–447. [Google Scholar] [CrossRef] [Green Version]
- Hadidi, M.; Ibarz, A.; Pagan, J. Optimisation and kinetic study of the ultrasonic-assisted extraction of total saponins from alfalfa (Medicago sativa) and its bioaccessibility using the response surface methodology. Food Chem. 2020, 309, 125786. [Google Scholar] [CrossRef] [PubMed]
- Pham, H.N.T.; Van Vuong, Q.; Bowyer, M.C.; Scarlett, C.J. Ultrasound-assisted extraction of Catharanthus roseus (L.) G. Don (Patricia White cultivar) stem for maximizing saponin yield and antioxidant capacity. J. Food Process. Preserv. 2018, 42, e13597. [Google Scholar] [CrossRef]
- Navarro del Hierro, J.; Herrera, T.; Fornari, T.; Reglero, G.; Martin, D. The gastrointestinal behavior of saponins and its significance for their bioavailability and bioactivities. J. Funct. Foods 2018, 40, 484–497. [Google Scholar] [CrossRef]
- Zhang, X.; Jin, M.; Tadesse, N.; Zhan, G.; Zhang, H.; Dang, J.; Wang, S.; Guo, Z.; Ito, Y. Methods to treat the industrial wastewater in diosgenin enterprises produced from Diosorea zingiberensis CH Wright. J. Clean. Prod. 2018, 186, 34–44. [Google Scholar] [CrossRef]
- Zhang, H.; Xu, J.; Wang, M.; Xia, X.; Dai, R.; Zhao, Y. Steroidal saponins and sapogenins from fenugreek and their inhibitory activity against α-glucosidase. Steroids 2020, 161, 108690. [Google Scholar] [CrossRef]
- Di Liberto, M.; Svetaz, L.; Furlán, R.L.E.; Zacchino, S.A.; Delporte, C.; Novoa, M.A.; Asencio, M.; Cassels, B.K. Antifungal activity of saponin-rich extracts of Phytolacca dioica and of the sapogenins obtained through hydrolysis. Nat. Prod. Commun. 2010, 5, 1013–1018. [Google Scholar] [CrossRef] [Green Version]
- Herrera, T.; Navarro del Hierro, J.; Fornari, T.; Reglero, G.; Martin, D. Acid hydrolysis of saponin-rich extracts of quinoa, lentil, fenugreek and soybean to yield sapogenin-rich extracts and other bioactive compounds. J. Sci. Food Agric. 2019, 99, 3157–3167. [Google Scholar] [CrossRef] [Green Version]
- Fernández-García, E.; Carvajal-Lérida, I.; Pérez-Gálvez, A. In vitro bioaccessibility assessment as a prediction tool of nutritional efficiency. Nutr. Res. 2009, 29, 751–760. [Google Scholar] [CrossRef]
- Zhao, C.; Miao, J.; Li, X.; Chen, X.; Mao, X.; Wang, Y.; Hua, X.; Gao, W. Impact of in vitro simulated digestion on the chemical composition and potential health benefits of Chaenomeles speciosa and Crataegus pinnatifida. Food Biosci. 2020, 35, 100511. [Google Scholar] [CrossRef]
- Martin, D.; Navarro del Hierro, J.; Villanueva Bermejo, D.; Fernández-Ruiz, R.; Fornari, T.; Reglero, G. Bioaccessibility and antioxidant activity of Calendula officinalis supercritical extract as affected by in vitro codigestion with olive oil. J. Agric. Food Chem. 2016, 64, 8828–8837. [Google Scholar] [CrossRef] [Green Version]
- Furtado, N.; Pirson, L.; Edelberg, H.M.; Miranda, L.; Loira-Pastoriza, C.; Preat, V.; Larondelle, Y.; André, C. Pentacyclic triterpene bioavailability: An overview of in vitro and in vivo studies. Molecules 2017, 22, 400. [Google Scholar] [CrossRef] [Green Version]
- Navarro del Hierro, J.; Piazzini, V.; Reglero, G.; Martin, D.; Bergonzi, M.C. In Vitro Permeability of Saponins and Sapogenins from Seed Extracts by the Parallel Artificial Membrane Permeability Assay: Effect of in Vitro Gastrointestinal Digestion. J. Agric. Food Chem. 2020, 68, 1297–1305. [Google Scholar] [CrossRef] [PubMed]
- Tatia, R.; Zalaru, C.; Tarcomnicu, I.; Moldovan, L.; Craciunescu, O.; Calinescu, I. Isolation and characterization of hederagenin from Hedera helix L. Extract with antitumor activity. Rev. Chim. 2019, 70, 1157–1161. [Google Scholar] [CrossRef]
- Bedour, M.S.; El-Munajjed, D.; Fayez, M.B.E.; Girgis, A.N. Steroid sapogenins VII. Identification and origin of 25d-spirosta-3, 5-diene among the fenugreek sapogenins. J. Pharm. Sci. 1964, 53, 1276–1278. [Google Scholar] [CrossRef] [PubMed]
- Medina-Meza, I.G.; Aluwi, N.A.; Saunders, S.R.; Ganjyal, G.M. GC–MS Profiling of Triterpenoid Saponins from 28 Quinoa Varieties (Chenopodium quinoa Willd.) Grown in Washington State. J. Agric. Food Chem. 2016, 64, 8583–8591. [Google Scholar] [CrossRef] [PubMed]
- Ng, K.G.; Price, K.R.; Fenwick, G.R. A TLC method for the analysis of quinoa (Chenopodium quinoa) saponins. Food Chem. 1994, 49, 311–315. [Google Scholar] [CrossRef]
- Ganem-Quintanar, A.; Quintanar-Guerrero, D.; Buri, P. Monoolein: A review of the pharmaceutical applications. Drug Dev. Ind. Pharm. 2000, 26, 809–820. [Google Scholar] [CrossRef]
- Nour, A.A.M.; Magboul, B.I. Chemical and amino acid composition of fenugreek seeds grown in Sudan. Food Chem. 1986, 22, 1–5. [Google Scholar] [CrossRef]
- Lahuta, L.B.; Szablińska, J.; Ciak, M.; Górecki, R.J. The occurrence and accumulation of d-pinitol in fenugreek (Trigonella foenum graecum L.). Acta Physiol. Plant. 2018, 40, 1–11. [Google Scholar] [CrossRef] [Green Version]
- Lupien, P.; Moorjani, S.; Brun, D.; Bielmann, P. Effects of 3-Hydroxy-3-methylglutaric Acid on Plasma and Low-Density Lipoprotein Cholesterol Levels in Familial Hypercholesterolemia. J. Clin. Pharmacol. 1979, 19, 120–126. [Google Scholar] [CrossRef]
- Mukker, J.K.; Singh, R.S.P.; Muir, A.D.; Krol, E.S.; Alcorn, J. Comparative pharmacokinetics of purified flaxseed and associated mammalian lignans in male Wistar rats. Br. J. Nutr. 2015, 113, 749–757. [Google Scholar] [CrossRef] [PubMed]
- Tahir, N.I.; Shaari, K.; Abas, F.; Parveez, G.K.A.; Ishak, Z.; Ramli, U.S. Characterization of apigenin and luteolin derivatives from oil palm (Elaeis guineensis Jacq.) Leaf using LC-ESI-MS/MS. J. Agric. Food Chem. 2012, 60, 11201–11210. [Google Scholar] [CrossRef] [PubMed]
- Benayad, Z.; Gómez-Cordovés, C.; Es-Safi, N. Characterization of Flavonoid Glycosides from Fenugreek (Trigonella foenum-graecum) Crude Seeds by HPLC–DAD–ESI/MS Analysis. Int. J. Mol. Sci. 2014, 15, 20668–20685. [Google Scholar] [CrossRef] [PubMed] [Green Version]
- Zhao, L.; Chen, J.; Su, J.; Li, L.; Hu, S.; Li, B.; Zhang, X.; Xu, Z.; Chen, T. In vitro antioxidant and antiproliferative activities of 5-hydroxymethylfurfural. J. Agric. Food Chem. 2013, 61, 10604–10611. [Google Scholar] [CrossRef] [PubMed]
- Hernandez, E.M. Specialty Oils: Functional and Nutraceutical Properties. In Functional Dietary Lipids: Food Formulation, Consumer Issues and Innovation for Health, 1st ed.; Sanders, T.A.B., Ed.; Elsevier: Amsterdam, The Netherlands, 2015; pp. 69–101. [Google Scholar]
- Pellegrini, M.; Lucas-Gonzales, R.; Ricci, A.; Fontecha, J.; Fernández-López, J.; Pérez-Álvarez, J.A.; Viuda-Martos, M. Chemical, fatty acid, polyphenolic profile, techno-functional and antioxidant properties of flours obtained from quinoa (Chenopodium quinoa Willd) seeds. Ind. Crops Prod. 2018, 111, 38–46. [Google Scholar] [CrossRef]
- Duliński, R.; Starzyńska-Janiszewska, A.; Byczyński, Ł.; Błaszczyk, U. Myo-inositol phosphates profile of buckwheat and quinoa seeds: Effects of hydrothermal processing and solid-state fermentation with Rhizopus oligosporus. Int. J. Food Prop. 2017, 20, 2088–2095. [Google Scholar] [CrossRef] [Green Version]
- Ahamed, N.T.; Singhal, R.S.; Kulkarni, P.R.; Pal, M. A Lesser-Known Grain, Chenopodium Quinoa: Review of the Chemical Composition of its Edible Parts. Food Nutr. Bull. 1998, 19, 61–70. [Google Scholar] [CrossRef]
- Lin, M.; Han, P.; Li, Y.; Wang, W.; Lai, D.; Zhou, L. Quinoa Secondary Metabolites and Their Biological Activities or Functions. Molecules 2019, 24, 2512. [Google Scholar] [CrossRef] [Green Version]
- Ross, A.B.; Svelander, C.; Karlsson, G.; Savolainen, O.I. Identification and quantification of even and odd chained 5-n alkylresorcinols, branched chain-alkylresorcinols and methylalkylresorcinols in Quinoa (Chenopodium quinoa). Food Chem. 2017, 220, 344–351. [Google Scholar] [CrossRef]
- Tang, Y.; Li, X.; Zhang, B.; Chen, P.X.; Liu, R.; Tsao, R. Characterisation of phenolics, betanins and antioxidant activities in seeds of three Chenopodium quinoa Willd. genotypes. Food Chem. 2015, 166, 380–388. [Google Scholar] [CrossRef]
- Souza, S.P.; Roos, A.A.; Gindri, A.L.; Domingues, V.O.; Ascari, J.; Guerra, G.P. Neuroprotective effect of red quinoa seeds extract on scopolamine-induced declarative memory deficits in mice: The role of acetylcholinesterase and oxidative stress. J. Funct. Foods 2020, 69, 103958. [Google Scholar] [CrossRef]
- Tian, S.; Sun, Y.; Chen, Z.; Zhao, R. Bioavailability and Bioactivity of Alkylresorcinols from Different Cereal Products. J. Food Qual. 2020, 2020, 1–6. [Google Scholar] [CrossRef]
- Serventi, L.; Chitchumroonchokchai, C.; Riedl, K.M.; Kerem, Z.; Berhow, M.A.; Vodovotz, Y.; Schwartz, S.J.; Failla, M.L. Saponins from soy and chickpea: Stability during beadmaking and in vitro bioaccessibility. J. Agric. Food Chem. 2013, 61, 6703–6710. [Google Scholar] [CrossRef]
- Jaramillo, S.; Muriana, F.J.G.; Guillen, R.; Jimenez-Araujo, A.; Rodriguez-Arcos, R.; Lopez, S. Saponins from edible spears of wild asparagus inhibit AKT, p70S6K, and ERK signalling, and induce apoptosis through G0/G1 cell cycle arrest in human colon cancer HCT-116 cells. J. Funct. Foods 2016, 26, 1–10. [Google Scholar] [CrossRef] [Green Version]
- McClements, D.J.; Zou, L.; Zhang, R.; Salvia-Trujillo, L.; Kumosani, T.; Xiao, H. Enhancing nutraceutical performance using excipient foods: Designing food structures and compositions to increase bioavailability. Compr. Rev. Food Sci. Food Saf. 2015, 14, 824–847. [Google Scholar] [CrossRef]
- Patch, C.S.; Tapsell, L.C.; Williams, P.G.; Gordon, M. Plant sterols as dietary adjuvants in the reduction of cardiovascular risk: Theory and evidence. Vasc. Health Risk Manag. 2006, 2, 157–162. [Google Scholar] [CrossRef] [PubMed] [Green Version]
- Nagao, A.; Kotake-Nara, E.; Hase, M. Effects of fats and oils on the bioaccessibility of carotenoids and vitamin E in vegetables. Biosci. Biotechnol. Biochem. 2013, 77, 1055–1060. [Google Scholar] [CrossRef] [PubMed] [Green Version]
- Rahimzadeh, N.; Alizadeh, M.; Ghaemmaghami Hezaveh, S.J. Estimated Bioaccessibility to 5-hydroxymethylfurfural from Frequently Consumed Dried Fruits in Iran. J. Chem. Health Risks 2018, 4, 15–23. [Google Scholar] [CrossRef]
- Cai, X.; Fang, Z.; Dou, J.; Yu, A.; Zhai, G. Bioavailability of Quercetin: Problems and Promises. Curr. Med. Chem. 2013, 20, 2572–2582. [Google Scholar] [CrossRef]
- Chen, X.; McClements, D.J.; Zhu, Y.; Chen, Y.; Zou, L.; Liu, W.; Cheng, C.; Fu, D.; Liu, C. Enhancement of the solubility, stability and bioaccessibility of quercetin using protein-based excipient emulsions. Food Res. Int. 2018, 114, 30–37. [Google Scholar] [CrossRef]
- Alberdi-Cedeño, J.; Ibargoitia, M.L.; Guillén, M.D. Study of the In Vitro Digestion of Olive Oil Enriched or Not with Antioxidant Phenolic Compounds. Relationships between Bioaccessibility of Main Components of Different Oils and Their Composition. Antioxidants 2020, 9, 543. [Google Scholar] [CrossRef] [PubMed]


| Rt (Min) | Compound | FE | HFE |
|---|---|---|---|
| SAPONINS | 31.13 | 2.01 | |
| 12.78 | Fenugreek saponin I | 6.63 | n.d. |
| 12.87 | Fenugreek saponin II | 10.66 | n.d. |
| 13.09 | Fenugreek saponin III | 6.02 | 0.64 |
| 14.17 | Fenugreek saponin IV | 5.02 | 1.05 |
| 14.75 | Fenugreek saponin V | 2.80 | 0.33 |
| SAPOGENINS | 8.14 | ||
| 20.80 | 3,5-Spirostadiene derivative | n.d. | 0.43 |
| 20.90 | 3,5-Spirostadiene derivative | n.d. | 0.13 |
| 21.66 | Smilagenin | n.d. | 0.24 |
| 21.79 | Sarsasapogenin | n.d. | 0.64 |
| 22.24 | Diosgenin | n.d. | 2.57 |
| 22.34 | Tigogenin | n.d. | 0.60 |
| 22.39 | Yamogenin | n.d. | 1.23 |
| 22.48 | Neotigogenin | n.d. | 0.64 |
| 23.52 | Yuccagenin | n.d. | 0.03 |
| 23.70 | Gitogenin | n.d. | 1.21 |
| 23.88 | Neogitogenin | n.d. | 0.42 |
| QE | HQE | ||
| SAPONINS | 7.86 | 2.00 | |
| 13.44 | Quinoa saponin I | 1.29 | 0.23 |
| 13.75 | Quinoa saponin II | 3.74 | 1.39 |
| 14.38 | Quinoa saponin III | 2.82 | 0.38 |
| SAPOGENINS | 5.63 | ||
| 24.25 | Oleanolic acid | n.d. | 1.55 |
| 25.24 | Hederagenin | n.d. | 0.82 |
| 27.01 | Serjanic acid | n.d. | 1.83 |
| 28.47 | Phytolaccagenic acid | n.d. | 1.44 |
| Rt (Min) | Compound | FE | HFE | ||
|---|---|---|---|---|---|
| LIPIDS | Area | g/100 g | Area | g/100 g | |
| Fatty acids | 2.30 | 35.21 | |||
| 12.69 | Fatty acid n.i. | n.d. | n.d. | 327,178 | 0.13 |
| 13.76 | Azelaic acid | n.d. | n.d. | 976,973 | n.q. |
| 14.09 | Tetradecanoic acid | n.d. | n.d. | 335,623 | 0.14 |
| 14.74 | n-Pentadecanoic acid | n.d. | n.d. | 643,202 | 0.18 |
| 15.43 | Palmitic acid | 2,556,971 | 0.47 | 42,547,201 | 6.50 |
| 15.84 | cis-10-Heptadecenoic acid | n.d. | n.d. | 873,397 | 0.22 |
| 15.97 | Heptadecanoic acid | n.d. | n.d. | 1,616,500 | 0.33 |
| 16.49 | Linoleic acid + oleic acid | 8,443,651 | 1.44 | 165,223,256 | 25.00 |
| 16.60 | Stearic acid | 1,976,029 | 0.38 | 10,112,280 | 1.61 |
| 17.41 | α-Linolenic acid | n.d. | n.d. | 1,386,960 | 0.29 |
| 17.50 | Fatty acid n.i. | n.d. | n.d. | 578,427 | 0.17 |
| 17.63 | Arachidic acid | n.d. | n.d. | 780,182 | 0.20 |
| 18.64 | Docosanoic acid | n.d. | n.d. | 498,225 | 0.16 |
| 19.11 | Fatty acid n.i. | n.d. | n.d. | 414,082 | 0.15 |
| 19.57 | Tetracosanoic acid | n.d. | n.d. | 244,503 | 0.12 |
| Glycerides | 0.38 | 7.08 | |||
| 18.26 | 2-Monopalmitin | n.d. | n.d. | 312,684 | 0.09 |
| 18.43 | 1-Monopalmitin | 660,615 | 0.22 | 749,955 | 0.25 |
| 19.08 | 2-Monoolein | n.d. | n.d. | 519,155 | 0.17 |
| 19.25 | 1-Monoolein | n.d. | n.d. | 1,333,086 | 0.45 |
| 19.35 | 2-Monostearin | 493,752 | 0.16 | 236,519 | 0.06 |
| 31.22 | Diglyceride n.i. | n.d. | n.d. | 326,190 | 1.32 |
| 32.15 | Diglyceride n.i. | n.d. | n.d. | 495,677 | 1.79 |
| 35.98 | Diglyceride n.i. | n.d. | n.d. | 305,674 | 1.27 |
| 37.32 | Diglyceride n.i. | n.d. | n.d. | 453,921 | 1.67 |
| NITROGEN COMPOUNDS | |||||
| Amino acids and derivatives | 5.96 | ||||
| 9.08 | l-Valine | 74,446 | 0.02 | n.d. | n.d. |
| 11.59 | Glutamic acid derivative n.i. | 1,157,128 | 0.27 | n.d. | n.d. |
| 11.67 | Glutamic acid | 21,256,096 | 4.97 | n.d. | n.d. |
| 11.77 | Glutamic acid derivative n.i. | 1,508,906 | 0.35 | n.d. | n.d. |
| 11.83 | Glutamic acid derivative n.i. | 705,448 | 0.17 | n.d. | n.d. |
| 12.58 | Phenylalanine | 485,697 | 0.11 | n.d. | n.d. |
| 14.78 | l-Tyrosine | 283,205 | 0.07 | n.d. | n.d. |
| Nitrogen compounds, non-protein | |||||
| 18.75 | Adenosine | 252,644 | n.q. | n.d. | n.d. |
| PHENOLIC COMPOUNDS | |||||
| 12.56 | 4-Hydroxybenzoic acid | n.d. | n.d. | 320,566 | 0.03 |
| 12.56 | Phenolic compound n.i. | 599,743 | 0.05 | n.d. | n.d. |
| ORGANIC ACIDS | |||||
| 8.27 | Levulinic acid | n.d. | n.d. | 1,064,940 | n.q. |
| 12.40 | β-Hydroxy-β-methylglutaric acid | n.d. | n.d. | 288,134 | n.q. |
| CARBOHYDRATES AND DERIVATIVES | |||||
| Sugars | 1.73 | ||||
| 16.55 | Monosaccharide n.i. | 2,779,858 | 0.09 | n.d. | n.d. |
| 18.93 | Sucrose | 5,189,844 | 1.09 | n.d. | n.d. |
| 19.30 | Disaccharide n.i. | 1,134,911 | 0.24 | n.d. | n.d. |
| 19.53 | Disaccharide n.i. | 1,129,958 | 0.24 | n.d. | n.d. |
| 19.90 | Disaccharide n.i. | 199,114 | 0.04 | n.d. | n.d. |
| 21.24 | Disaccharide n.i. | 88,523 | 0.03 | n.d. | n.d. |
| Sugar alcohols | 1.70 | ||||
| 14.18 | Sugar alcohol n.i. | 2,851,411 | 1.55 | n.d. | n.d. |
| 15.85 | Sugar alcohol n.i. | 279,870 | 0.15 | n.d. | n.d. |
| TOCOLS | |||||
| 21.07 | α-Tocopherol | 122,692 | 0.10 | 330,911 | 0.26 |
| PHYTOSTEROLS | 0.82 | 1.86 | |||
| 21.81 | Campesterol | 152,569 | 0.12 | 332,792 | 0.26 |
| 22.38 | β-Sitosterol | 673,182 | 0.49 | 2,230,012 | 1.31 |
| 22.85 | Cycloartenol | 262,446 | 0.21 | 382,728 | 0.29 |
| OTHER ORGANIC COMPOUNDS | |||||
| 9.96 | 5-(Hydroxymethyl)furfural | n.d. | n.d. | 794,089 | n.q. |
| NON-IDENTIFIED COMPOUNDS | |||||
| 9.53 | n.i. | n.d. | n.d. | 272,457 | n.d. |
| 9.96 | n.i. | 379,413 | n.d. | n.d. | n.d. |
| 10.07 | n.i. | 640,401 | n.d. | n.d. | n.d. |
| 15.64 | n.i. | 679,227 | n.d. | n.d. | n.d. |
| 15.93 | n.i. | 613,602 | n.d. | n.d. | n.d. |
| 16.95 | n.i. | 1,047,810 | n.d. | n.d. | n.d. |
| Rt (Min) | Compound | QE | HQE | ||
|---|---|---|---|---|---|
| LIPIDS | Area | g/100 g | Area | g/100 g | |
| Fatty acids | 18.67 | 57.37 | |||
| 10.81 | Fatty acid n.i. | 450,537 | 0.15 | 105,632 | 0.10 |
| 13.74 | Azelaic acid | 295,429 | n.q. | 624,302 | n.q. |
| 14.09 | Tetradecanoic acid | n.d. | n.d. | 967,829 | 0.23 |
| 14.60 | Palmitic acid, methyl ester | n.d. | n.d. | 564,801 | 0.17 |
| 14.74 | n-Pentadecanoic acid | n.d. | n.d. | 436,759 | 0.15 |
| 15.24 | Palmitoleic acid | n.d. | n.d. | 1,594,816 | 0.33 |
| 15.40 | Palmitic acid | 21,585,329 | 2.57 | 63,448,504 | 9.65 |
| 15.67 | Linoleic acid methyl ester | 709,965 | 0.19 | 1,460,352 | 0.31 |
| 15.79 | Heptadecanoic acid | 645,089 | 0.18 | n.d. | n.d. |
| 16.46 | Linoleic acid + Oleic acid | 112,939,760 | 13.82 | 292,989,296 | 44.26 |
| 16.57 | Stearic acid | 2,598,181 | 0.48 | 5,188,940 | 0.87 |
| 16.80 | cis-10-Nonadecenoic acid | 573,992 | 0.17 | 1,192,260 | 0.27 |
| 16.95 | Nonadecanoic acid | 717,759 | 0.19 | n.d. | n.d. |
| 17.11 | Branched chain fatty acid n.i. | 558,659 | 0.17 | n.d. | n.d. |
| 17.49 | Fatty acid n.i. | 1,977,879 | 0.38 | 2,625,371 | 0.48 |
| 17.62 | Eicosanoic acid | 388,780 | 0.14 | 664,297 | 0.19 |
| 18.52 | cis-13-Docosenoic acid | 834,878 | 0.21 | 1,910,933 | 0.37 |
| Glycerides | 23.39 | 23.15 | |||
| 18.26 | 2-Monopalmitin | n.d. | n.d. | 1,026,164 | 0.35 |
| 18.43 | 1-Monopalmitin | 2,554,881 | 0.85 | 2,241,608 | 0.75 |
| 18.64 | Monoglyceride n.i. | n.d. | n.d. | 2,122,285 | 0.71 |
| 19.08 | 2-Monoolein | n.d. | n.d. | 1,797,832 | 0.61 |
| 19.26 | 1-Monoolein | n.d. | n.d. | 5,789,486 | 1.81 |
| 19.25 | Monoglyceride n.i. | 2,419,864 | 0.81 | 625,561 | 0.21 |
| 19.36 | 2-Monostearin | 1,504,555 | 0.51 | 885,292 | 0.30 |
| 31.22 | Diglyceride n.i. | 1,711,567 | 5.09 | 892,885 | 2.87 |
| 32.15 | Diglyceride n.i. | 1,210,341 | 3.73 | 1,589,691 | 4.76 |
| 35.98 | Diglyceride n.i. | 1,895,510 | 5.59 | 1,322,477 | 4.03 |
| 37.33 | Diglyceride n.i. | 2,338,224 | 6.80 | 2,321,607 | 6.75 |
| NITROGEN COMPOUNDS | |||||
| Amino acids and derivatives | 1.07 | ||||
| 9.09 | l-Valine | 520,768 | 0.12 | n.d. | n.d. |
| 9.65 | l-Leucine | 593,774 | 0.14 | n.d. | n.d. |
| 9.82 | l-Isoleucine | 573,058 | 0.13 | n.d. | n.d. |
| 9.84 | l-Proline | 310,659 | 0.07 | n.d. | n.d. |
| 12.58 | Phenylalanine | 755,735 | 0.18 | n.d. | n.d. |
| 14.79 | l-Tyrosine | 1,841,249 | 0.43 | n.d. | n.d. |
| Nitrogen compounds, non-protein | |||||
| 18.76 | Adenosine | 859,568 | n.q | n.d. | n.d. |
| 19.03 | Nucleoside n.i. | 2,105,901 | n.q | n.d. | n.d. |
| PHENOLIC COMPOUNDS | 0.49 | 1.20 | |||
| 11.91 | Phenolic compound n.i. | 301,007 | 0.03 | 352,057 | 0.03 |
| 12.50 | 3-Hydroxybenzoic acid | 277,150 | 0.02 | 228,709 | 0.02 |
| 12.55 | 4-Hydroxybenzoic acid | 316,918 | 0.03 | 742,472 | 0.06 |
| 13.56 | Vanillic acid | 658,070 | 0.06 | 2,287,118 | 0.19 |
| 13.97 | Protocatechuic acid | 1,574,802 | 0.13 | 1,100,106 | 0.09 |
| 15.70 | Isoferulic acid | 770,448 | 0.07 | 1,178,230 | 0.10 |
| 15.82 | Phenolic compound n.i. | n.d. | n.d. | 4,209,075 | 0.36 |
| 21.39 | Quercetin | 529,905 | 0.16 | 1,889,147 | 0.35 |
| ORGANIC ACIDS | |||||
| 8.31 | Levulinic acid | n.d. | n.d. | 6,678,331 | n.q. |
| CARBOHYDRATES AND DERIVATIVES | |||||
| Sugars | 15.04 | ||||
| 13.50 | Monosaccharide n.i. | 334,468 | 0.05 | n.d. | n.d. |
| 14.02 | Monosaccharide n.i. | 800,569 | 0.11 | n.d. | n.d. |
| 14.08 | Monosaccharide n.i. | 869,500 | 0.12 | n.d. | n.d. |
| 14.57 | Monosaccharide n.i. | 1,341,584 | 0.18 | n.d. | n.d. |
| 15.13 | Monosaccharide n.i. | 1,725,857 | 0.23 | n.d. | n.d. |
| 17.32 | Monosaccharide n.i. | 621,039 | 0.08 | n.d. | n.d. |
| 18.16 | Monosaccharide n.i. | 608,507 | 0.08 | n.d. | n.d. |
| 18.91 | Disaccharide n.i. | 761,289 | 1.67 | n.d. | n.d. |
| 18.99 | Sucrose | 70,842,522 | 12.52 | n.d. | n.d. |
| Sugar alcohols | 0.88 | ||||
| 13.37 | Sugar alcohol n.i. | 219,799 | 0.12 | n.d. | n.d. |
| 13.41 | Sugar alcohol n.i. | 310,261 | 0.17 | n.d. | n.d. |
| 14.89 | Sugar alcohol n.i. | 1,089,958 | 0.59 | n.d. | n.d. |
| TOCOLS | |||||
| 20.38 | β-Tocopherol | 710,062 | 0.51 | 987,442 | 0.68 |
| 21.09 | α-Tocopherol + Branched chain alkylresorcinol C20:0 | 504,040 | n.q. | 494,045 | n.q. |
| ALKYLRESORCINOLS 1 | 1.79 | 1.04 | |||
| 20.57 | Branched chain alkylresorcinol C19:0 | 301,095 | 0.10 | 131,551 | 0.04 |
| 20.73 | Alkylresorcinol C19:0 | 157,677 | 0.05 | 91,436 | 0.03 |
| 20.86 | Methyl alkylresorcinol C19:0 a | 162,491 | 0.05 | 174,353 | 0.06 |
| 21.04 | Methyl alkylresorcinol C19:0 b | 89,956 | 0.03 | 105,698 | 0.03 |
| 21.22 | Alkylresorcinol C20:0 | 63,163 | 0.02 | 66,606 | 0.02 |
| 21.44 | Methyl alkylresorcinol C20:0 | 465,052 | 0.15 | 713,693 | n.q. |
| 21.56 | Branched chain alkylresorcinol C21:0 | 632,613 | 0.21 | 341,593 | 0.11 |
| 21.66 | Alkenylresorcinol C21:1 | 345,020 | 0.11 | 199,108 | 0.07 |
| 21.77 | Alkylresorcinol C21:0 | 404,519 | 0.13 | 198,851 | 0.07 |
| 21.94 | Methyl alkylresorcinol C21:0 a | 363,033 | 0.12 | 355,126 | 0.12 |
| 22.05 | Methyl alkenylresorcinol C21:1 | 89,517 | 0.03 | 84,248 | 0.03 |
| 22.10 | Alkenylresorcinol C22:1 | 44,641 | 0.01 | n.d. | n.d. |
| 22.18 | Methyl alkylresorcinol C21:0 b | 135,872 | 0.04 | 198,437 | 0.07 |
| 22.24 | Branched chain alkylresorcinol C22:0 | 588,653 | 0.19 | 376,310 | 0.12 |
| 22.53 | Methyl alkenylresorcinol C22:1 + β-Amyrin | 111,487 | n.q. | 157,275 | n.q. |
| 22.69 | Methyl alkylresorcinol C22:0 | 372,702 | 0.12 | 327,208 | 0.11 |
| 22.84 | Branched chain alkylresorcinol C23:0 a | 294,763 | 0.10 | n.d. | n.d. |
| 22.99 | Alkenylresorcinol C23:1 | 115,112 | 0.04 | 48,642 | 0.02 |
| 23.38 | Methyl alkylresorcinol C23:0 a | 185,482 | 0.06 | 165,900 | 0.05 |
| 23.77 | Branched chain alkylresorcinol C24:0 | 238,231 | 0.08 | 93,178 | 0.03 |
| 24.41 | Methyl alkylresorcinol C24:0 | 145,075 | 0.05 | 105,472 | 0.03 |
| 24.60 | Branched chain alkylresorcinol C25:0 | 149,488 | 0.05 | 44,779 | 0.01 |
| 25.35 | Methyl alkylresorcinol C25:0 | 41,486 | 0.01 | 34,293 | 0.01 |
| 25.89 | Branched chain alkylresorcinol C26:0 | 43,240 | 0.01 | n.d. | n.d. |
| PHYTOSTEROLS | 1.47 | 2.35 | |||
| 21.82 | Campesterol | n.d. | n.d. | 93,024 | 0.08 |
| 21.99 | Stigmasterol | 129,590 | 0.10 | 270,847 | 0.21 |
| 22.39 | β-Sitosterol | 847,328 | 0.60 | 1,629,923 | 1.02 |
| 22.81 | Δ7-Stigmastenol | 1,143,706 | 0.77 | 1,663,885 | 1.04 |
| OTHER ORGANIC COMPOUNDS | |||||
| 9.96 | 5-(Hydroxymethyl)furfural | n.d. | n.d. | 4,142,040 | n.q. |
| 19.56 | Squalene | 2,151,321 | 0.97 | 3,244,348 | 1.40 |
| NON-IDENTIFIED COMPOUNDS | |||||
| 10.68 | n.i. | n.d. | n.d. | 145,243 | n.q. |
| 11.87 | n.i. | 530,418 | n.q. | n.d. | n.d. |
| 13.11 | n.i. | 199,292 | n.q. | n.d. | n.d. |
| 13.61 | n.i. | 387,038 | n.q. | n.d. | n.d. |
| 14.53 | n.i. | 5,992,880 | n.q. | n.d. | n.d. |
| 14.68 | n.i. | 4,571,935 | n.q. | n.d. | n.d. |
| 16.57 | n.i. | 3,652,082 | n.q. | n.d. | n.d. |
| 17.59 | n.i. | n.d. | n.d. | 731,295 | n.q. |
© 2020 by the authors. Licensee MDPI, Basel, Switzerland. This article is an open access article distributed under the terms and conditions of the Creative Commons Attribution (CC BY) license (http://creativecommons.org/licenses/by/4.0/).
Share and Cite
Navarro del Hierro, J.; Reglero, G.; Martin, D. Chemical Characterization and Bioaccessibility of Bioactive Compounds from Saponin-Rich Extracts and Their Acid-Hydrolysates Obtained from Fenugreek and Quinoa. Foods 2020, 9, 1159. https://doi.org/10.3390/foods9091159
Navarro del Hierro J, Reglero G, Martin D. Chemical Characterization and Bioaccessibility of Bioactive Compounds from Saponin-Rich Extracts and Their Acid-Hydrolysates Obtained from Fenugreek and Quinoa. Foods. 2020; 9(9):1159. https://doi.org/10.3390/foods9091159
Chicago/Turabian StyleNavarro del Hierro, Joaquín, Guillermo Reglero, and Diana Martin. 2020. "Chemical Characterization and Bioaccessibility of Bioactive Compounds from Saponin-Rich Extracts and Their Acid-Hydrolysates Obtained from Fenugreek and Quinoa" Foods 9, no. 9: 1159. https://doi.org/10.3390/foods9091159