Article

Pyropheophytin a in Soft Deodorized Olive Oils

by
Raquel B. Gómez-Coca
*,
Mahmoud Alassi
,
Wenceslao Moreda
and
María del Carmen Pérez-Camino
Department of Characterization and Quality of Lipids, Instituto de la Grasa-CSIC-, Campus of Universidad Pablo de Olavide, E-41013 Sevilla, Spain
*
Author to whom correspondence should be addressed.
Foods 2020, 9(8), 978; https://doi.org/10.3390/foods9080978
Submission received: 22 May 2020 / Revised: 3 July 2020 / Accepted: 21 July 2020 / Published: 23 July 2020

Abstract

:
Mild refined olive oil obtained by neutralization and/or by soft deodorization at a low temperature and its blending with extra virgin olive oil (EVOO) is not allowed and is difficult to detect. Chlorophyll derivatives, pheophytins and pyropheophytin, and their relative proportions were proposed as parameters to detect such processes. The objective of this study is to determine changes in EVOO, in terms of pheophytins and pyropheophytin, occurring after several well-controlled mild refining processes. The changes on those chlorophyll pigments due to the processes depend on the temperature, stripping gas, acidity and oil nature. The data obtained show that, at temperatures below 100 °C, the rate at which pyropheophytin a is formed (Ra) is lower than the rate at which pheophytins a+a’ disappear (Ra+a’). As a consequence, the Ra+a’ and Ra ratios are considered to be directly linked to pheophytins a+a’ decrease instead of to pyropheophytin a formation. Stripping gas very slightly affects the transformation of the chlorophyll pigments; actually both acidity and N2 enhance the increment in the Ra+a’ and Ra ratios. In relation to the oil nature, the higher the initial pheophytin a+a’ content, the higher the increase in the Ra+a’ and Ra relations.

1. Introduction

Olive tree (Olea europaea) is one of the most expanded crops in the world. This has repercussions not only regarding the nutritional point of view but also with respect to the economy of, mainly, Mediterranean countries. Both the International Olive Council (IOC) and the European Union consider virgin olive oil (VOO) as just the oil obtained from the fruit of the olive tree solely by mechanical or other physical processes under conditions, particularly thermal conditions, that do not lead to alterations in the oil, and which has not undergone any treatment other than washing, decantation, centrifugation, and filtration [1,2]. If the quality of the oil does not meet a number of standards [3], it cannot be considered as ‘edible’ and must be refined. Refined olive oil (ROO) is a flavorless, colorless product that cannot be sold by retail and that has to be mixed with genuine VOO. Controlled olive oil blends are available in the market under the designation of olive oil (OO) composed of refined and virgin olive oils. Blends of olive oil with other vegetable oils are available too [4]. However, the high market price that VOO can reach has made it target of both mislabeling and illegal blending, and much work has been done to uncover such practices, including that on the detection of the correct proportion of olive oil in legal blends with seed oils [5,6].
Regarding adulterations, they may consist, for instance, of the addition of hazelnut oil, of oil obtained from the second extraction of the olive paste (olive pomace oil), or of soft deodorized olive oil. Hazelnut oil can be detected within an interval of 20–25% through the determination of the difference between the actual and the theoretical content of triacylglycerols (TAG) with equivalent carbon number 42 (ECN 42) [7], and at lower percentages (5% and 2%, respectively) through the relations between different TAG [8] or through lupeol determination [9,10,11]. The presence of low-quality centrifugation oil (olive pomace oil) can be proven determining the wax content [12] and the aliphatic alcohols content [13] since they increase during the storage time previous to the second centrifugation [14]. As far as soft deodorized olive oils are concerned, they are still difficult, if not impossible, to detect, which has triggered considerable research on the subject.
Soft deodorized olive oils come from low quality oils with high acidity or weak organoleptic defects, which have been the objects of illegal practices channeled into concealing their negative flavor. One of the strategies commonly used consists of a neutralization (in case of high free acidity and/or very high bitterness) and/or soft deodorization at a low temperature (in case of low free acidity but negative sensory characteristics), and then blending with extra virgin olive oil (EVOO) [15]. This practice is difficult to detect since the conventional refining markers, such as stigmastadienes [16,17,18], trans fatty acids, ad TAG dimers [19], are only formed at high temperatures, such as those in standard deodorization in which the oil is kept at 180–250 °C for 30–180 min [15,20]. Actually, soft deodorization conditions are tailored to avoid the formation of those specific markers [21], as has been pointed out in recent studies conceived to resolve this problem. Actually, such studies use the determination of glyceridic compounds to detect the presence of soft deodorized oils in virgin olive oils. They focus on the fact that, after the application of mild refining conditions, the relationship between the diacylglycerol content and the free acidity breaks [20].
Furthermore, the determination of non-glyceridic components has also been used to define the effect of deodorization. Such is the case of the fatty acid alkyl ester (FAAE) content [15,22] that has been related with the oil’s sensory classification. In that case, it was demonstrated that such alkyl esters only proved the addition of soft deodorized oil when this had been extracted from fruits with fermentative defects (i.e., fusty, musty, and winey-vinegary), remaining unaffected in oxidized oils and in oils obtained from frozen olives [22,23]. Moreover, the effects of hydrolysis and oxidation have been utilized to detect the presence of soft deodorized olive oil in VOO [24] and so has been the determination of the composition of volatile compounds [21].
In any of the above-referenced methods, the results were not conclusive; therefore, there is a need for new markers. In this line and since soft deodorization passes at a certain temperature, it makes sense to focus on some other compounds sensitive to low-temperature treatments such as chlorophylls. Chlorophylls, the natural pigments responsible for the green color of vegetable oils [25], are highly sensitive and experience chemical and physical modifications after processing and storage [26]. The most widespread reaction is pheophytinization, which takes place by the breakdown and loss of the magnesium atom from the chlorophyll moiety to yield pheophytins (phy) [27]. One further step, as a result of the heat treatments, consists of the formation of pyropheophytins (pyphy) by the demethoxycarbonylation of the C13 atom [27].
It is clear then that there must be a connection between chlorophyll degradation products and the different stages of a soft deodorization process. Actually, Serani and Piacenti [28] used a correlation coefficient (cold index) to reveal the use of soft deodorization in virgin olive oils but, according to Gertz [29], the results were compromised by the method precision due to the fact that the cold index was influenced by the chlorophyll content of the oil and by the quantification of phy and pyphy, since the instability of chlorophyll hindered the possibility of using a calibration standard. Following those previous lines of research, we were convinced that the quantities and relations of phy and pyphy could be suitable markers for olive oil processing. Therefore, we decided to study how phy and pyphy were affected by soft deodorization and to establish the relationship between VOO chlorophyll pigment composition and the presence of soft deodorized oils, taking into account that the soft deodorization procedure may be tailored to suit the characteristics of the raw material [20].

2. Materials and Methods

2.1. Chemicals

All chemical reagents were of analytical grade. The standard of chlorophyll a was purchased at Sigma-Aldrich (Merck KGaA, Darmstadt, Germany). Sodium hydroxide pellets, phenolphthalein, and diethyl ether, were from Panreac Química, S.A.U. (Castellar del Valles, Barcelona, Spain). Acetone and methanol were from Romil Chemicals Ltd. (Waterbeach, Cambridge, GB, UK). The deionized water used was obtained from a Milli-Q 50 system (Millipore Corp., Burlington, MA, USA).

2.2. Samples

Four Spanish monovarietal olive oils (Hojiblanca, Picual and two Manzanilla samples) were purchased directly from producers. A second set consisting of six olive oils of several origins and qualities (L-1, M-1, H-1, L-2, M-2 and H-2), with no varietal specifications, was purchased from local markets or directly from producers.

2.3. Qualitative Analysis of Chlorophyll Pigments

Several methods have been proposed to determine chlorophyll pigments in olive oils, including rapid and routine techniques [28,30,31].
In this work, we follow the method described by the International Standard Organization [32] and the German Society for Fat Science [33], based on the procedure previously described by Gertz and coworkers [29]. This method is currently one of the most widely used for the determination of phy and pyphy. Briefly, 300 mg of the oil samples is weighed into a 4-mL vial and introduced, with the help of 1 mL n-hexane, into a 1-g silica solid phase extraction (SPE) column, previously activated with 5 mL hexane. Subsequently the vial is rinsed twice with 1 mL n-hexane and added onto the column. A first fraction is eluted with 5 mL of a mixture consisting of n-hexane:diethyl ether (90:10, v/v) and is discarded. A second fraction is eluted with 5 mL acetone and collected. Then, it is evaporated in a rotary evaporator and re-suspended in 0.5 mL acetone for its subsequent analysis using a high-performance liquid chromatography-diode array detector (HPLC-DAD).
The HPLC analyses of the chlorophyll pigments were carried out with an HP Agilent 1100 Liquid Chromatograph (Agilent Technologies, Santa Clara, CA, USA) equipped with a DAD. Acquisition of data was done with the Agilent ChemStation for the HPLC System program. The conditions for the HPLC assays were: Waters Spherisorb ODS2 C18 column (250 × 4.6 mm internal diameter, 3-μm particle size) (Waters Ltd., Hertfordshire, UK), 20-μL injection volume through a Rheodyne Manual Sample Injector Valve (Idex Health & Science LLC, Rohnert Park, CA, USA), and isocratic elution conditions water:methanol:acetone (4:36:60, v/v/v), at a flow rate of 1 mL/min. Sequential detection was performed at 410 nm.

2.4. Quantitative Analysis of Chlorophyll Pigments

Pigments were quantified with a calibration curve obtained by least-squares linear regression analysis. The concentration range of the curve fitted the expected level of chlorophyll in VOO. We proceed as follows:
From a 0.01% chlorophyll standard solution, we prepared five different diluted solutions in acetone (concentrations between 0.1 and 0.5 mg/kg) and we injected them, in duplicate, in the HPLC system.
The exact concentration of the aforementioned chlorophyll solutions (1.12 × 10⁻⁷ M, 2.24 × 10⁻⁷ M, 2.80 × 10⁻⁷ M, 4.48 × 10⁻⁷ M, 5.60 × 10⁻⁷ M) were determined spectrophotometrically at 410 nm, using the chlorophyll extinction coefficient (ε410 = 94700/M × cm) and molecular weight (Mw = 893.51 g/moL).
The relationship between the different chlorophyll pigments was calculated according to the following equations:
Ra+a’ (%) = pyphy a × 100/(pyphy a + phy a + phy a’)
Ra (%) = pyphy a × 100/(pyphy a + phy a)
where pyphy a, phy a and phy a’ stand for pyropheophytin a, pheophytin a, and pheophytin a’, respectively.

2.5. Sensitivity and Method Repeatability

Tests to assess the repeatability of the method and trials to establish the limit of detection (LOD) were performed according to published procedures [34].
The LOD can be defined as the minimum concentration of an analyte that can be detected, although not necessarily quantified, with an acceptable confidence through a given analytical procedure. These concentration values should produce sharp, symmetrical analyte peaks with no tailing or shoulders and with a signal-to-noise ratio of at least 3. That is a concentration whose signal equals the blank signal (Y) plus three times (k = 3) its standard deviation (S): LOD = Y + k × S.
In order to calculate the LOD, five olive oil solutions prepared at different dilutions from a sample with low chlorophyll pigments content were taken to the HPLC, their areas measured and the respective standard deviations calculated.
The repeatability of the method was assessed with three VOO samples of different chlorophyll pigment concentrations (L-1, M-1 and H-1 with low, medium and high chlorophyll concentration, respectively). We determined the phy a+a’ and of pyphy a concentrations (in mg/kg) together with the Ra+a’ percentage.
Measurements were done in triplicate. The statistical analysis of the repeatability was carried out following the ISO 5725 Norm [35] and AOAC Regulation [36].
The statistical parameters used were:
-
Sr: Standard deviation of the repeatability = ( x x ¯ ) 2 ( n 1 )
-
r: Repeatability (2.8√Sr2) or intra-laboratory variance.
-
RSDr%: Relative standard deviation of the repeatability = 100 × Sr/mean.
-
CI: Confidence interval (95%).
The statistical study of the results was carried out by one-way analysis of variance (one-way ANOVA) of a number of repeated samples. The minimum significant level was set at 5%. The analysis was performed using the SPSS 12.0 program (SPSS Inc., Chicago, WI, USA).

2.6. Olive Oil Soft Neutralization Process

We carried out the soft neutralization procedure using an aqueous sodium hydroxide solution at 12 % (w/v). In order to know the volume needed for the free fatty acid neutralization, we first determined the free acidity of the starting oil according to the method published by the IOC. This method drives to the calculation of the free acidity expressed as the percentage of oleic acid and its performance had already been tested according to the corresponding collaborative tests [37].
Next, we placed 10 ± 0.001 g of each olive oil sample in test tubes and added a volume of the 12% (w/v) aqueous sodium hydroxide solution corresponding to the free acidity, plus a 5% excess (2 mL approximately). We shook the tubes for 20 min and then centrifuged them (10 min, 3000 rpm, 16 cm centrifugation diameter). On each case, we discarded the aqueous phase and washed the remaining oily phase with 5–6 portions distilled water for 5 min. We repeated this last step until we had made sure there were no free-soaps (the pink color of the phenolphthalein disappeared completely). Finally, we centrifuge them for 10 min in the described conditions.

2.7. Olive Oil Mild Deodorization Procedure

Soft deodorization is a technique utilized to eliminate unpleasant odors in olive oil, getting a matrix that keeps its chemical composition unaltered. We carried out the process under soft thermal conditions, vacuum, and a certain stripping agent (N2 or Air), in a way that such gas passed for a given period of time through a volume of relatively hot oil at a low pressure. In order to do this, we prepared our own laboratory equipment, mimicking industrial conditions as much as possible. Such equipment consisted of the following parts:
  • Temperature controlled shaker.
  • Kitasato flask to prevent the sucking back of the sample.
  • Beaker with glycerine as thermal liquid and stirring magnet.
  • 60 mL Sample container with bubbler.
  • Thermostat.
  • Rotameter.
  • Stripping gas intake system.
  • Vacuum gauge.
  • Vacuum pump with vacuum control.
We took the olive oil samples through different mild deodorization processes (vacuum at 22.5 mmHg; 600 mL/min stripping gas), and studied the influence of the following factors (Table 1):
  • Deodorization time (using all four varieties: Treatment #1).
  • Deodorization temperature (hojiblanca and manzanilla 1 and 2 varieties: Treatment #2).
  • Free acidity (using picual variety).
  • Stripping gas (using hojiblanca variety: Treatment #3).
Moreover, the effect of combining neutralization and deodorization was considered. In order to do that, three olive oils with a low, medium and high content of chlorophyll pigments (L-2, M-2, and H-2, respectively) were used. After neutralization with sodium hydroxide (Section 2.6) and filtering, oils were soft deodorized under N2, at 98 °C, for three hours.

3. Results and Discussion

3.1. Sensitivity and Method Repeatability

The lowest detectable concentration of pyphy a was 0.07 mg/kg.
The data obtained in two consecutive determinations of the same sample, using the same analytical method, did not differ in more than the value of ‘r’ (Table 2). From those data (RSDr = 0.34–6.59%, RSDr = 2.5–10%, and RSDr = 1.82–4.62%, for phy (a+a’) and pyphy a, and Ra+a’, respectively) one may consider the method to have a good repeatability.

3.2. Qualitative Analysis of Chlorophyll Pigments

The selected conditions lead to the separation of individual pigments. The HPLC chromatograms consist of a series of peaks, three of them well resolved, whose retention times appear within the range from 15 to 25 min (Figure 1). They correspond to phy b and b’, phy a, phy a’, and pyphy a. After, pyphy a’ might also appear. Those peaks were identified according to the published bibliography [28,33].

3.3. Quantitative Analysis of Chlorophyll Pigments

We calculated the analyte concentration corresponding to each peak (phy a, phy a’, and pyphy a) using the chlorophyll calibration curve: concentration (mg/kg) = −0.00319 + 0.0111 × peak area. We used chlorophyll as a standard instead of pyphy a because pyphy a is not commercialized as such and its synthesis is laborious.

3.4. Olive Oil Mild Deodorization Procedure

As shown in Table 3, the olive oil samples under study presented a wide variation in their chlorophyll content and, as observed in previous studies on different olive varieties [38], phy a was always the dominant pigment, being particularly high in the case of Manzanilla 1. According to our experience in the last ten years, where we have been analyzing 150 samples a year, on average, such a value may be considered to be very high. However, we have to keep in mind that it is not possible to give an expected average value (and therefore a reference value) for this parameter since the total content of chlorophyll compounds depends, among other things, on the characteristics of the starting samples and on the storage conditions [27]. Interestingly, the analyte concentrations seem to be dependent on the cultivar, which is the opposite to those observed by previous researchers over studies in which a higher number of cultivars were considered [39]. Therefore, the small number of samples advise us to be cautious regarding such a statement. We are aware that our assertion may seem contradictory to that observed in the cases of Manzanilla 1 and Manzanilla 2 (same cultivar but totally different results). In such a circumstance we have to take into consideration that the pigment composition and content of a certain oil is highly conditioned by the oil’s initial quality, light exposure, temperature, etc., and not only by the cultivar. This is indeed a line of research to be focused on during our next endeavors, where a wider number of varieties are being systematically analyzed.

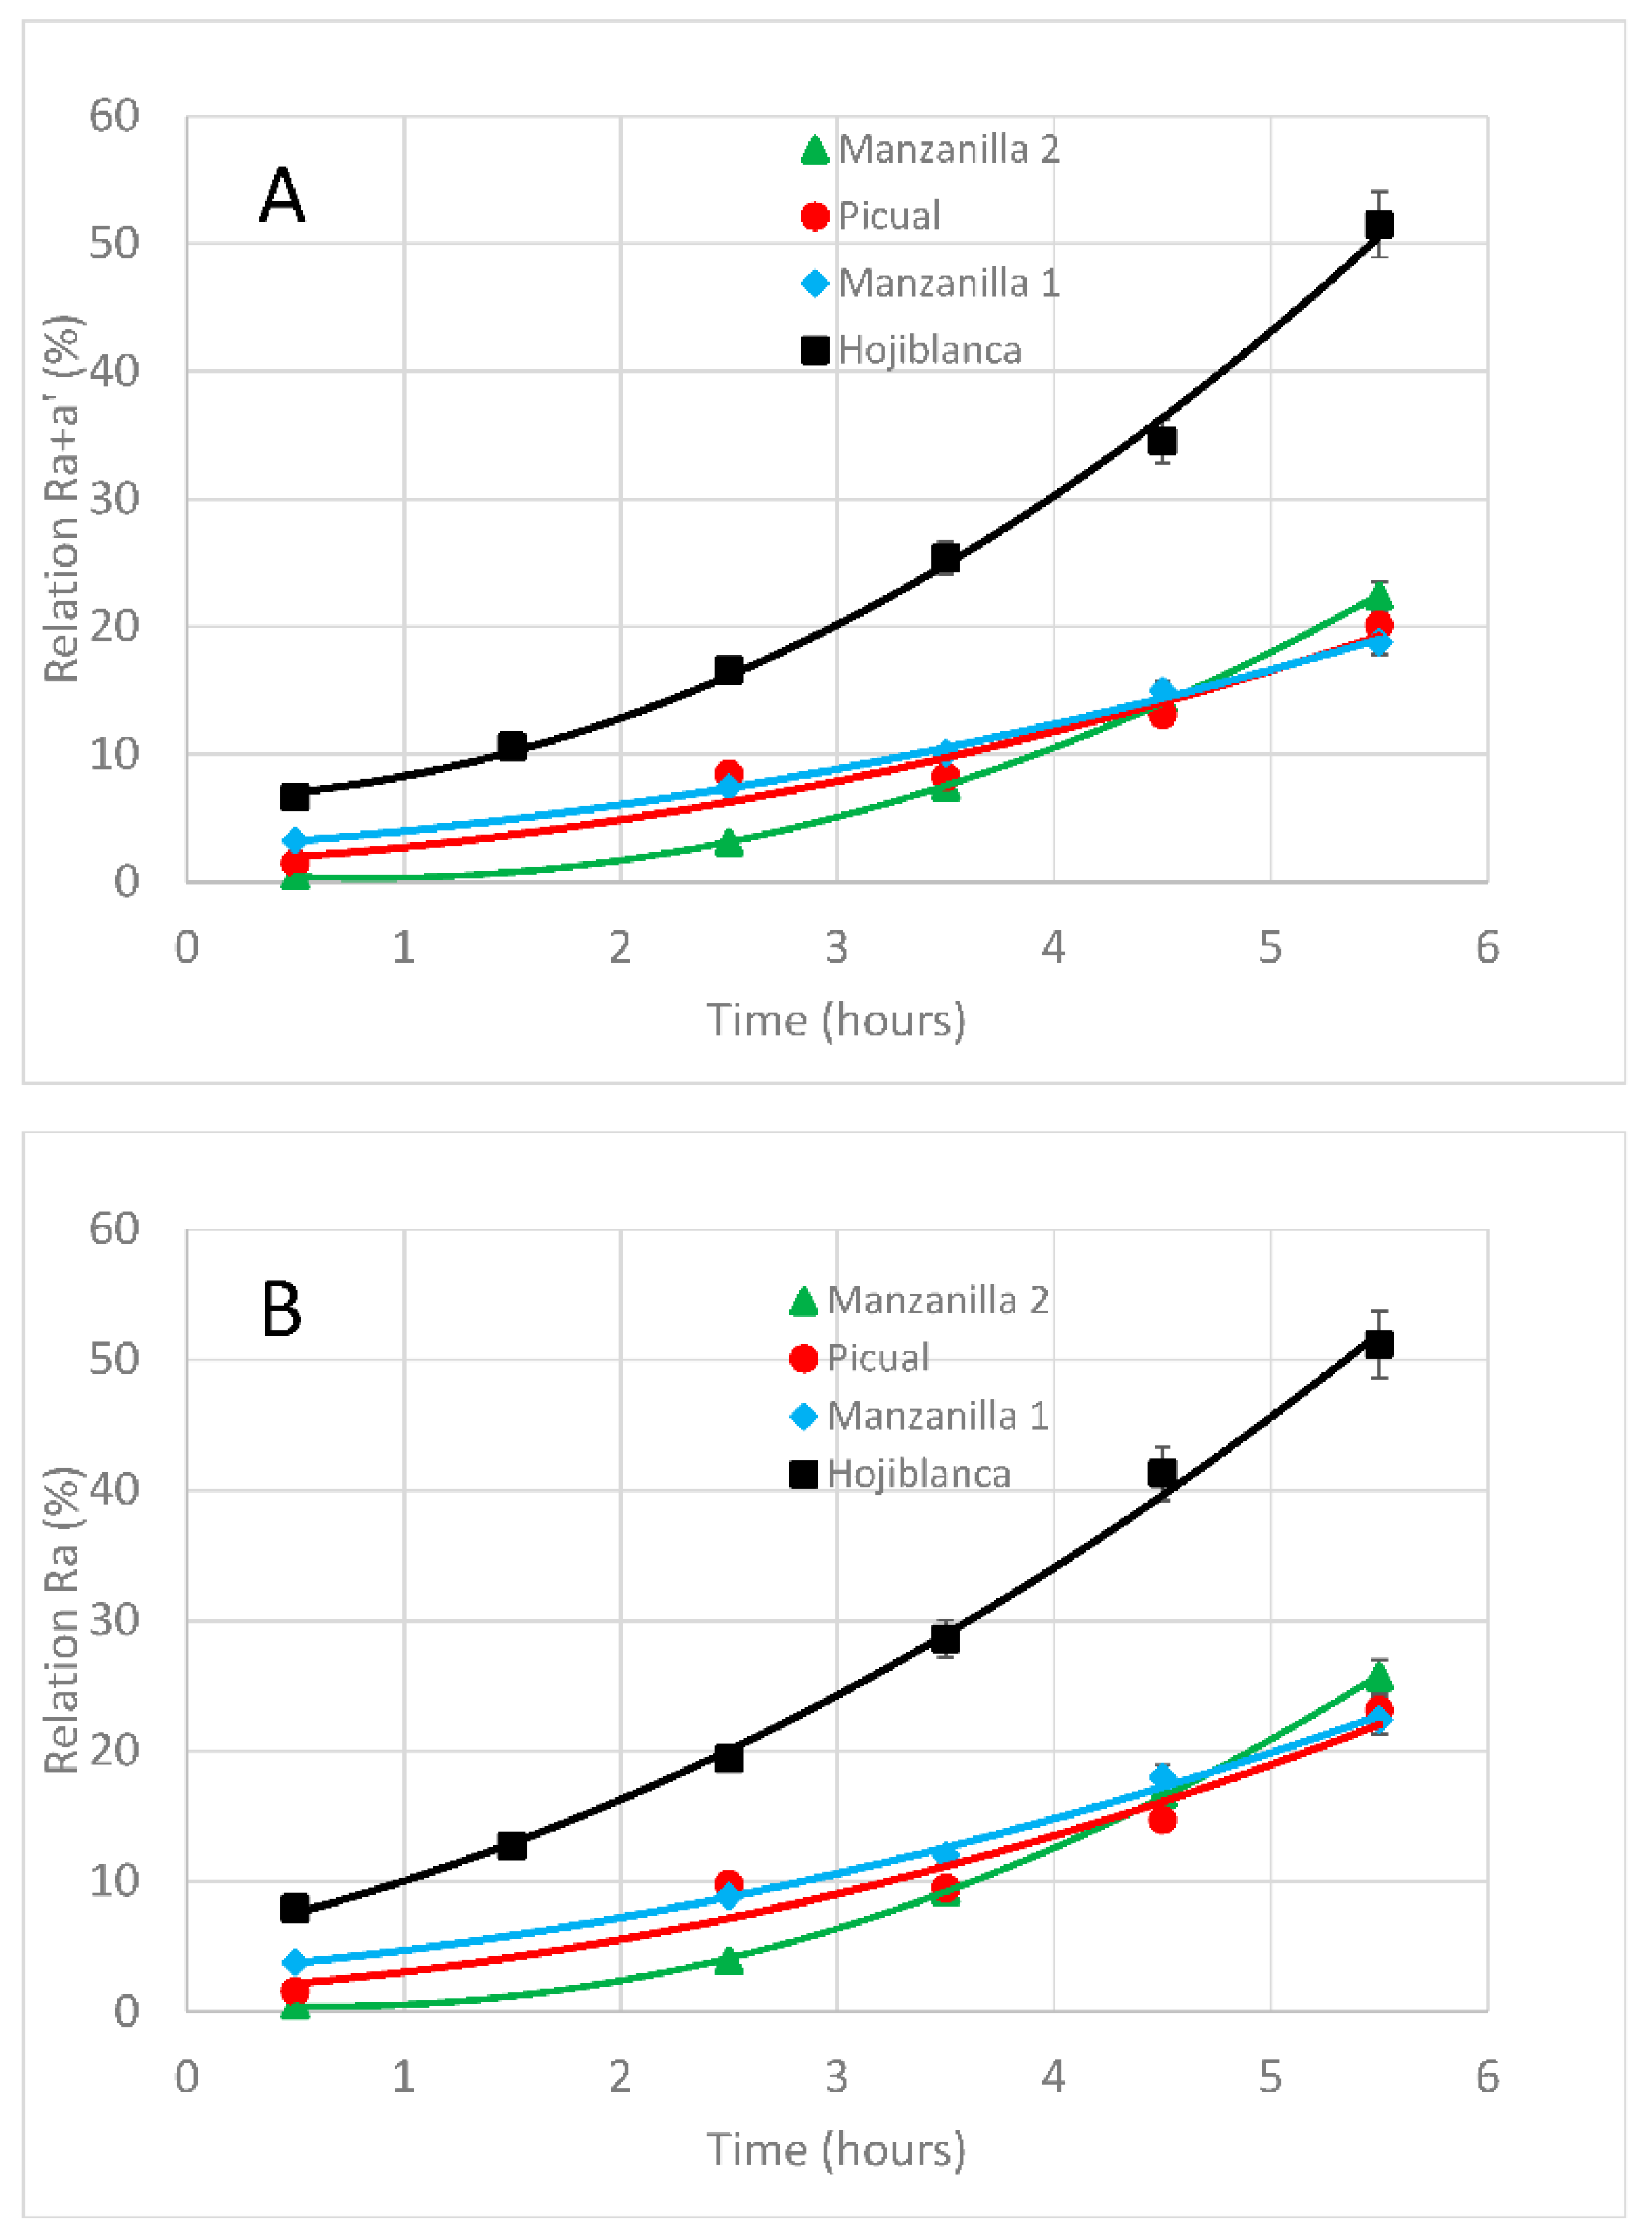
3.4.1. Effect of Deodorization Time

In order to consider the effect of the deodorization time, samples of monovarietal VOO hojiblanca, manzanilla, (manzanilla 1 and manzanilla 2) and picual were subjected to different deodorization timespans, at 98 °C, using N2 as a carrier gas (Table 1, Treatment #1), for which results are shown in Figure 2. Under such accelerated conditions, the rate of evolution per hour is around 50% for hojiblanca and 25% for the others cultivars, which is very high in comparison with the normal 5–6% evolution per year observed during non-accelerated conditions [39].
In all cases, there was a quick rise in phy a+a’ during the first hours of treatment, which slowed down later (Figure 2A). In the case of hojiblanca cultivar, the Ra+a’ relation reaches 17% after around 2.5 h, whereas in the cases of picual, manzanilla 1 and manzanilla 2, at least 4.5 h are needed to exceed the 17% threshold. Such a 17% limit is the one proposed by Australian and Californian regulatory bodies and corresponds to the minimum pyphy a content accepted for fresh EVOO [40,41]. Differences among cultivars (Table 3) may be due to the low initial pyphy a content, 0.70 mg/kg, in comparison with the phy a+a’ presence, 10.90 mg/kg, observed in hojiblanca, which in turn gives an already higher initial Ra+a’ in comparison to the others.
The evolution observed in our study agrees with that previously published according to which the parameters of 100 °C and 60 min were considered as the optima, since they allowed negative volatiles removal and low pyphy formation (11.83%) [21].
If the phy a’ content is not taken into account, that is, only Ra is calculated (Figure 2B), hojiblanca exceeds the 17% limit after around 1.5–2 h, whereas picual, manzanilla 1 and manzanilla 2 hold 4–4.5 h. It is then clear that the Ra relation may evidence the presence of soft deodorized oils in a better way than the Ra+a’ relation does, meaning that phy a and pyphy a would reveal as key compounds to detect this kind of practice.
In any case, the increase in the Ra+a’ and Ra relations is due to the phy a+a’ reduction and not so much to pyphy a formation. This may be due to the phy a+a’ destruction because of the effect of the deodorization conditions (98 °C), whereas pyphy a increases little after a certain time. We have to point out that we cannot expect an intensive phy a+a’ destruction to be translated in an intensive pyphy a formation, since the concentrations of such derivatives do not keep a lineal relationship. Actually, previous studies show how, after the thermal treatment of olive oils, the disappearance of phy a+a’ did not only correspond to the formation of pyphy a (and therefore to a lineal relationship) but also to that of other three products: 132OH-phy a, 151OH-lactone-phy a, and a colorless derivative [27], giving a more exact glimpse on the fate of phy a+a’.

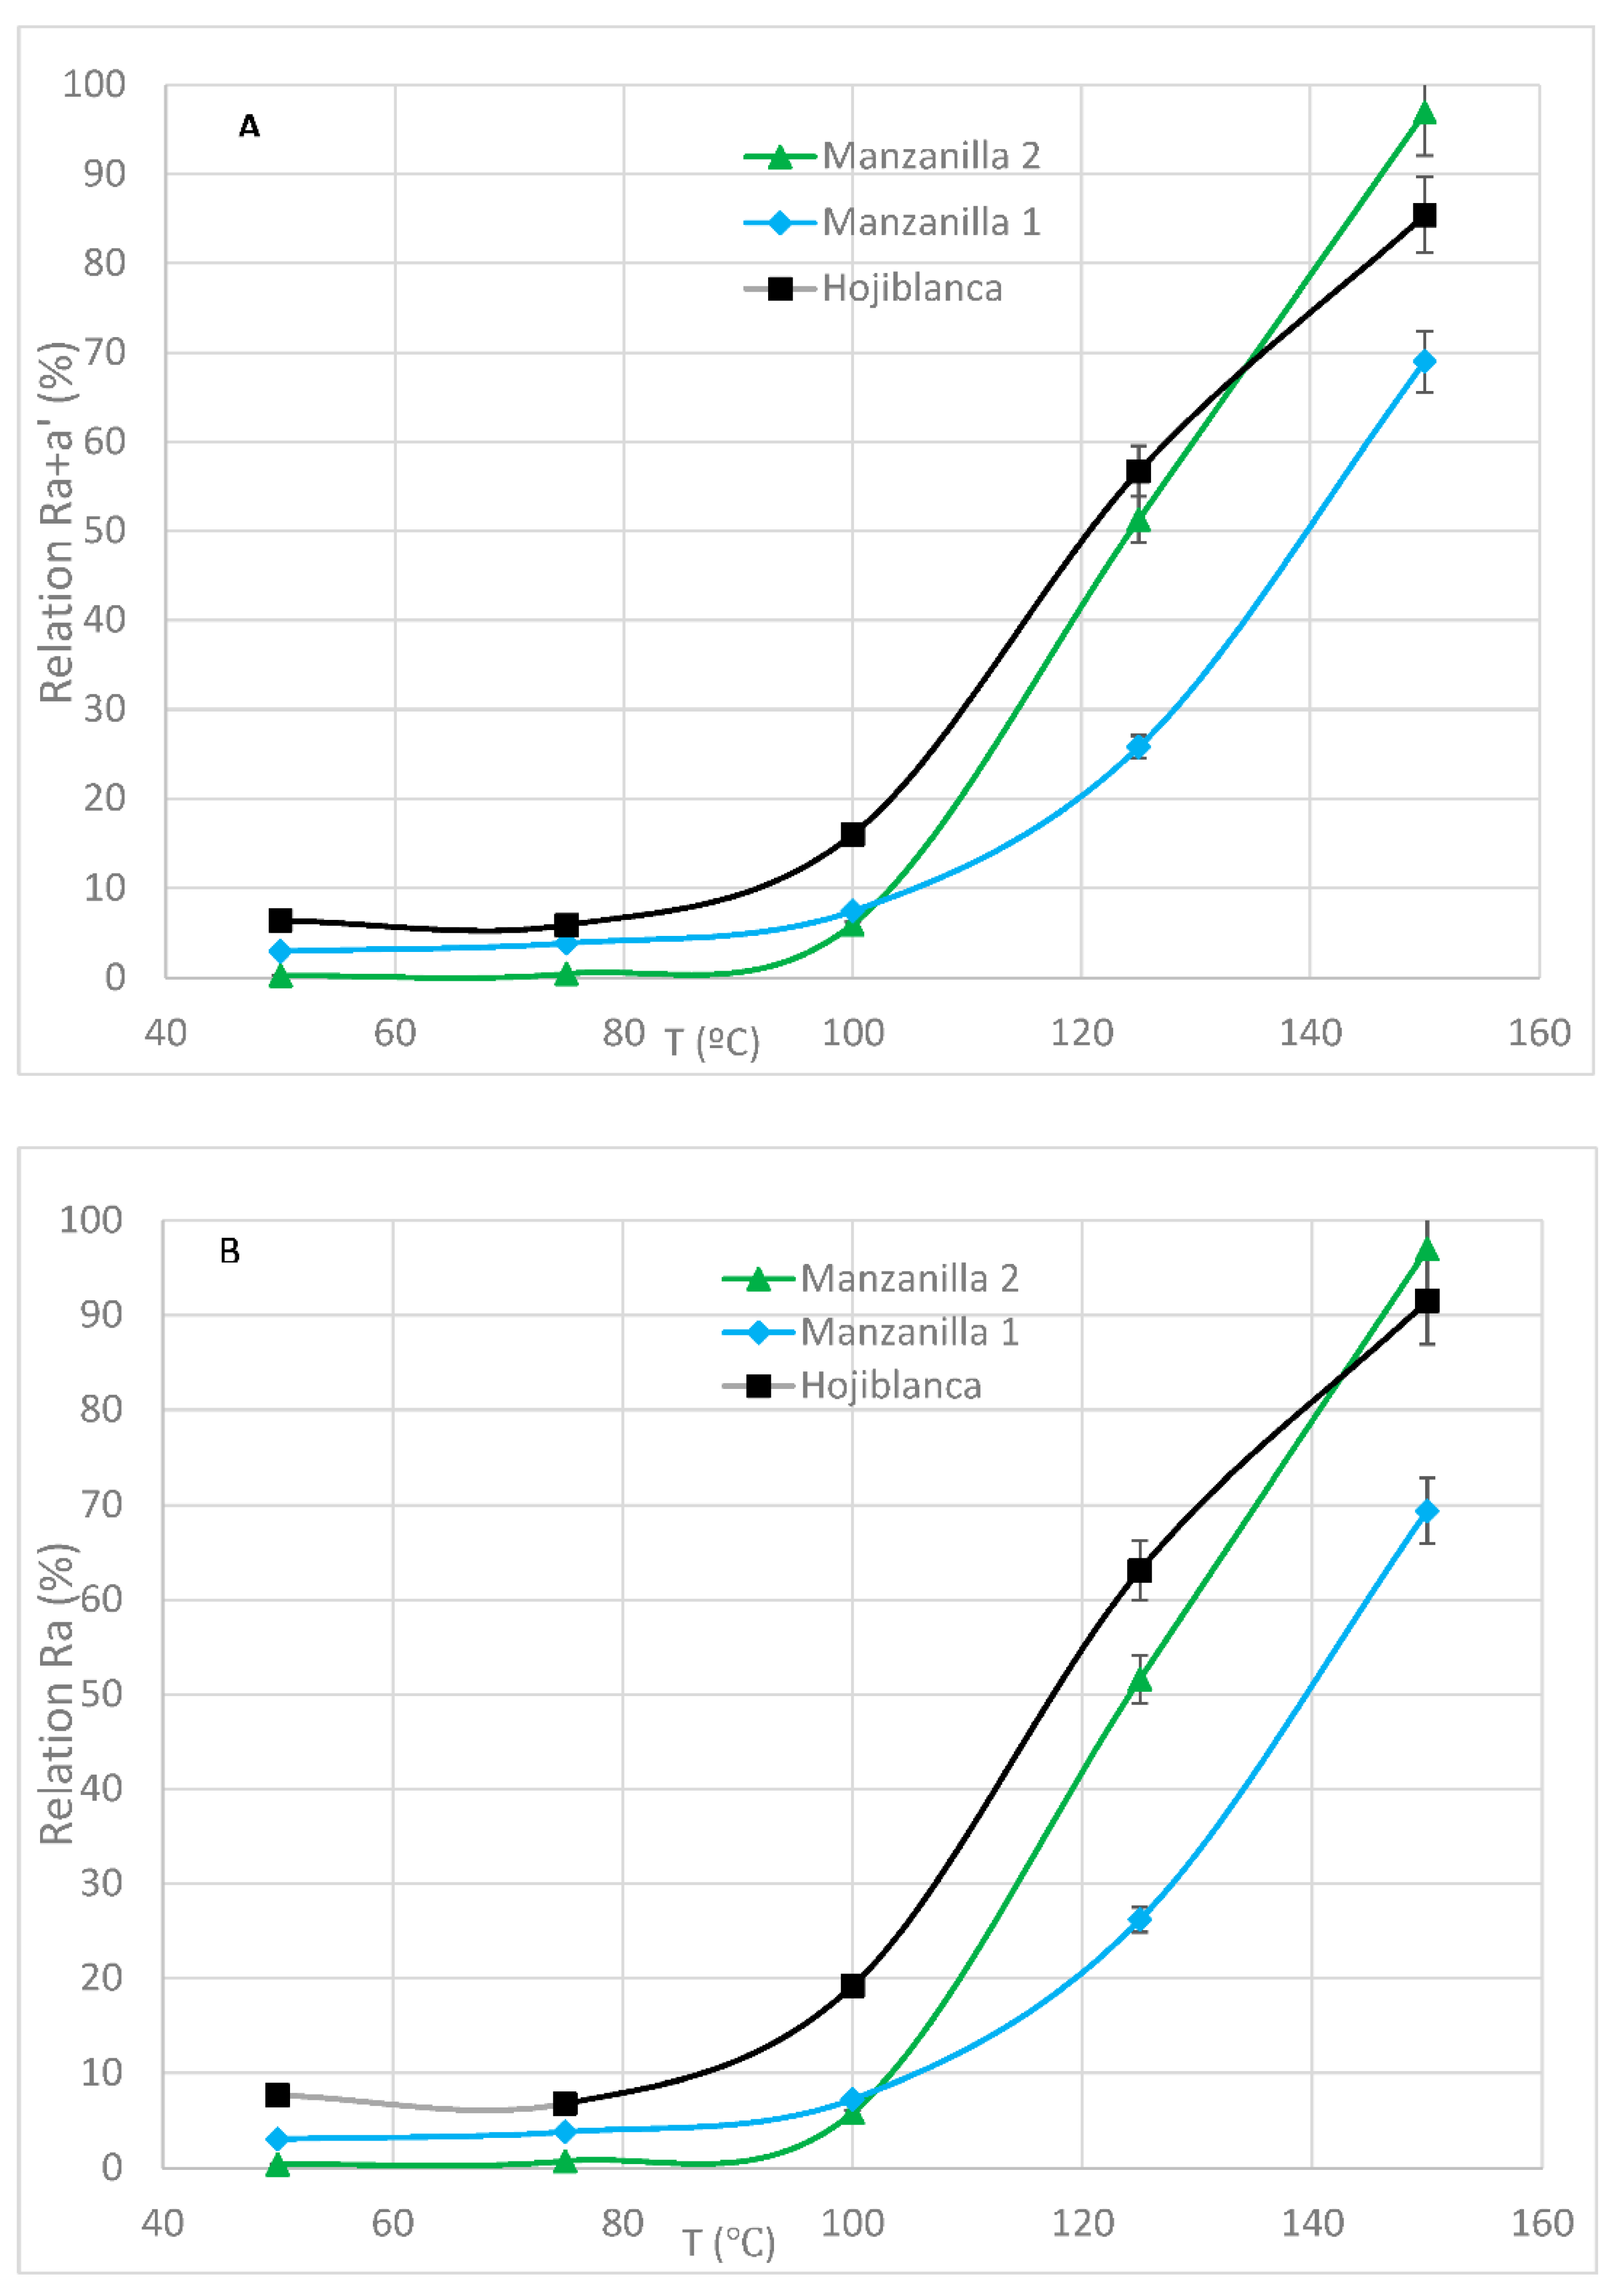
3.4.2. Effect of Deodorization Temperature

The effect of the deodorization temperature was studied with the monovarietal EVOO hojiblanca, manzanilla 1 and manzanilla 2. In this case, oils were subjected to two-hour length deodorizations at 50, 75, 100, 130, and 150 °C using N2 as a stripping gas (Table 1, Treatment #2).
Samples of hojiblanca and manzanilla 2 oils had relatively low initial concentrations of chlorophyll pigments (11.60 and 15.74 mg/kg, respectively), whereas, in the case of manzanilla 1, the pigment concentration was much higher (118.97 mg/kg).
The results are shown in Figure 3. When one compares the Ra+a’ and Ra relations between the three different samples, it is clear that the higher the initial pigment concentration, the higher the Ra+a’ and Ra increments. Besides, increases in temperature lead to increases in both Ra+a’ and Ra proportions, the latter being steeper than the former, meaning that not all phy a+a’ turn into pyphy a. Besides, it is clear that there is not a linear correlation with temperature and that at temperatures below 100 °C the formation of pyphy a takes place slowly, as has already been observed before [21], although we demonstrate that a two-hour deodorization versus a one-hour timespan, as stated earlier [21], has no effect on pyphy a formation, temperature being the key factor. From 100 °C on, pyphy a formation goes up notably.

3.4.3. Effect of Free Acidity

The study of the influence of the free acidity on the chlorophyll pigments during deodorization was carried out on samples of VOO from the picual variety. This parameter was chosen because of its relationship with the oil’s initial quality. Picual samples had 0.19% free acidity and were spiked with oleic acid in order to get aliquots with 2.0 and 5.0% free acidity. Samples were subjected to 2 to 5 h length deodorizations at 98 °C, using N2 as a stripping gas (Table 1, lines 11–13).
According to the data obtained, the higher the acidity, the higher the increase in the Ra and Ra+a’ relations, the effect being more pronounced when phy a’ is left aside (Figure 4), since in this case the 17% limit is reached after 1.25–2 h from the highest to the lowest acidity, instead of 1.5–2.25 h, respectively. Therefore, it is clear that high acidity enhances phy a+a’ losses and pyphy a formation. Furthermore, pyphy a formation is clearly bound to oil quality expressed over its free fatty acid content, which contrasts with that indicated in the literature, in which a prediction model focused on olive oil shelf life stated that even if pyphy a is strongly related with light exposure and storage temperature, it does not show any association with oil quality nor with its chemical composition [42].

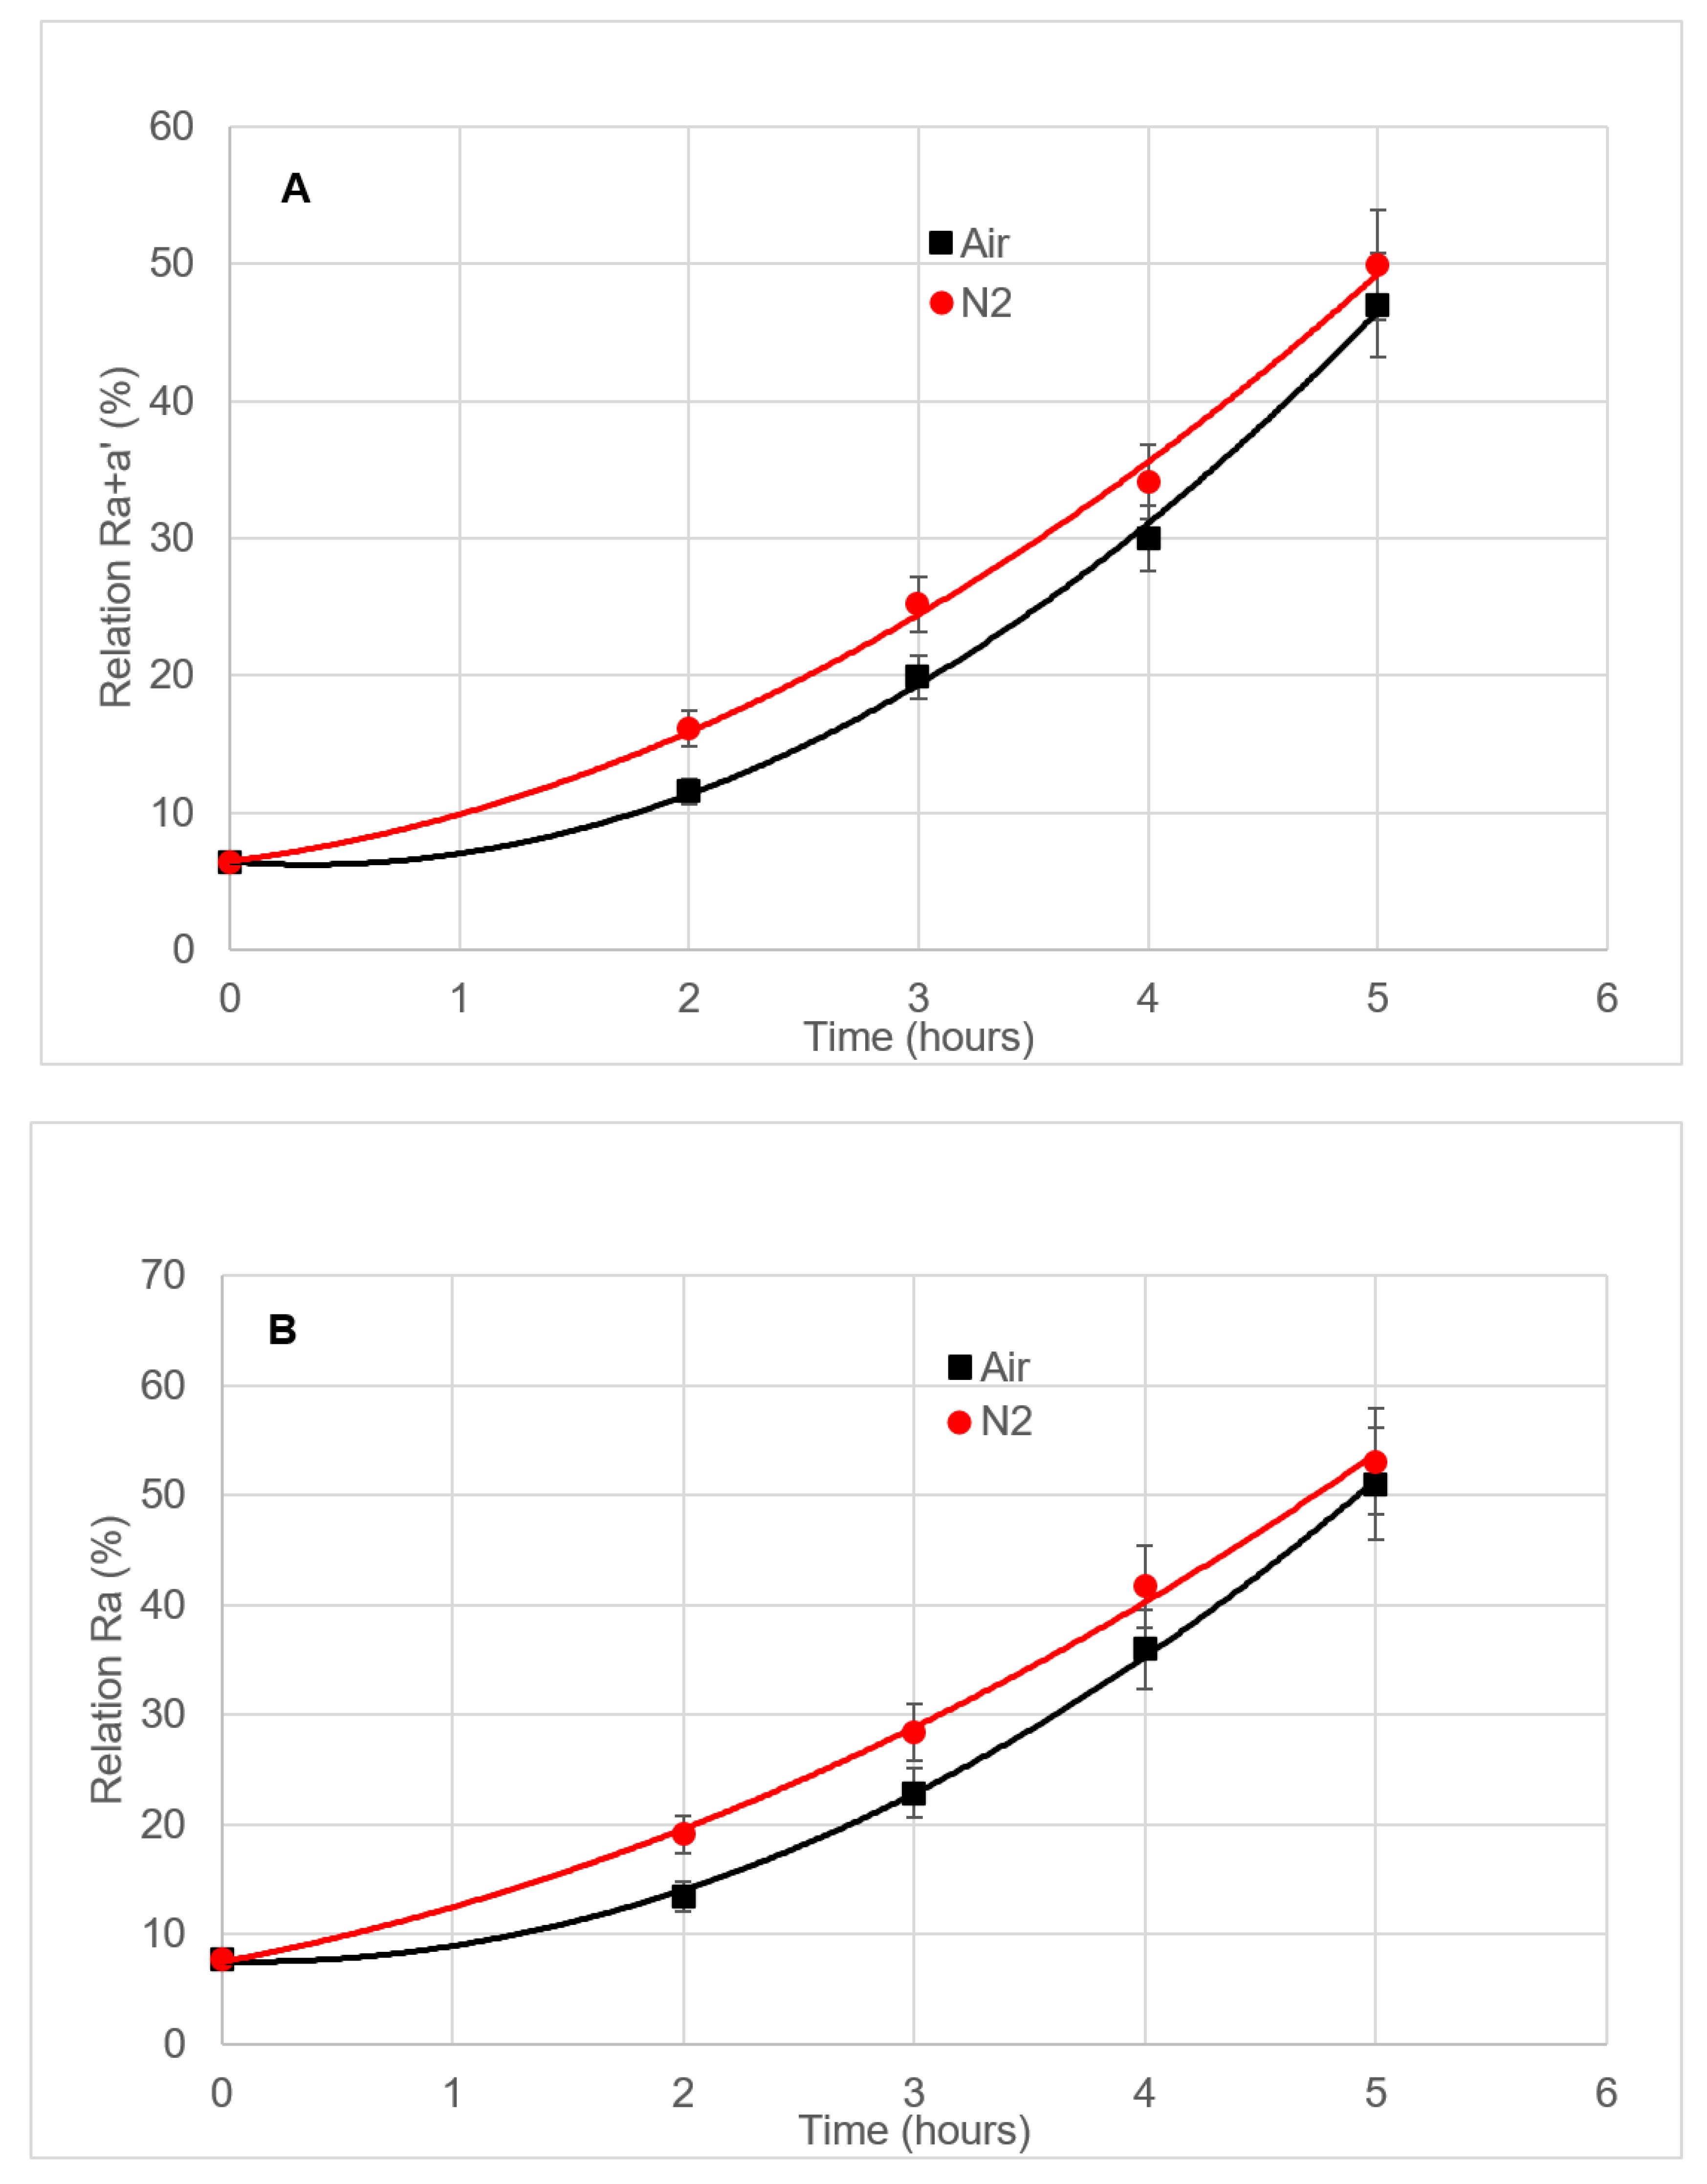
3.4.4. Effect of the Stripping Gas

The study of the influence of the carrier gas on the chlorophyll pigments was carried out on hojiblanca VOO. Those samples were subjected to 2 to 5 h length deodorizations at 98 °C, using either N2 or air as a stripping gas (Table 1, Treatment #3).
The results are shown in Figure 5. When N2 is utilized as a stripping gas, the Ra+a’ relation is around 4.6–5% higher than when air is chosen (Figure 5A), meaning that the 17% limit is exceeded after 2.0 h in the case of N2, and after 2.7 h if air is applied. After three hours, there is not a statistically significant difference on the Ra+a’ relation between both stripping gases. The same tendency is observed for the Ra relation, although the time to surpass the limit is 1.5 and 2.4 h, respectively (Figure 5B).

3.4.5. Effect of Neutralization Plus Soft Deodorization

Table 4 shows the results of applying neutralization, and neutralization followed by soft deodorization (3 h, 98 °C, N2 stripping gas), together with the initial pigment contents in the samples under study. VOO sample L-2 possesses the lowest amount; therefore, pyphy a is not formed in a substantial way. Consequently, Ra+a’ and Ra equal zero. After neutralizing VOO sample M-2, phy a+a’ and pyphy a content decrease minimally, which turns into an increase in Ra+a’ and Ra, although without substantial meaning. This is in the way round for sample H-2 but, as it may be expected, the subsequent deodorization resulted in phy a+a’ decrease and pyphy a increase, with the corresponding change in the Ra+a’ and Ra relations.
In no case the Ra+a’ and Ra relations exceed the 17% value established as a limit from which an oil may be suspected to be soft deodorized.

4. Conclusions

In this pilot study, we observed that changes in chlorophyll pigments, due to soft the deodorization process, depend on the temperature, the limit of which was 100 °C. Below such ceiling, the rate at which pyphy a is formed is lower than the rate at which phy a+a’ disappear. This indicates that, besides pyphy a formation, there exist parallel processes through which other non-detected compounds are formed. As a consequence, the Ra+a’ and Ra relations are considered to be more directly linked to phy a+a’ decrease than to pyphy a formation.
Stripping gas slightly affects the transformation of chlorophyll pigments; in fact, N2 enhances the increment in the Ra+a’ and Ra relations.
Acidity also boosts the increment in the Ra+a’ and Ra relations.
Regarding the oil nature, the higher the initial phy a+a’ content, the higher the increase in the Ra+a’ and Ra relations. If the initial phy a+a’ presence is too low, the value of the Ra+a’ and Ra relations will be zero.
Finally, we are sensitive to the fact that the number of samples under study was too limited to draw definite conclusions, yet it is our intention through this approach to offer a new insight in the detection of the soft deodorization oils in virgin olive oils. Indeed we will continue developing this line of research to answer open questions such as the fate of phy (a+a’) or the actual influence of the cultivar on the chlorophyll profiles.

Author Contributions

Conceptualization R.B.G.-C. and M.A.; investigation M.A.; methodology M.A.; writing-original draft R.B.G.-C.; writing-review & editing R.B.G.-C., W.M., M.d.C.P.-C.; project administration & supervision W.M., M.d.C.P.-C. All authors have read and agreed to the published version of the manuscript.

Funding

This research received no external funding.

Conflicts of Interest

The authors have declared no conflict of interest.

References

  1. International Olive Council. Trade Standard Applying to Olive Oils and Olive Pomace Oils; COI/T. 15/NC No 3/Rev. 12; International Olive Council: Madrid, Spain, 2018; pp. 1–17. [Google Scholar]
  2. European Council Regulation. Regulation No 136/66/EEC of 22 September 1966 on the establishment of a common organization of the market in oils and fats. Off. J. Eur. Commun. 1966, 66, 1–11. [Google Scholar]
  3. European Commission Regulation. Commission Implementing Regulation (EU) 2019/1604 of 27 September 2019 amending Regulation (EEC) No 2568/91 on the characteristics of olive oil and olive-residue oil and on the relevant methods of analysis. Off. J. Eur. Commun. 2019, 14, 1. [Google Scholar]
  4. European Commission Regulation. Commission Implementing Regulation (EU) No 29/2012 of 13 January 2012 on marketing standards for olive oil, and successive amendments. Off. J. Eur. Commun. 2012, 12, 14. [Google Scholar]
  5. Frankel, E.N. Chemistry of extra virgin olive oil: Adulteration, oxidative stability, and antioxidants. J. Agric. Food Chem. 2010, 58, 5991–6006. [Google Scholar] [CrossRef] [PubMed]
  6. Gómez-Coca, R.B.; Pérez-Camino, M.C.; Martínez-Rivas, J.M.; Bendini, A.; Gallina-Toschi, T.; Moreda, W. Olive oil mixtures. Part one: Decisional trees or how to verify the olive oil percentage in declared blends. Food Chem. 2020, 315, 126235. [Google Scholar] [CrossRef] [PubMed]
  7. International Olive Council. Determination of the Difference Between Actual and Theoretical Content of Triacylglycerols with ECN 42; COI/T.20/Doc. No 20/Rev. 4; International Olive Council: Madrid, Spain, 2017; pp. 1–22. [Google Scholar]
  8. Cert, A.; Moreda, W. Algorithms for detection of hazelnut oil in olive oil. Grasas Aceit. 2000, 51, 143–149. [Google Scholar] [CrossRef] [Green Version]
  9. Azarmad-Darmichi, S.; Dutta, P.C. Novel solid-phase extraction method to separate 4-desmethyl-, 4-monomethyl- and 4,4-dimethylsterols in vegetable oils. J. Chromatogr. A 2006, 1108, 183–187. [Google Scholar] [CrossRef]
  10. Azarmad-Darmichi, S.; Dutta, P.C. Free and sterified 4,4-dimethylsterols in hazelnut oil and their retention during refining processes. J. Am. Oil Chem. Soc. 2007, 84, 297–304. [Google Scholar] [CrossRef]
  11. Boskou, D. Olive oil. In Vegetable Oils in Food Technology. Composition, Properties and Uses, 2nd ed.; Gunstone, F.D., Ed.; Wiley-Blackwell: Hoboken, NJ, USA, 2010; pp. 243–272. [Google Scholar]
  12. International Olive Council. Determination of Waxes, Fatty Acid Methyl Esters and Fatty Acid Ethyl Esters by Capillary Column Gas Chromatography; COI/T.20/Doc. No 28/Rev. 2; International Olive Council: Madrid, Spain, 2017; pp. 1–19. [Google Scholar]
  13. International Olive Council. Determination of the Sterol Composition and Content and Aliphatic Alcoholic Compounds by Capillary Gas Chromatography; COI/T.20/Doc. No 26/Rev. 4; International Olive Council: Madrid, Spain, 2018; pp. 1–31. [Google Scholar]
  14. Ranalli, A.; Ferrante, M.L.; De Mattia, G.; Constantini, N. Analytical evaluation of virgin olive oil of first and second extraction. J. Agric. Food Chem. 1999, 47, 417–424. [Google Scholar] [CrossRef]
  15. Pérez-Camino, M.C.; Cert, A.; Romero-Segura, A.; Cert-Trujillo, R.; Moreda, W. Alkyl esters of fatty acids a useful tool to detect soft deodorized olive oils. J. Agric. Food Chem. 2008, 56, 6740–6744. [Google Scholar] [CrossRef]
  16. Lanzón, A.; Cert, A.; Albi, T. Detección de la presencia de aceite de olive refinado en aceite de olive virgen. Grasas Aceit. 1989, 40, 385–388. [Google Scholar]
  17. Cert, A.; Lanzón, A.; Carelli, A.A.; Albi, T. Formation of stifmasta-3,5-diene in vegetable oils. Food Chem. 1994, 49, 287–293. [Google Scholar] [CrossRef]
  18. Serra Bonveh, J.; Soliva Torrent, M.; Ventura Coll, F. A laboratory study of the bleaching process in stigmasta-3,5-diene concentration in olive oils. J. Am. Oil Chem. Soc. 2001, 78, 305–310. [Google Scholar] [CrossRef]
  19. Gertz, C.; Klostermann, S. A new analytical procedure to differentiate virgin or non-refined from refined vegetable fats and oils. Eur. J. Lipid Sci. Technol. 2000, 102, 329–336. [Google Scholar] [CrossRef]
  20. Gómez-Coca, R.B.; Pérez-Camino, M.C.; Bendini, A.; Gallina-Toschi, T.; Moreda, W. Olive oil mixtures. Part two: Detection of soft deodorized oil in extra virgin olive oil through diacylglycerol determination. Relationship with free acidity. Food Chem. 2020, 330, 127226. [Google Scholar] [CrossRef]
  21. Aparicio-Ruiz, R.; Romero, I.; García-González, D.L.; Oliver-Pozo, C.; Aparicio, R. Soft-deodorization of virgin olive oil: Study of the changes of quality and chemical composition. Food Chem. 2017, 220, 42–50. [Google Scholar] [CrossRef]
  22. Bendini, A.; Cerretani, L.; Valli, E.; Lercker, G.; Mazzini, C. Application of analytical methods to determine mildly deodorized olive oils in commercial extra virgin olive oils. Ind. Alim. Italy 2009, 48, 46–51. [Google Scholar]
  23. Gómez-Coca, R.B.; Moreda, W.; Pérez-Camino, M.C. Fatty acid alkyl esters in olive oil vs. organoleptic assessment. Food Chem. 2012, 135, 1205–1209. [Google Scholar] [CrossRef]
  24. Bendini, A.; Valli, E.; Cerretani, L.; Chiavaro, E.; Lercker, G. Study on the effects of heating of virgin olive oil blended with mildly deodorized olive oil: Focus on the hydrolytic and oxidative state. J. Agric. Food Chem. 2009, 57, 10055–10062. [Google Scholar] [CrossRef]
  25. Mínguez-Mosquera, M.I.; Garrido-Fernández, J. Chlorophyll and carotenoid presence in olive fruit (Olea europaea). J. Agric. Food Chem. 1989, 37, 1–7. [Google Scholar] [CrossRef]
  26. Mínguez-Mosquera, M.I.; Gandul-Rojas, B.; Garrido-Fernández, J.; Gallardo-Guerrero, L. Pigments present in virgin olive oil. J. Am. Oil Chem. Soc. 1990, 67, 192–196. [Google Scholar] [CrossRef]
  27. Aparicio-Ruiz, R.; Mínguez-Mosquera, M.I.; Gandul-Rojas, B. Thermal degradation kinetics of chlorophyll pigments in virgin olive oils. 1. Compounds of series a. J. Agric. Food Chem. 2010, 58, 6200–6208. [Google Scholar] [CrossRef] [PubMed]
  28. Serani, A.; Piacenti, D. Sistema analitico per l’identificazione di oli deodorati in oli vergini di olive. Nota 1—Analisi dei pigmenti clorofilliani in oli vergini di oliva. Riv. Ital. Sostanze Grasse 2001, 78, 459–463. [Google Scholar]
  29. Gertz, C.; Fiebig, H.J. Pyropheophytin a—Determination of thermal degradation products of chlorophyll a in virgin olive oil. Eur. J. Lipid Sci. Technol. 2006, 108, 1062–1065. [Google Scholar] [CrossRef]
  30. Hornero-Méndez, D.; Gandul-Rojas, B.; Mínguez-Mosquera, M.I. Routine and sensitive SPE-HPLC method for quantitative determination of pheophytin a and pyropheophytin a in olive oils. Food Res. Int. 2005, 38, 1067–1072. [Google Scholar] [CrossRef]
  31. Li, X.; Woodman, M.; Wang, S.C. High-performance liquid chromatography with fluorescence detection for the rapid analysis of pheophytins and pyropheophytins in virgin olive oil. J. Sep Sci. 2015, 38, 2813–2818. [Google Scholar] [CrossRef]
  32. International Organization for Standardization. Animal and Vegetable Fats and Oils—Determination of the Degradation Products of Chlorophylls A (Phepophytins and Pyropheophytins); ISO/DIS 29841; International Organization for Standardization: Geneva, Switzerland, 2008; pp. 1–10. [Google Scholar]
  33. German Society for Fat Science. Determination of Pyropheophytin A in Olive Oil; Draft 4.10.2005; German Society for Fat Science: Berlin, Germany, 2005. [Google Scholar]
  34. International Union of Pure and Applied Chemistry. Nomenclature in evaluation of analytical methods including detection and quantification capabilities. Pure Appl. Chem. 1995, 67, 1699–1723. [Google Scholar] [CrossRef]
  35. International Organization for Standardization. Precision of test methods. Determination of repeatability and reproducibility of a standard test method by inter-laboratory tests. ISO 1986, 5725, 1–49. [Google Scholar]
  36. Association of Official Agricultural Chemists. Collaborative study guideline. J. Assoc. Off. Anal. Chem. Int. 1995, 78, 143A–160A. [Google Scholar]
  37. International Olive Council. Determination of Free Fatty Acids, Cold Method; COI/T.20/Doc. No 34/Rev. 1; International Olive Council: Madrid, Spain, 2007; pp. 1–4. [Google Scholar]
  38. Giuffrida, D.; Salvo, F.; Salvo, A.; Cossignani, L.; Dugo, G. Pigments profile in monovarietal virgin olive oils from various Italian olive varieties. Food Chem. 2011, 124, 1119–1123. [Google Scholar] [CrossRef]
  39. Guillaume, C.; Gertz, C.; Ravetti, L. Pyropheophytin a and 1,2-diacyl-glycerols over time under different storage conditions in natural olive oils. J. Am. Oil Chem. Soc. 2014, 91, 697–709. [Google Scholar] [CrossRef]
  40. Standards Australia. AS5264-2011: Olive Oils and Olive-Pomace Oils; Committee FT-034; Standards Australia: Sydney, Australia, 2011. [Google Scholar]
  41. California Department of Food and Agriculture. Grade and Labelling Standards for Olive Oil, Refined-Olive Oil and Olive-Pomace Oil; California Department of Food and Agriculture: Fresno, CA, USA, 2014.
  42. Guillaume, C.; Ravetti, L. Shelf-life prediction of extra virgin olive oils using an empirical model based on standard quality tests. J. Chem. 2016, 2016, 1–7. [Google Scholar] [CrossRef] [Green Version]
Figure 1. High-performance liquid chromatography (HPLC) chromatogram of the chlorophyll pigments of a soft deodorized olive oil cv. hojiblanca. From left to right, they correspond to pheophytin b, pheophytin b’, pheophytin a, pheophytin a’, and pyropheophytin a.
Foods 09 00978 g001
Figure 2. (A) Ra+a’ relation vs. soft deodorization time and (B): Ra relation vs. soft deodorization time, in VOO samples from hojiblanca (squares), picual (dots) and manzanilla (triangles) cultivars. The soft deodorization process was carried out at 98 °C using N2 as a stripping gas. Each value corresponds to the average of two individual pieces of data.
Foods 09 00978 g002
Figure 3. (A): Ra+a’ relation vs. soft deodorization temperature and (B): Ra relation vs. soft deodorization temperature, in VOO samples from manzanilla and hojiblanca cultivars. The soft deodorization process lasted two hours. N2 was used as a stripping gas. Each value corresponds to the average of two individual pieces of data.
Foods 09 00978 g003
Figure 4. (A): Ra+a’ relation vs. soft deodorization time and (B): Ra relation vs. soft deodorization length, in VOO samples from the picual cultivar of different free acidity values (5, 2 and 0.19%, from top to bottom). The soft deodorization processes were carried out at 98 °C with N2 as a stripping gas. Each value corresponds to the average of two individual pieces of data.
Foods 09 00978 g004
Figure 5. (A): Ra+a’ relation vs. deodorization length and (B): Ra relation vs. deodorization length, in VOO samples from the hojiblanca cultivar. The deodorization process was carried out at 98 °C. Either N2 or air was used as a carrier gas. Each value corresponds to the average of two individual pieces of data.
Foods 09 00978 g005
Table 1. Oil sample varieties and soft deodorization conditions. Each treatment was done in duplicate.
Olive Oil VarietyTreatmentDeodorization Conditions
Time (h)Temperature (°C)Gas
HojiblancaTreatment #10.5, 1.5, 2.5, 3.5, 4.5, 5.598N2
Treatment #2250, 75, 100, 130, 150N2
Treatment #32, 3, 4, 598Air/N2
Manzanilla 1Treatment #10.5, 2.5, 3.5, 4.5, 5.598N2
Treatment #2250, 75, 100, 130, 150N2
Manzanilla 2Treatment #10.5, 2.5, 3.5, 4.5, 5.598N2
Treatment #2250, 75, 100, 130, 150N2
PicualTreatment #10.5, 2.5, 3.5, 4.5, 5.598N2
0.19% free acidity2, 3, 4, 598N2
2% free acidity2, 3, 4, 598N2
5% free acidity2, 3, 4, 598N2
Table 2. Statistical parameters for pheophytin (a+a’), pyropheophytin a, and Ra+a’ determinations in three different virgin olive oil (VOO) samples: L-1, M-1 and H-1 with low, medium and high chlorophyll concentration, respectively.
ParametersVOO Samples
L-1M-1H-1
Pheophytin (a+a’)
Mean (mg/kg)11.620.941.5
Sr0.770.180.14
r2.150.520.40
RSDr, % (n = 3)6.590.890.34
CI (0.05)0.870.210.16
Pyropheophytin a
Mean (mg/kg)0.10.92.0
Sr0.010.040.05
r0.030.110.15
RSDr, % (n = 3)104.442.50
CI (0.05)0.010.050.06
Ra+a’
Mean (%)1.13.94.6
Sr0.020.180.12
r0.040.500.32
RSDr, % (n = 3)1.824.622.61
CI (0.05)0.020.200.13
n: number of replicates; Sr: Standard deviation of the repeatability = ( x x ¯ ) 2 ( n 1 ) ; RSDr, %: Relative standard deviation of the repeatability = 100 × Sr/mean; r: repeatability = 2.8√Sr2; CI: Confidence Interval (95%). Each value corresponds to the average of three individual data.
Table 3. Chlorophyll pigments (mg/kg) originally present in the olive oil samples under study together with Ra+a’ and Ra (%).
Olive Oil VarietyPhy aPhy a’Pyphy aRa+aRa
Hojiblanca8.742.160.706.127.52
Manzanilla 1102.4813.053.442.903.26
Manzanilla 214.361.380.000.030.04
Picual10.7110.222.080.920.97
phy a: pheophytin a, phy a’: pheophytin a’ and pyphy a: pyropheophytin a. Each value corresponds to the average of two individual pieces of data.
Table 4. Chlorophyll derivative concentrations (mg/kg) present in olive oil samples with low (L-2), medium (M-2) and high (H-2) pigment contents after different treatments: neutralization, filtration, and soft deodorization under N2, at 98 °C, for 3 h. Ra+a’ and Ra (both in %) are also given.
SampleTreatmentphy aphy a’pyphy aRa+a’Ra
L-2Initial2.530.070.000.000.00
Neutralization2.490.500.000.000.00
Neutralization + soft deodorization1.380.400.000.000.00
M-2Initial16.521.660.583.093.39 a
Neutralization12.652.360.462.973.51 a
Neutralization + soft deodorization11.752.670.785.136.22 b
H-2Initial36.304.071.222.933.25 a
Neutralization34.927.721.413.203.88 a
Neutralization + soft deodorization17.943.852.239.2811.06 c
phy a: pheophytin a; phy a’: pheophytin a’ and pyphy a: pyropheophytin a. Each value corresponds to the average of two individual pieces of data. a, b, cEqual letters indicate that differences are not statistically significant.

