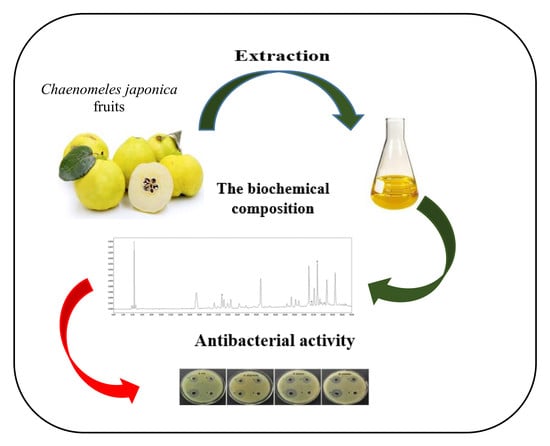
Japanese Quince (Chaenomeles japonica) as a Potential Source of Phenols: Optimization of the Extraction Parameters and Assessment of Antiradical and Antimicrobial Activities

 ,
, 
 ,
, 
Abstract
1. Introduction
2. Materials and Methods
2.1. Plant Material
2.2. Maceration Extraction Method
2.3. Ultrasound Extraction Method and Experimental Design
2.4. Determination of Total Phenolic Content
2.5. Determination of Total Proanthocyanidins Content
2.6. Antiradical Activity
2.7. Determination of Ascorbic Acid (Vitamin C) Content
2.8. Determination of Total Fibre Content
2.9. High Performance Liquid Chromatography (HPLC) Method for the Determination of Phenolic Compounds
2.10. Preparation of Extracts for Antibacterial Testing
2.11. Antimicrobial Activity Assay
2.12. The Statistical Methods
3. Results and Discussion
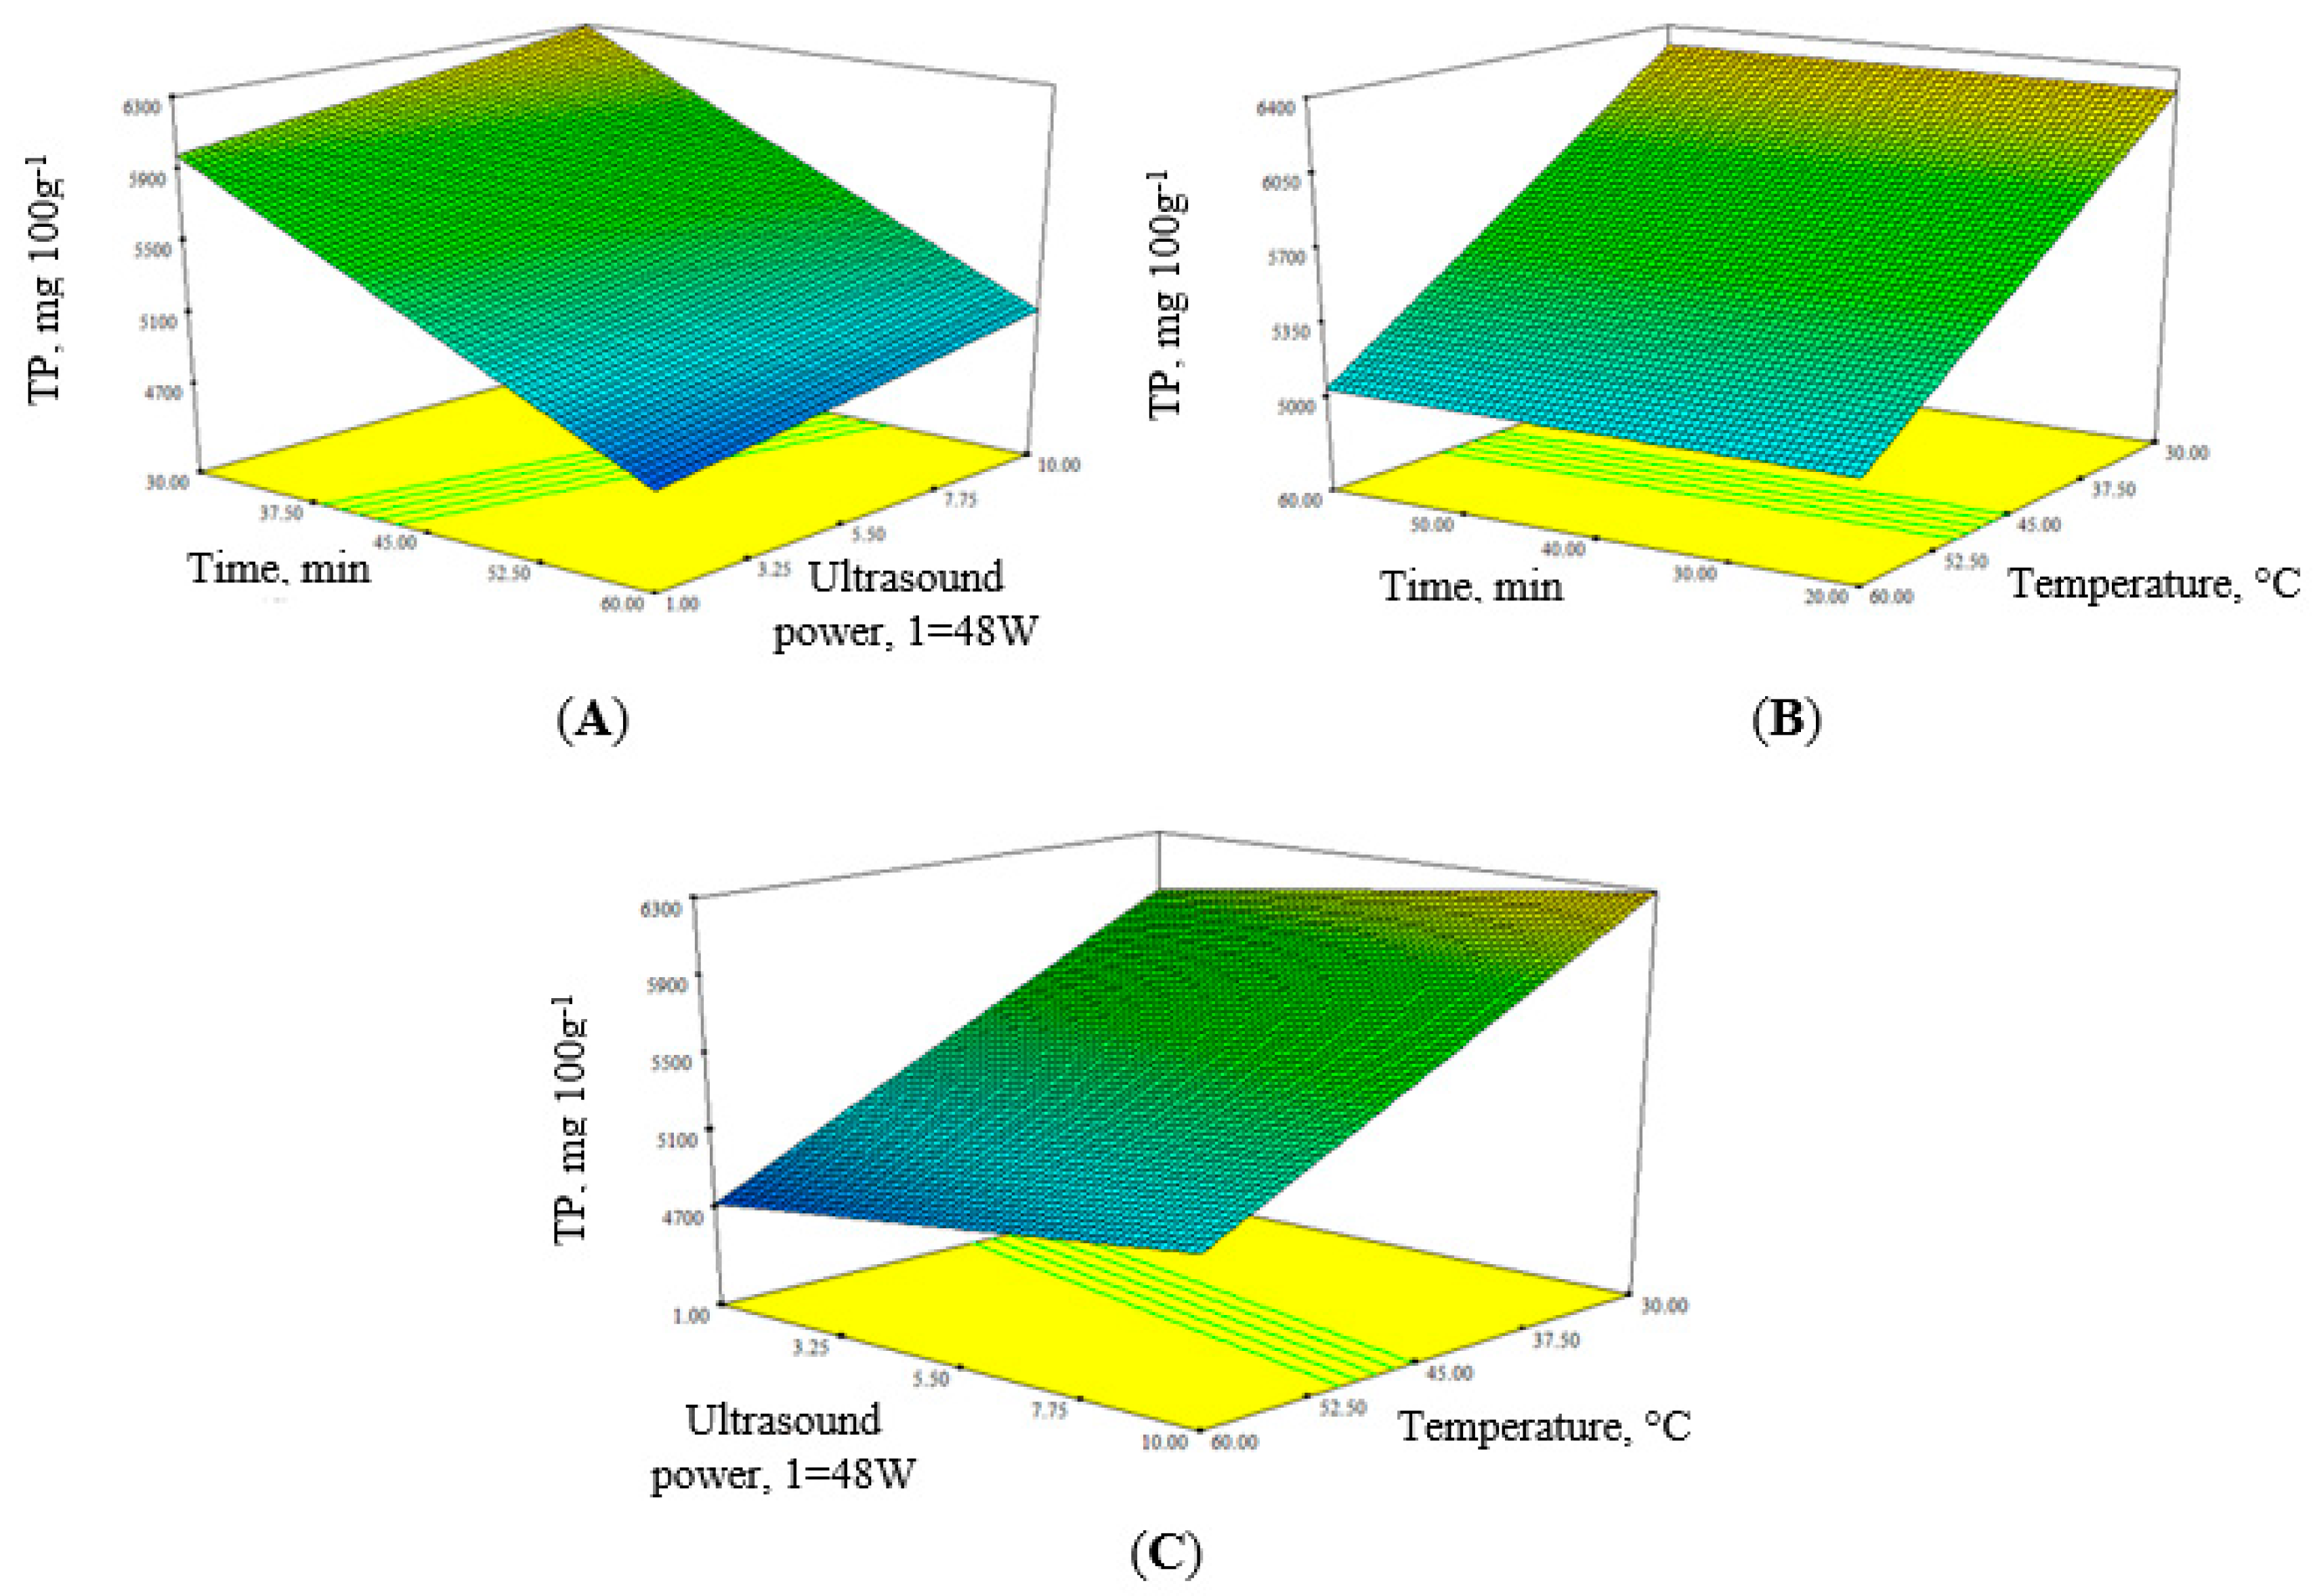
3.1. Selection of Extraction Parameters
3.2. Biochemical Composition and Antiradical Activity of Japanese Quince Fruit Extracts
3.3. Antibacterial Activity
4. Conclusions
Author Contributions
Funding
Conflicts of Interest
References
- Bieniasz, M.; Dziedzic, E.; Kaczmarczyk, E. The effect of storage and processing on vitamin C content in Japanese quince fruit. Folia Hortic. 2017, 29, 83–93. [Google Scholar] [CrossRef]
- Hummer, K.E.; Janick, J. Rosaceae: Taxonomy, economic importance, genomics. In Genetics and Genomics of Rosaceae; Springer: New York, NY, USA, 2009; pp. 1–17. [Google Scholar]
- Strugała, P.; Cyboran-Mikołajczyk, S.; Dudra, A.; Mizgier, P.; Kucharska, A.Z.; Olejniczak, T.; Gabrielska, J. Biological Activity of Japanese quince Extract and Its Interactions with Lipids, Erythrocyte Membrane, and Human Albumin. J. Membr. Biol. 2016, 249, 393–410. [Google Scholar] [CrossRef] [PubMed]
- Gorlach, S.; Wagner, W.; Podsędek, A.; Szewczyk, K.; Koziołkiewicz, M.; Dastych, J. Procyanidins from Japanese quince (Chaenomeles japonica) fruit induce apoptosis in human colon cancer Caco-2 cells in a degree of polymerization-dependent manner. Nutr. Cancer 2011, 63, 1348–1360. [Google Scholar] [CrossRef] [PubMed]
- Lewandowska, U.; Szewczyk, K.; Owczarek, K.; Hrabec, Z.; Podsędek, A.; Koziołkiewicz, M.; Hrabec, E. Flavanols from Japanese quince (Chaenomeles japonica) fruit inhibit human prostate and breast cancer cell line invasiveness and cause favorable changes in Bax/Bcl-2 mRNA ratio. Nutr. Cancer 2013, 65, 273–285. [Google Scholar] [CrossRef] [PubMed]
- Owczarek, K.; Hrabec, E.; Fichna, J.; Sosnowska, D.; Koziołkiewicz, M.; Szymański, J.; Lewandowska, U. Flavanols from Japanese quince (Chaenomeles japonica) fruit suppress expression of cyclooxygenase-2, metalloproteinase-9, and nuclear factor-kappaB in human colon cancer cells. Acta Biochim. Pol. 2017, 64, 567–576. [Google Scholar] [CrossRef]
- Strek, M.; Gorlach, S.; Podsedek, A.; Sosnowska, D.; Koziolkiewicz, M.; Hrabec, Z.; Hrabec, E. Procyanidin oligomers from Japanese quince (Chaenomeles japonica) fruit inhibit activity of MMP-2 and MMP-9 metalloproteinases. J. Agric. Food Chem. 2007, 55, 6447–6452. [Google Scholar] [CrossRef]
- Du, H.; Wu, J.; Li, H.; Zhong, P.-X.; Xu, Y.-J.; Li, C.-H.; Wang, L.-S. Polyphenols and triterpenes from Chaenomeles fruits: Chemical analysis and antioxidant activities assessment. Food Chem. 2013, 141, 4260–4268. [Google Scholar] [CrossRef]
- Ros, J.; Laencina, J.; Hellin, P.; Jordan, M.; Vila, R.; Rumpunen, K. Characterization of juice in fruits of different Chaenomeles species. Lebensm. Wiss. Technol. 2004, 37, 301–307. [Google Scholar] [CrossRef]
- Frei, B.; Birlouez-Aragon, I.; Lykkesfeldt, J. Authors’ perspective: What is the optimum intake of vitamin C in humans? Crit. Rev. Food Sci. Nutr. 2012, 52, 815–829. [Google Scholar] [CrossRef]
- Thomas, M.; Guillemin, F.; Guillon, F.; Thibault, J.F. Pectins in the fruits of Japanese quince (Chaenomeles japonica). Carbohydr. Polym. 2003, 53, 361–372. [Google Scholar] [CrossRef]
- Thomas, M.; Crépeau, M.J.; Rumpunen, K.; Thibault, J.F. Dietary fibre and cell wall polysaccharides in the fruits of Japanese quince (Chaenomeles japonica). LWT Food Sci. Technol. 2000, 33, 124–131. [Google Scholar] [CrossRef]
- Kendall, C.W.; Esfahani, A.; Jenkins, D.J. The link between dietary fibre and human health. Food Hydrocoll. 2010, 24, 42–48. [Google Scholar] [CrossRef]
- Burda, S.; Oleszek, W. Antioxidant and antiradical activities of flavonoids. J. Agric. Food Chem. 2001, 49, 2774–2779. [Google Scholar] [CrossRef] [PubMed]
- Pannala, A.S.; Chan, T.S.; O’Brien, P.J.; Rice-Evans, C.A. Flavonoid B-ring chemistry and antioxidant activity: Fast reaction kinetics. Biochem. Biophys. Res. Commun. 2001, 282, 1161–1168. [Google Scholar] [CrossRef] [PubMed]
- Farhadi, F.; Khameneh, B.; Iranshahi, M.; Iranshahy, M. Antibacterial activity of flavonoids and their structure–activity relationship: An update review. Phytother. Res. 2019, 33, 13–40. [Google Scholar] [CrossRef]
- Česonienė, L.; Daubaras, R.; Viškelis, P.; Šarkinas, A. Determination of the total phenolic and anthocyanin contents and antimicrobial activity of Viburnum opulus fruit juice. Plant. Foods Hum. Nutr. 2012, 67, 256–261. [Google Scholar] [CrossRef]
- Viskelis, P.; Rubinskienė, M.; Jasutienė, I.; Šarkinas, A.; Daubaras, R.; Česonienė, L. Anthocyanins, antioxidative, and antimicrobial properties of American cranberry (Vaccinium macrocarpon Ait.) and their press cakes. J. Food Sci. 2009, 74, C157–C161. [Google Scholar] [CrossRef]
- Puupponen-Pimiä, R.; Nohynek, L.; Alakomi, H.L.; Oksman-Caldentey, K.M. Bioactive berry compounds—Novel tools against human pathogens. Appl. Microbiol. Biotechnol. 2005, 67, 8–18. [Google Scholar] [CrossRef]
- Kikowska, M.; Włodarczyk, A.; Rewers, M.; Sliwinska, E.; Studzińska-Sroka, E.; Witkowska-Banaszczak, E.; Thiem, B. Micropropagation of Chaenomeles japonica: A Step towards Production of Polyphenol-rich Extracts Showing Antioxidant and Antimicrobial Activities. Molecules 2019, 24, 1314. [Google Scholar] [CrossRef]
- Xianfei, X.; Xiaoqiang, C.; Shunying, Z.; Guolin, Z. Chemical composition and antimicrobial activity of essential oils of Chaenomeles speciosa from China. Food Chem. 2007, 100, 1312–1315. [Google Scholar] [CrossRef]
- Dent, M.; Dragović-Uzelac, V.; Penić, M. The effect of extraction solvents, temperature and time on the composition and mass fraction of polyphenols in Dalmatian wild sage (Salvia officinalis L.) extracts. Food Technol. Biotechnol. 2013, 51, 84–91. [Google Scholar]
- Tan, M.C.; Tan, C.P.; Ho, C.W. Effects of extraction solvent system, time and temperature on total phenolic content of henna (Lawsonia inermis) stems. Int. Food Res. J. 2013, 20, 3117. [Google Scholar]
- Aybastıer, Ö.; Işık, E.; Şahin, S.; Demir, C. Optimization of ultrasonic-assisted extraction of antioxidant compounds from blackberry leaves using response surface methodology. Ind. Crop. Prod. 2013, 44, 558–565. [Google Scholar] [CrossRef]
- Irakli, M.; Chatzopoulou, P.; Ekateriniadou, L. Optimization of ultrasound-assisted extraction of phenolic compounds: Oleuropein, phenolic acids, phenolic alcohols and flavonoids from olive leaves and evaluation of its antioxidant activities. Ind. Crop. Prod. 2018, 124, 382–388. [Google Scholar] [CrossRef]
- Pandey, A.; Belwal, T.; Sekar, K.C.; Bhatt, I.D.; Rawal, R.S. Optimization of ultrasonic-assisted extraction (UAE) of phenolics and antioxidant compounds from rhizomes of Rheum moorcroftianum using response surface methodology (RSM). Ind. Crop. Prod. 2018, 119, 218–225. [Google Scholar] [CrossRef]
- Rumpunen, K. Chaenomeles: Potential new fruit crop for northern Europe. In Trends in New Crops and New Uses; ASHA Press: Alexandria, VA, USA, 2002; pp. 385–392. [Google Scholar]
- Allam, M.; Ordás, B.; Djemel, A.; Tracy, W.F.; Revilla, P. Linkage disequilibrium between fitness QTLs and the sugary1 allele of maize. Mol. Breed. 2019, 39, 3. [Google Scholar] [CrossRef]
- Urbanaviciute, I.; Liaudanskas, M.; Seglina, D.; Viskelis, P. Japanese Quince Chaenomeles Japonica (Thunb.) Lindl. ex Spach Leaves a New Source of Antioxidants for Food. Int. J. Food Prop. 2019, 22, 795–803. [Google Scholar] [CrossRef]
- Mišina, I.; Sipeniece, E.; Rudzińska, M.; Grygier, A.; Radzimirska-Graczyk, M.; Kaufmane, E.; Górnaś, P. Associations between Oil Yield and Profile of Fatty Acids, Sterols, Squalene, Carotenoids, and Tocopherols in Seed Oil of Selected Japanese Quince Genotypes during Fruit Development. Eur. J. Lipid Sci. Technol. 2020, 122, 1900386. [Google Scholar] [CrossRef]
- Radziejewska-Kubzdela, E.; Górnaś, P. Impact of Genotype on Carotenoids Profile in Japanese quince (Chaenomeles japonica) Seed Oil. J. Am. Oil Chem. Soc. 2020. [Google Scholar] [CrossRef]
- Slinkard, K.; Singleton, V.L. Total phenol analysis: Automation and comparison with manual methods. Am. J. Enol. Vitic. 1977, 28, 49–55. [Google Scholar]
- Heil, M.; Baumann, B.; Andary, C.; Linsenmair, E.K.; McKey, D. Extraction and quantification of “condensed tannins” as a measure of plant anti-herbivore defence? Revisiting an old problem. Naturwissenschaften 2002, 89, 519–524. [Google Scholar] [CrossRef] [PubMed]
- Brand-Williams, W.; Cuvelier, M.E.; Berset, C. Use of a free radical method to evaluate antioxidant activity. LWT-Food Sci. Technol. 1995, 28, 25–30. [Google Scholar] [CrossRef]
- Re, R.; Pellegrini, N.; Proteggente, A.; Pannala, A.; Yang, M.; Rice-Evans, C. Antioxidant activity applying an improved ABTS radical cation decolorization assay. Free Radic. Biol. Med. 1999, 26, 1231–1237. [Google Scholar] [CrossRef]
- AOAC. Official Methods of Analysis of the Association of Official Analytical Chemists, 15th ed.; AOAC: Arlington, VA, USA, 1990; pp. 1058–1059. [Google Scholar]
- Cunniff, P. Official methods of analysis of aoac international. J. AOAC Int. 1997, 80, 127A. [Google Scholar]
- Liaudanskas, M.; Viškelis, P.; Raudonis, R.; Kviklys, D.; Uselis, N.; Janulis, V. Phenolic composition and antioxidant activity of Malus domestica leaves. Sci. World J. 2014. [Google Scholar] [CrossRef] [PubMed]
- Bobinaitė, R.; Viškelis, P.; Šarkinas, A.; Venskutonis, P.R. Phytochemical composition, antioxidant and antimicrobial properties of raspberry fruit, pulp, and marc extracts. CyTA J. Food 2013, 11, 334–342. [Google Scholar] [CrossRef]
- Hood, J.R.; Wilkinson, J.M.; Cavanagh, H.M. Evaluation of common antibacterial screening methods utilized in essential oil research. J. Essent. Oil Res. 2003, 15, 428–433. [Google Scholar] [CrossRef]
- Tao, W.; Zhang, Y.; Shen, X.; Cao, Y.; Shi, J.; Ye, X.; Chen, S. Rethinking the mechanism of the health benefits of proanthocyanidins: Absorption, metabolism, and interaction with gut microbiota. Compr. Rev. Food Sci. Food Saf. 2019, 18, 971–985. [Google Scholar] [CrossRef]
- Viškelis, P.; Rubinskienė, M.; Bobinaitė, R.; Dambrauskienė, E. Bioactive compounds and antioxidant activity of small fruits in Lithuania. J. Food Agric. Environ. 2010, 8, 259–263. [Google Scholar]
- Vaquero, M.R.; Alberto, M.R.; de Nadra, M.M. Antibacterial effect of phenolic compounds from different wines. Food Control. 2007, 18, 93–101. [Google Scholar] [CrossRef]
- Boulekbache-Makhlouf, L.; Slimani, S.; Madani, K. Total phenolic content, antioxidant and antibacterial activities of fruits of Eucalyptus globulus cultivated in Algeria. Ind. Crop. Prod. 2013, 41, 85–89. [Google Scholar] [CrossRef]
- Vaara, M. Agents that increase the permeability of the outer membrane. Microbiol. Rev. 1992. [Google Scholar] [CrossRef]
- Wendakoon, C.; Calderon, P.; Gagnon, D. Evaluation of selected medicinal plants extracted in different ethanol concentrations for antibacterial activity against human pathogens. J. Med. Act. Plants 2012, 1, 60–68. [Google Scholar]
- Tajkarimi, M.M.; Ibrahim, S.A.; Cliver, D.O. Antimicrobial herb and spice compounds in food. Food Control. 2010, 21, 1199–1218. [Google Scholar] [CrossRef]
- Biswas, B.; Rogers, K.; McLaughlin, F.; Daniels, D.; Yadav, A. Antimicrobial activities of leaf extracts of guava (Psidium guajava L.) on two gram-negative and gram-positive bacteria. Int. J. Microbiol. 2013. [Google Scholar] [CrossRef]
- Basile, A.; Sorbo, S.; Giordano, S.; Ricciardi, L.; Ferrara, S.; Montesano, D.; Ferrara, L. Antibacterial and allelopathic activity of extract from Castanea sativa leaves. Fitoterapia 2000, 71, S110–S116. [Google Scholar] [CrossRef]
- Radovanović, B.C.; Anđelković, S.M.; Radovanović, A.B.; Anđelković, M.Z. Antioxidant and antimicrobial activity of polyphenol extracts from wild berry fruits grown in southeast Serbia. Trop. J. Pharm. Res. 2013, 12, 813–819. [Google Scholar] [CrossRef]
- Arima, H.; Ashida, H.; Danno, G.I. Rutin-enhanced antibacterial activities of flavonoids against Bacillus cereus and Salmonella enteritidis. Biosci. Biotechnol. Biochem. 2002, 66, 1009–1014. [Google Scholar] [CrossRef]
- Amin, M.U.; Khurram, M.; Khattak, B.; Khan, J. Antibiotic additive and synergistic action of rutin, morin and quercetin against methicillin resistant Staphylococcus aureus. BMC Complement. Altern. Med. 2015, 15, 59. [Google Scholar] [CrossRef]
- Cetin-Karaca, H.; Newman, M.C. Antimicrobial efficacy of plant phenolic compounds against Salmonella and Escherichia coli. Food Biosci. 2015, 11, 8–16. [Google Scholar] [CrossRef]
- Nohynek, L.J.; Alakomi, H.L.; Kähkönen, M.P.; Heinonen, M.; Helander, I.M.; Oksman-Caldentey, K.M.; Puupponen-Pimiä, R.H. Berry phenolics: Antimicrobial properties and mechanisms of action against severe human pathogens. Nutr. Cancer 2006, 54, 18–32. [Google Scholar] [CrossRef] [PubMed]
- Katalinić, V.; Možina, S.S.; Skroza, D.; Generalić, I.; Abramovič, H.; Miloš, M.; Boban, M. Polyphenolic profile, antioxidant properties and antimicrobial activity of grape skin extracts of 14 Vitis vinifera varieties grown in Dalmatia (Croatia). Food Chem. 2010, 119, 715–723. [Google Scholar] [CrossRef]
- Omojate Godstime, C.; Enwa Felix, O.; Jewo Augustina, O.; Eze Christopher, O. Mechanisms of antimicrobial actions of phytochemicals against enteric pathogens—A review. J. Pharm. Chem. Biol. Sci. 2014, 2, 77–85. [Google Scholar]
- Caillet, S.; Côté, J.; Sylvain, J.-F.; Lacroix, M. Antimicrobial effects of fractions from cranberry products on the growth of seven pathogenic bacteria. Food Control. 2012, 23, 419–428. [Google Scholar] [CrossRef]


| Solvent | Solvents Concentration [%] | ||
|---|---|---|---|
| 100 | 70 | 50 | |
| Ethanol | 4409 ± 25 c | 5104 ± 32 b | 5256 ± 19 a |
| Methanol | 5195 ± 34 a | 4984 ± 22 b | 4796 ± 27 c |
| Acetone | 3228 ± 61 b | 5426 ± 83 a | 5274 ± 52 a |
| Test Set | X1, Ultrasonic Power (W) | X2, Extraction Time (min) | X3, Temperature (°C) | Total Phenols mg/100 g |
|---|---|---|---|---|
| 1 | 240 (0) | 40 (0) | 45 (0) | 5365.5 |
| 2 | 240 (0) | 40 (0) | 45 (0) | 5219.2 |
| 3 | 480 (+1) | 20 (−1) | 60 (+1) | 4522.6 |
| 4 | 240 (0) | 40 (0) | 60 (+1) | 5047.3 |
| 5 | 48 (−1) | 60 (+1) | 60 (+1) | 4851.1 |
| 6 | 240 (0) | 20 (−1) | 45 (0) | 5579.9 |
| 7 | 48 (−1) | 40 (0) | 45 (0) | 5830.9 |
| 8 | 48 (−1) | 20 (−1) | 60 (+1) | 4729.5 |
| 9 | 240 (0) | 40 (0) | 45 (0) | 5417.3 |
| 10 | 240 (0) | 40 (0) | 45 (0) | 5866.3 |
| 11 | 240 (0) | 40 (0) | 45 (0) | 5840.6 |
| 12 | 240 (0) | 60 (+1) | 45 (0) | 5095.9 |
| 13 | 48 (−1) | 60 (+1) | 30 (−1) | 6061.7 |
| 14 | 240 (0) | 40 (0) | 30 (−1) | 6236.9 |
| 15 | 240 (0) | 40 (0) | 45 (0) | 5007.3 |
| 16 | 480 (+1) | 60 (+1) | 60 (+1) | 4785.2 |
| 17 | 480 (+1) | 20 (−1) | 30 (−1) | 6435.2 |
| 18 | 48 (−1) | 20 (−1) | 30 (−1) | 5515.3 |
| 19 | 480 (+1) | 60 (+1) | 30 (−1) | 6016.7 |
| 20 | 480 (+1) | 40 (0) | 45 (0) | 6784.9 |
| Source | Sum of Squares | df | Mean Square | F Value | p-Value |
|---|---|---|---|---|---|
| Model | 4.25 × 10⁶ | 3 | 1.42 × 10⁶ | 7.6519 | 0.0022 |
| Ultrasonic power | 2.42 × 10⁵ | 1 | 2.42 × 10⁵ | 1.30814 | 0.2696 |
| Extraction time | 78.961 | 1 | 78.961 | 4.27 × 10⁻⁴ | 0.9838 |
| Temperature | 4.01 × 10⁶ | 1 | 4.01 × 10⁶ | 21.64713 | 0.0003 |
| Lack of Fit | 2.38 × 10⁶ | 11 | 2.16 × 10⁵ | 1.853435 | 0.2570 |
| Pure Error | 5.83 × 10⁵ | 5 | 1.17 × 10⁵ |
| Properties | Japanese Quince Cultivars | ||
|---|---|---|---|
| ‘Darius’ | ‘Rondo’ | ‘Rasa’ | |
| TPC, mgGAE/100 g | 4550 ± 394 a | 3906 ± 77 a | 4366 ± 385 a |
| Content of proanthocyanidins, mg/100 g | 1550.1 ± 31.4 a | 879.7 ± 20.1 c | 1233.4 ± 15.6 b |
| RSA (DPPH), µmol TE/100 gDW | 115.9 ± 5.9 a | 99.1 ± 2.2 b | 106.5 ± 2.3 a |
| RSA (ABTS), µmol TE/100 gDW | 559.7 ± 34.2 b | 372.0 ± 5.0 c | 681.6 ± 11.7 a |
| Ascorbic acid (vitamin C), mg/100 g | 168 ± 2.1 a | 169 ± 1.1 a | 114 ± 2.8 b |
| Total fiber content, g/100 g | 28.5 ± 2.5 a | 28.5 ± 3.0 a | 31.2 ± 3.2 a |
| Compound, µg g−1 DW | Japanese Quince Cultivars | ||
|---|---|---|---|
| ‘Darius’ | ‘Rondo’ | ‘Rasa’ | |
| Isoquercitrin | 38.8 ± 2.5 a | 33.3 ± 3.2 b | 42.4 ± 1.9 a |
| Rutin | 37.8 ± 3.4 c | 57.4 ± 2.2 b | 66.7 ± 2.2 a |
| (+)-Catechin | 131.8 ± 6.1 c | 182.9 ± 8.3 a | 157.9 ± 10.2 b |
| (–)-Epicatechin | 3535.1 ± 60.2 a | 3343.1 ± 55.1 b | 3575.9 ± 50.5 a |
| Chlorogenic acid | 152.9 ± 7.1 a | 98.6 ± 6.3 c | 113.7 ± 4.4 b |
| Total | 3896.3 ± 65.2 a | 3715.2 ± 58.1 a | 3956.7 ± 53.7 a |
| Microorganism | Extract Concentration, % | Japanese Quince Cultivars | |||
|---|---|---|---|---|---|
| ‘Rasa’ | ‘Darius’ | ‘Rondo’ | |||
| Inhibition Zone Size, mm | |||||
| Gram-positive | Bacillus subtilis (ATCC 6633) | 0.5 | 11.0 ± 0.1 | 11.0 ± 0.1 | 11.7 ± 0.5 |
| 1 | 14.0 ± 0.1 | 12.0 ± 0.1 | 12.7 ± 0.4 | ||
| 5 | 21.7 ± 0.5 | 18.3 ± 1.2 | 18.0 ± 0.1 | ||
| Enterococcus faecalis (ATCC 29212) | 0.5 | 13.0 ± 0.1 | 12.0 ± 0.1 | 17.7 ± 0.4 | |
| 1 | 17.0 ± 0.1 | 15.0 ± 0.1 | 20.6 ± 0.5 | ||
| 5 | 30.7 ± 0.5 | 25.3 ± 1.3 | 27.0 ± 0.2 | ||
| Staphylococcus aureus (ATCC 25923) | 0.5 | 9.0 ± 0.1 | 9.0 ± 0.1 | 0 | |
| 1 | 12.0 ± 0.1 | 10.0 ± 0.1 | 13.7 ± 0.5 | ||
| 5 | 18.7 ± 0.4 | 17.3 ± 1.1 | 18.0 ± 0.1 | ||
| Gram-negative | Escherichia coli (25922 ATCC) | 0.5 | 9.0 ± 0.1 | 10.0 ± 0.1 | 9.7 ± 0.5 |
| 1 | 13.0 ± 0.1 | 12.0 ± 0.1 | 12.6 ± 0.5 | ||
| 5 | 19.6 ± 0.5 | 15.3 ± 1.1 | 17.0 ± 0.1 | ||
| Pseudomonas aeruginosa (27853 ATCC) | 0.5 | 9.0 ± 0.1 | 9.0 ± 0.1 | 9.6 ± 0.4 | |
| 1 | 13.0 ± 0.1 | 12.0 ± 0.1 | 11.7 ± 0.5 | ||
| 5 | 19.7 ± 0.5 | 16.3 ± 1.1 | 16.0 ± 0.1 | ||
| Salmonella enterica serovar Typhimurium (ATCC 14028) | 0.5 | 0 | 0 | 0 | |
| 1 | 12.0 ± 0.1 | 12.0 ± 0.1 | 11.7 ± 0.5 | ||
| 5 | 19.7 ± 0.4 | 17.3 ± 1.2 | 15.0 ± 0.1 | ||
| Candida albicans (ATCC 10231) | 0.5 | 0 | 0 | 0 | |
| 1 | 0 | 0 | 0 | ||
| 5 | 0 | 0 | 0 | ||
© 2020 by the authors. Licensee MDPI, Basel, Switzerland. This article is an open access article distributed under the terms and conditions of the Creative Commons Attribution (CC BY) license (http://creativecommons.org/licenses/by/4.0/).
Share and Cite
Urbanavičiūtė, I.; Liaudanskas, M.; Bobinas, Č.; Šarkinas, A.; Rezgienė, A.; Viskelis, P. Japanese Quince (Chaenomeles japonica) as a Potential Source of Phenols: Optimization of the Extraction Parameters and Assessment of Antiradical and Antimicrobial Activities. Foods 2020, 9, 1132. https://doi.org/10.3390/foods9081132
Urbanavičiūtė I, Liaudanskas M, Bobinas Č, Šarkinas A, Rezgienė A, Viskelis P. Japanese Quince (Chaenomeles japonica) as a Potential Source of Phenols: Optimization of the Extraction Parameters and Assessment of Antiradical and Antimicrobial Activities. Foods. 2020; 9(8):1132. https://doi.org/10.3390/foods9081132
Chicago/Turabian StyleUrbanavičiūtė, Ieva, Mindaugas Liaudanskas, Česlovas Bobinas, Antanas Šarkinas, Aistė Rezgienė, and Pranas Viskelis. 2020. "Japanese Quince (Chaenomeles japonica) as a Potential Source of Phenols: Optimization of the Extraction Parameters and Assessment of Antiradical and Antimicrobial Activities" Foods 9, no. 8: 1132. https://doi.org/10.3390/foods9081132
APA StyleUrbanavičiūtė, I., Liaudanskas, M., Bobinas, Č., Šarkinas, A., Rezgienė, A., & Viskelis, P. (2020). Japanese Quince (Chaenomeles japonica) as a Potential Source of Phenols: Optimization of the Extraction Parameters and Assessment of Antiradical and Antimicrobial Activities. Foods, 9(8), 1132. https://doi.org/10.3390/foods9081132