Food-Loss Control at the Macronutrient Level: Protein Inventory for the Norwegian Farmed Salmon Production System


Abstract
1. Introduction
- (1)
- The quantities of input and output protein for every process.
- (2)
- The potential of salmon by-products as food and the amount of protein that does not reach the human food chain.
- (3)
- How the system’s protein inventory can more accurately reflect the true FL and can assess the efficiency of biomass conversion into food.
2. Methods
2.1. Substance Flow Analysis (SFA)
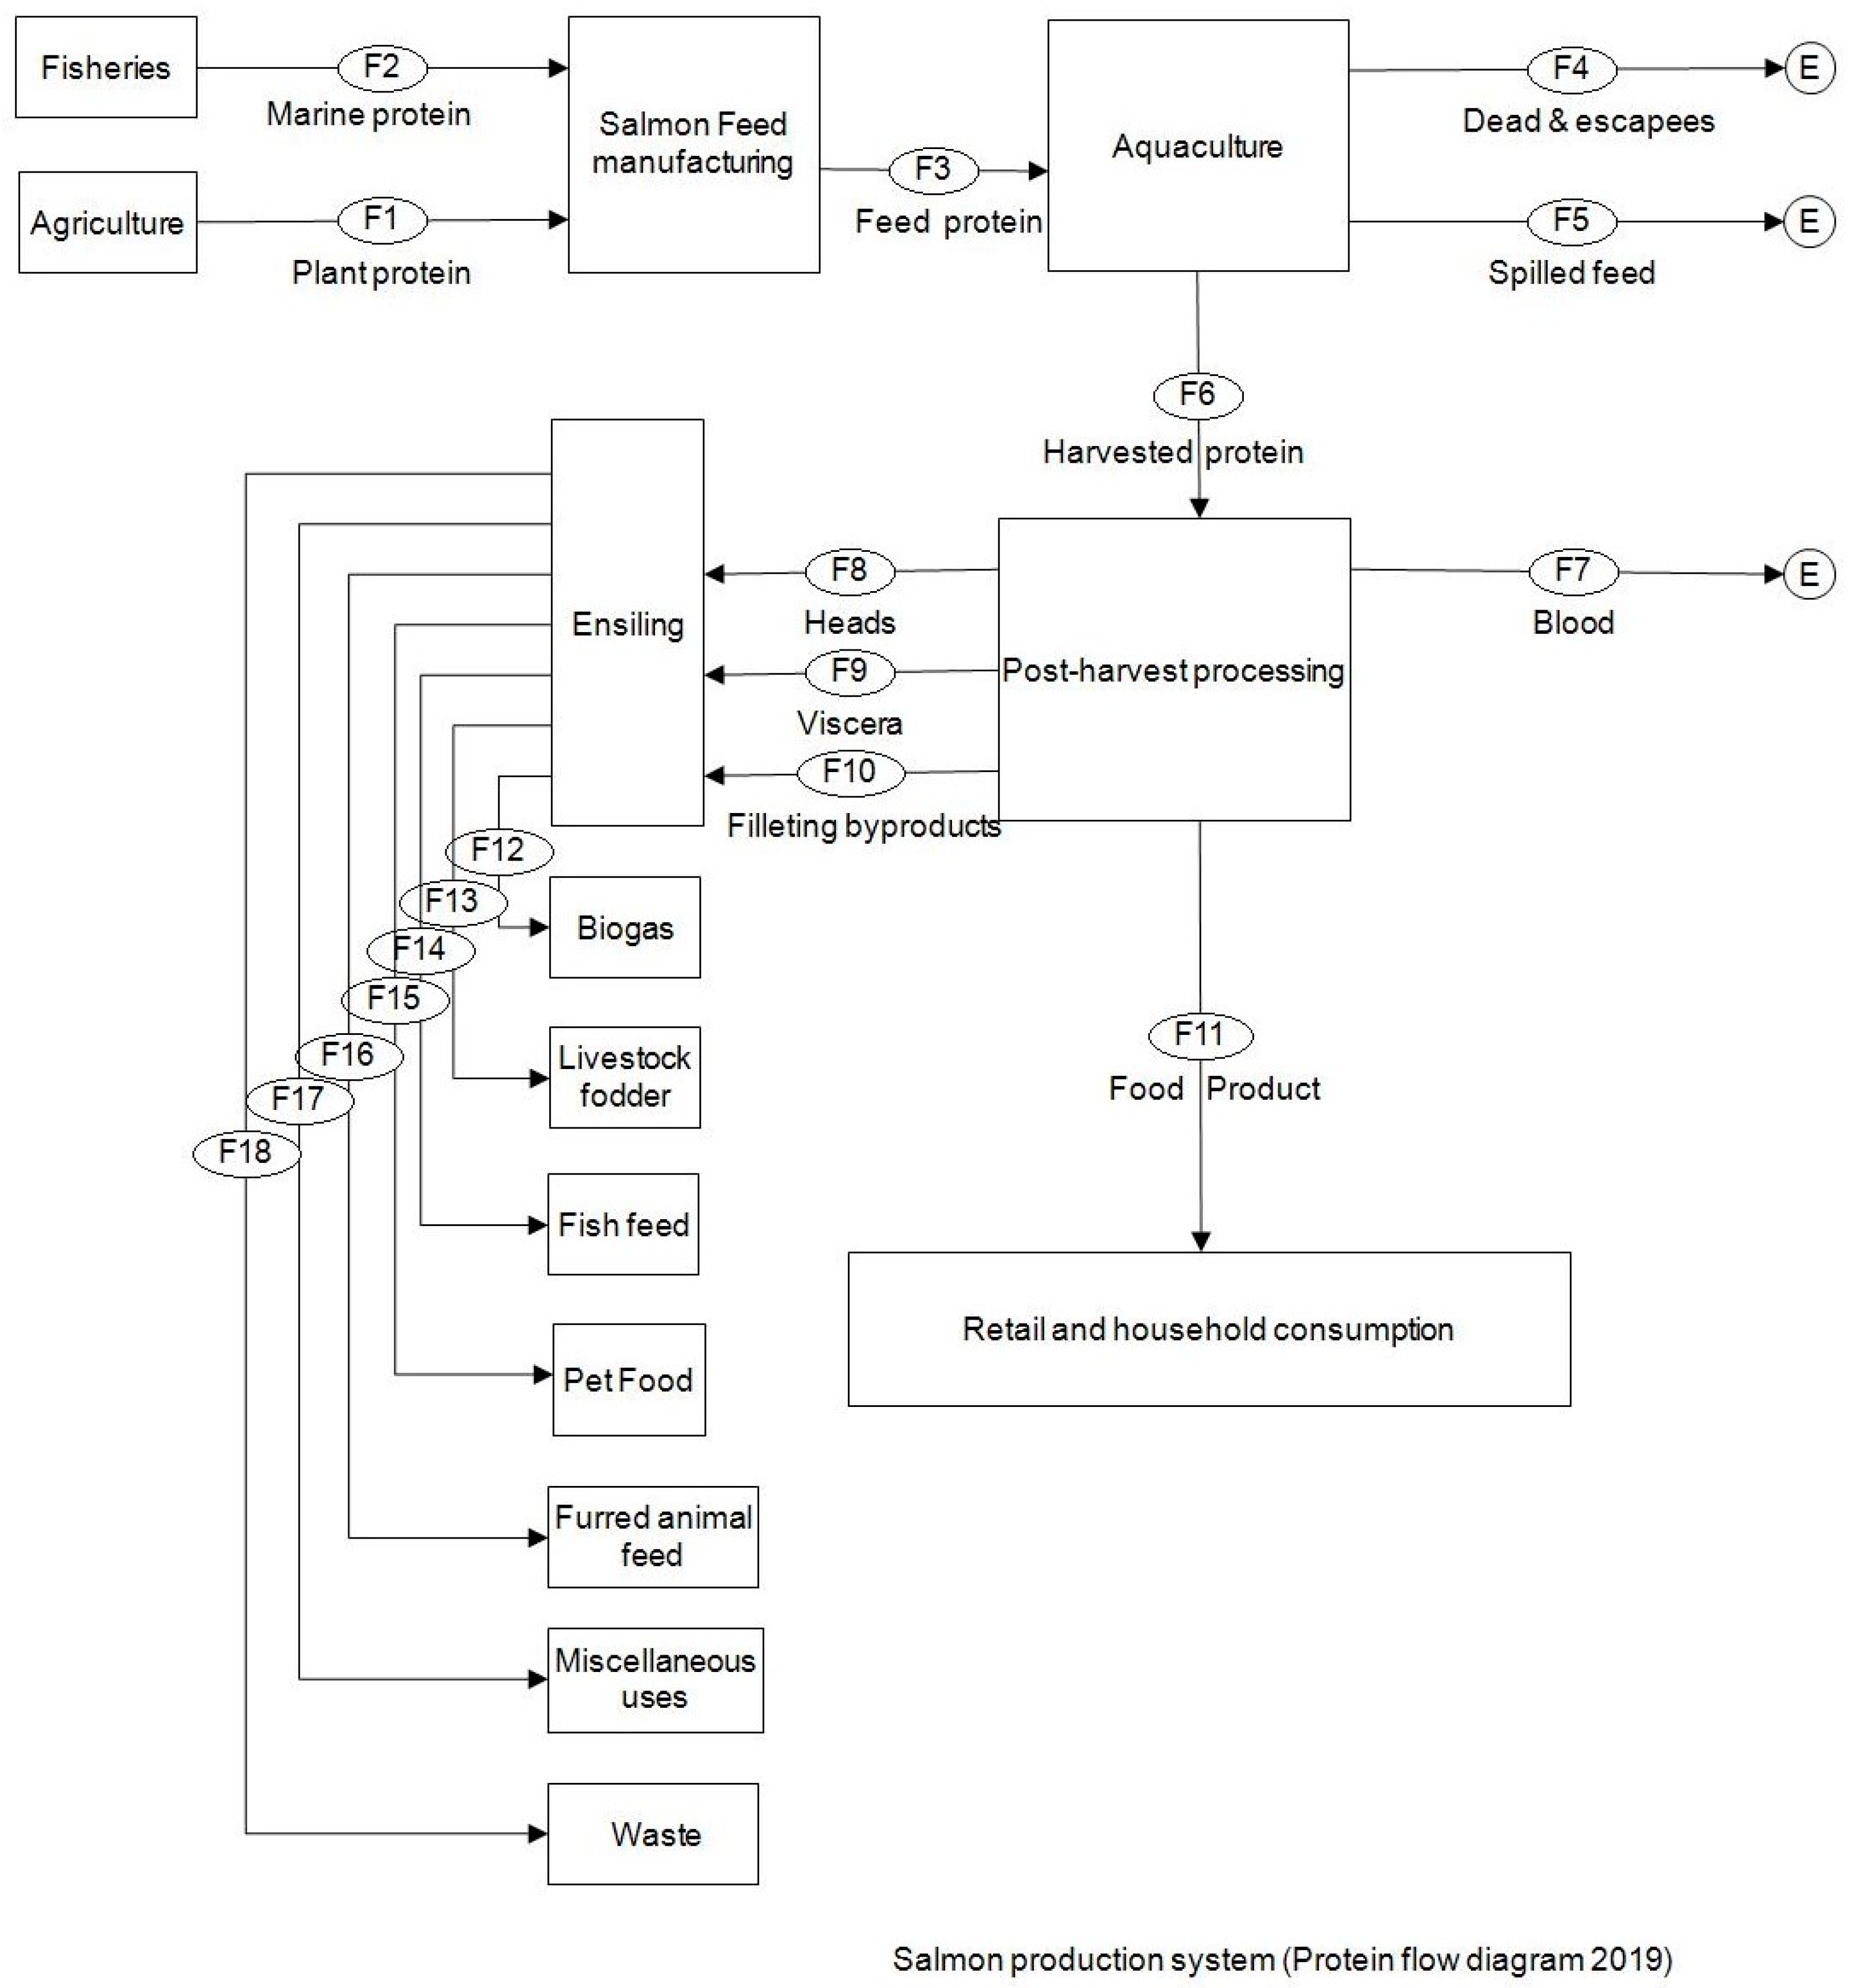
2.2. System Definition and Flow Description
2.3. Data Sources and Quantification Method
2.4. Variability Margins and Uncertainties
3. Results
3.1. Current Practices and Flows
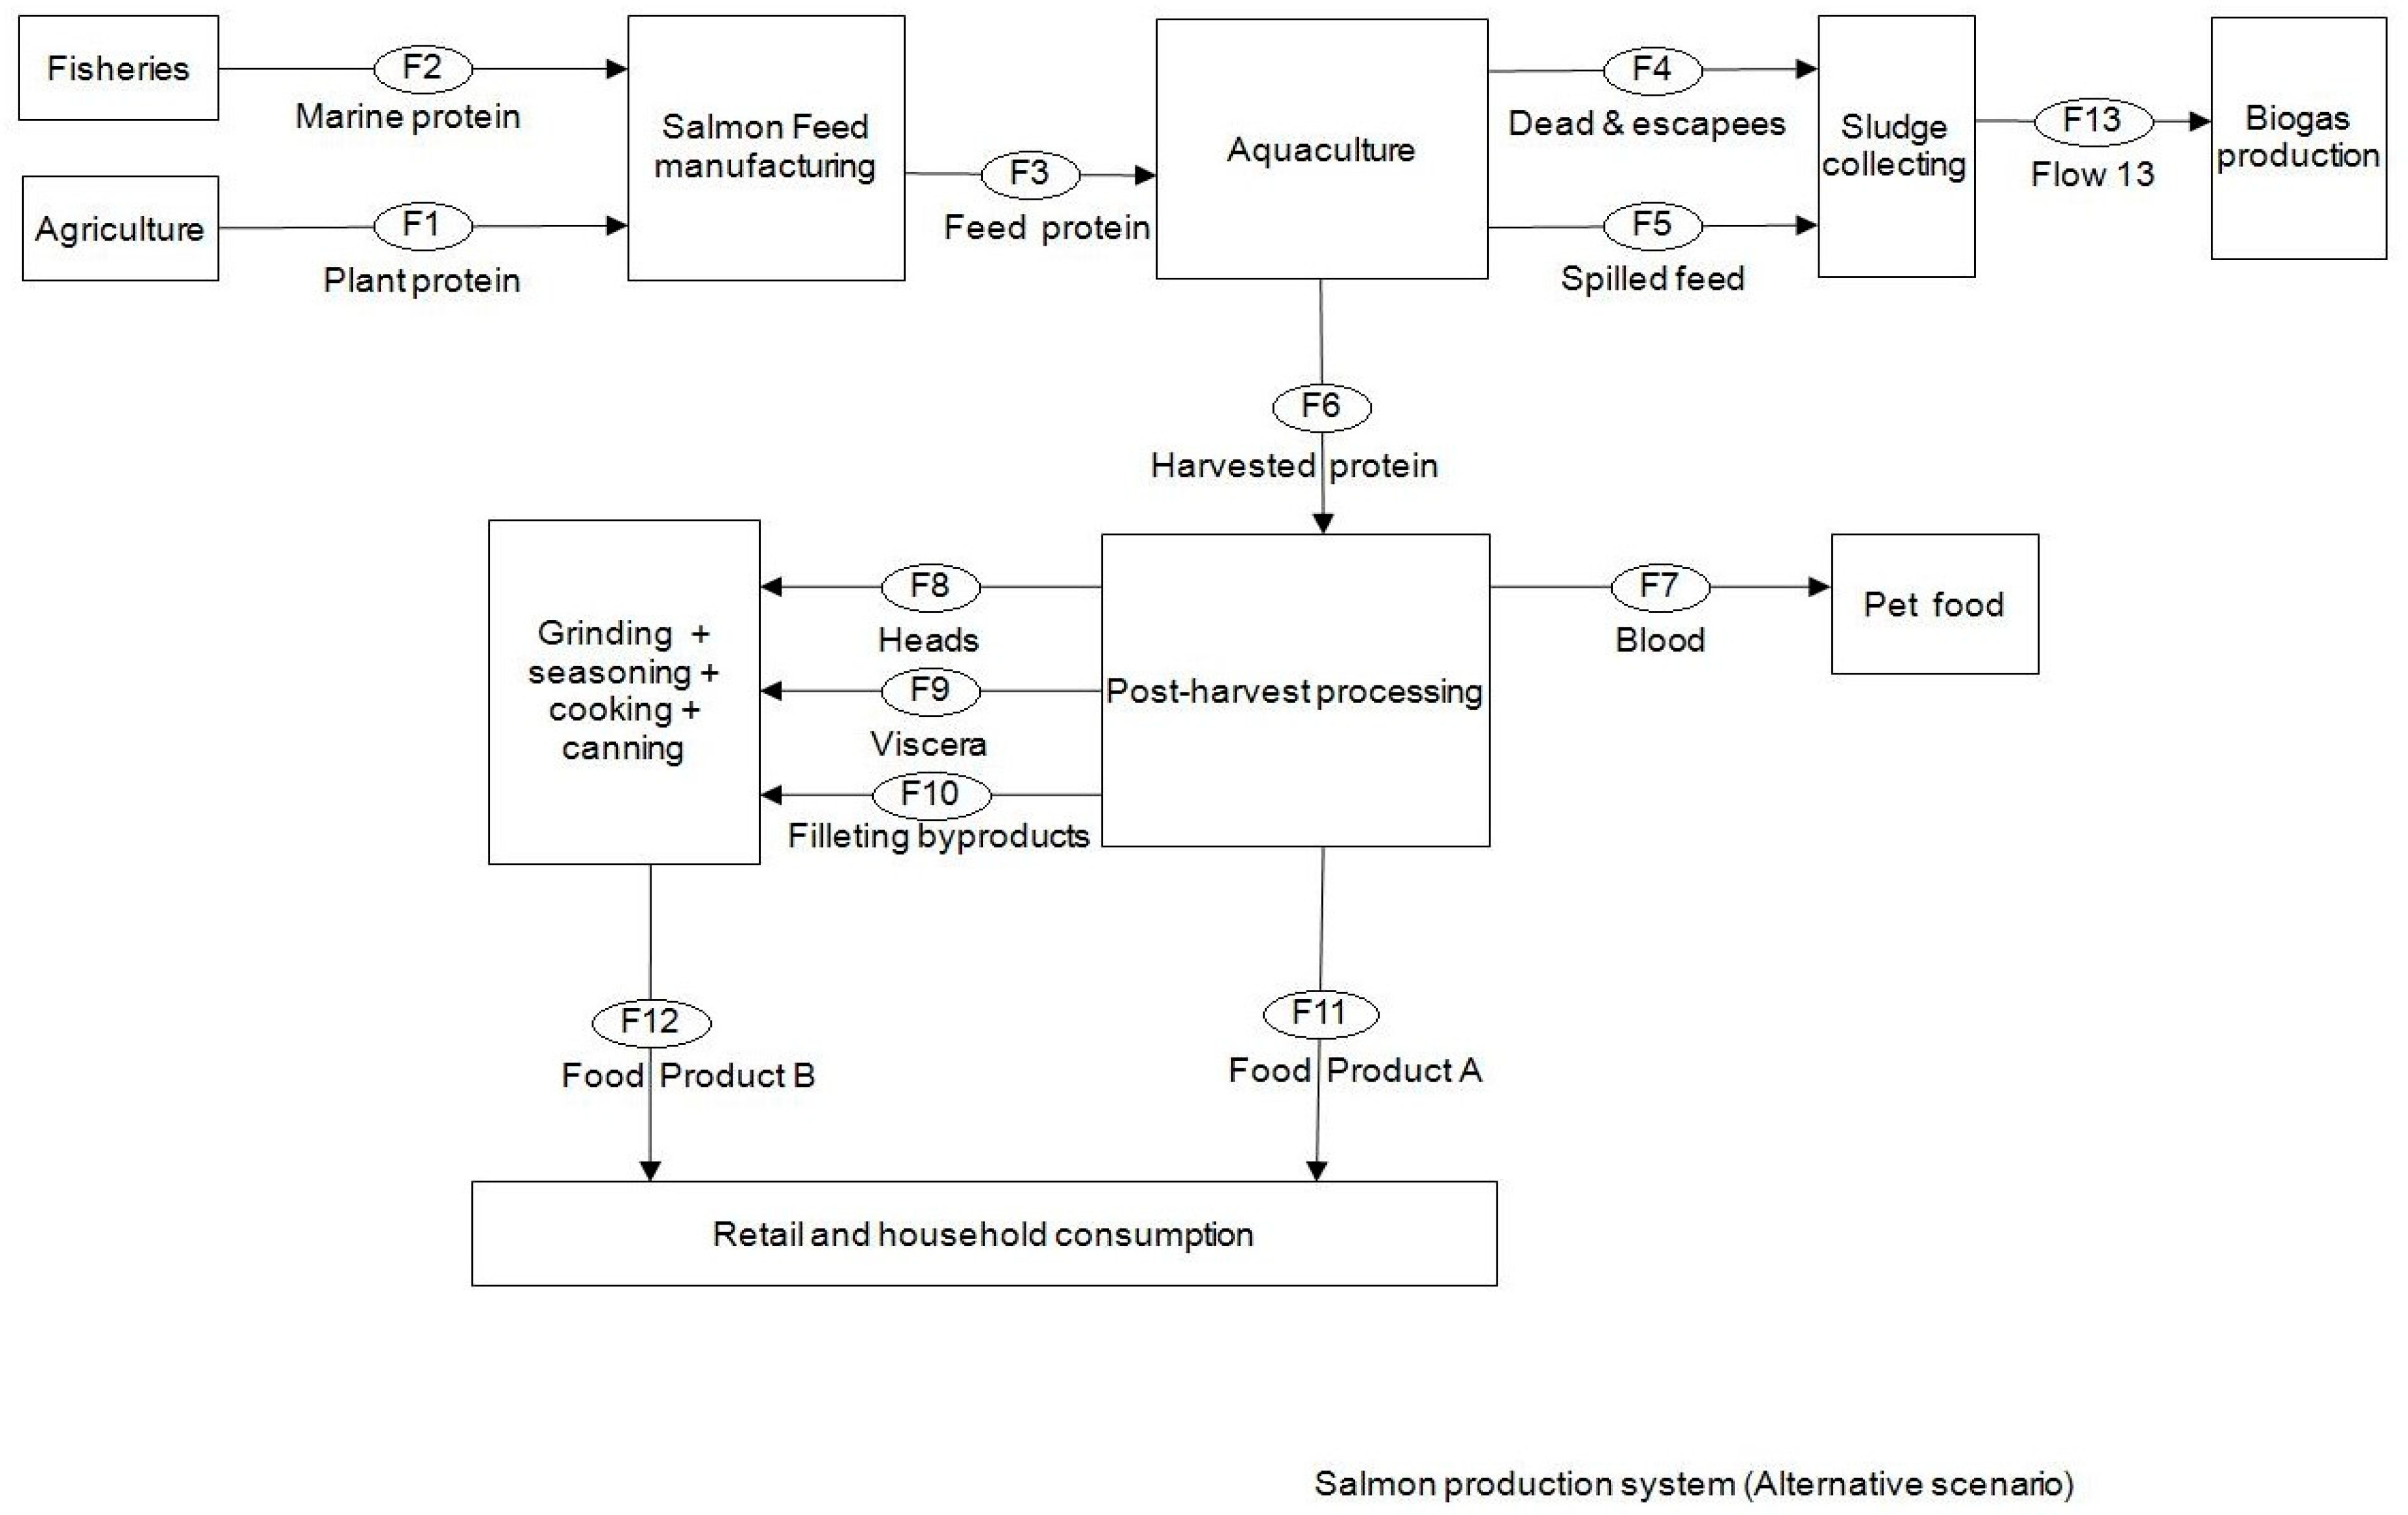
3.2. Alternative Scenario
4. Discussion
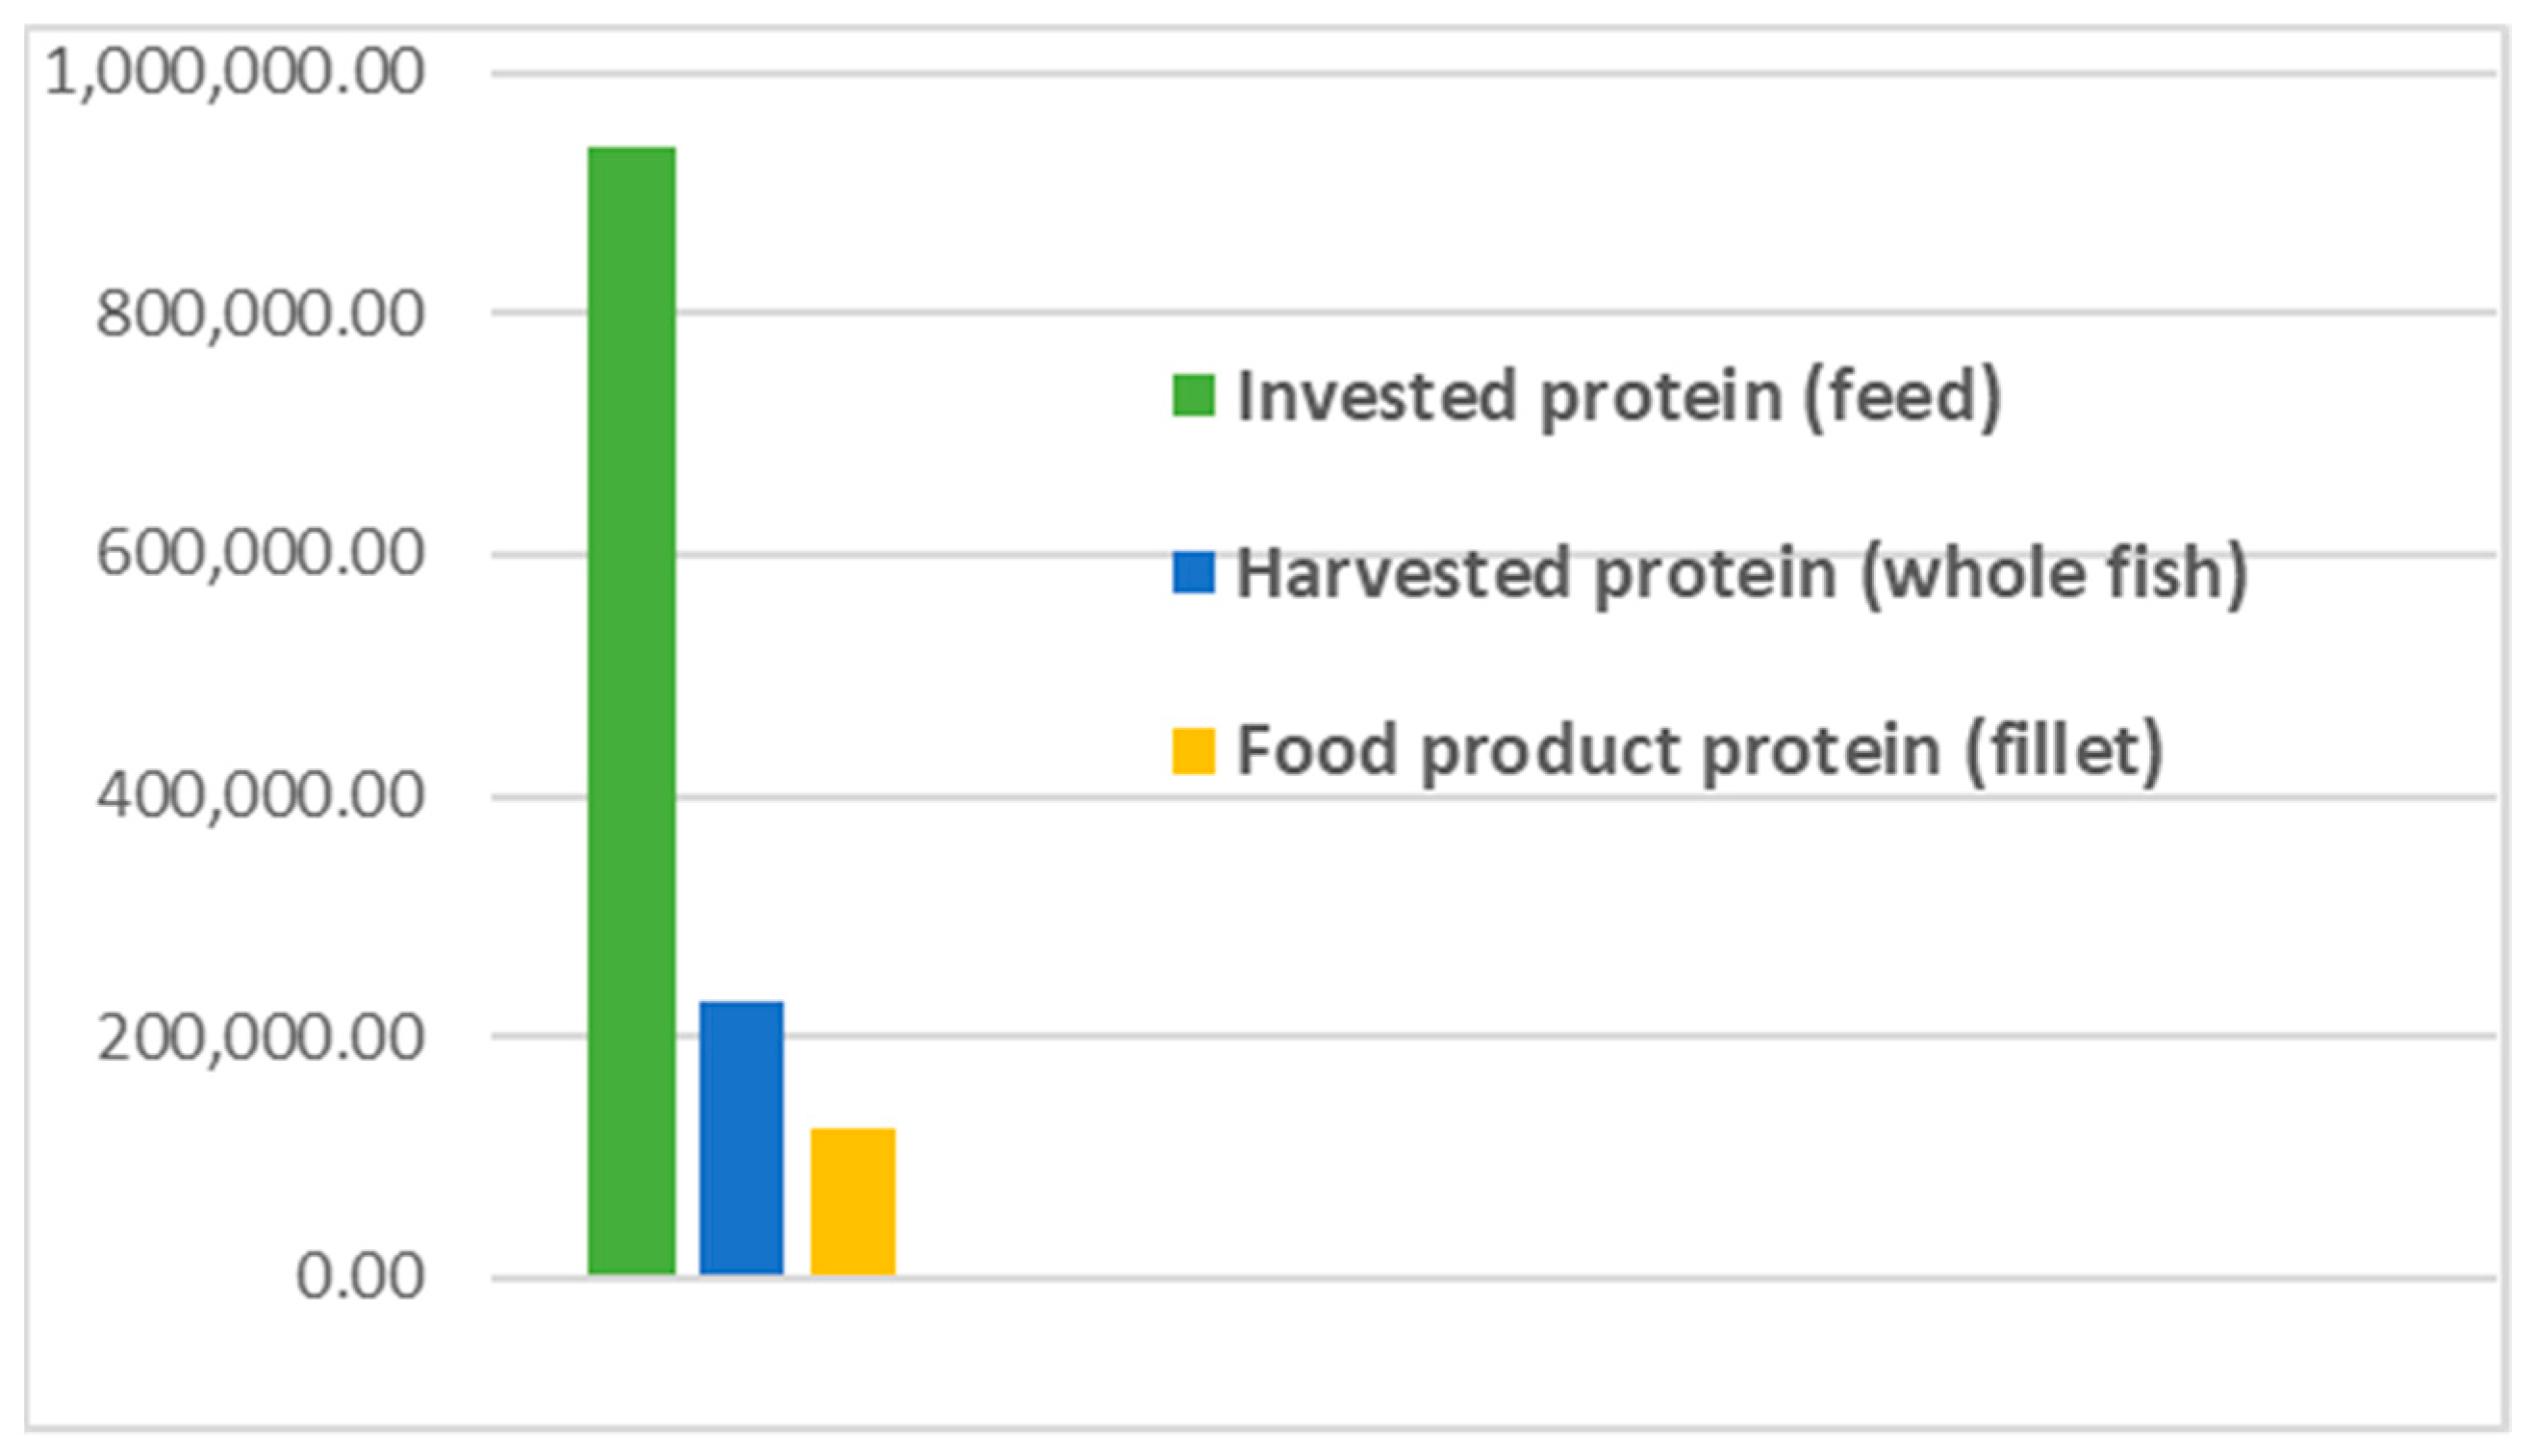
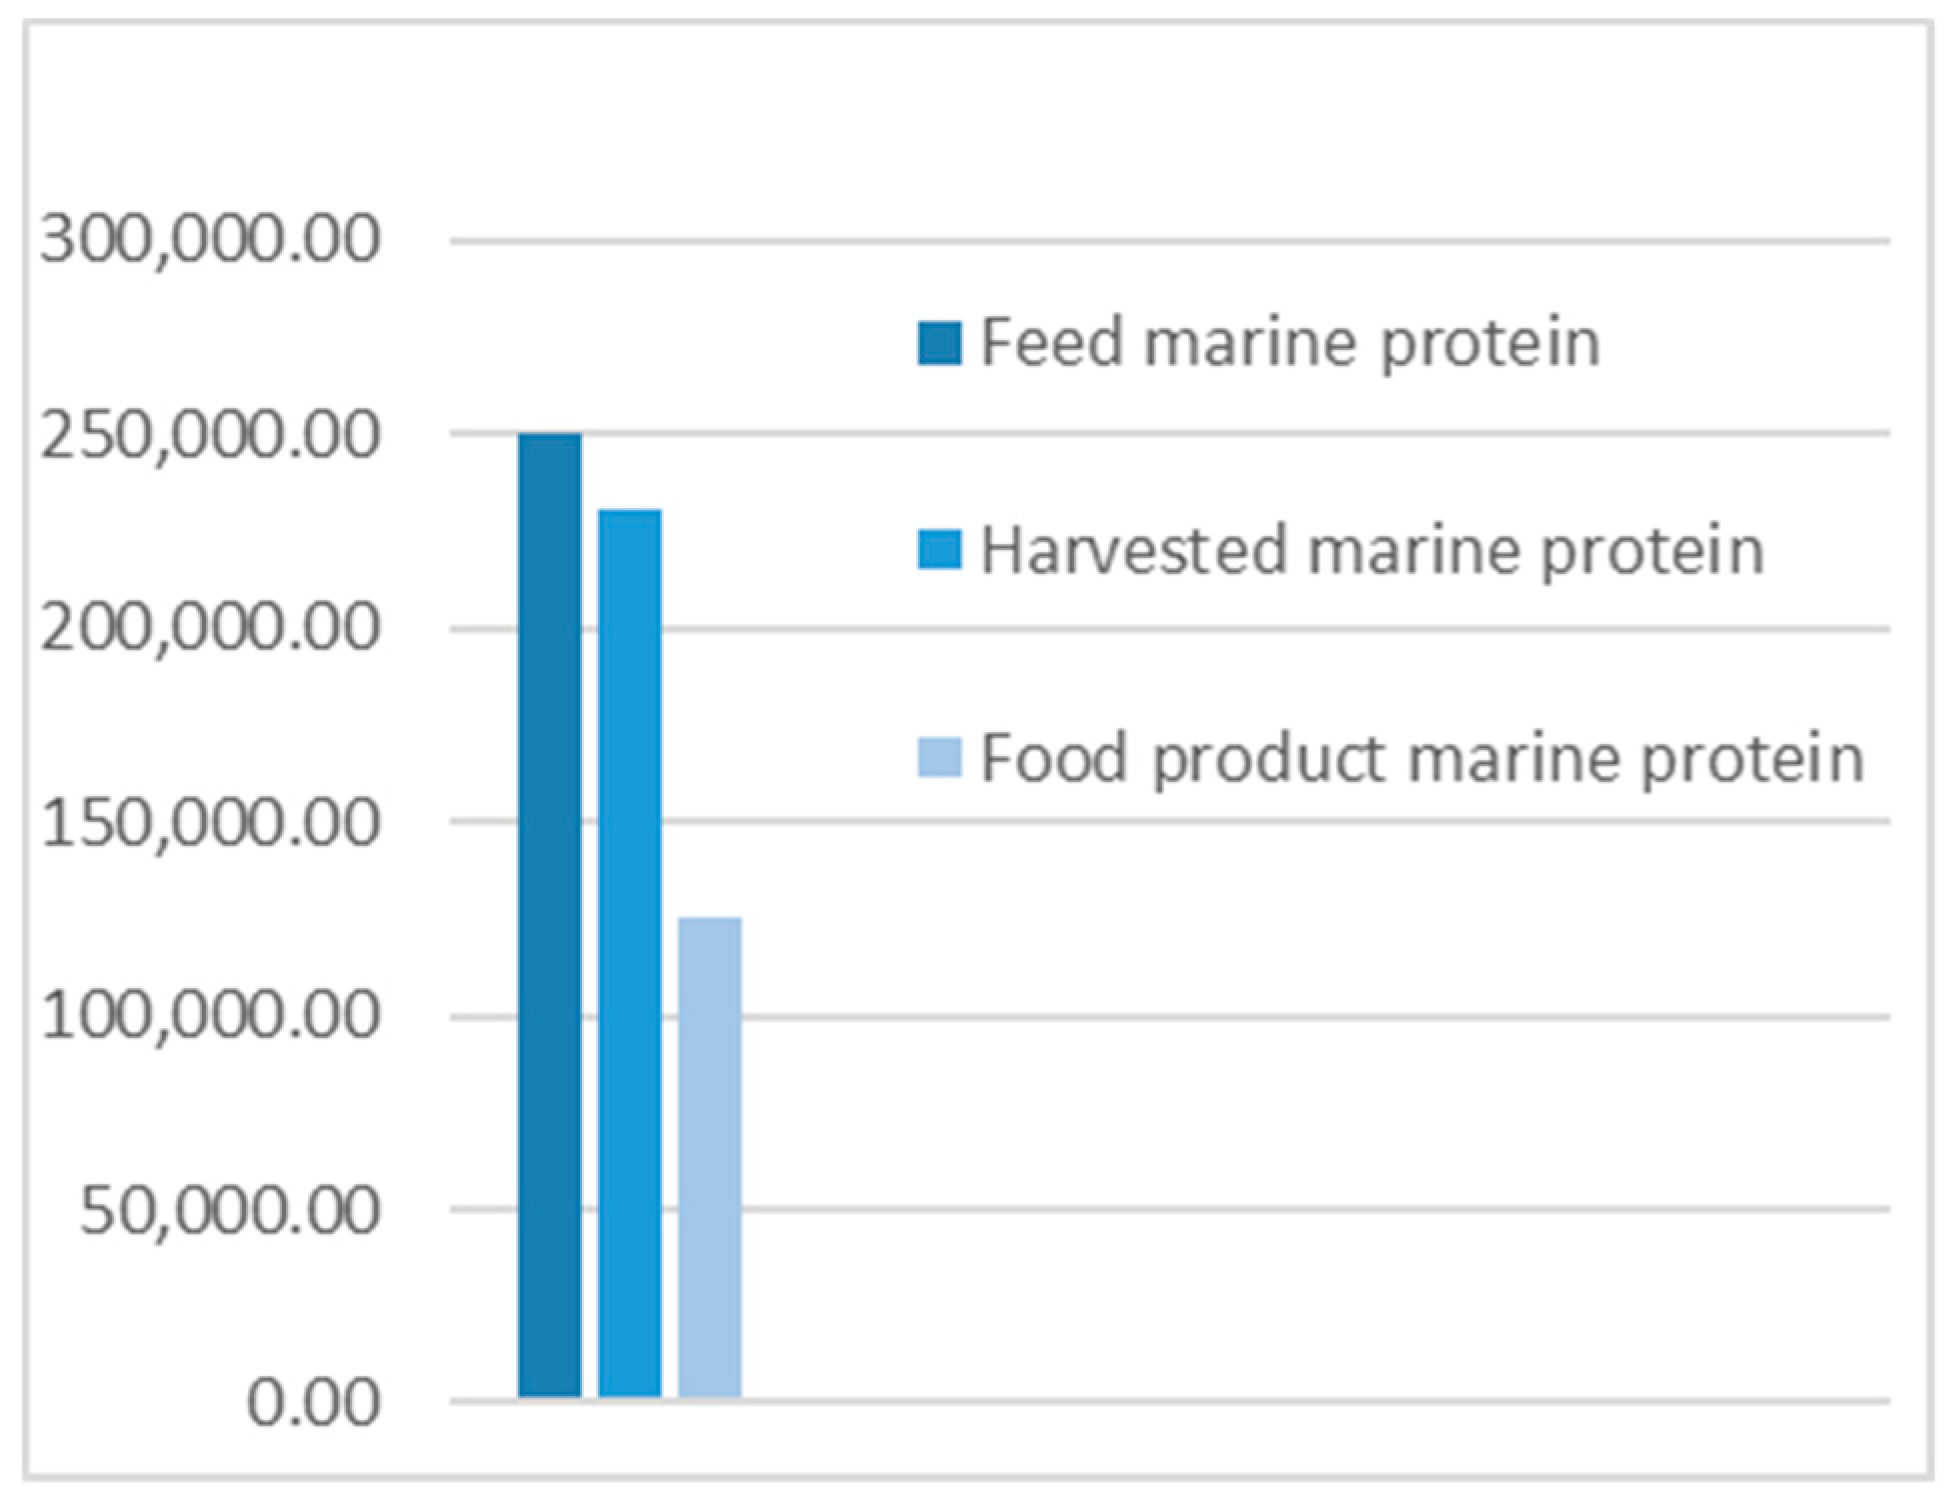
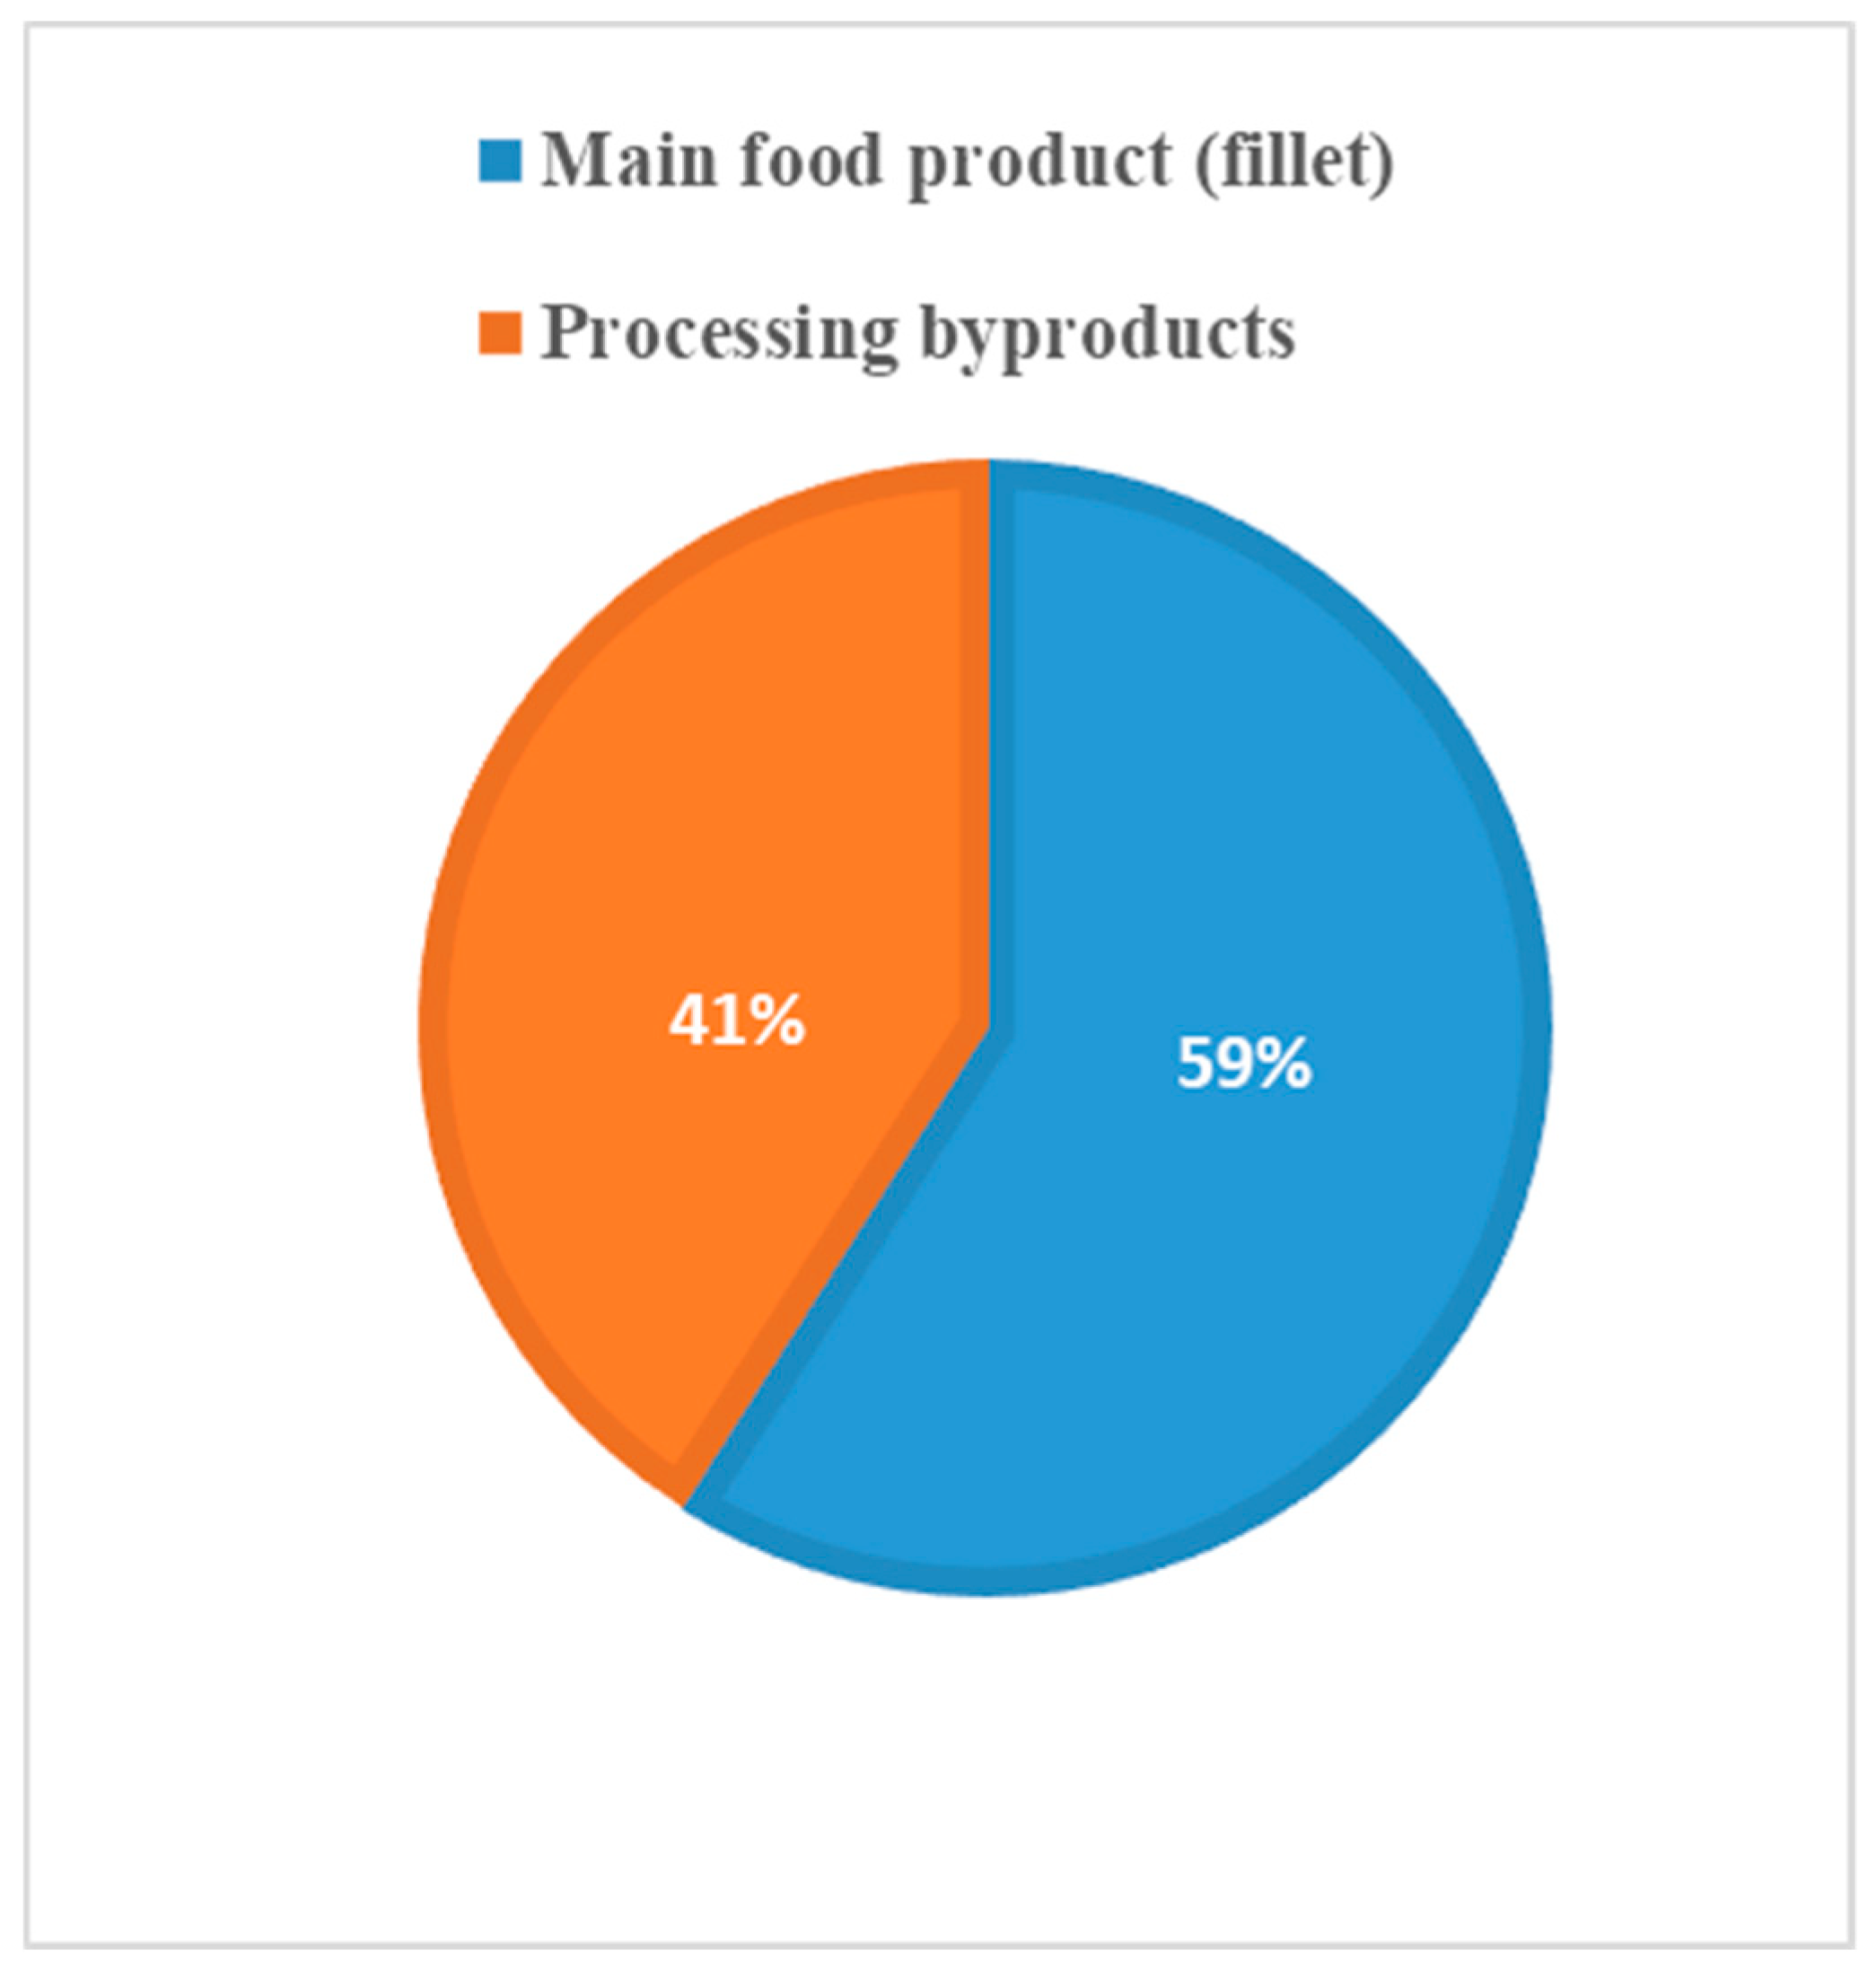
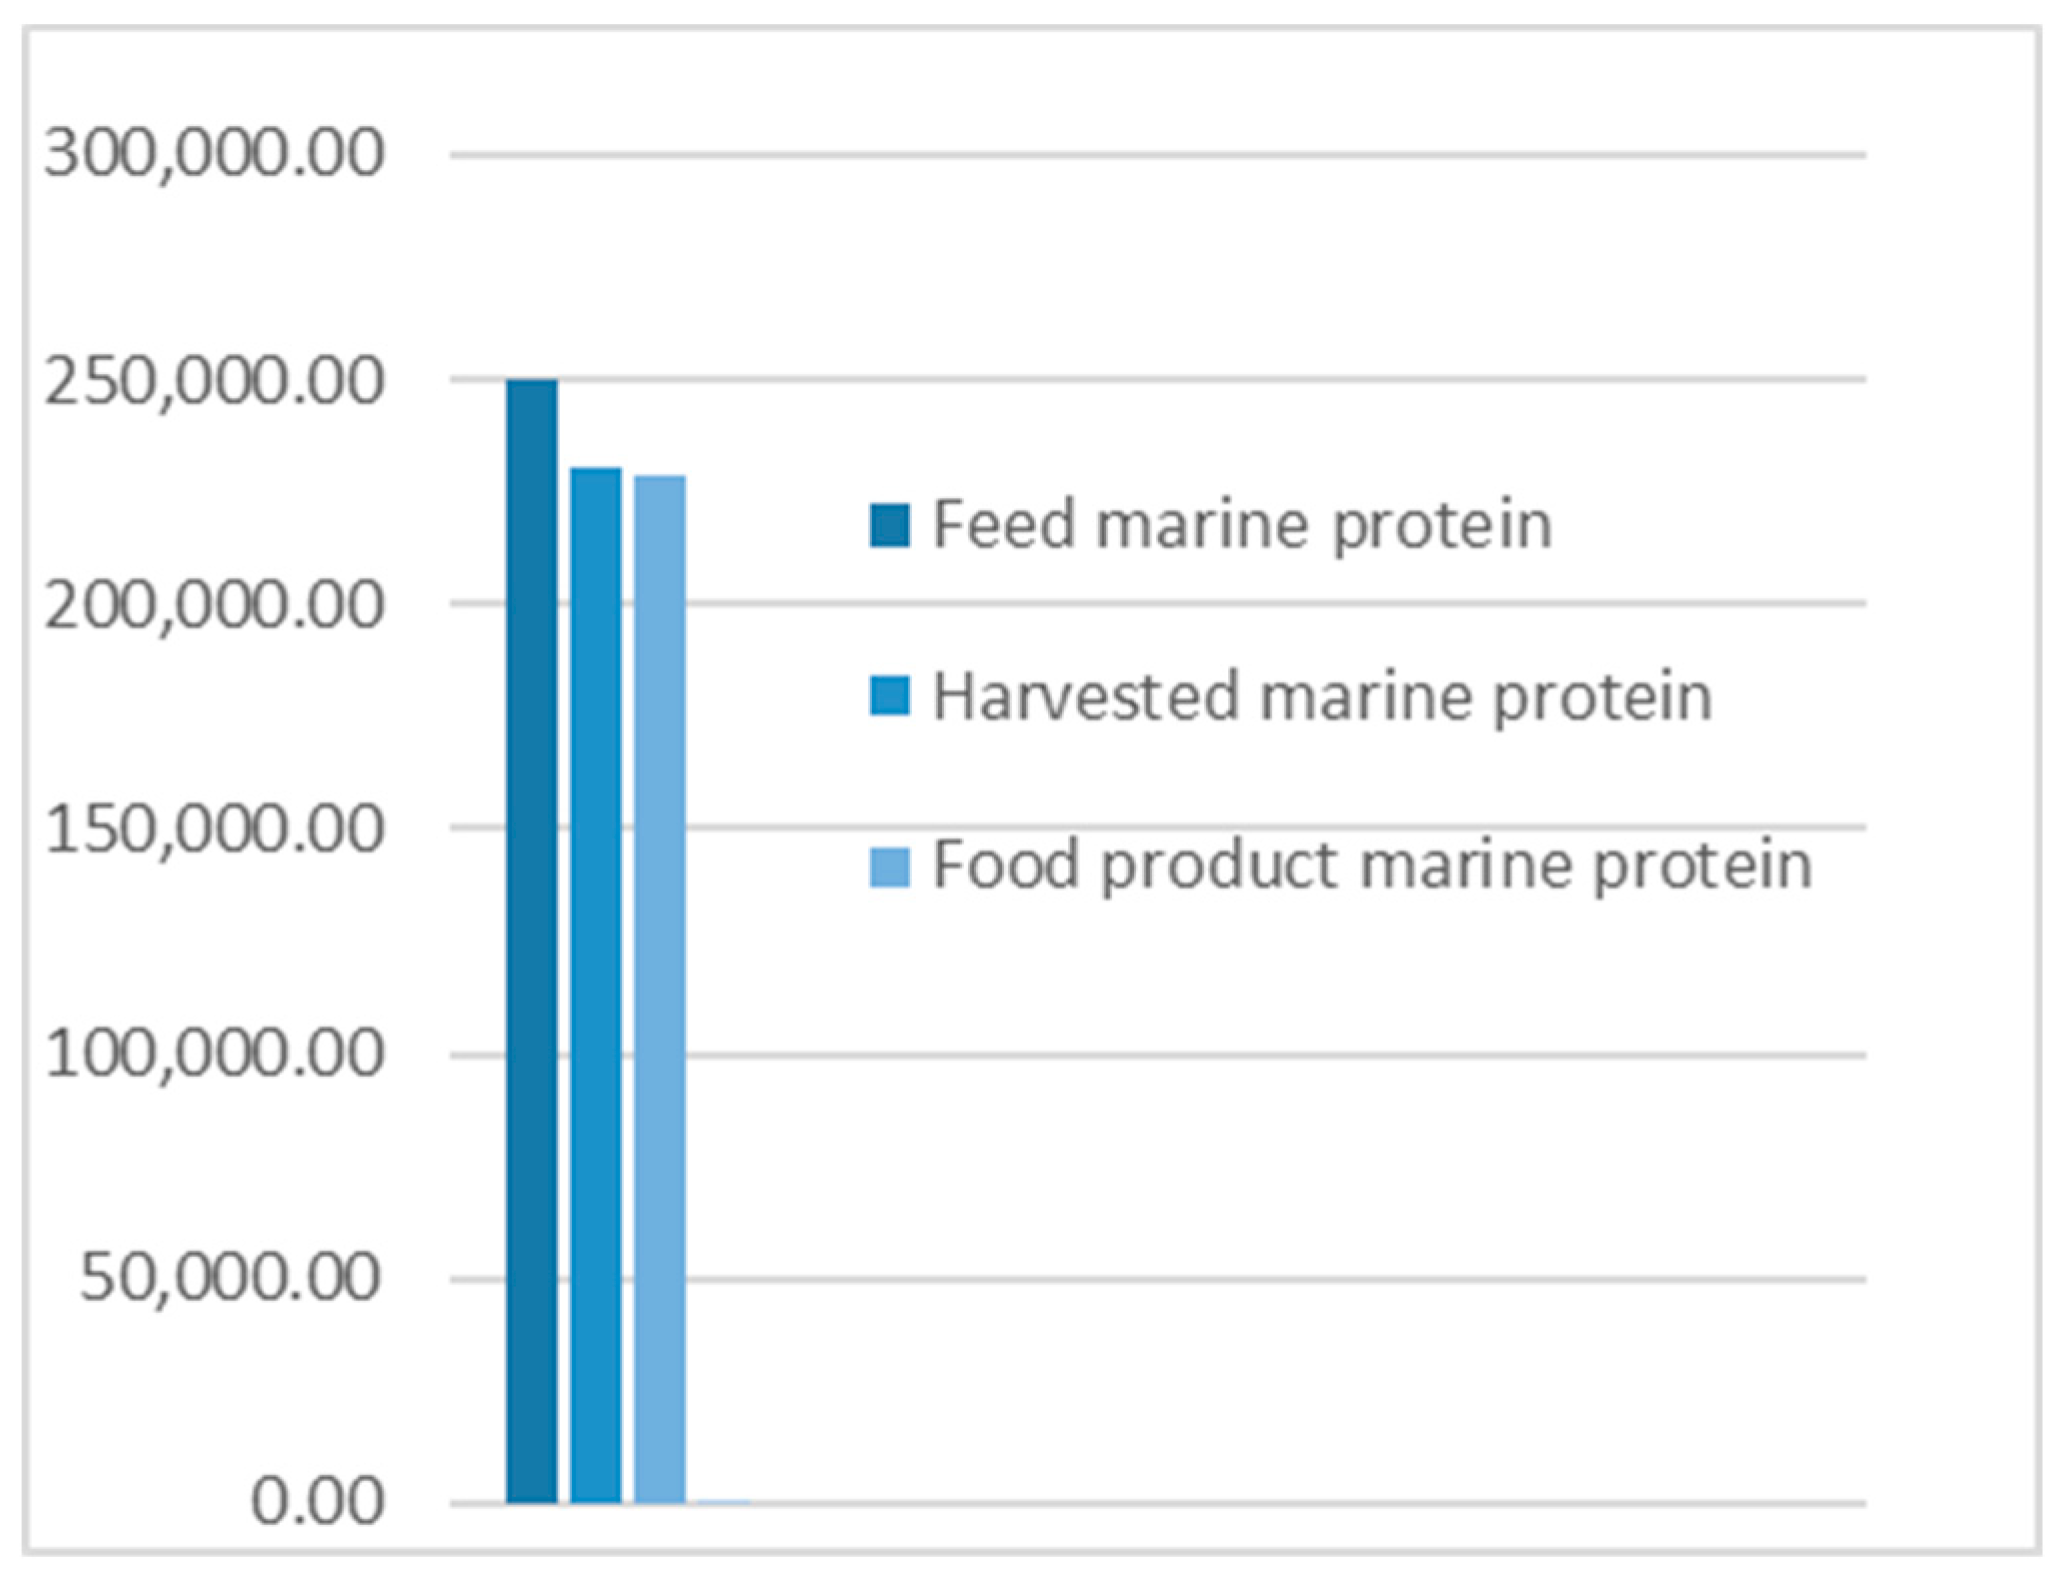
- The results from applying protein SFA provided a clear picture about the system and the material. The total harvested salmon protein equaled less than 25% of the invested feed protein (Figure 2). The marine protein ingredient of the feed pellets equaled 10% more than the total harvested salmon protein (Figure 3). Approximately 41% of the total harvested salmon protein departed the human food chain for good as silage used for other industries (Figure 4). The estimated 85 kilotons of protein that turned into silage was embodied in approximately 650 kilotons of biomass. The quantity of protein in the model can reflect how nutrient-costly it is to produce salmon and how much of that salmon biomass is being lost during post-harvest processing.
- The method of SFA modeling of the quantity of protein flowing through the farmed salmon value chain served the objectives of FL assessment and reduction. Targeting protein, a biomolecule and a macronutrient, as an indicator substance provided a qualitative description of the material based on its optimum nutritional potential before the protein is broken down into other substances and nitrogen compounds. The method of substance flow analysis provided guidance on how to model a system and to quantify the flows and stocks of the traced substance; however, achieving the concept of 100% mass balance was not possible due to the complexity of biological processes and how the protein passes through fish metabolism, after which part of it is secreted as nitrogen compounds in feces and urine or breaks down during ensiling hydrolysis.
- Uncertainties of the SFA model result from seasonal and geographical variations, as this study included the three interlinked subsystems that structure this production system, and each subsystem has a level of independence, is geographically distant, and has operational needs and circumstances. We acknowledge the ambiguity due to variations in the size of the escaped fish, the number of dead and escapee fish, the amount of spilled feed, the seasonal variations in salmon physiology, and the percentage of protein content in the tissue. The available information and data covered most of the system and processes, with the exception of the miscellaneous uses of the silage (flow number 17). The reason for such a hazy description is that there are several experimental uses that are still under development.
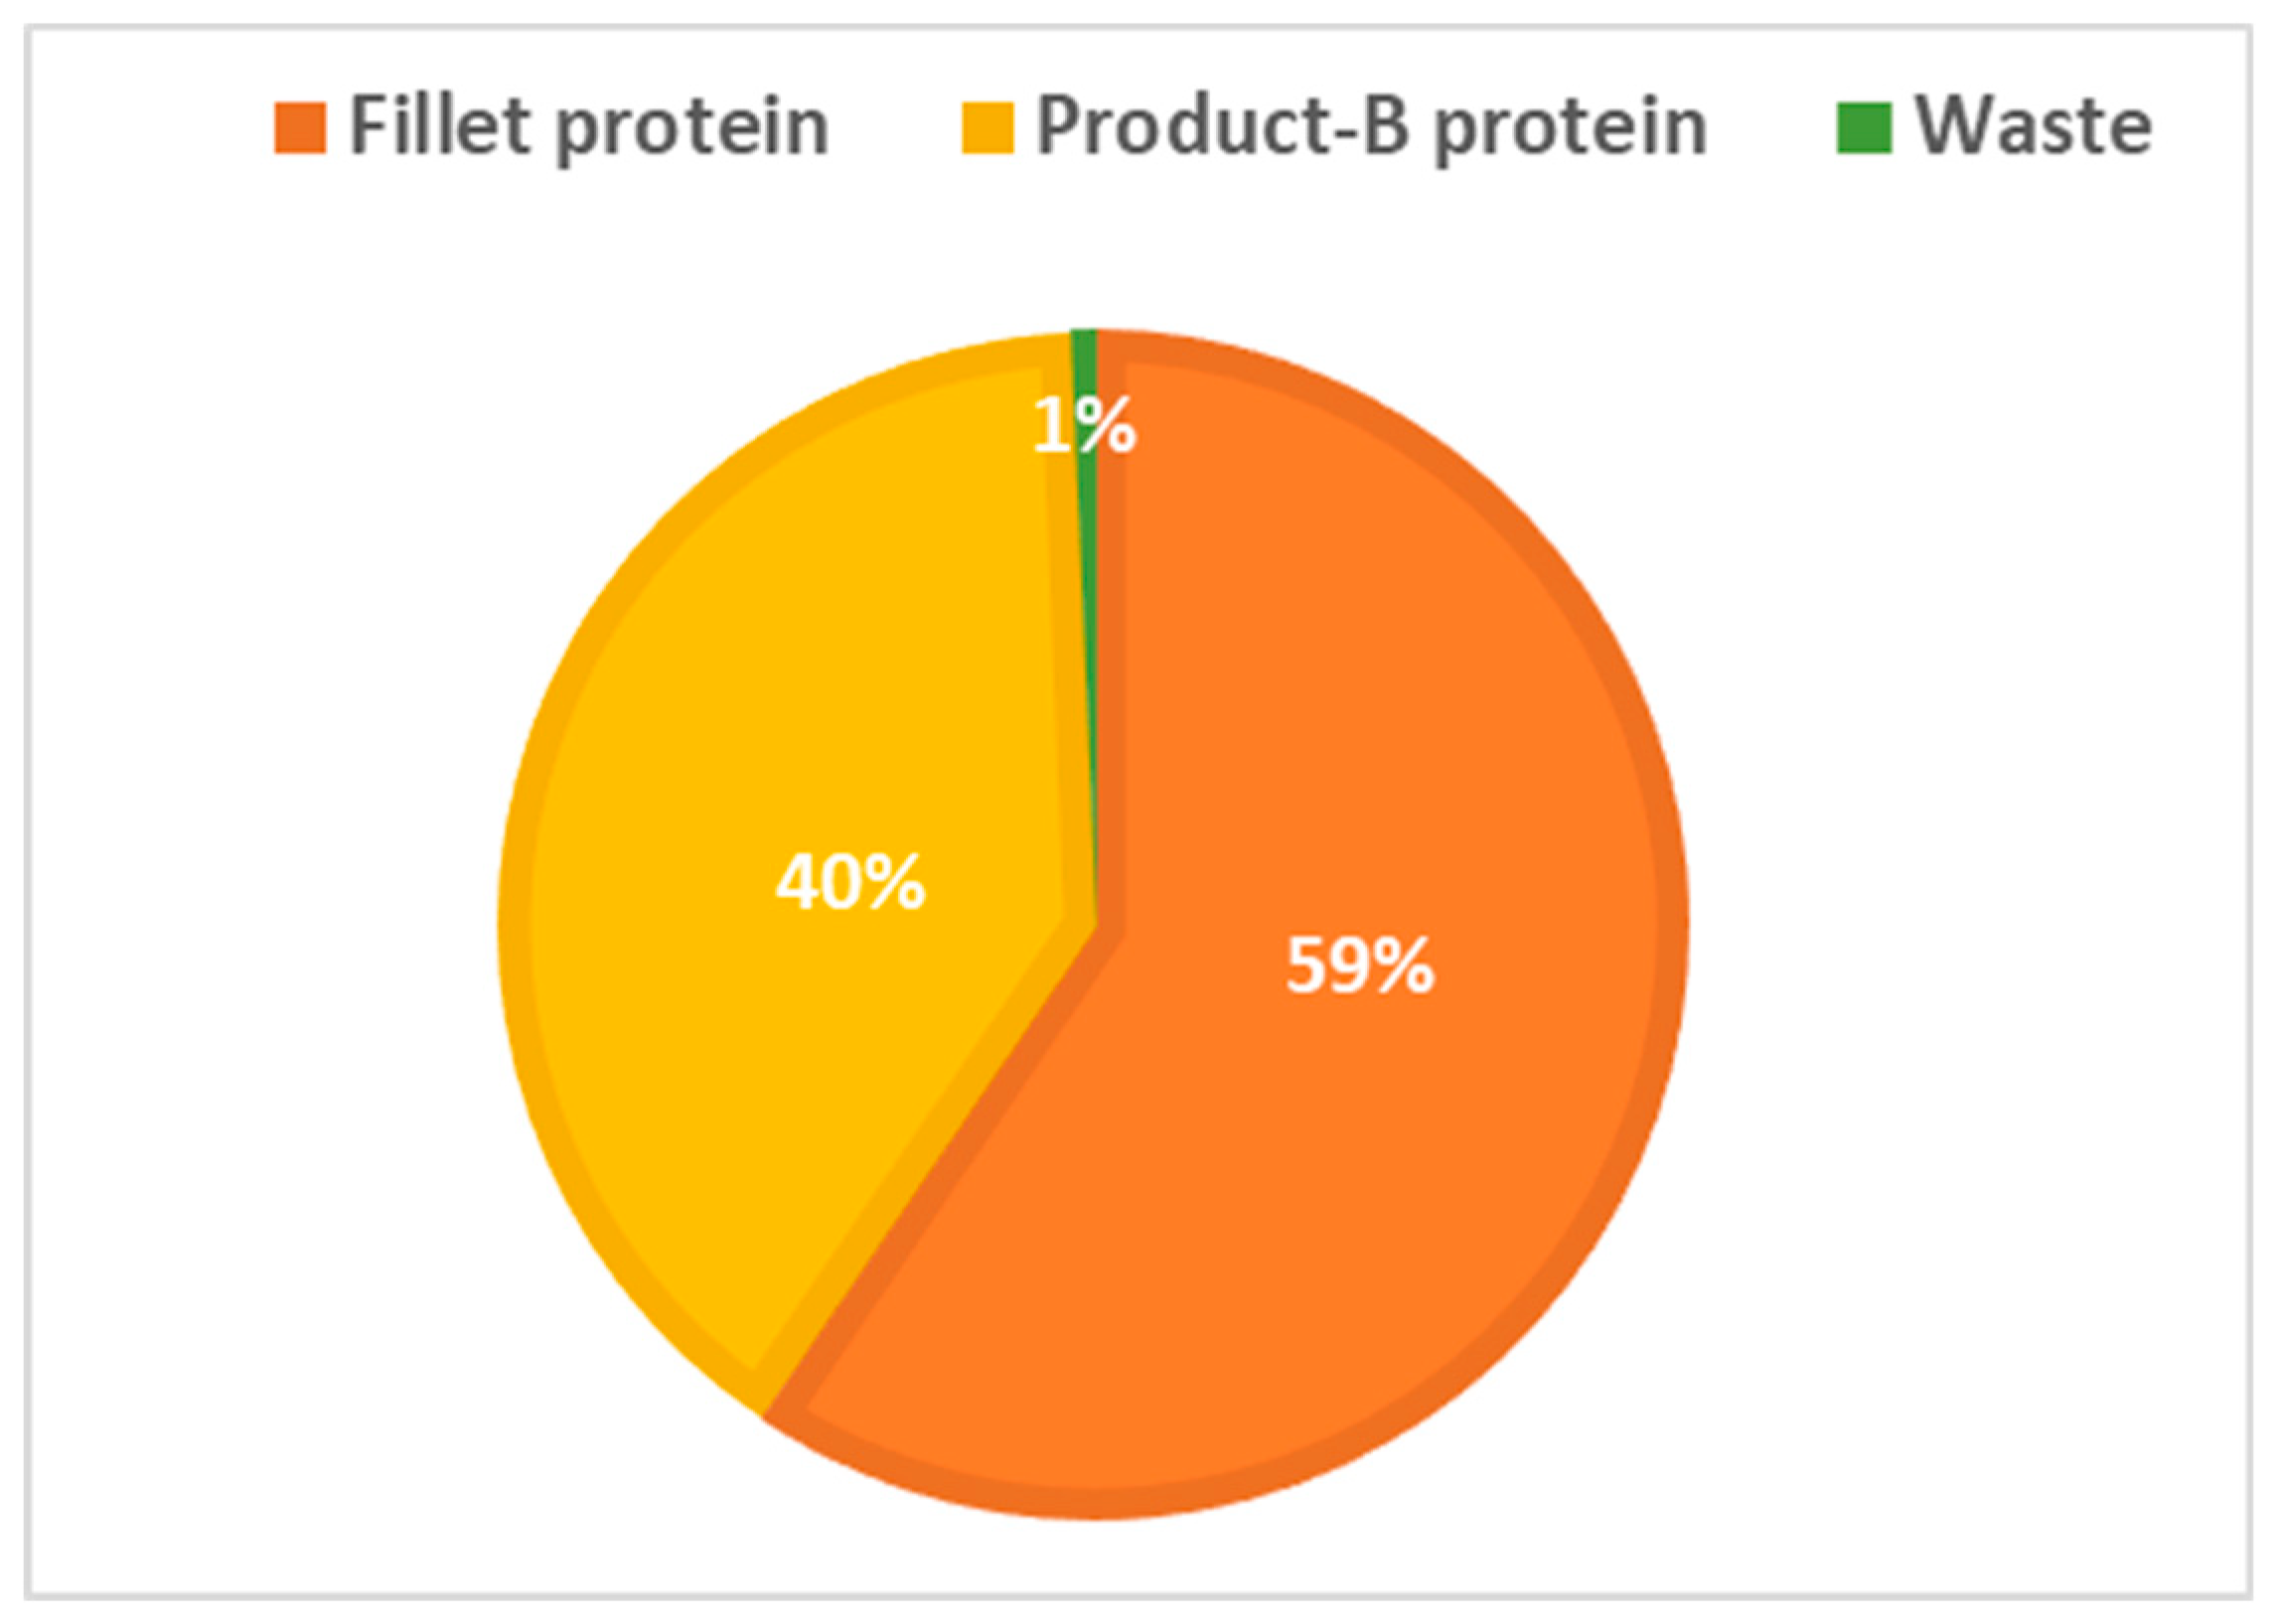
- The alternative scenario in Section 3.2 (Figure 5) is based on further processing of the by-product material to re-introduce it as a marketable, quality food product that contains approximately 40% of the post-harvest protein (Figure 6). That will improve the system’s efficiency and bring more balance between invested and harvested marine protein (Figure 7) with increase in the protein quantity that becomes available for human consumers. In this alternative scenario, we highlighted the desirable impact of developing a new food product to be produced in parallel to salmon fillets, in a clear invitation to food scientists and product developers. The invested marine protein ingredient in salmon feed usually comes from anchovies and sardines, two fish species that are typically food-processed for canning. Creating a canned food product from the rest of the raw material of salmon provides a nutrient-dense, affordable sea food product with a long shelf life and that is ready to eat. Such a product would be a valuable compensation for the marine protein consumed as salmon feed. With the right recipe and a good marketing plan, the monetary revenue from turning the down-graded raw material remains to an affordable nutrient-dense seafood product would be substantial. This scenario, if materialized, would put an extra 650 kilotons of seafood on the global food table. The most significant limitation of this scenario is the quality status of the salmon by-products upon delivery for processing and their fitness for food ingredients. For this scenario to emerge and function, by-products need to reach the processing line with acceptable microbial load and free from spoilage. This raises the importance of localizing responsibility over salmon by-products on the same post-harvest processing facility for quick processing and for ensuring the freshness of the material, preceding microbial growth and rancidity. In this scenario, both the salmon fillet product and the hypothetical product B must come out of the same factory.
- Other scenarios based on dry matter extraction of protein and fat out of salmon by-products could be suggested. Macronutrient recovery from by-products would have a positive effect on the system’s efficiency and FL reduction “if” the recovered protein and fat were used as food. However, the total utilized biomass would be much less in comparison to the quantity in the first alternative scenario suggested by this study. Nutrient recovery requires further processing, associated with more production complications and costs. The main concept of this study was to consider macronutrients as indicators of the food material, not as a distinct target from the rest of the biomass. Our targeted FL reduction would be achieved if we were to manage to turn the whole 650 kilotons of salmon by-products into a food product, including but not limited to their 85-kiloton protein content.
5. Concluding Remarks
Author Contributions
Funding
Acknowledgments
Conflicts of Interest
References
- Ojeda, D.; Sasser, J.S.; Lunstrum, E. Malthus’s specter and the anthropocene. Gend. Place Cult. 2020, 27, 316–332. [Google Scholar] [CrossRef]
- Bran, F.; Ioan, I.; Radulescu, C.V. The Malthusian Dilemma on the Threshold of the Third Millennium. In Proceedings of the Managerial Challenges of the Contemporary Society, Cluj-Napoca, Romania, 7–8 June 2013; pp. 50–54. [Google Scholar]
- FAO; IFAD; UNICEF; WFP; WHO. The State of Food Security and Nutrition in the World 2019. The State of Food Security and Nutrition in the World (SOFI): Safeguarding against Economic Slowdowns and Downturns. 2019. World Food Programme Website. Available online: https://www.wfp.org/publications/2019-state-food-security-and-nutrition-world-sofi-safeguarding-against-economic (accessed on 11 February 2020).
- United Nations (UN), Department of Economic and Social Affairs, Population Division. World Population, World Population Prospects 2019: Highlights (ST/ESA/SER.A/423); United Nations: New York, NY, USA, 2019; pp. 1–46. Available online: https://population.un.org/wpp/Publications/ (accessed on 14 January 2020).
- Steiner, G.; Geissler, B.; Schernhammer, E.S. Hunger and Obesity as Symptoms of Non-Sustainable Food Systems and Malnutrition. Appl. Sci. 2019, 9, 1062. [Google Scholar] [CrossRef]
- United Nations (UN). Transforming Our World: The 2030 Agenda for Sustainable Development. 2016. United Nations Website. Available online: http://wedocs.unep.org/bitstream/handle/20.500.11822/11125/unep_swio_sm1_inf7_sdg.pdf?sequence=1 (accessed on 14 January 2020).
- Food and Agriculture Organization (FAO). Food Wastage Footprint, Impacts on Natural Resources. 2013. FAO Website. Available online: http://www.fao.org/sustainable-food-value-chains/library/details/en/c/266219/ (accessed on 20 January 2020).
- Food and Agriculture Organization (FAO). Global Food Losses and Food Waste–Extent, Causes and Prevention. 2011. FAO Website. Available online: http://www.fao.org/3/a-i2697e.pdf (accessed on 28 April 2020).
- Ishangulyyev, R.; Kim, S.; Lee, S.H. Understanding Food Loss and Waste—Why Are We Losing and Wasting Food? Foods 2019, 8, 297. [Google Scholar] [CrossRef] [PubMed]
- Vázquez-Rowe, I.; Laso, J.; Margallo, M.; Garcia-Herrero, I.; Hoehn, D.; Amo-Setién, F.; Bala, A.; Abajas, R.; Sarabia, C.; Durá, M.J.; et al. Food loss and waste metrics: A proposed nutritional cost footprint linking linear programming and life cycle assessment. Int. J. Life Cycle Assess. 2019, 25, 1197–1209. [Google Scholar] [CrossRef]
- Rezaei, M.; Liu, B. Food Loss and Waste in the Food Supply Chain; International Nut and Dried Fruit Council: Reus, Spain, 2017; pp. 26–27. [Google Scholar]
- Dora, M.; Wesana, J.; Gellynck, X.; Seth, N.; Dey, B.; De Steur, H. Importance of sustainable operations in food loss: Evidence from the Belgian food processing industry. Ann. Oper. Res. 2019. [Google Scholar] [CrossRef]
- Lipinski, B.; Hanson, C.; Lomax, J.; Kitinoja, L.; Waite, R.; Searchinger, T. Reducing food loss and waste. World Resour. Inst. Work. Pap. 2013, 1, 1–40. [Google Scholar]
- Abualtaher, M.; Skjøndal Bar, E. Systems Engineering Approach to Food Loss Reduction in Norwegian Farmed Salmon Post-Harvest Processing. Systems 2020, 8, 4. [Google Scholar] [CrossRef]
- Das, H.; Singh, S.K. Useful byproducts from cellulosic wastes of agriculture and food industry—A critical appraisal. Crit. Rev. Food Sci. Nutr. 2004, 44, 77–89. [Google Scholar] [CrossRef]
- Laufenberg, G.; Kunz, B.; Nystroem, M. Transformation of vegetable waste into value added products: (A) the upgrading concept; (B) practical implementations. Bioresour. Technol. 2003, 87, 167–198. [Google Scholar] [CrossRef]
- Klitkou, A.; Fevolden, A.M.; Capasso, M. From Waste to Value: Valorisation Pathways for Organic Waste Streams in Circular Bioeconomies; Routledge: Abingdon, UK, 2019. [Google Scholar]
- Muhlack, R.A.; Potumarthi, R.; Jeffery, D.W. Sustainable wineries through waste valorisation: A review of grape marc utilisation for value-added products. Waste Manag. 2018, 72, 99–118. [Google Scholar] [CrossRef]
- Kim, J.-S.; Park, J.W. Mince from Seafood Processing By-Product and Surimi as Food Ingredients, in Maximising the Value of Marine By-Products; Elsevier: Amsterdam, The Netherlands, 2007; pp. 196–228. [Google Scholar]
- Katayama, M.; Wilson, L.A. Utilization of okara, a byproduct from soymilk production, through the development of soy-based snack food. J. Food Sci. 2008, 73, S152–S157. [Google Scholar] [CrossRef] [PubMed]
- Food and Agriculture Organization (FAO). The State of World Fisheries and Aquaculture 2018—Meeting the Sustainable Development Goals. 2018. FAO Website. Available online: http://www.fao.org/documents/card/en/c/I9540EN/ (accessed on 15 February 2020).
- Ernst & Young AS (EY). The Norwegian Aquaculture Analysis: An Overview. 2017. EY Website. Available online: www.ey.com (accessed on 15 February 2020).
- United Nations Food and Agriculture Organization (FAO). Globefish Highlights April 2020 Issue, with Annual 2019 Statistics–A Quarterly Update on World Seafood Markets. 2020. Available online: http://www.fao.org/documents/card/en/c/ca9528en/ (accessed on 10 June 2020).
- Hjelt, K.A. Norwegian regulation system and the history of the Norwegian salmon farming industry. In Proceedings of the International Symposium on Cage Aquaculture in Asia, Tungkang, Pingtung, Taiwan, 2–6 November 1999; AFS; WAS-SC. 2000. [Google Scholar]
- Aquaculture-Act, Act of 17 June 2005 No. 79 Relating to Aquaculture. 2005. Directorate of Fisheries Website. Available online: https://www.fiskeridir.no/English/Aquaculture/Aquaculture-Act (accessed on 15 April 2020).
- Abualtaher, M.; Bar, E.S. Review of applying material flow analysis-based studies for a sustainable Norwegian Salmon aquaculture industry. J. Appl. Aquac. 2019, 32, 1–15. [Google Scholar] [CrossRef]
- Abolofia, J.; Asche, F.; Wilen, J.E. The Cost of Lice: Quantifying the Impacts of Parasitic Sea Lice on Farmed Salmon. Mar. Resour. Econ. 2017, 32, 329–349. [Google Scholar] [CrossRef]
- Hersoug, B. The greening of Norwegian salmon production. Marit. Stud. 2015, 14, 16. [Google Scholar] [CrossRef]
- Norwegian Ministry of Foreign Affairs. Norway’s Follow-Up of Agenda 2030 and the Sustainable Development Goals. 2016; Norwegian Government Website. Available online: https://www.regjeringen.no/en/dokumenter/follow-up-sdg2/id2507259/ (accessed on 17 January 2020).
- Ytrestøyl, T.; Aas, T.S.; Berge, G.M.; Hatlen, B.; Sørensen, M.; Ruyter, B.; Åsgård, T.E. Resource Utilisation and Eco-Efficiency of Norwegian Salmon Farming in 2010. 2011. Available online: https://nofima.no/en/publication/1161982/ (accessed on 14 March 2020).
- Olsen, R.L.; Toppe, J.; Karunasagar, I. Challenges and realistic opportunities in the use of by-products from processing of fish and shellfish. Trends Food Sci. Technol. 2014, 36, 144–151. [Google Scholar] [CrossRef]
- Exler, J.; Pehrsson, P.R. Nutrient content and variability in newly obtained salmon data for USDA Nutrient Database for Standard Reference. FASEB J. 2007, 21, A315. [Google Scholar] [CrossRef]
- Atanasoff, A.; Nikolov, G.; Staykov, Y.; Zhelyazkov, G.; Sirakov, I. Proximate and mineral analysis of Atlantic salmon (Salmo Salar) cultivated in Bulgaria. Biotechnol. Anim. Husb. 2013, 29, 571–579. [Google Scholar] [CrossRef]
- Polotow, T.G.; Vardaris, C.V.; Mihaliuc, A.R.; Gonçalves, M.S.; Pereira, B.; Ganini, D.; Barros, M.P. Astaxanthin Supplementation Delays Physical Exhaustion and Prevents Redox Imbalances in Plasma and Soleus Muscles of Wistar Rats. Nutrients 2014, 6, 5819–5838. [Google Scholar] [CrossRef]
- Friedman, M. Nutritional Value of Proteins from Different Food Sources. A Review. J. Agric. Food Chem. 1996, 44, 6–29. [Google Scholar] [CrossRef]
- Cowey, C.; Daisley, K.; Parry, G. Study of amino acids, free or as components of protein, and of some B vitamins in the tissues of the Atlantic salmon, Salmo salar, during spawning migration. Comp. Biochem. Physiol. 1962, 7, 29–38. [Google Scholar] [CrossRef]
- Biomar. Integrated Sustainability Report 2019. 2019. BioMar Website. Available online: https://www.biomar.com/en/global/sustainability/sustainability-report/#refid-42178 (accessed on 5 May 2020).
- Biomar. Sustainability Report 2018. 2018. BioMar Website. Available online: https://www.biomar.com/globalassets/.global/pdf-files/biomar-group-sustainability-report-2018.pdf (accessed on 5 May 2020).
- Aas, T.S.; Åsgård, T.E. Estimated Content of Nutrients and Energy in Feed Spill and Faeces in Norwegian Salmon Culture. 2017. Available online: https://nofima.no/en/publication/1480919/ (accessed on 18 February 2020).
- Arason, S. Production of Fish Silage in Fisheries Processing: Biotechnological Applications; Martin, A., Ed.; Chapman & Hall: London, UK, 1994; pp. 244–272. [Google Scholar]
- Ramírez, A. Salmon By-Product Proteins; FAO Fisheries Circular. No. 1027; Food and Agriculture Organization of the United Nations (FAO): Rome, Italy, 2007; p. 31. [Google Scholar]
- Gbogouri, G.A.; Linder, M.; Fanni, J.; Parmentier, M. Influence of Hydrolysis Degree on the Functional Properties of Salmon Byproducts Hydrolysates. J. Food Sci. 2004, 69, C615–C622. [Google Scholar] [CrossRef]
- Bechtel, P.; Sathivel, S.; Oliveira, A. Alkali Extracted Protein Fractions from Salmon Byproducts. In Annual IFT Meeting; New Orleans, Louisiana, USA. 2005. Available online: https://www.ars.usda.gov/research/publications/publication/?seqNo115=181828 (accessed on 25 June 2020).
- Bechtel, P.J. Properties of different fish processing by-products from pollock, cod and salmon. J. Food Process. Preserv. 2003, 27, 101–116. [Google Scholar] [CrossRef]
- Stevens, J.R.; Newton, R.W.; Tlusty, M.; Little, D.C. The rise of aquaculture by-products: Increasing food production, value, and sustainability through strategic utilisation. Mar. Policy 2018, 90, 115–124. [Google Scholar] [CrossRef]
- Brunner, P.H.; Rechberger, H. Practical Handbook of Material Flow Analysis; Taylor & Francis e-Library: Abingdon, UK, 2005; Volume 1, pp. 35–65. [Google Scholar]
- Huang, C.L.; Vause, J.; Ma, H.W.; Yu, C.P. Using material/substance flow analysis to support sustainable development assessment: A literature review and outlook. Resour. Conserv. Recycl. 2012, 68, 104–116. [Google Scholar] [CrossRef]
- Brunner, P.H. Substance Flow Analysis. J. Ind. Ecol. 2012, 16, 293–295. [Google Scholar] [CrossRef]
- Bringezu, S.; Fischer-Kowalski, M.; Kleijn, R.; Palm, V. Regional and National Material Flow Accounting. From Paradigm to Practice of Sustainability, no 4. In Proceedings of the Con-Account Workshop January, Leiden, The Netherlands, 21–23 January 1997; pp. 32–42. [Google Scholar]
- Norway Directorate of Fisheries. County Overview of Reported Biomass Figures from Norwegian Aquaculture Plants with Salmon Production of Salmon and Rainbow Trout in Seawater. 2020; Directorate Fisheries Website. Available online: https://www.fiskeridir.no/Akvakultur/Tall-og-analyse/Biomassestatistikk/Biomassestatistikk-etter-fylke (accessed on 10 April 2020).
- Aas, T.S.; Ytrestøyl, T.; Aasgaard, T. Utilization of feed resources in the production of Atlantic salmon (Salmo salar) in Norway: An update for 2016. Aquac. Rep. 2019, 15, 100216. [Google Scholar] [CrossRef]
- Norway Directorate of Fisheries. Statistics on Escapes. Norway Directorate of Fisheries. 2020; Directorate Fisheries Website. Available online: https://www.fiskeridir.no/Akvakultur/Tall-og-analyse/Roemmingsstatistikk/Roemmingsstatistikk-antall-og-art (accessed on 2 March 2020).
- Sierra Lopera, L.M.; Sepúlveda Rincón, C.T.; Vásquez Mazo, P.; Figueroa Moreno, O.A.; Zapata Montoya, J.E. Byproducts of Aquaculture process: Development and prospective uses. Review. Vitae 2018, 25, 128–140. [Google Scholar] [CrossRef]
- Rustad, T. Maximising the Value of Marine By-Products (Chapter Physical and Chemical Properties of Protein Seafood By-Products); Woodhead Publishing in Food Science, Technology and Nutrition; Shahidi, F., Ed.; CRC Press: Boca Raton, FL, USA; Woodhead Publishing: Cambridge, UK, 2007; pp. 3–18. [Google Scholar]
- Falch, E.; Rustad, T.; Aursand, M. By-products from gadiform species as raw material for production of marine lipids as ingredients in food or feed. Process Biochem. 2006, 41, 666–674. [Google Scholar] [CrossRef]
- Skara, T.; Sivertsvik, M.; Birkeland, S. Production of salmon oil from filleting byproducts-Effects of storage conditions on lipid oxidation and content of omega-3 polyunsaturated fatty acids. J. Food Sci. 2004, 69, E417–E421. [Google Scholar] [CrossRef]
- Shumilina, E.; Slizyte, R.; Mozuraityte, R.; Dykyy, A.; Stein, T.A.; Dikiy, A. Quality changes of salmon by-products during storage: Assessment and quantification by NMR. Food Chem. 2016, 211, 803–811. [Google Scholar] [CrossRef]
- Winther, U.; Myhre, M.S. Verdiskapings-og Restråstoffanalyser i Norsk Sjømatnæring 2017–2019; SINTEF Ocean: Trondheim, Norway, 2019. [Google Scholar]
- Website Developed by Nofima, SINTEF Ocean and BarentsWatch. Sustainability in Aquaculture 2020. 2020. Sintef Ocean Website. Available online: https://www.barentswatch.no/en/havbruk/utilisation-of-residual-raw-materials (accessed on 14 March 2020).
- Hedbrant, J.; Sörme, L. Data Vagueness and Uncertainties in Urban Heavy-Metal Data Collection. Water Air Soil Pollut. Focus 2001, 1, 43–53. [Google Scholar] [CrossRef]


| Salmon Parts | Weight Fraction | Protein % |
|---|---|---|
| Whole fish | 100% | 16.9% |
| Blood | 2% | 5% |
| Viscera | 14% | 10% |
| Head | 10% | 15% |
| Filleting byproducts (i.e., backbone, belly bones, back fin, collarbone, tailpiece, belly flap, pin bones, fins, belly membrane, and skin) | 24% | ~12% |
| Fillet trims | 2% | 17% |
| Salmon fillet | 48% | 19% |
| Level of Uncertainty | Interval | Source(s) of Information | Example(s) |
|---|---|---|---|
| 0 | */1 | Official statistics | Norway salmon production in 2019 |
| 1 | */1.1 | Official statistics on local, regional, and national levels; values in general (from the literature); and information from the industry | Byproduct uses, protein content in salmon body parts, and feed content |
| 2 | */1.33 | Official statistics at the regional and national levels, and values in general (for content) | Monthly feed consumption in each region |
| 3 | */2 | Monitored data | Nitrogen compounds from protein hydrolysis |
| 4 | */4 | Values in general for flows (from the literature) | Sludge in fish cages |
| The Flows | Protein in Tons * | |||
|---|---|---|---|---|
| Flow | Description | Minimum | Average | Maximum |
| F1 | Plant protein feed ingredient | 630,883.085 | 697,125.81 | 763,368.533 |
| F2 | Marine protein feed ingredient | 227,557.332 | 250,313.065 | 275,344.372 |
| F3 | Feed pellets’ total protein content | 847,454.891 | 936,437.655 | 1,025,420.418 |
| F4 | Dead/escaped salmon protein | 114.03 | 131.12 | 148.2 |
| F5 | Spilled feed protein | 174,786.16 | 200,969.13 | 227,152.1 |
| F6 | Harvested salmon protein (whole fish) | 208,531.25 | 230,427.025 | 252,322.80 |
| F7 | Blood content of protein | 1190.617 | 1368.972 | 1547.326 |
| F8 | Head | 16,866.67 | 19,393.29 | 21,919.92 |
| F9 | Viscera | 16,668.646 | 20,332.414 | 21,662.572 |
| F10 | Filleting byproducts and trims (backbone, belly bones, back fin, collarbone, tailpiece, belly flap, pin bones, fins, tissues, belly membrane, and skin) | 38,337.885 | 44,080.9 | 49,823.915 |
| F11 | Food product for the market | 108,584.32 | 124,850.25 | 141,116.182 |
| F12 | Silage for biogas | 17,737.69 | 20,394.8 | 23,051.91 |
| F13 | Silage for livestock fodder | 15,766.84 | 18,128.71 | 20,490.58 |
| F14 | Silage for fish feed | 15,109.89 | 17,373.35 | 19,636.81 |
| F15 | Silage for pet feed | 11,168.18 | 12,841.17 | 14,514.16 |
| F16 | Silage for furred animals feed | 1313.90 | 1510.73 | 1707.55 |
| F17 | Silage for miscellaneous uses | 4598.66 | 5287.54 | 5976.42 |
| F18 | Waste from silage | 7299.46 | 8392.91 | 9486.37 |
© 2020 by the authors. Licensee MDPI, Basel, Switzerland. This article is an open access article distributed under the terms and conditions of the Creative Commons Attribution (CC BY) license (http://creativecommons.org/licenses/by/4.0/).
Share and Cite
Abualtaher, M.; Bar, E.S. Food-Loss Control at the Macronutrient Level: Protein Inventory for the Norwegian Farmed Salmon Production System. Foods 2020, 9, 1095. https://doi.org/10.3390/foods9081095
Abualtaher M, Bar ES. Food-Loss Control at the Macronutrient Level: Protein Inventory for the Norwegian Farmed Salmon Production System. Foods. 2020; 9(8):1095. https://doi.org/10.3390/foods9081095
Chicago/Turabian StyleAbualtaher, Mohd, and Eirin Skjøndal Bar. 2020. "Food-Loss Control at the Macronutrient Level: Protein Inventory for the Norwegian Farmed Salmon Production System" Foods 9, no. 8: 1095. https://doi.org/10.3390/foods9081095
APA StyleAbualtaher, M., & Bar, E. S. (2020). Food-Loss Control at the Macronutrient Level: Protein Inventory for the Norwegian Farmed Salmon Production System. Foods, 9(8), 1095. https://doi.org/10.3390/foods9081095