Comparison of Real-Time PCR Quantification Methods in the Identification of Poultry Species in Meat Products

Abstract
1. Introduction
2. Material and Methods
2.1. Material
2.1.1. Chemical Material
2.1.2. Sample Material
2.2. Methods
2.2.1. Bioinformatics
2.2.2. DNA Isolation
2.2.3. Real-Time PCR
Reaction Set-Up
Templates
2.2.4. Calculation
Method A: Quantification with Reference Material
Method B: Quantification with Matrix-Specific Multiplication Factors
Method C: Quantification with Internal Reference Sequence
2.2.5. Statistical Analysis
3. Results
3.1. Bioinformatics
3.2. Development of One Triplex and One Duplex Real-Time PCR System
3.3. Quantification
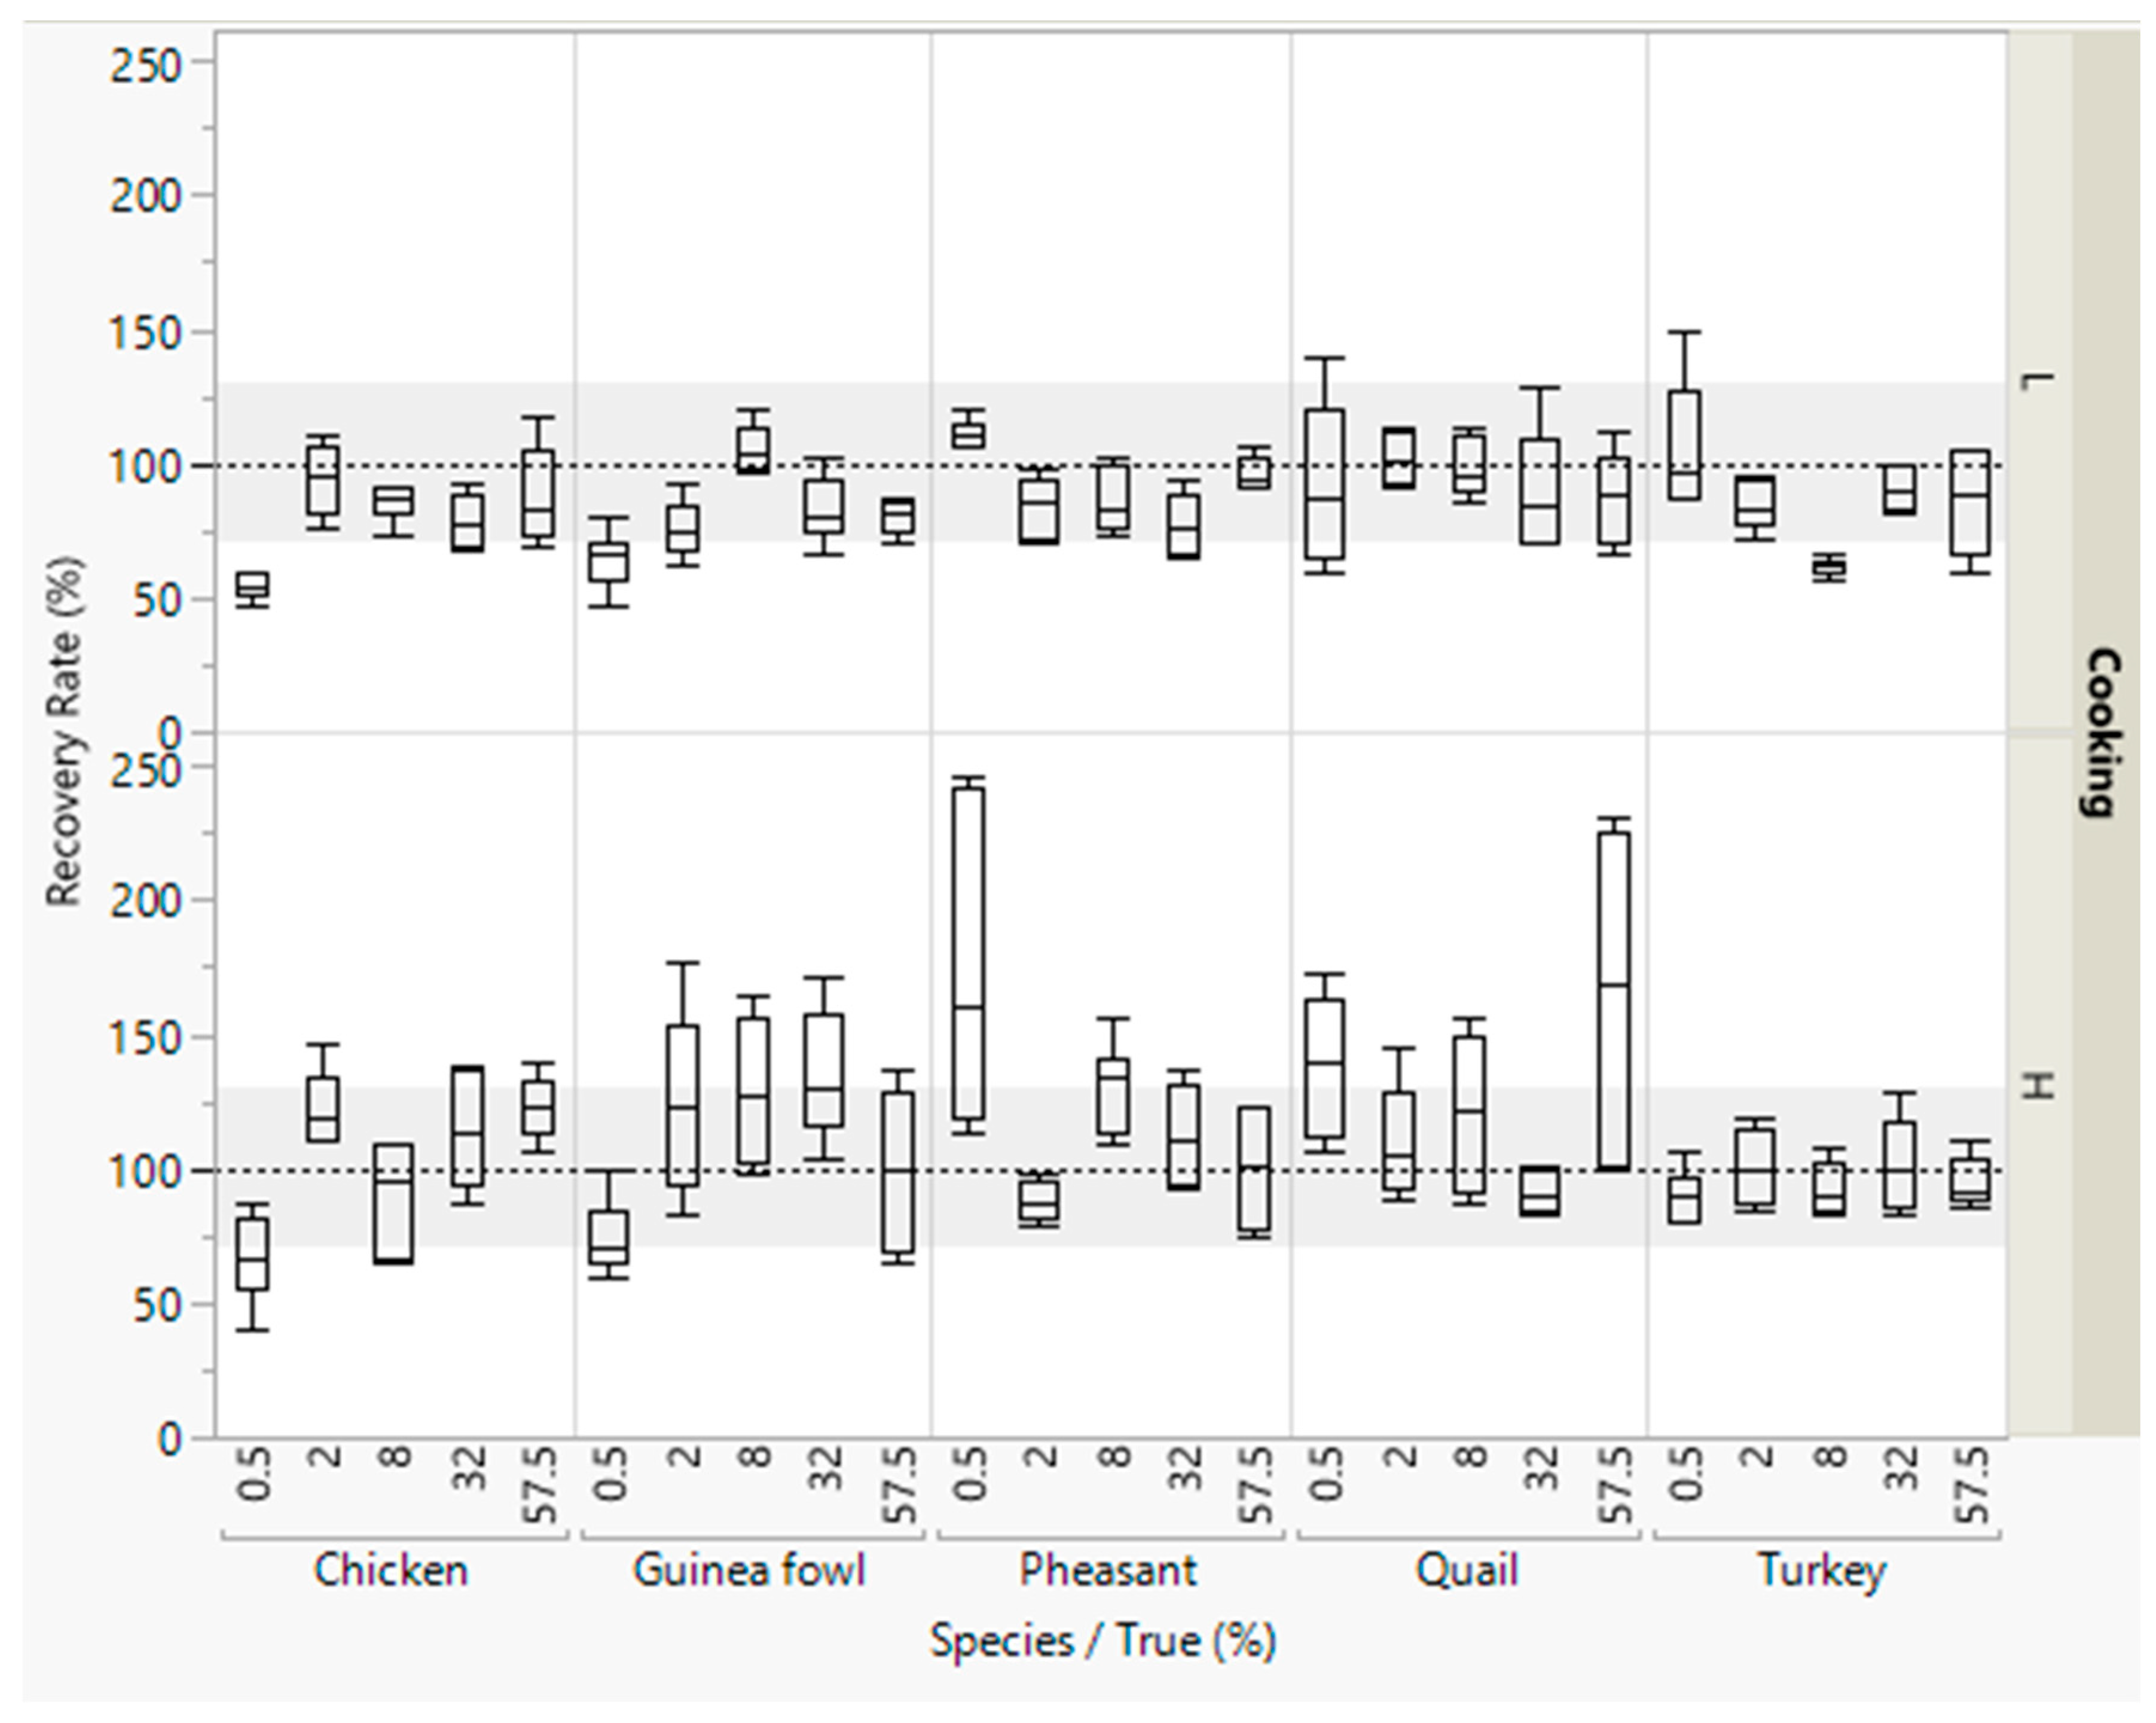
3.3.1. Method A: Quantification with Reference Material
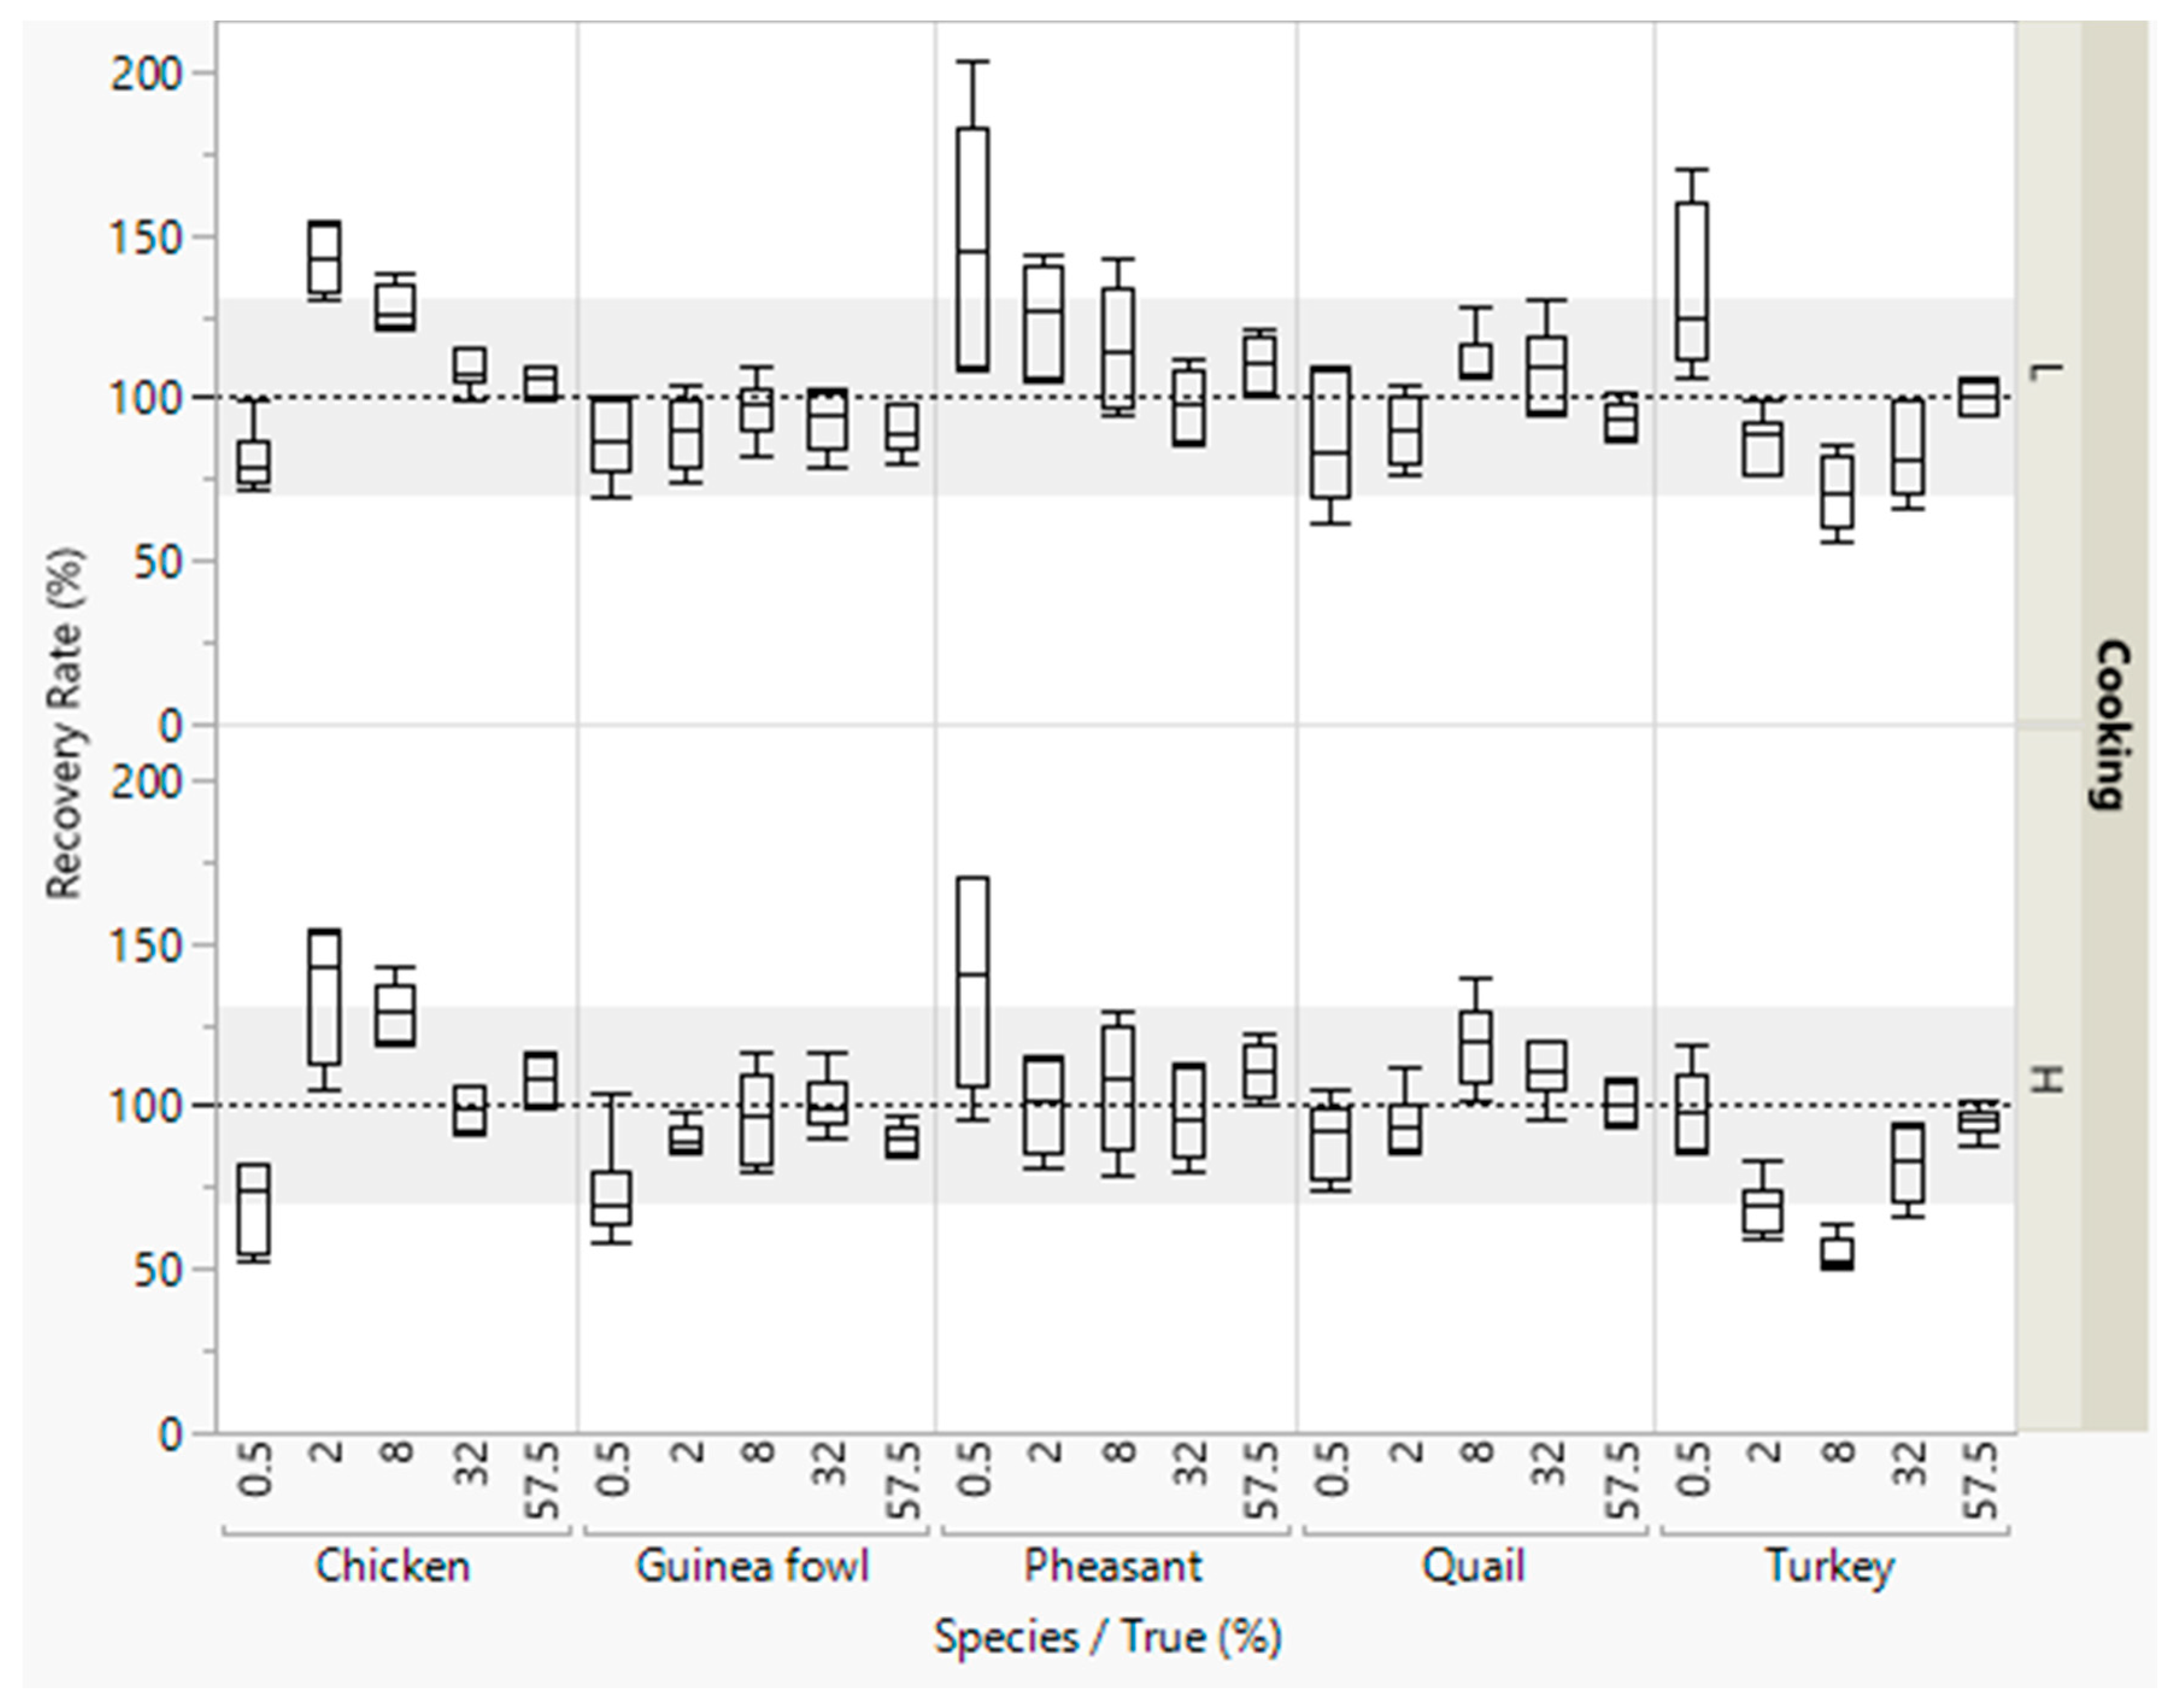
3.3.2. Method B: Quantification with Matrix-Specific Multiplication Factors
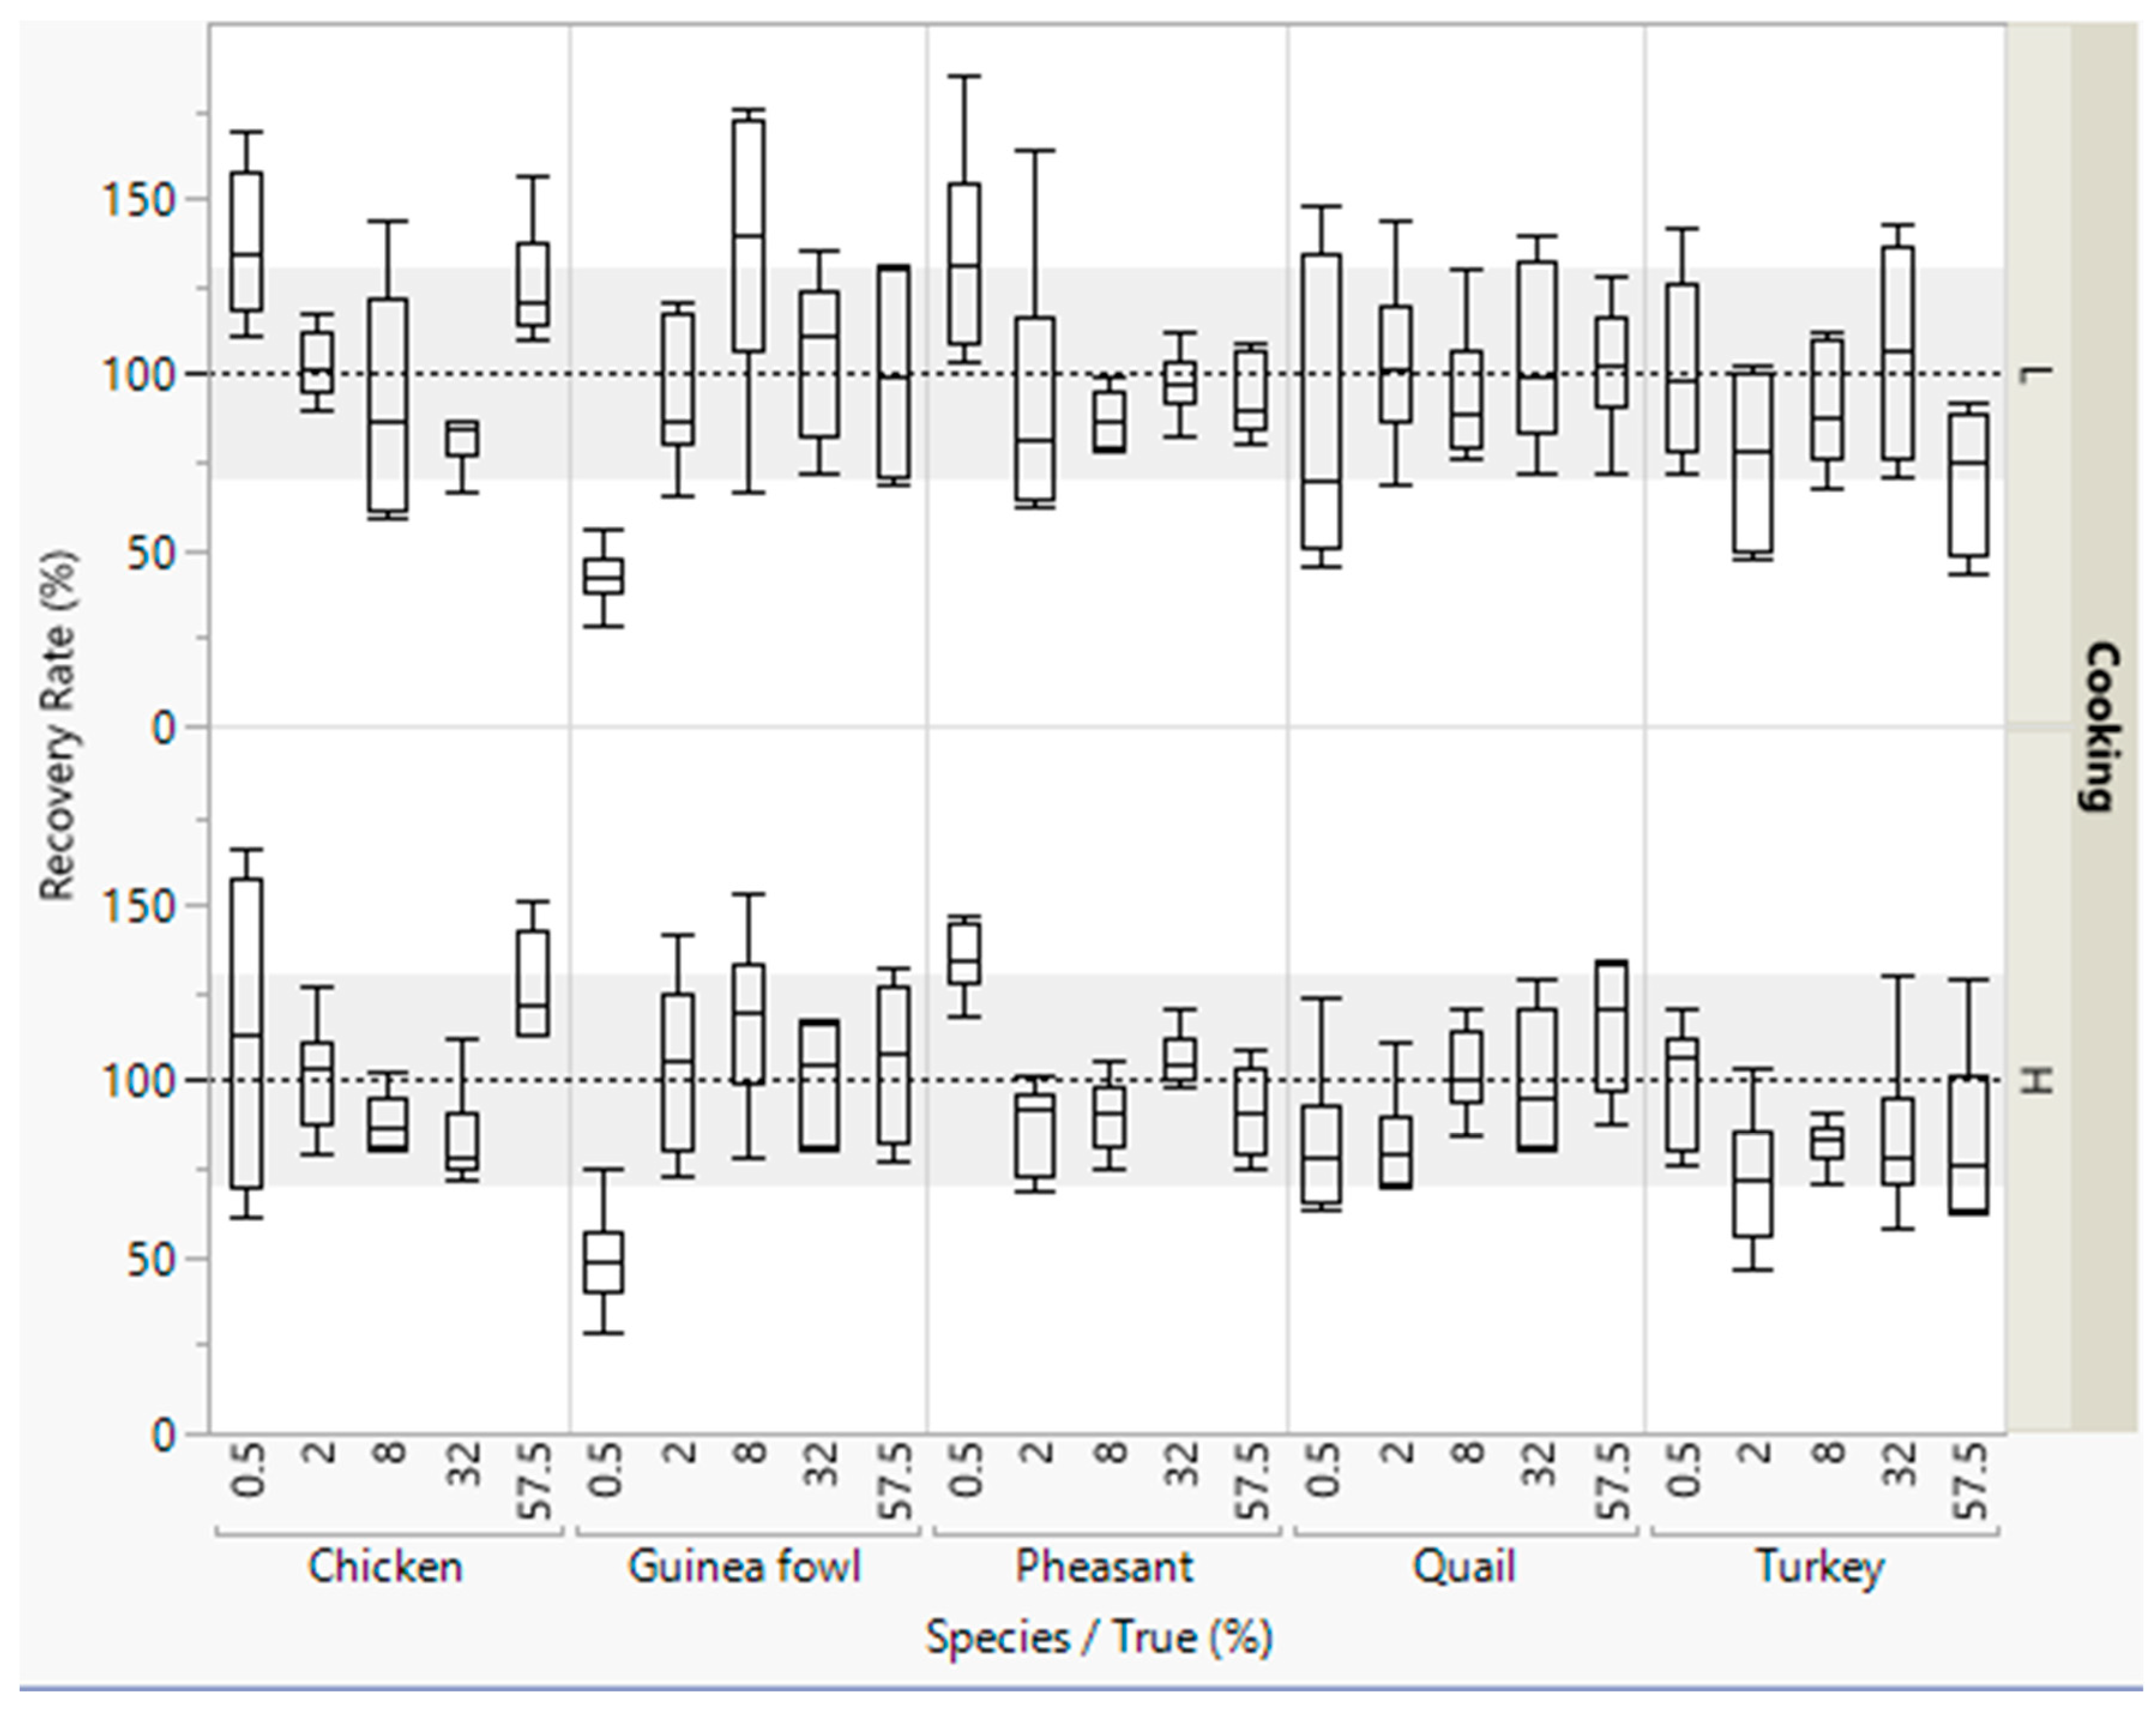
3.3.3. Method C: Quantification with an Internal Reference Sequence
3.3.4. Comparison
4. Discussion
5. Conclusions
Author Contributions
Funding
Acknowledgments
Conflicts of Interest
References
- European Commission. The Rapid Alert System for Food and Feed 2013 Annual Report; European Union: Luxembourg, 2014; Available online: https://ec.europa.eu/food/sites/food/files/safety/docs/rasff_annual_report_2013.pdf (accessed on 27 July 2020).
- Regulation 1169/2011. Commission regulation (EU) No 1169/2011 of the European parliament and of the council of 25 October 2011 on the provision of food information to consumers. Official Journal of the European Union, L 304 2011, 20, 18–63. [Google Scholar]
- Köppel, R.; Ganeshan, A.; van Velsen, F.; Weber, S.; Schmid, J.; Graf, C.; Hochegger, R. Digital duplex versus real-time PCR for the determination of meat proportions from sausages containing pork and beef. Eur. Food Res. Technol. 2018, 245, 151–157. [Google Scholar] [CrossRef]
- Kesmen, Z.; Yetiman, A.E.; Sahin, F.; Yetim, H. Detection of chicken and turkey meat in meat mixtures by using real-time PCR assays. J. Food Sci. 2012, 77, C167–C173. [Google Scholar] [CrossRef] [PubMed]
- Böhme, K.; Calo-Mata, P.; Barros-Velázquez, J.; Ortea, I. Review of recent DNA-based methods for main food-authentication topics. J. Agric. Food Chem. 2019, 67, 3854–3864. [Google Scholar] [CrossRef]
- Ballin, N.Z.; Vogensen, F.K.; Karlsson, A.H. Species determination—Can we detect and quantify meat adulteration? Meat Sci. 2009, 83, 165–174. [Google Scholar] [CrossRef]
- Kang, T.S.; Tanaka, T. Comparison of quantitative methods based on SYBR Green real-time qPCR to estimate pork meat adulteration in processed beef products. Food Chem. 2018, 269, 549–558. [Google Scholar] [CrossRef]
- Waiblinger, H.-U.; Boernsen, B.; Geppert, C.; Demmel, A.; Peterseil, V.; Koeppel, R. Ring trial validation of single and multiplex real-time PCR methods for the detection and quantification of the allergenic food ingredients mustard, celery, soy, wheat and rye. J. Verbrauch. Lebensm. 2017, 12, 55–72. [Google Scholar] [CrossRef]
- Sakai, Y.; Kotoura, S.; Yano, T.; Kurihara, T.; Uchida, K.; Miake, K.; Akiyama, H.; Tanabe, S. Quantification of pork, chicken and beef by using a novel reference molecule. Biosci. Biotechnol. Biochem. 2011, 75, 1639–1643. [Google Scholar] [CrossRef]
- Lick, S. (Max Rubner-Institut, Kulmbach, Germany). Personal Communication, 2020.
- Gryson, N. Effect of food processing on plant DNA degradation and PCR-based GMO analysis: A review. Anal. Bioanal. Chem. 2010, 396, 2003–2022. [Google Scholar] [CrossRef]
- Mano, J.; Nishitsuji, Y.; Kikuchi, Y.; Fukudome, S.-I.; Hayashida, T.; Kawakami, H.; Kurimoto, Y.; Noguchi, A.; Kondo, K.; Teshima, R.; et al. Quantification of DNA fragmentation in processed foods using real-time PCR. Food Chem. 2017, 226, 149–155. [Google Scholar] [CrossRef]
- Kang, T.S. Basic principles for developing real-time PCR methods used in food analysis: A review. Trends Food Sci. Technol. 2019, 91, 574–585. [Google Scholar] [CrossRef]
- Dolch, K.; Judas, M.; Schwägele, F.; Brüggemann, D.A. Development and validation of two triplex real-time PCR systems for the simultaneous detection of six cereal species in processed meat products. Food Control 2019, 101, 180–188. [Google Scholar] [CrossRef]
- Köppel, R.; Ruf, J.; Rentsch, J. Multiplex real-time PCR for the detection and quantification of DNA from beef, pork, horse and sheep. Eur. Food Res. Technol. 2011, 232, 151–155. [Google Scholar] [CrossRef]
- Köppel, R.; Ruf, J.; Zimmerli, F.; Breitenmoser, A. Multiplex real-time PCR for the detection and quantification of DNA from beef, pork, chicken and turkey. Eur. Food Res. Technol. 2008, 227, 1199–1203. [Google Scholar] [CrossRef]
- Köppel, R.; Ganeshan, A.; Weber, S.; Pietsch, K.; Graf, C.; Hochegger, R.; Griffiths, K.; Burkhardt, S. Duplex digital PCR for the determination of meat proportions of sausages containing meat from chicken, turkey, horse, cow, pig and sheep. Eur. Food Res. Technol. 2019, 245, 853–862. [Google Scholar] [CrossRef]
- Rojas, M.; González, I.; Pávon, M.A.; Pegels, N.; Lago, A.; Hernández, P.E.; García, T.; Martin, R. Novel TaqMan real-time polymerase chain reaction assay for verifying the authenticity of meat and commercial meat products from game birds. Food Addit. Contam. Part A-Chem. Anal. Control Expo. Risk Assess. 2010, 27, 749–763. [Google Scholar] [CrossRef]
- Druml, B.; Grandits, S.; Mayer, W.; Hochegger, R.; Cichna-Markl, M. Authenticity control of game meat products—A single method to detect and quantify adulteration of fallow deer (Dama dama), red deer (Cervus elaphus) and sika deer (Cervus nippon) by real-time PCR. Food Chem. 2015, 170, 508–517. [Google Scholar] [CrossRef]
- Iwobi, A.; Sebah, D.; Spielmann, G.; Maggipinto, M.; Schrempp, M.; Kraemer, I.; Gerdes, L.; Busch, U.; Huber, I. A multiplex real-time PCR method for the quantitative determination of equine (horse) fractions in meat products. Food Control 2017, 74, 89–97. [Google Scholar] [CrossRef]
- Costa, J.; Amaral, J.S.; Grazina, L.; Oliveira, M.B.P.P.; Mafra, I. Matrix-normalised real-time PCR approach to quantify soybean as a potential food allergen as affected by thermal processing. Food Chem. 2017, 221, 1843–1850. [Google Scholar] [CrossRef]
- Soares, S.; Amaral, J.S.; Oliveira, M.B.P.P.; Mafra, I. Quantitative detection of soybean in meat products by a TaqMan real-time PCR assay. Meat Sci. 2014, 98, 41–46. [Google Scholar] [CrossRef]
- López-Andreo, M.; Lugo, L.; Garrido-Pertierra, A.; Prieto, M.I.; Puyet, A. Identification and quantitation of species in complex DNA mixtures by real-time polymerase chain reaction. Anal. Biochem. 2005, 339, 73–82. [Google Scholar] [CrossRef] [PubMed]
- Produktion von Fleisch weltweit nach Art in den Jahren 2014 bis 2019 (in Millionen Tonnen). Available online: https://de.statista.com/statistik/daten/studie/28778/umfrage/erzeugung-von-fleisch-weltweit-seit-1990/ (accessed on 2 June 2020).
- Wisniewski, A.; Buschulte, A. How to tackle food fraud in official food control authorities in Germany. J. Consum. Prot. Food Saf. 2019, 14, 319–328. [Google Scholar] [CrossRef]
- Statistisches Bundesamt. Geflügelschlachtereien, Geschlachtete Tiere und Schlachtmenge in Deutschland im Jahr 2018. Available online: https://de.statista.com/statistik/daten/studie/232533/umfrage/gefluegelstatistik-erhebung-in-gefluegelschlachtereien-in-deutschland/ (accessed on 2 June 2020).
- Dooley, J.J.; Paine, K.E.; Garrett, S.D.; Brown, H.M. Detection of meat species using TaqMan real-time PCR assays. Meat Sci. 2004, 68, 431–438. [Google Scholar] [CrossRef] [PubMed]
- Jonker, K.M.; Tilburg, J.J.; Hägele, G.H.; de Boer, E. Species identification in meat products using real-time PCR. Food Addit. Contam. Part. A Chem. Anal. Control Expo. Risk Assess. 2008, 25, 527–533. [Google Scholar] [CrossRef]
- Laube, I.; Zagon, J.; Broll, H. Quantitative determination of commercially relevant species in foods by real-time PCR. Int. J. Food Sci. Technol. 2007, 42, 336–341. [Google Scholar] [CrossRef]
- Kumar, S.; Stecher, G.; Li, M.; Knyaz, C.; Tamura, K. MEGA X: Molecular Evolutionary Genetics Analysis across Computing Platforms. Mol. Biol. Evol. 2018, 35, 1547–1549. [Google Scholar] [CrossRef]
- Hübner, P. Isolation genomischer DNA aus Lebensmitteln (Wizard-Extraktion). Kanton. Labor Zürich 2007, Z6521/9902, 1–6. [Google Scholar]
- Andrée, S.; Schwägele, F. Authentifizierung ausgewählter Geflügelspezies mittels Pentaplex-Real-Time-PCR. Mitt. Fleischforsch. Kulmb. 2011, 50, 163–171. [Google Scholar]
- Stirtzel, S.; Andrée, S.; Schwägele, F. Authentifizierung von Geflügel mit tierartspezifischen Primersystemen. Mitt. Fleischforsch. Kulmb. 2006, 45, 251–258. [Google Scholar]
- Soares, S.; Amaral, J.S.; Oliveira, M.B.P.P.; Mafra, I. A SYBR Green real-time PCR assay to detect and quantify pork meat in processed poultry meat products. Meat Sci. 2013, 94, 115–120. [Google Scholar] [CrossRef]
- Chisholm, J.; Sanchez, A.; Brown, J.; Hird, H. The development of species-specific real-time PCR assays for the detection of pheasant and quail in food. Food Anal. Methods 2008, 1, 190–194. [Google Scholar] [CrossRef]
- Tanabe, S.; Hase, M.; Yano, T.; Sato, M.; Fujimura, T.; Akiyama, H. A real-time quantitative PCR detection method for pork, chicken, beef, mutton, and horseflesh in foods. Biosci. Biotechnol. Biochem. 2007, 71, 3131–3135. [Google Scholar] [CrossRef] [PubMed]
- Zdeňková, K.; Akhatova, D.; Fialová, E.; Krupa, O.; Kubica, L.; Lencová, S.; Demnerová, K. Detection of meat adulteration: Use of efficient and routine-suited multiplex polymerase chain reaction-based methods for species authentication and quantification in meat products. J. Food Nutr. Res. 2018, 57, 351–362. [Google Scholar]
- Xiang, W.J.; Shang, Y.; Wang, Q.; Xu, Y.C.; Zhu, P.Y.; Huang, K.L.; Xu, W.T. Identification of a chicken (Gallus gallus) endogenous reference gene (Actb) and its application in meat adulteration. Food Chem. 2017, 234, 472–478. [Google Scholar] [CrossRef] [PubMed]
- Rojas, M.; González, I.; Pavón, M.A.; Pegels, N.; Hernández, P.E.; García, T.; Martín, R. Polymerase chain reaction assay for verifying the labeling of meat and commercial meat products from game birds targeting specific sequences from the mitochondrial D-loop region. Poult. Sci. 2010, 89, 1021–1032. [Google Scholar] [CrossRef]
- Gregory, T.R. A bird’s-eye view of the C-value enigma: Genome size, cell size, and metabolic rate in the class aves. Evolution 2002, 56, 121–130. [Google Scholar] [CrossRef]
- Sánchez, A.; Quinteiro, J.; Vázquez, J.A.; Perez-Martín, R.I.; Sotelo, C.G. Comparison of real-time PCR methods for quantification of European hake (Merluccius merluccius) in processed food samples. Food Chem. 2019, 272, 279–285. [Google Scholar] [CrossRef]
- Eugster, A.; Ruf, J.; Rentsch, J.; Köppel, R. Quantification of beef, pork, chicken and turkey proportions in sausages: Use of matrix-adapted standards and comparison of single versus multiplex PCR in an interlaboratory trial. Eur. Food Res. Technol. 2009, 230, 55–61. [Google Scholar] [CrossRef]
- Kaltenbrunner, M.; Hochegger, R.; Cichna-Markl, M. Red deer (Cervus elaphus)-specific real-time PCR assay for the detection of food adulteration. Food Control. 2018, 89, 157–166. [Google Scholar] [CrossRef]
- Druml, B.; Kaltenbrunner, M.; Hochegger, R.; Cichna-Markl, M. A novel reference real-time PCR assay for the relative quantification of (game) meat species in raw and heat-processed food. Food Control. 2016, 70, 392–400. [Google Scholar] [CrossRef]
- Laube, I.; Zagon, J.; Spiegelberg, A.; Butschke, A.; Kroh, L.W.; Broll, H. Development and design of a ‘ready-to-use’ reaction plate for a PCR-based simultaneous detection of animal species used in foods. Int. J. Food Sci. Technol. 2007, 42, 9–17. [Google Scholar] [CrossRef]
- Ren, Y.F.; Li, X.; Liu, Y.M.; Yang, L.T.; Cai, Y.C.; Quan, S.; Pan, L.W.; Chen, S.S. A novel quantitative real-time PCR method for identification and quantification of mammalian and poultry species in foods. Food Control 2017, 76, 42–51. [Google Scholar] [CrossRef]
- Fajardo, V.; González, I.; Martín, I.; Rojas, M.; Hernández, P.E.; García, T.; Martín, R. Real-time PCR for detection and quantification of red deer (Cervus elaphus), fallow deer (Dama dama), and roe deer (Capreolus capreolus) in meat mixtures. Meat Sci. 2008, 79, 289–298. [Google Scholar] [CrossRef] [PubMed]
- Meira, L.; Costa, J.; Villa, C.; Ramos, F.; Oliveira, M.; Mafra, I. EvaGreen real-time PCR to determine horse meat adulteration in processed foods. LWT-Food Sci. Technol. 2017, 75, 408–416. [Google Scholar] [CrossRef]
- Pegels, N.; González, I.; Martín, I.; Rojas, M.; García, T.; Martín, R. Applicability assessment of a real-time PCR assay for the specific detection of bovine, ovine and caprine material in feedstuffs. Food Control 2011, 22, 1189–1196. [Google Scholar] [CrossRef]


| Amount of Meat Added (%) | ||||||||||
|---|---|---|---|---|---|---|---|---|---|---|
| Poultry Species | S1 | S2 | S3 | S4 | S5 | U1 | U2 | U3 | U4 | U5 |
| Chicken | 1.0 | 0.0 | 69.0 | 25.0 | 5.0 | 2.0 | 0.5 | 57.5 | 32.0 | 8.0 |
| Guinea fowl | 25.0 | 5.0 | 1.0 | 0.0 | 69.0 | 32.0 | 8.0 | 2.0 | 0.5 | 57.5 |
| Pheasant | 0.0 | 69.0 | 25.0 | 5.0 | 1.0 | 0.5 | 57.5 | 32.0 | 8.0 | 2.0 |
| Quail | 5.0 | 1.0 | 0.0 | 69.0 | 25.0 | 8.0 | 2.0 | 0.5 | 57.5 | 32.0 |
| Turkey | 69.0 | 25.0 | 5.0 | 1.0 | 0.0 | 57.5 | 32.0 | 8.0 | 2.0 | 0.5 |
| Multiplex Real-Time PCR | Animal Species | Gene | Code | DNA Sequence 5′–3′ | Concentration (µM) | Reference |
|---|---|---|---|---|---|---|
| C-G-P | Chicken | Cyt b | C-for | AGC AAT TCC CTA CAT TGG ACA CA | 0.20 | [27] |
| C-rev | GAT GAT AGT AAT ACC TGC GAT TGC A | 0.20 | ||||
| C-probe | JOE-CAG TCG ACA ACC CAA CCC TTA CCC GAT TC-BHQ1 | 0.08 | [32] | |||
| Guinea fowl | Cyt b | G-for | GCA TAC GCC ATC CTC CGC TC | 0.20 | [33] | |
| G-rev | GCT GCC CAC TCA GGT TAG A | 0.20 | ||||
| G-probe | DY682-TGG AGG CGT ACT AGC ACT AGC AGC CTC CG-BHQ2 | 0.08 | [32] | |||
| Pheasant | Cyt b | P-for | GAG ACA TGA AAC ACT GGA G | 0.20 | [33] | |
| P-rev | CAG GTC CAT TCT ACC AAG G | 0.20 | ||||
| P-probe | ATTO633-CGT CCT ACT CCT CAC ACT CAT AGC AAC C-BHQ2 | 0.08 | [32] | |||
| Q-T | Quail | Cyt b | Q-for | TGT ACC CTA CAT CGG CCA AAC C | 0.20 | [33] |
| Q-rev | GTC AGA TGA GAT TCC TAA TGG G | 0.20 | ||||
| Q-probe | FAM-CCT ACC CTA ACC CGA TTC TTC GCC CTC C-BHQ1 | 0.10 | [32] | |||
| Turkey | Cyt b | T-for | CAC TCT TGC ATT CTC TTC TGT GG | 0.20 | [33] | |
| T-rev | GGA GGT TAT GGA GGA GTC AAC | 0.20 | ||||
| T-probe | ROX-CCT ACA CAT GCC GAA ACG TAC AAT ACG-BHQ2 | 0.08 | [32] | |||
| ALL | Eukarya | 12S rRNA | 12S-for | AAA CTG GGA TTA GAT ACC CCA CTA TG | 0.3 | This work |
| 12S-rev | AGA ACA GGC TCC TCT AGG TGG | 0.3 | ||||
| 12S-probe | FAM-AGA ACT ACG AGC ACA AAC GCT TAA AAC TCT A-BHQ1 | 0.2 |
| DNA | Triplex C-G-P | Duplex Q-T | ||||||||
|---|---|---|---|---|---|---|---|---|---|---|
| Chicken | Guinea Fowl | Pheasant | Quail | Turkey | ||||||
| Asparagus | 32.28 | 32.96 | - | - | - | - | - | - | - | - |
| Beef | 32.20 | - | - | - | - | - | - | - | - | - |
| Chicken | 15.21 | 15.47 | - | - | 31.27 | 31.06 | - | - | - | - |
| Deer | - | - | - | - | - | - | 34.74 | 34.26 | - | - |
| Duck | - | - | - | - | 34.64 | - | - | - | - | - |
| Goose | - | - | - | - | 29.54 | 29.22 | - | - | 34.23 | - |
| Guinea fowl | 32.95 | 34.77 | 16.40 | 16.71 | - | - | - | - | - | - |
| Kangaroo | - | - | - | - | - | - | 32.33 | 31.46 | - | - |
| Mace | 32.13 | - | - | - | 29.53 | - | - | - | - | - |
| Ostrich | - | - | 31.01 | 30.59 | 30.49 | 30.12 | 30.94 | 31.20 | - | - |
| Pheasant | - | - | - | - | 14.70 | 14.73 | - | - | - | - |
| Quail | - | - | - | - | - | - | 17.69 | 17.73 | - | - |
| Turkey | - | - | - | - | - | - | - | - | 15.86 | 16.00 |
| Wild boar | - | - | - | - | - | - | - | - | 34.80 | - |
| Blank value | 32.66 | - | 32.36 | 32.33 | 29.13 | 29.73 | 32.23 | 31.35 | 31.71 | 32.38 |
| Actual (% w/w) | Low Temperature | High Temperature | ||||||
|---|---|---|---|---|---|---|---|---|
| Mean Predicted (% w/w) a | SD b | CV (%) c | Bias (%) d | Mean Predicted (% w/w) a | SD b | CV (%) c | Bias (%) d | |
| Chicken | ||||||||
| 0.5 | 0.28 | 0.04 | 14.41 | −43.33 | 0.33 | 0.08 | 24.49 | −33.33 |
| 2.0 | 1.88 | 0.26 | 14.01 | −5.83 | 2.43 | 0.27 | 11.23 | 21.67 |
| 8.0 | 6.82 | 0.54 | 7.95 | −14.79 | 7.22 | 1.64 | 22.71 | −9.79 |
| 32.0 | 25.22 | 3.14 | 12.47 | −21.20 | 36.45 | 7.15 | 19.61 | 13.91 |
| 57.5 | 50.53 | 10.56 | 20.90 | −12.12 | 70.88 | 6.79 | 9.57 | 23.28 |
| Guinea fowl | ||||||||
| 0.5 | 0.30 | 0.06 | 21.08 | −40.00 | 0.37 | 0.08 | 22.27 | −26.67 |
| 2.0 | 1.52 | 0.24 | 15.83 | −24.17 | 2.48 | 0.69 | 27.95 | 24.17 |
| 8.0 | 8.45 | 0.73 | 8.62 | 5.63 | 10.30 | 2.42 | 23.48 | 28.75 |
| 32.0 | 26.63 | 3.93 | 14.74 | −16.77 | 43.10 | 8.06 | 18.69 | 34.69 |
| 57.5 | 45.90 | 3.68 | 8.01 | −20.17 | 57.42 | 17.53 | 30.53 | −0.14 |
| Pheasant | ||||||||
| 0.5 | 0.55 | 0.05 | 9.96 | 10.00 | 0.87 | 0.30 | 34.74 | 73.33 |
| 2.0 | 1.68 | 0.22 | 13.24 | −15.83 | 1.78 | 0.15 | 8.25 | −10.83 |
| 8.0 | 6.92 | 0.96 | 13.94 | −13.54 | 10.45 | 1.35 | 12.96 | 30.63 |
| 32.0 | 24.85 | 3.93 | 15.81 | −22.34 | 36.02 | 6.30 | 17.49 | 12.55 |
| 57.5 | 55.53 | 3.66 | 6.59 | −3.42 | 57.60 | 13.94 | 24.19 | 0.17 |
| Quail | ||||||||
| 0.5 | 0.47 | 0.16 | 34.99 | −6.67 | 0.70 | 0.15 | 22.13 | 40.00 |
| 2.0 | 2.03 | 0.20 | 9.67 | 1.67 | 2.22 | 0.43 | 19.44 | 10.83 |
| 8.0 | 7.90 | 0.88 | 11.12 | −1.25 | 9.68 | 2.41 | 24.91 | 21.04 |
| 32.0 | 28.83 | 7.56 | 26.23 | −9.90 | 29.17 | 2.35 | 8.05 | −8.85 |
| 57.5 | 50.32 | 10.41 | 20.69 | −12.49 | 95.07 | 37.50 | 39.45 | 65.33 |
| Turkey | ||||||||
| 0.5 | 0.52 | 0.16 | 31.01 | 3.33 | 0.45 | 0.05 | 12.17 | −10.00 |
| 2.0 | 1.68 | 0.19 | 11.53 | −15.83 | 2.03 | 0.30 | 14.81 | 1.67 |
| 8.0 | 4.95 | 0.23 | 4.56 | −38.13 | 7.42 | 0.80 | 10.83 | −7.29 |
| 32.0 | 29.05 | 2.81 | 9.68 | −9.22 | 32.60 | 5.69 | 17.45 | 1.88 |
| 57.5 | 49.42 | 12.04 | 24.37 | −14.06 | 54.68 | 5.37 | 9.82 | −4.90 |
| Temperature | Batch | Chicken | Guinea Fowl | Pheasant | Quail | Turkey |
|---|---|---|---|---|---|---|
| Low | A | 1.16 | 1.19 | 0.68 | 3.02 | 1.19 |
| B | 1.44 | 1.49 | 1.12 | 4.61 | 1.17 | |
| Mean | 1.30 | 1.34 | 0.90 | 3.82 | 1.18 | |
| High | A | 0.24 | 0.12 | 0.09 | 0.31 | 0.61 |
| B | 0.23 | 0.09 | 0.10 | 0.29 | 0.42 | |
| Mean | 0.24 | 0.11 | 0.09 | 0.30 | 0.52 |
| Actual (% w/w) | Low Temperature | High Temperature | ||||||
|---|---|---|---|---|---|---|---|---|
| Mean Predicted (% w/w) a | SD b | CV (%) c | Bias (%) d | Mean Predicted (% w/w) a | SD b | CV (%) c | Bias (%) d | |
| Chicken | ||||||||
| 0.5 | 0.40 | 0.05 | 11.70 | −19.33 | 0.35 | 0.07 | 19.07 | −29.67 |
| 2.0 | 2.85 | 0.20 | 6.94 | 42.58 | 2.71 | 0.41 | 15.24 | 35.42 |
| 8.0 | 10.23 | 0.55 | 5.39 | 27.83 | 10.33 | 0.74 | 7.13 | 29.10 |
| 32.0 | 34.77 | 1.90 | 5.47 | 8.65 | 31.76 | 2.37 | 7.47 | −0.74 |
| 57.5 | 60.68 | 2.49 | 4.10 | 5.52 | 62.27 | 4.51 | 7.25 | 8.30 |
| Guinea fowl | ||||||||
| 0.5 | 0.44 | 0.06 | 14.08 | −13.00 | 0.37 | 0.08 | 21.66 | −26.67 |
| 2.0 | 1.80 | 0.23 | 12.61 | −10.25 | 1.81 | 0.09 | 4.71 | −9.58 |
| 8.0 | 7.75 | 0.73 | 9.45 | −3.10 | 7.73 | 1.11 | 14.42 | −3.35 |
| 32.0 | 29.86 | 2.96 | 9.91 | −6.68 | 32.29 | 2.84 | 8.81 | 0.90 |
| 57.5 | 51.62 | 4.15 | 8.04 | −10.22 | 51.76 | 2.72 | 5.26 | −9.98 |
| Pheasant | ||||||||
| 0.5 | 0.74 | 0.19 | 25.55 | 47.33 | 0.69 | 0.17 | 24.82 | 38.00 |
| 2.0 | 2.50 | 0.33 | 13.21 | 24.75 | 2.00 | 0.28 | 14.08 | 0.00 |
| 8.0 | 9.25 | 1.60 | 17.33 | 15.65 | 8.50 | 1.64 | 19.33 | 6.19 |
| 32.0 | 31.41 | 3.44 | 10.96 | −1.83 | 31.11 | 4.83 | 15.53 | −2.79 |
| 57.5 | 63.42 | 5.17 | 8.16 | 10.30 | 63.70 | 5.12 | 8.03 | 10.79 |
| Quail | ||||||||
| 0.5 | 0.43 | 0.10 | 22.58 | −13.67 | 0.45 | 0.06 | 13.19 | −10.33 |
| 2.0 | 1.81 | 0.22 | 11.95 | −9.75 | 1.90 | 0.19 | 9.94 | −5.17 |
| 8.0 | 8.90 | 0.70 | 7.83 | 11.21 | 9.54 | 1.06 | 11.10 | 19.23 |
| 32.0 | 35.00 | 4.17 | 11.93 | 9.36 | 35.42 | 2.81 | 7.95 | 10.68 |
| 57.5 | 53.81 | 3.19 | 5.93 | −6.42 | 57.99 | 4.04 | 6.96 | 0.86 |
| Turkey | ||||||||
| 0.5 | 0.66 | 0.13 | 19.06 | 32.33 | 0.50 | 0.06 | 12.78 | −0.67 |
| 2.0 | 1.74 | 0.17 | 9.89 | −13.00 | 1.38 | 0.16 | 11.85 | −31.00 |
| 8.0 | 5.68 | 0.94 | 16.46 | −28.98 | 4.37 | 0.42 | 9.65 | −45.42 |
| 32.0 | 26.62 | 4.58 | 17.19 | −16.81 | 26.32 | 4.03 | 15.32 | −17.76 |
| 57.5 | 57.65 | 2.79 | 4.84 | 0.26 | 54.78 | 2.57 | 4.69 | −4.74 |
| Actual (% w/w) | Low Temperature | High Temperature | ||||||
|---|---|---|---|---|---|---|---|---|
| Mean Predicted (% w/w) a | SD b | CV (%) c | Bias (%) d | Mean Predicted (% w/w) a | SD b | CV (%) c | Bias (%) d | |
| Chicken | ||||||||
| 0.5 | 0.69 | 0.11 | 16.37 | 37.67 | 0.57 | 0.21 | 37.23 | 14.00 |
| 2.0 | 2.06 | 0.20 | 9.65 | 3.08 | 2.03 | 0.32 | 15.90 | 1.58 |
| 8.0 | 7.38 | 2.64 | 35.76 | −7.79 | 7.08 | 0.68 | 9.56 | −11.56 |
| 32.0 | 26.22 | 2.48 | 9.47 | −18.05 | 26.61 | 4.78 | 17.97 | −16.84 |
| 57.5 | 72.45 | 9.83 | 13.56 | 25.99 | 73.04 | 9.12 | 12.49 | 27.02 |
| Guinea fowl | ||||||||
| 0.5 | 0.21 | 0.04 | 21.00 | −57.67 | 0.25 | 0.07 | 30.08 | −50.67 |
| 2.0 | 1.87 | 0.42 | 22.56 | −6.50 | 2.09 | 0.50 | 23.74 | 4.75 |
| 8.0 | 10.85 | 3.17 | 29.24 | 35.56 | 9.36 | 1.99 | 21.25 | 17.02 |
| 32.0 | 33.86 | 7.46 | 22.03 | 5.82 | 32.24 | 5.27 | 16.36 | 0.73 |
| 57.5 | 57.65 | 17.42 | 30.21 | 0.26 | 60.87 | 13.56 | 22.28 | 5.85 |
| Pheasant | ||||||||
| 0.5 | 0.67 | 0.15 | 21.82 | 34.67 | 0.67 | 0.05 | 7.32 | 34.67 |
| 2.0 | 1.85 | 0.76 | 41.35 | −7.50 | 1.75 | 0.25 | 14.53 | −12.58 |
| 8.0 | 6.99 | 0.66 | 9.46 | −12.62 | 7.22 | 0.85 | 11.76 | −9.79 |
| 32.0 | 31.17 | 3.02 | 9.68 | −2.59 | 34.09 | 2.49 | 7.31 | 6.52 |
| 57.5 | 53.74 | 6.71 | 12.49 | −6.54 | 52.72 | 8.00 | 15.18 | −8.31 |
| Quail | ||||||||
| 0.5 | 0.35 | 0.16 | 47.44 | −31.00 | 0.41 | 0.11 | 26.76 | −18.00 |
| 2.0 | 1.92 | 0.57 | 29.44 | −3.92 | 1.65 | 0.30 | 18.42 | −17.50 |
| 8.0 | 7.33 | 1.64 | 22.44 | −8.40 | 8.21 | 1.02 | 12.38 | 2.67 |
| 32.0 | 31.10 | 5.97 | 19.20 | −2.83 | 32.02 | 6.33 | 19.76 | 0.06 |
| 57.5 | 57.61 | 8.82 | 15.31 | 0.19 | 66.62 | 10.82 | 16.24 | 15.87 |
| Turkey | ||||||||
| 0.5 | 0.52 | 0.14 | 26.07 | 4.33 | 0.50 | 0.09 | 17.35 | 0.33 |
| 2.0 | 1.62 | 0.51 | 31.38 | −18.92 | 1.45 | 0.39 | 27.19 | −27.67 |
| 8.0 | 7.33 | 1.34 | 18.28 | −8.42 | 6.59 | 0.51 | 7.73 | −17.63 |
| 32.0 | 34.91 | 8.85 | 25.36 | 9.10 | 26.89 | 7.77 | 28.90 | −15.97 |
| 57.5 | 42.73 | 9.91 | 23.19 | −25.68 | 47.90 | 14.35 | 29.96 | −16.70 |
| Method | Technical Summary | Bias | CV | Recovery Rate | Species |
|---|---|---|---|---|---|
| (% within Accepted Range) d | |||||
| A a | Quantification with reference material | ||||
| - Fast - Low costs | 80 | 100 | 68 | Chicken | |
| 60 | 80 | 65 | Guinea fowl | ||
| 80 | 90 | 80 | Pheasant | ||
| 80 | 70 | 77 | Quail | ||
| 90 | 90 | 85 | Turkey | ||
| B b | Quantification with matrix-specific multiplication factors | ||||
| - More time and more costs for establishment of multiplication-factors - Suited for repeated use | 50 | 100 | 70 | Chicken | |
| 90 | 100 | 93 | Guinea fowl | ||
| 80 | 90 | 82 | Pheasant | ||
| 100 | 100 | 97 | Quail | ||
| 60 | 100 | 73 | Turkey | ||
| C c | Quantification with an internal reference sequence | ||||
| - More time and more costs due to second real-time PCR assay - With inhibition control | 70 | 80 | 77 | Chicken | |
| 70 | 70 | 62 | Guinea fowl | ||
| 80 | 90 | 80 | Pheasant | ||
| 90 | 70 | 80 | Quail | ||
| 80 | 40 | 77 | Turkey | ||
© 2020 by the authors. Licensee MDPI, Basel, Switzerland. This article is an open access article distributed under the terms and conditions of the Creative Commons Attribution (CC BY) license (http://creativecommons.org/licenses/by/4.0/).
Share and Cite
Dolch, K.; Andrée, S.; Schwägele, F. Comparison of Real-Time PCR Quantification Methods in the Identification of Poultry Species in Meat Products. Foods 2020, 9, 1049. https://doi.org/10.3390/foods9081049
Dolch K, Andrée S, Schwägele F. Comparison of Real-Time PCR Quantification Methods in the Identification of Poultry Species in Meat Products. Foods. 2020; 9(8):1049. https://doi.org/10.3390/foods9081049
Chicago/Turabian StyleDolch, Kerstin, Sabine Andrée, and Fredi Schwägele. 2020. "Comparison of Real-Time PCR Quantification Methods in the Identification of Poultry Species in Meat Products" Foods 9, no. 8: 1049. https://doi.org/10.3390/foods9081049
APA StyleDolch, K., Andrée, S., & Schwägele, F. (2020). Comparison of Real-Time PCR Quantification Methods in the Identification of Poultry Species in Meat Products. Foods, 9(8), 1049. https://doi.org/10.3390/foods9081049