Article

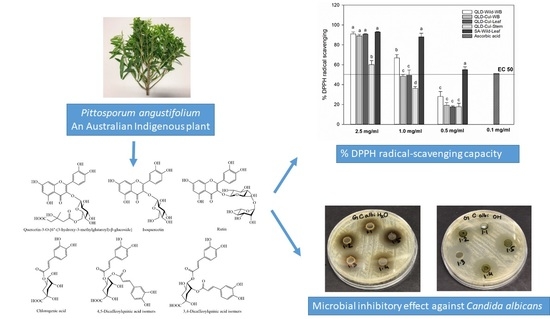
Nutritional Value and Antimicrobial Activity of Pittosporum angustifolium (Gumby Gumby), an Australian Indigenous Plant

1
ARC Industrial Transformation Training Centre for Uniquely Australian Foods, Centre for Nutrition and Food Sciences, Queensland Alliance for Agriculture and Food Innovation, The University of Queensland, Coopers Plans 4108, Australia
2
Department of Food Technology, Faculty of Agriculture, Can Tho University, Can Tho 94000, Vietnam
3
Health Support Queensland, Queensland Health Department, Coopers Plans 4108, Australia
*
Authors to whom correspondence should be addressed.
Foods 2020, 9(7), 887; https://doi.org/10.3390/foods9070887
Submission received: 29 May 2020 / Revised: 30 June 2020 / Accepted: 1 July 2020 / Published: 6 July 2020

Abstract

:
The indigenous endemic plant P. angustifolium has received attention for nutraceutical and therapeutic applications in Australia. This study investigates for the first time the nutritional value (macro- and micronutrients, minerals, trace elements, polyphenols, carotenoids, saponins and antioxidant capacity) and antimicrobial activity of different botanical parts of P. angustifolium, either collected from the wild or cultivated. Different botanical tissues, geographic location and growing condition (wild vs. cultivated) showed significant (p < 0.05) effects on the tested bioactive compounds, with the leaves having significantly (p < 0.05) higher levels than the stems. Saponins and polyphenols could be identified as the main bioactive compounds in the leaves with up to 4% per dry weight. The extracts of P. angustifolium leaves and stems showed strong antioxidant and antimicrobial activities, especially against Candida albicans. These activities correlated (R2 = 0.64–0.92; p < 0.05) with the levels of polyphenols and saponins, indicating their biologic potential. Findings from this study may provide information for future applications of P. angustifolium in the functional ingredient or nutraceutical industry.

Graphical Abstract

1. Introduction

There is a global demand for natural ingredients from plant sources with multifunctional properties for application in the food and nutraceutical industries. In 2018, the market for herbal dietary supplements in the United States increased by 9.4% and the value of this market reached an estimated 8.842 billion dollars across all market channels, marking the strongest US sale growth of herbal supplements since 1998 [1]. Similarly, there is a growing demand for foods and medicines that are known for their customary usage by Indigenous communities. These interests range from general desires for prevention from acute and chronic diseases, maintenance of good health, well-being, immune system strengthening and energy sustenance, to seeking out traditional foods/native plants that provide natural antioxidants and antimicrobials. There are many plant bioactive compounds of particular interest such as saponins, polyphenols including tannins and alkaloids, which are known to assist in providing the above benefits to human health and well-being.
P. angustifolium (common name: Gumby Gumby) is a shrub tree, native to Australia. This species belongs to the genus Pittosporum and the family Pittosporaceae, consisting of approximately 200 species in nine genera [2]. P. angustifolium has been found mainly in inland Australia, New Zealand and many other parts of the world [2]. Different botanical tissues of P. angustifolium have been traditionally used as Indigenous bush medicine across inland Australia for hundreds of years to enhance general health and well-being. The infusions from leaves were used to treat cold and coughs and to induce lactation [3]. Decoction made from the fruits was taken orally or applied to treat skin problems such as eczema and pruritus [2,4]. In addition, P. angustifolium has been traditionally used for treatment of rheumatoid arthritis and other inflammatory conditions [5]. Recently, Madikizela and McGaw [6] summarized information on traditional medicinal applications of the genus Pittosporum for treatment of a wide range of infections such as inflammatory, spasmodic, malarial and microbial infections (e.g., narcotics, chronic bronchitis, leprous infection, rheumatic, bruises, sciatica, chest infection and certain skin diseases). Interestingly, all parts of the Pittosporum plants, including leaf, bark, root, flower, fruit pulp, seed and even wood, have been reported to show potential medicinal applications in many countries such as Australia, China, India and South Africa [6].
The increasing interest in drug discovery from native medicinal plants has led to many studies on extraction, identification and quantification of bioactive compounds in different species of Pittosporum genus, P. angustifolium included [6,7,8,9,10,11,12,13,14]. Several bioactive compounds have been identified in the crude extracts of P. angustifolium such as triterpenoid saponins in leaves and seeds [7,8,9,10,11], phenolic acids and flavonoids in leaves (Figure 1) [12], tannins and essential oils in leaves and fruits [11]. Among them, triterpenoid saponins, essential oils and non-tannin polyphenols are reported as main bioactive compounds in the Pittosporum genus [6,13], whereas tannins and alkaloids are minor compounds. There seems to be no alkaloids present in the leaves and fruits of P. angustifolium [11,14].
Despite the wealth of available literature on bioactive compounds and their associated medicinal properties, there is still a gap in knowledge regarding potential effects of P. angustifolium bioactive compounds due to different growing conditions (wild vs. cultivated), diverse botanical tissues (leaf vs. stem) and geographical locations. Therefore, the present study aimed (i) to determine proximate composition, minerals and trace elements, bioactive compounds, antioxidant capacity and antimicrobial activity of Australian grown P. angustifolium as an initial measure of their nutritional value and bioactive potential and (ii) to assess the impact of different plant parts, growing conditions and geographic locations on bioactive compounds and associated bioactivities.

2. Materials and Methods

2.1. Plant Material

Approximately 5 kg of P. angustifolium (1 year-old) whole branch (length ≤ 30 cm; stem diameter < 5 mm) collected in 2018 from the field (Clermont, Queensland (QLD), Australia) were provided by Gumby Gumby Australia, Ltd. (Clermont, Australia). The cultivated sample was divided into 3 different parts: leaves, stems and the whole branch (without separation as used for traditional medicinal applications). The ratio between leaf and stem was 65–70:30–35 (w/w). The samples were freeze-dried at −50 °C for 48 h (CSK Climateck, CSK Scientific, Brisbane, Australia) and blended into a fine powder using a Waring Laboratory Blender (Australian Scientific, Australia).
The wild harvested sample, collected in 2018 from subtropical forest, included P. angustifolium whole branch from QLD (provided by Gumby Gumby Australia, Ltd.) and leaves from South Australia (SA) (supplied by Bush Food Australia, Ltd., Wilmington, Australia). After harvesting, the samples were air-dried indoors and blended into a fine powder (ca. 3 kg) as with the cultivated samples. The final (powdered) samples had a moisture content ≤5% and were stored at −35 °C for further analysis.
The following abbreviations were used to label the samples: QLD–Cul–WB, QLD–Cul–Leaf, QLD–Cul–Stem (cultivated P. angustifolium whole branch, leaf and stem samples collected in QLD); QLD–Wild–WB (P. angustifolium whole branch collected from the wild in QLD) and SA–Wild–Leaf (P. angustifolium leaves collected from the wild in SA).

2.2. Reagents

Polyphenol and carotenoid standards (HPLC grade), including (+/−) -catechin, gallic acid, rutin, isoquercetin, chlorogenic acid, caffeic acid, p-coumaric acid, ferulic acid, lutein, zeaxanthin and trans-beta-carotene, were purchased from Sigma-Aldrich (Castle Hill, NSW, Australia). Ascorbic acid, 2,2-diphenyl-1-picrylhydrazyl (DPPH), oleanolic acid and 1,4-dithiothreitol (DTT) were also from Sigma-Aldrich.
Pteroylmonoglutamic acid (PteGlu), tetrahydrofolate (H4folate), 5-methyltetrahydrofolate (5-CH3-H4folate), 5-formyltetrahydrofolate (5-CHO-H4folate), and their corresponding labeled isotopes were sourced from Merck Eprova (Schaffhausen, Switzerland).
Cultures of Staphylococcus aureus (strain 6571) and Escherichia coli (strain 9001) were obtained from the National Collection of Type Cultures (NCTC, Health Protection Agency Center for Infection, London, UK). Candida albicans (strain 90028) was sourced from the American Type Culture Collection (ATCC, In Vitro Technologies Pty, Ltd., Noble Park, Australia). Plate count agar and potato dextrose agar media (Thermo Fisher Scientific, Scoresby, Australia) were used to test antibacterial and antifungicidal activity.

2.3. Methods

2.3.1. Proximate Analysis

Proximate analysis was performed at Symbio Alliance Laboratories (Eight Mile Plains, Australia), a National Association of Testing Authorities (NATA) accredited laboratory that complies with ISO/IEC 17,025:2005. The following NATA accredited in-house or standard AOAC methods were used: protein (AOAC method 990.03, [15]); total fat (AOAC method 991.36, [16]); saturated, mono-unsaturated, poly-unsaturated and trans fatty acids by gas chromatography with flame-ionization detector (in-house method CFH068.2); dry matter (AOAC method 934.01, [17]); ash content (AOAC method 942.05, [17]); total sugar, total dietary fiber and available carbohydrate by high performance liquid chromatography equipped with refractive index detector (in-house methods CFH001.1, CF057 and CF029.1). Proximate analysis was performed in duplicate including measurement of uncertainty.

2.3.2. Mineral and Trace Element Analysis

Analysis of minerals (Ca, K, Mg, Na and P) was performed using inductively coupled plasma optical emission spectrometry (ICP-OES, Agilent 700, Agilent Technologies, Tokyo, Japan) after hot-block digestion. Analysis of trace elements was performed using inductively coupled plasma mass spectrometry (ICP-MS, Agilent 7700) after microwave digestion. The analysis was carried out at the Forensic and Scientific Services, Queensland, a NATA accredited laboratory. Details of the method have been described previously by Akter et al. [18].

2.3.3. Analysis of Polyphenols

Extraction of Free Phenolic Compounds

Extraction of free polyphenols was carried out as reported previously [19], with modifications. Briefly, 200 mg powdered sample was homogenized with 80% methanol containing 0.1% HCl (v/v) using a vortex. The homogenate was subsequently placed in an ultrasonication bath for 30 min at room temperature (rt) to support the release of phenolic compounds, followed by centrifugation at 3900 rpm for 10 min at rt (Eppendorf Centrifuge 5804, Hamburg-Eppendorf, Germany). Supernatants were retained, while residues were re-extracted twice followed the procedure described above. The supernatants were combined and subjected to UHPLC-PDA-MS/MS analysis, DPPH radical-scavenging capacity assay and total phenolic content (TPC) measurement. The extraction was carried out in triplicate.

Extraction of Bound Phenolic Compounds

Extraction of bound phenolic compounds followed Adom and Liu [20] with modifications and details of the method were described previously by Phan et al. [21]. Briefly, following the free phenolic extraction, the residues were subjected to alkaline hydrolysis and subsequently extracted with ethyl acetate. The ethyl acetate extracts were dried at 40 °C under nitrogen flow and redissolved in 50% methanol containing 0.1% formic acid for further analysis.

U(H)PLC-PDA-MS/MS Analysis

Polyphenols were analyzed using a Waters AcquityTM UPLC-PDA System (Waters, Rydalmere, Australia) with detailed chromatographic conditions summarized in Supplementary Table S1. Peak identities were confirmed using a Thermo high resolution Q Exactive mass spectrometer equipped with electrospray ionization (ESI) source and a Dionex Ultimate 3000 UHPLC system (Thermo Fisher Scientific Pty, Ltd., Scoresby, Australia). A full MS scan in negative ion mode was acquired from m/z 120 to 1000 at a resolving power of 70,000 full-width at half maximum. For the compounds of interest, a MS/MS scan range of m/z 100–1000 was selected, with normalized collision energy (NCE) at 35 V. The compound identification was based on comparing retention time, UV-Vis spectra, mass spectra and fragmentation patterns with those obtained from available standards and/or literature. Polyphenols were quantified at 320 nm, using external calibration curves of different polyphenol standards as stated in Section 2.2.

2.3.4. Analysis of Carotenoids

Extraction

Carotenoid extraction followed the method previously reported by Djuikwo et al. [22] with slight modifications. Approximately, 100 mg powdered sample was homogenized with acetone and 95% ethanol containing 0.1% butylated hydroxytoluene (BHT) (w/v). Next, the samples were subjected to saponification for 30 min at rt using KOH (20% in methanol, w/v), while shaking at 100 rpm. Following the saponification, hexane/dichloromethane (DCM) mixture (70:30, v/v) containing 0.1% BHT was added to extract carotenoid compounds. NaCl 10% (w/v) was added to improve phase separation, followed by centrifugation at 3900 rpm for 5 min at rt. The upper hexane/DCM layer was collected, combined and then evaporated under nitrogen until dryness. The crude extract was freshly reconstituted in methanol/methyl tert-butyl ether (50:50, v/v) containing 0.1% BHT for UHPLC-PDA-MS/MS analysis. All procedures were performed on ice, under dim light, using amber glassware where possible. The extraction was performed in triplicate.

U(H)PLC-PDA-APCI-MS/MS Analysis

Carotenoids were analyzed using a Waters AcquityTM UPLC-PDA system (Supplementary Table S1). Detected carotenoid compounds were identified using the same UHPLC-MS/MS system as described for the polyphenol analysis (Section 2.3.3) but employing an atmospheric pressure chemical ionization (APCI) operated in positive mode. A full MS scan (m/z 80–1200) was acquired. For the compounds of interest, a MS/MS scan range of m/z 80–650 was selected, with NCE at 20 V. Carotenoids were quantified at 450 nm, using external calibration curves of all-trans beta carotene, lutein and zeaxanthin. Concentrations of carotenoid standards were determined spectrophotometrically (Cintra 303, GBC Scientific Equipment, Braeside, Australia) using the specific molar absorption coefficients of carotenoids in solutions [23].

2.3.5. Vitamins

Folates

Folates were analyzed by stable isotope dilution assay (SIDA) and UHPLC-PDA-MS/MS (Striegel et al. [24]). Briefly, 100 mg of powdered sample was extracted with MES buffer (pH 5). Labeled isotopic compounds (IS), including [13C5]-PteGlu, [13C5]-H4folate, [13C5]-5-CH3-H4folate and [13C5]-5-CHO-H4folate, were added at appropriated concentrations. A Shimadzu UHPLC-ESI-MS/MS system (Shimadzu Corp., Kyoto, Japan) equipped with a Shimadzu 8060 triple quadrupole mass spectrometer was employed (Supplementary Table S1). Multiple reaction monitoring (MRM) in positive mode was optimized to quantify individual folate vitamers and their corresponding labeled isotopes. External calibration curves for quantification of folate vitamers were constructed based on the ratios of peak areas of analytes vs. IS.

Vitamin C

Ascorbic acid (L-AA) extraction and analysis followed Campos et al. [25], with slight modifications. Briefly, 200 mg powdered sample was extracted with 3% meta-phosphoric acid containing 8% acetic acid and 1-mM EDTA. The reduction of dehydroascorbic acid (DHAA), which was also present in the extracts/samples, to L-AA was performed following the method of Spinola et al. [26]. Vitamin C (L-AA + DHAA) was determined using a Waters UPLC-PDA system (Supplementary Table S1) and an external calibration curve of L-AA at 245 nm was used for quantification.

Non-Folate B Vitamins

Analysis of vitamins B1, B2, B3, B5, B6, B7 and B12 was conducted at Symbio Alliance Laboratories, using NATA accredited in-house HPLC-PDA methods (CFH363, CFH364 and CFH366). The analysis were performed in duplicate including measurement of uncertainty.

2.3.6. Total Phenolic Content

The free and bound polyphenol extracts were used for total phenolic content (TPC) measurement employing the Folin–Ciocâlteu reagent [27]. A microplate absorbance reader (Sunrise, Tecan, Maennedorf, Switzerland) was used at 700 nm. TPC was expressed as mg of gallic acid equivalents (GAE) per g of sample, using an external gallic acid standard curve (0–105 mg/L).

2.3.7. DPPH Radical-Scavenging Capacity

The DPPH free radical-scavenging assay [28] was used to determine the radical-scavenging capacity of the samples. The scavenging capacity was measured on a microplate absorbance reader (Sunrise, Tecan) at 517 nm. Ascorbic acid (0–0.1 mg/mL) was added for comparison. The % DPPH scavenging capacity was calculated using the following equation:
% DPPH = [(A0 − A1)/A0] × 100;
where A0 and A1 are the absorbance values of the control and the test samples, respectively.

2.3.8. Total (Condensed) Tannins

Extraction of tannins followed the method described by Karamac et al. [29] with slight modifications. Briefly, approximately 1 g powdered sample was extracted with acetone in a sonication bath (70 °C, 15 min). After cooling, the supernatant was retained by centrifugation at 3900 rpm for 10 min. The extraction was repeated 3 times and the supernatants were combined and concentrated at 40 °C in a miVac sample Duo concentrator (Genevac, Inc, Gardiner, NY, USA). The dried extract was redissolved in methanol and subjected to the Vanillin-HCl assay (Price et al. [30]), using a Sunrise microplate reader at 500 nm. (+/−)-Catechin (0–1.5 g/L) was used to prepare an external calibration curve. Total tannin content (TTC) was expressed as mg of catechin equivalents (CaE) per 100 g of sample.

2.3.9. Total Saponins

Extraction and quantification of saponins followed the spectrophotometric method described previously [31,32] with modifications. Approximately 1 g powdered sample was extracted with 80% methanol at rt while shaking on an orbital shaker (RP1812, Paton Scientific, Victor Harbor, Australia) at 100 rpm overnight. The supernatant was collected after centrifugation (3900 rpm, 10 min), while the residue was re-extracted twice with 80% methanol (for 1 h). The supernatants were combined and evaporated until dryness at 40 °C in a miVac sample Duo concentrator. The dried extract was redissolved in water and successively extracted with diethyl-ether to remove the pigments, followed by extraction of saponins with saturated n-butanol. The n-butanol extracts were combined and dried under reduced pressure using a rotary evaporator (Buchi Rotavapor R-100, BÜCHI Labortechnik AG, Flawil, Switzerland). The dried extract was redissolved in aqueous methanol 80% (v/v) and subjected to the Vanillin-H2SO4 assay [31,32], using a Sunrise microplate reader at 540 nm. Oleanolic acid (0–0.5 g/L) was used to prepare an external calibration curve. Total saponins were expressed as mg of oleanolic acid equivalents (OE) per 100 g of sample.

2.3.10. Antimicrobial Activity

Powdered samples (1 g) were extracted 3 times with water or methanol in a sonication bath (30 min, rt). The supernatants were combined after centrifugation and evaporated at 60 °C and 40 °C for water and methanolic extracts, respectively, using a miVac sample Duo concentrator. Aqueous methanol 20% (v/v) was used to freshly reconstitute the extract precipitates. Well diffusion assay followed the method described previously by Phan et al. [21] was applied to test the antimicrobial activity against Staphylococcus aureus, a Gram-positive bacteria; Escherichia coli, a Gram-negative bacteria and Candida albicans, a fungi. Penicillin and streptomycin (1 g) (Gibco, Life Technologies, Scoresby, Australia) and 10 μg fluconazole (Sigma-Aldrich) were used as antibacterial and antifungal controls, respectively. Aqueous methanol 20% (v/v) was also included in the assay to evaluate the effect of solvent on microbial growth. The agar plates were incubated at 37 °C for 24 h or 48 h (depending on growth), and the inhibition zones formed around the wells were recorded. The results were expressed as strong (>13 mm), moderate (6–12 mm), weak (≥5 mm) or no inhibitory activity (<5 mm) [33].

2.3.11. Statistical Analysis

A one-way analysis of variance (ANOVA), using Minitab 17 for Windows (Minitab, Inc., State College, PA, USA), was employed to test the variances of measurements. A p-value of 0.05 or less was considered as statistically significant. Pearson’s correlation coefficient analysis was also applied to test correlations between bioactive compounds and bioactivities.

3. Results and Discussion

3.1. Proximate, Minerals and Trace Elements

3.1.1. Proximate

The proximate results showed that the predominant nutritional components of P. angustifolium are carbohydrates and dietary fiber, followed by low amounts of protein and fat (Table 1). Comparing between the two growing conditions (wild vs. cultivated), protein and carbohydrate contents were higher in the cultivated sample (7.2% vs. 10.6% and 26.6% vs. 31.3%, respectively). In contrast, the wild sample contained more fat (4.6% vs. 3.4%) and ash (11.2% vs. 9.6%) than the cultivated one. The slight difference in the proximate composition probably reflects the potential effect of different growing conditions on the biosynthesis of nutritional components in P. angustifolium.
According to Food Standards Australia and New Zealand [34], if a serving of food contains at least 4 to 7 g of dietary fiber, it can be considered as a good to excellent source of dietary fiber. Based on this, P. angustifolium is a good source of dietary fiber (43.3–45.2% DW; Table 1) with a recommended serving size of 10 g powder per day (suggested by Gumby Gumby, Ltd.). Furthermore, a relative high content of ash could be determined (9.6–11.2% DW), indicating the presence of considerable concentrations of inorganic elements in this plant. Hence, it is necessary to determine minerals and trace elements to understand their nutritional significance in this plant.

3.1.2. Minerals and Trace Elements

Generally, there was a significant (p < 0.05) difference in minerals and trace elements between P. angustifolium leaves and stems, with the leaves possessing significantly (p < 0.05) higher levels of minerals and trace elements than the stems (Table 2). Furthermore, the environment had a significant impact on minerals and chemical elements, particularly Ca, Na, K, P, Fe, Al, Ba, Hg and Pb (p < 0.05 between wild and cultivated samples). Only Mg and Ni were found at comparable levels in the wild and cultivated samples (p > 0.05). Several elements such as Ag, Sn and Sb were detected at relatively low levels (below 0.05 mg/kg DW), whereas Ca, K and Fe were found at relatively high levels which could be favorable in terms of their dietary intake (Table 2). For heavy metals, Al was found at the highest level among the heavy metals quantified, followed by Cr, Pb, Cd and Hg, with the Al content being found almost five times higher in the wild compared to the cultivated sample (89 vs. 18 mg/kg DW; Table 2). The obtained results suggest that the levels of minerals and trace elements in P. angustifolium are affected by different growing conditions as well as botanical tissues.

3.2. Vitamins

3.2.1. Non-Folate B Vitamins
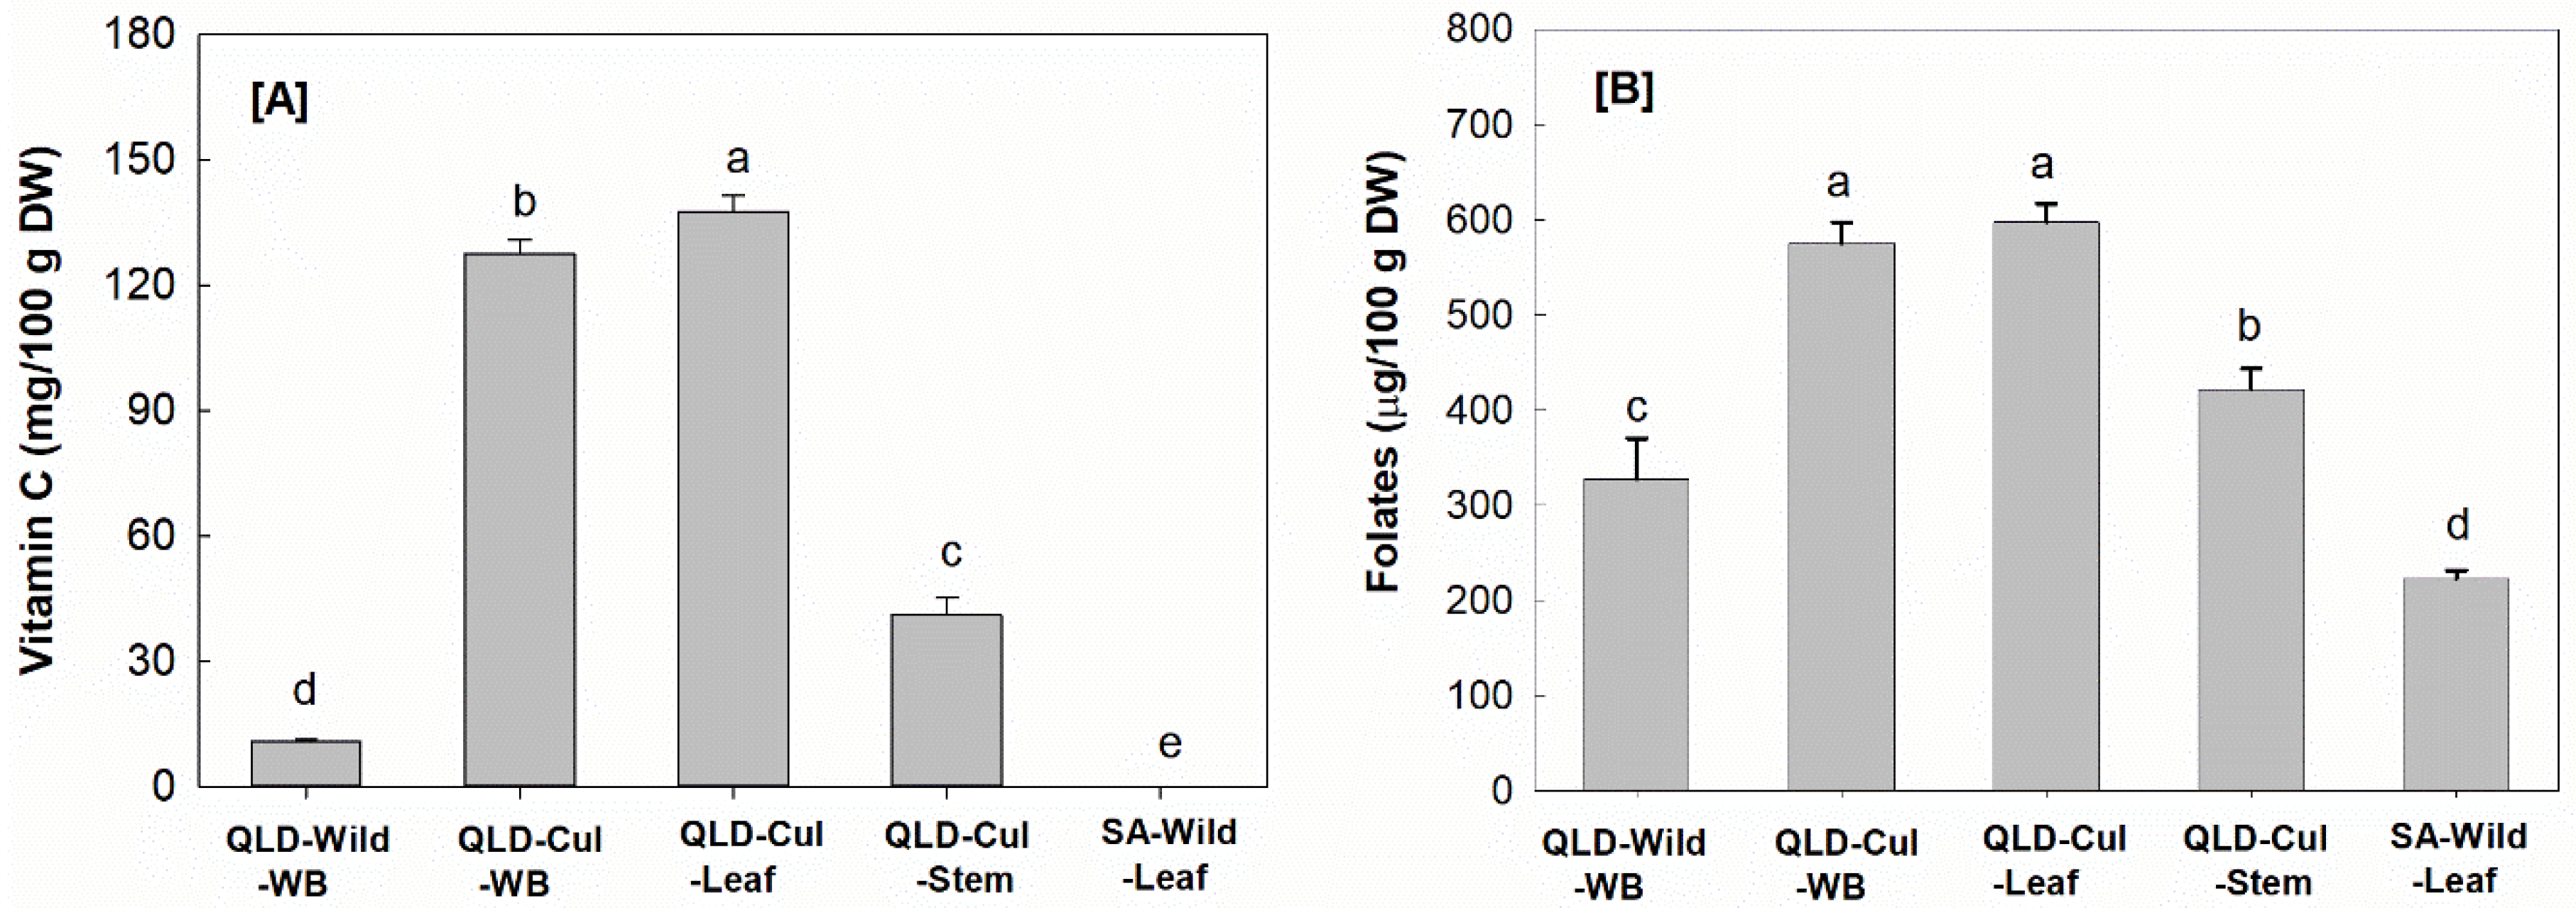
B vitamins are crucial in many metabolic and physiological processes and can act as coenzymes in the energy metabolism (vitamins B1, B2, B3, B5 and B7), production of new cells (vitamins B6 and B12), protein metabolism (vitamin B6), and are essential for a functioning nervous system (vitamins B1, B3 and B12) [40]. Table 3 shows that only vitamins B2, B3, B5 and B6 could be quantified in the P. angustifolium whole branch sample (59 to 1300 µg/100 g DW) and vitamins B1, B7 and B12 were only found in traces (<5 µg/100 g DW). Vitamin B3 was the highest among the analyzed B vitamins. Similar to the proximate composition, the cultivated sample contained more B vitamins (B2, B3 and B5) than the wild sample. Only vitamin B6 was higher in the wild sample. The recommended dietary intakes (RDI) for the analyzed B vitamins are also included in Table 3 for reference and extrapolation.

3.2.2. Vitamin C

Figure 2A shows that the cultivated leaf sample had the highest (p < 0.05) vitamin C content (137 mg/100 g DW) among the samples tested, followed by the whole branch and the stem samples. Ascorbic acid was not detectable (LOD = 0.1 ppm) in the P. angustifolium leaves collected from the wild in SA (SA–Wild–Leaf; Figure 2A). Regarding the impact of growing conditions, the wild samples had significantly (p < 0.05) lower vitamin C levels than the cultivated samples collected in QLD. The results reflect not only the importance of growing conditions and location, but also the drying procedure and sample treatment, which are critical in preserving vitamin C. The samples collected from the wild, both in SA and QLD, were air-dried, whereas the cultivated samples were freeze-dried, which is a very mild preservation procedure. Vitamin C found in the cultivated leaf sample was double the amount of that reported in green tea leaf powder (60 mg/100 g DW [41]).

3.2.3. Folates

Folates were found at moderate levels in the P. angustifolium samples following the order: QLD–Cul–Leaf > QLD–Cul–WB > QLD–Cul–Stem > QLD–Wild–WB > SA–Wild–Leaf (Figure 2B). 5-CH3-H4folate, the biologically active folate form, was the main folate vitamer found in the studied P. angustifolium samples (data not shown). Among the analyzed tissues, the leaves had a significantly (p < 0.05) higher folate content than the stem, but no difference (p > 0.05) could be observed between the leaves and the whole branch samples. Similar to vitamin C (Figure 2A), the total folate content of the leaves collected in SA was the lowest (p < 0.05) among the samples studied (Figure 2B), indicating the impact of the geographic location and/or sample treatment. The results also showed that the levels of folate in P. angustifolium (222–597 µg/100 g DW, equivalent to 74–220 µg/100 g FW, considering a moisture content of 63%) are comparable to strawberry (59–153 µg/100 g FW [41]), a popular dietary source of folate. However, it should be noted that the common serving size of P. angustifolium (max. 10 g powder) is much lower than that of strawberry fruit (144 g).

3.3. Total Phenolic Content (TPC)

The TPC results (free and bound) ranged from 730 to 4075 mg GAE/100 g DW, depending on the plant tissue and geographic location, but was not affected by growing conditions (wild vs. cultivated) (Table 4). Furthermore, the free-TPC was considerably higher in all samples compared to the bound-TPC, as the free-TPC accounted for >90% of total TPC. The stems had lower total TPC (free and bound) compared to the leaf samples but contained more (p < 0.05) bound TPC than the leaves; however, the bound TPC only contributed a minor proportion to the total TPC.
There was no difference (p > 0.05) in the TPC of the samples collected from the wild or cultivated in QLD. In contrast, different growing locations affected the TPC, as the wild leaves collected in SA possessed ca. 3-fold more (p < 0.05) total phenolics than the QLD samples (Table 4). The results of the present study are similar to the reported TPC in leaves and twigs of other species belonging to the Pittosporaceae family, ranging from 2600 to 4090 mg GAE/100 g DW [42,43,44,45]. However, compared to green tea leaf powder, a popular source of polyphenols, the TPC in the studied P. angustifolium samples was lower (730–4075 mg GAE/100 g DW vs. 6500–10,600 mg/100 g DW [46]).

3.4. Total (Condensed) Tannins

The total tannin content (TTC) in the studied P. angustifolium samples ranged from 15.9 to 52 mg CaE/100 g DW (Table 4) and was much lower than the TPC. Furthermore, the TTC was significantly (p < 0.05) affected by the geographical location, whereas growing conditions and different plant tissues did not affect (p > 0.05) the TTC. The QLD-grown samples showed a significantly (p < 0.05) lower TTC compared to the SA-grown sample. There is also a controversy in reporting tannins in Pittosporum species, probably due to the diversity of genotypes. For example, Amoo et al. [44] reported that condensed tannins were not detectable in leaves and twigs of P. viridiflorum collected in KwaZulu-Natal (South Africa), whereas Vesoul and Cock [14] and Momeni et al. [47] reported the presence of tannins (qualitative data only) in P. phylliraeoides collected in Queensland (Australia) and P. viridiflorum grown in Western Cameroon (Africa), respectively.

3.5. Saponins

Table 4 shows that P. angustifolium leaves and stems are rich sources of saponins, with levels up to 4000 mg/100 g equivalent to 4% on dry weight basis. Comparison with common saponin-rich foods such as legume seeds, including chickpeas (230 mg/100 g DW), kidney beans (410 mg/100 g DW) and soya beans (650 mg/100 g DW) [48], the saponin content in the studied P. angustifolium samples is approximately 10-times higher. Contrary to the TTC and TPC, with SA leaves having significantly (p < 0.05) higher levels, the saponin content of P. angustifolium whole branch and leaves collected in QLD was higher than that of the SA leaves (trend only, p > 0.05; Table 4). Interestingly, the saponin level in the leaf sample was double that of the stem (3870 vs. 1589 mg OE/100 g DW), indicating a significant (p < 0.05) effect of the botanical tissue. There is limited information available regarding quantification of saponins in P. angustifolium as several previous studies only reported the presence of saponins in the Pittosporum genus by using qualitative screening tests without further quantification [11,14]. Recently, by applying NMR spectroscopy, mono- and bis-demosidic triterpene saponins as well as taraxastane-type triterpene saponins have been structurally identified as the main triterpenoid saponin compounds in P. angustifolium [8,9,10]. Further studies on profiling and quantification of individual saponins in this plant are necessary.

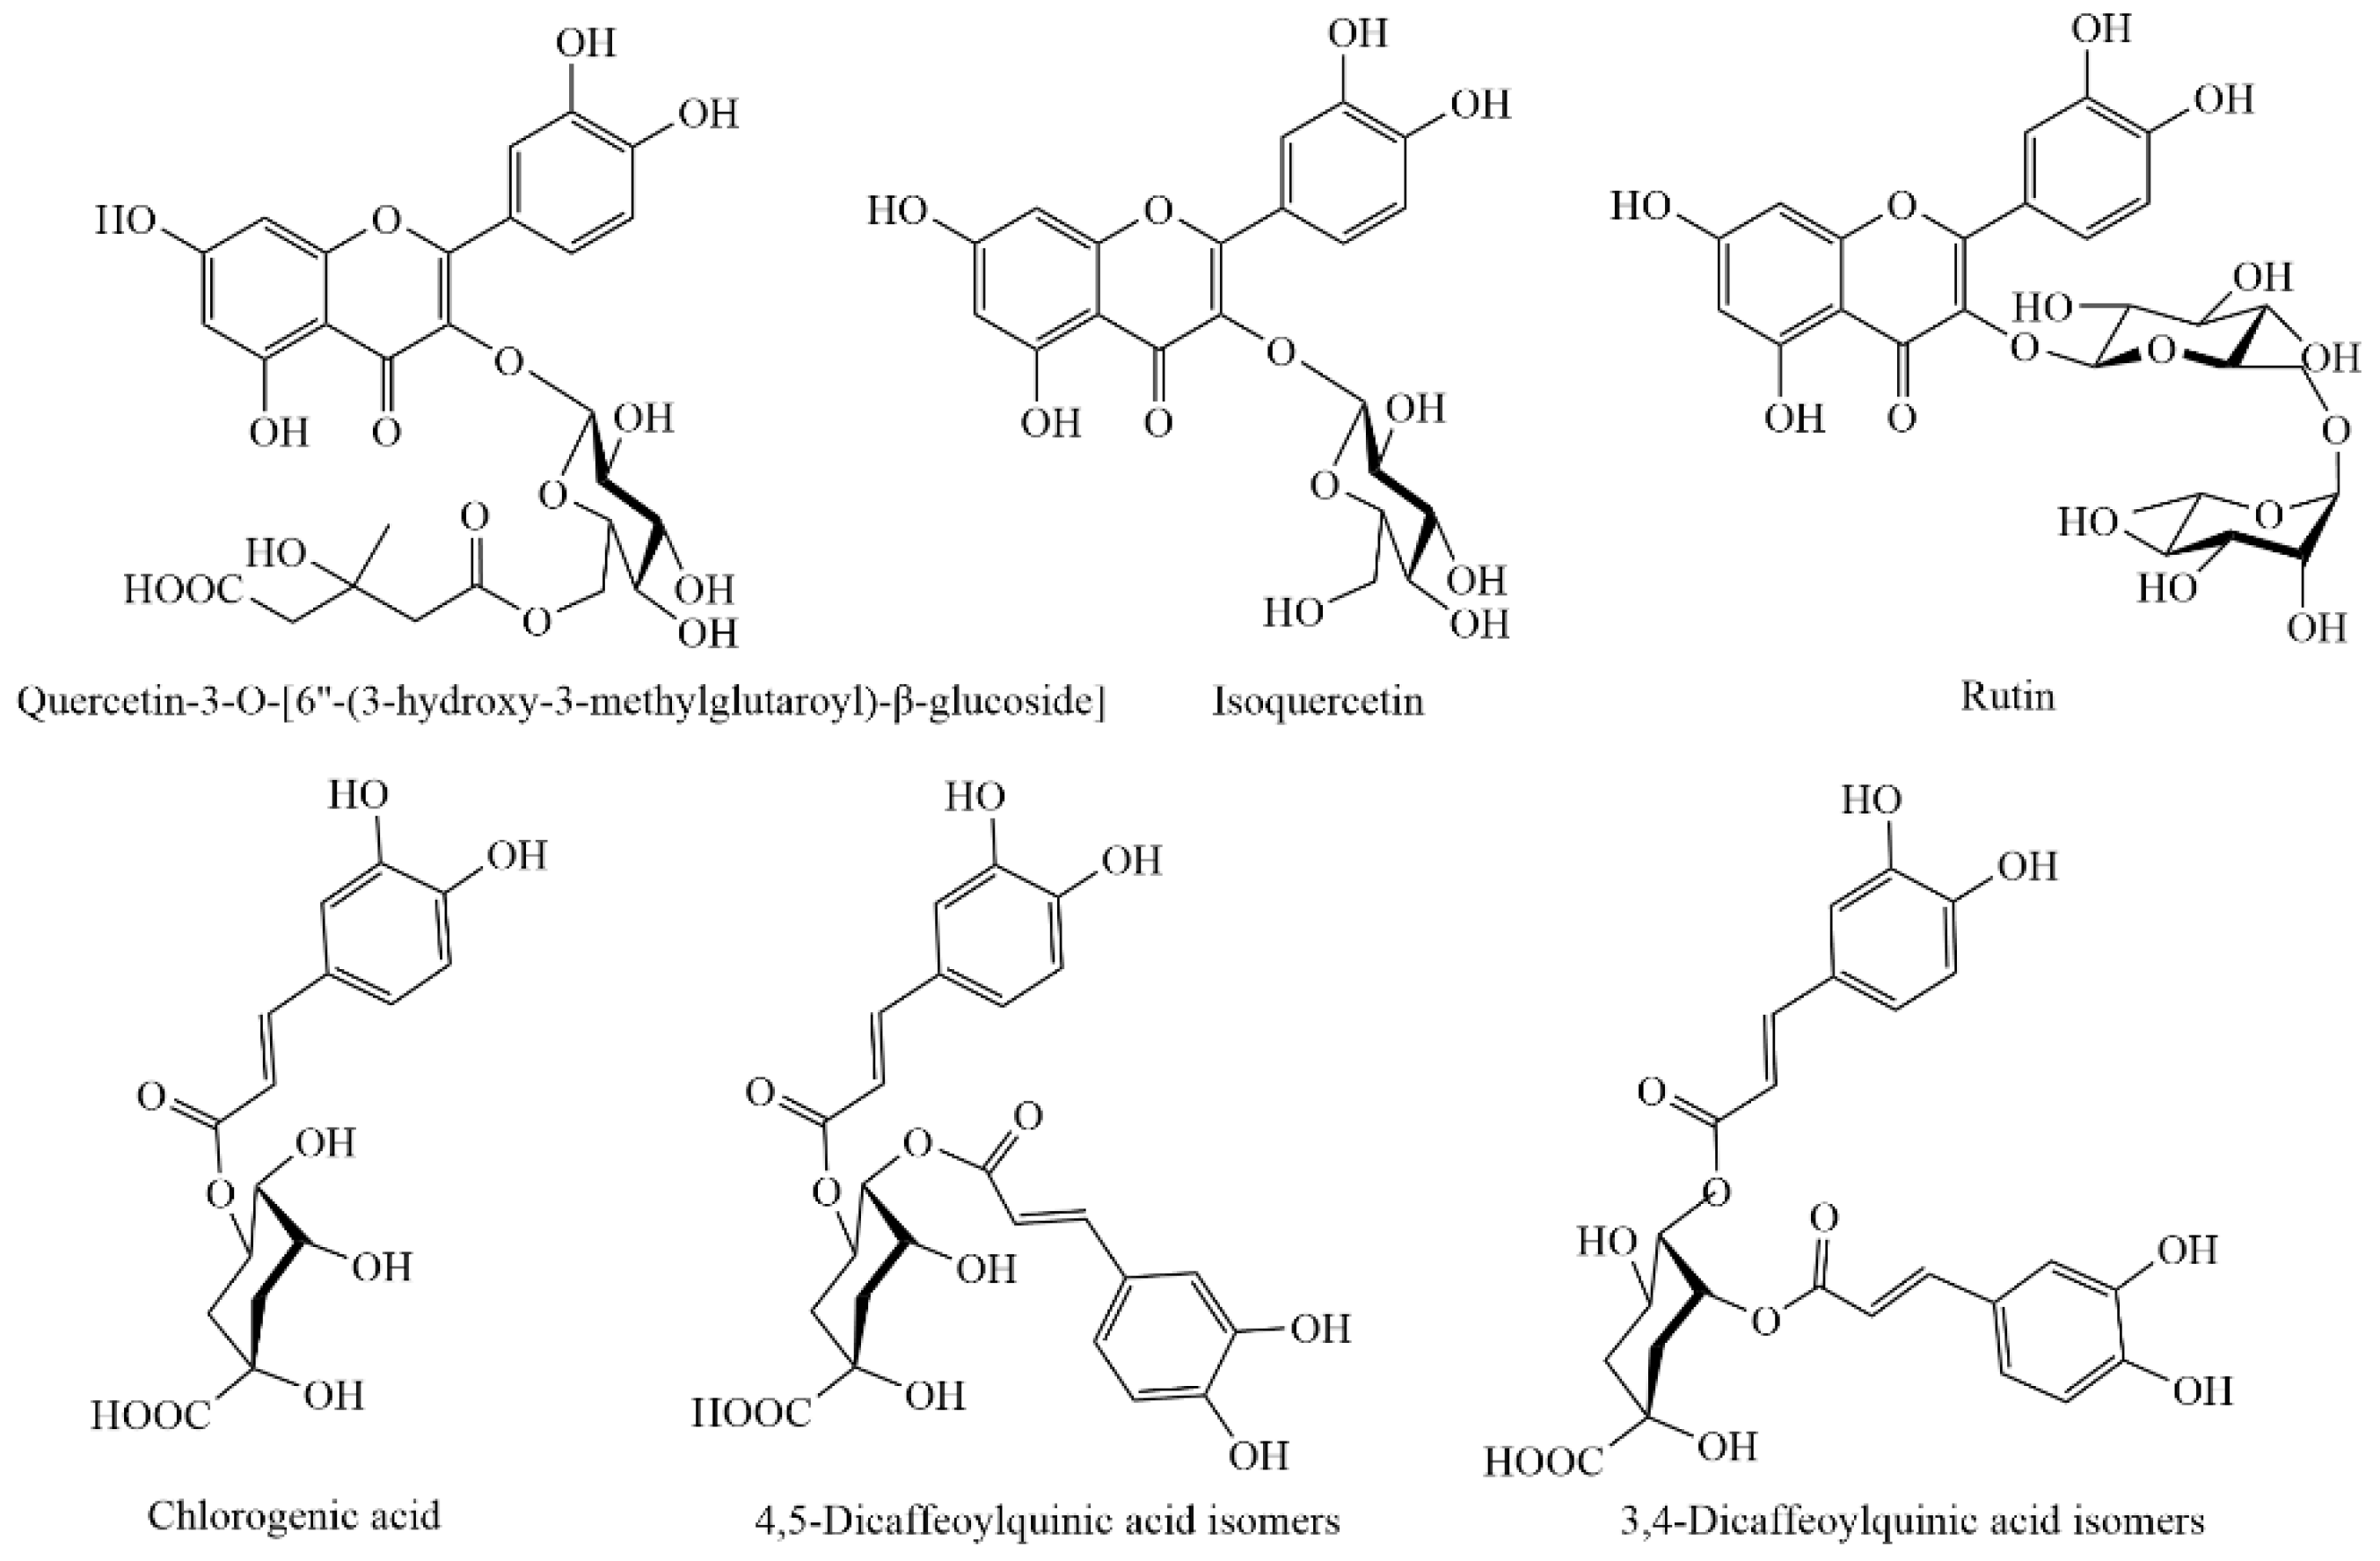
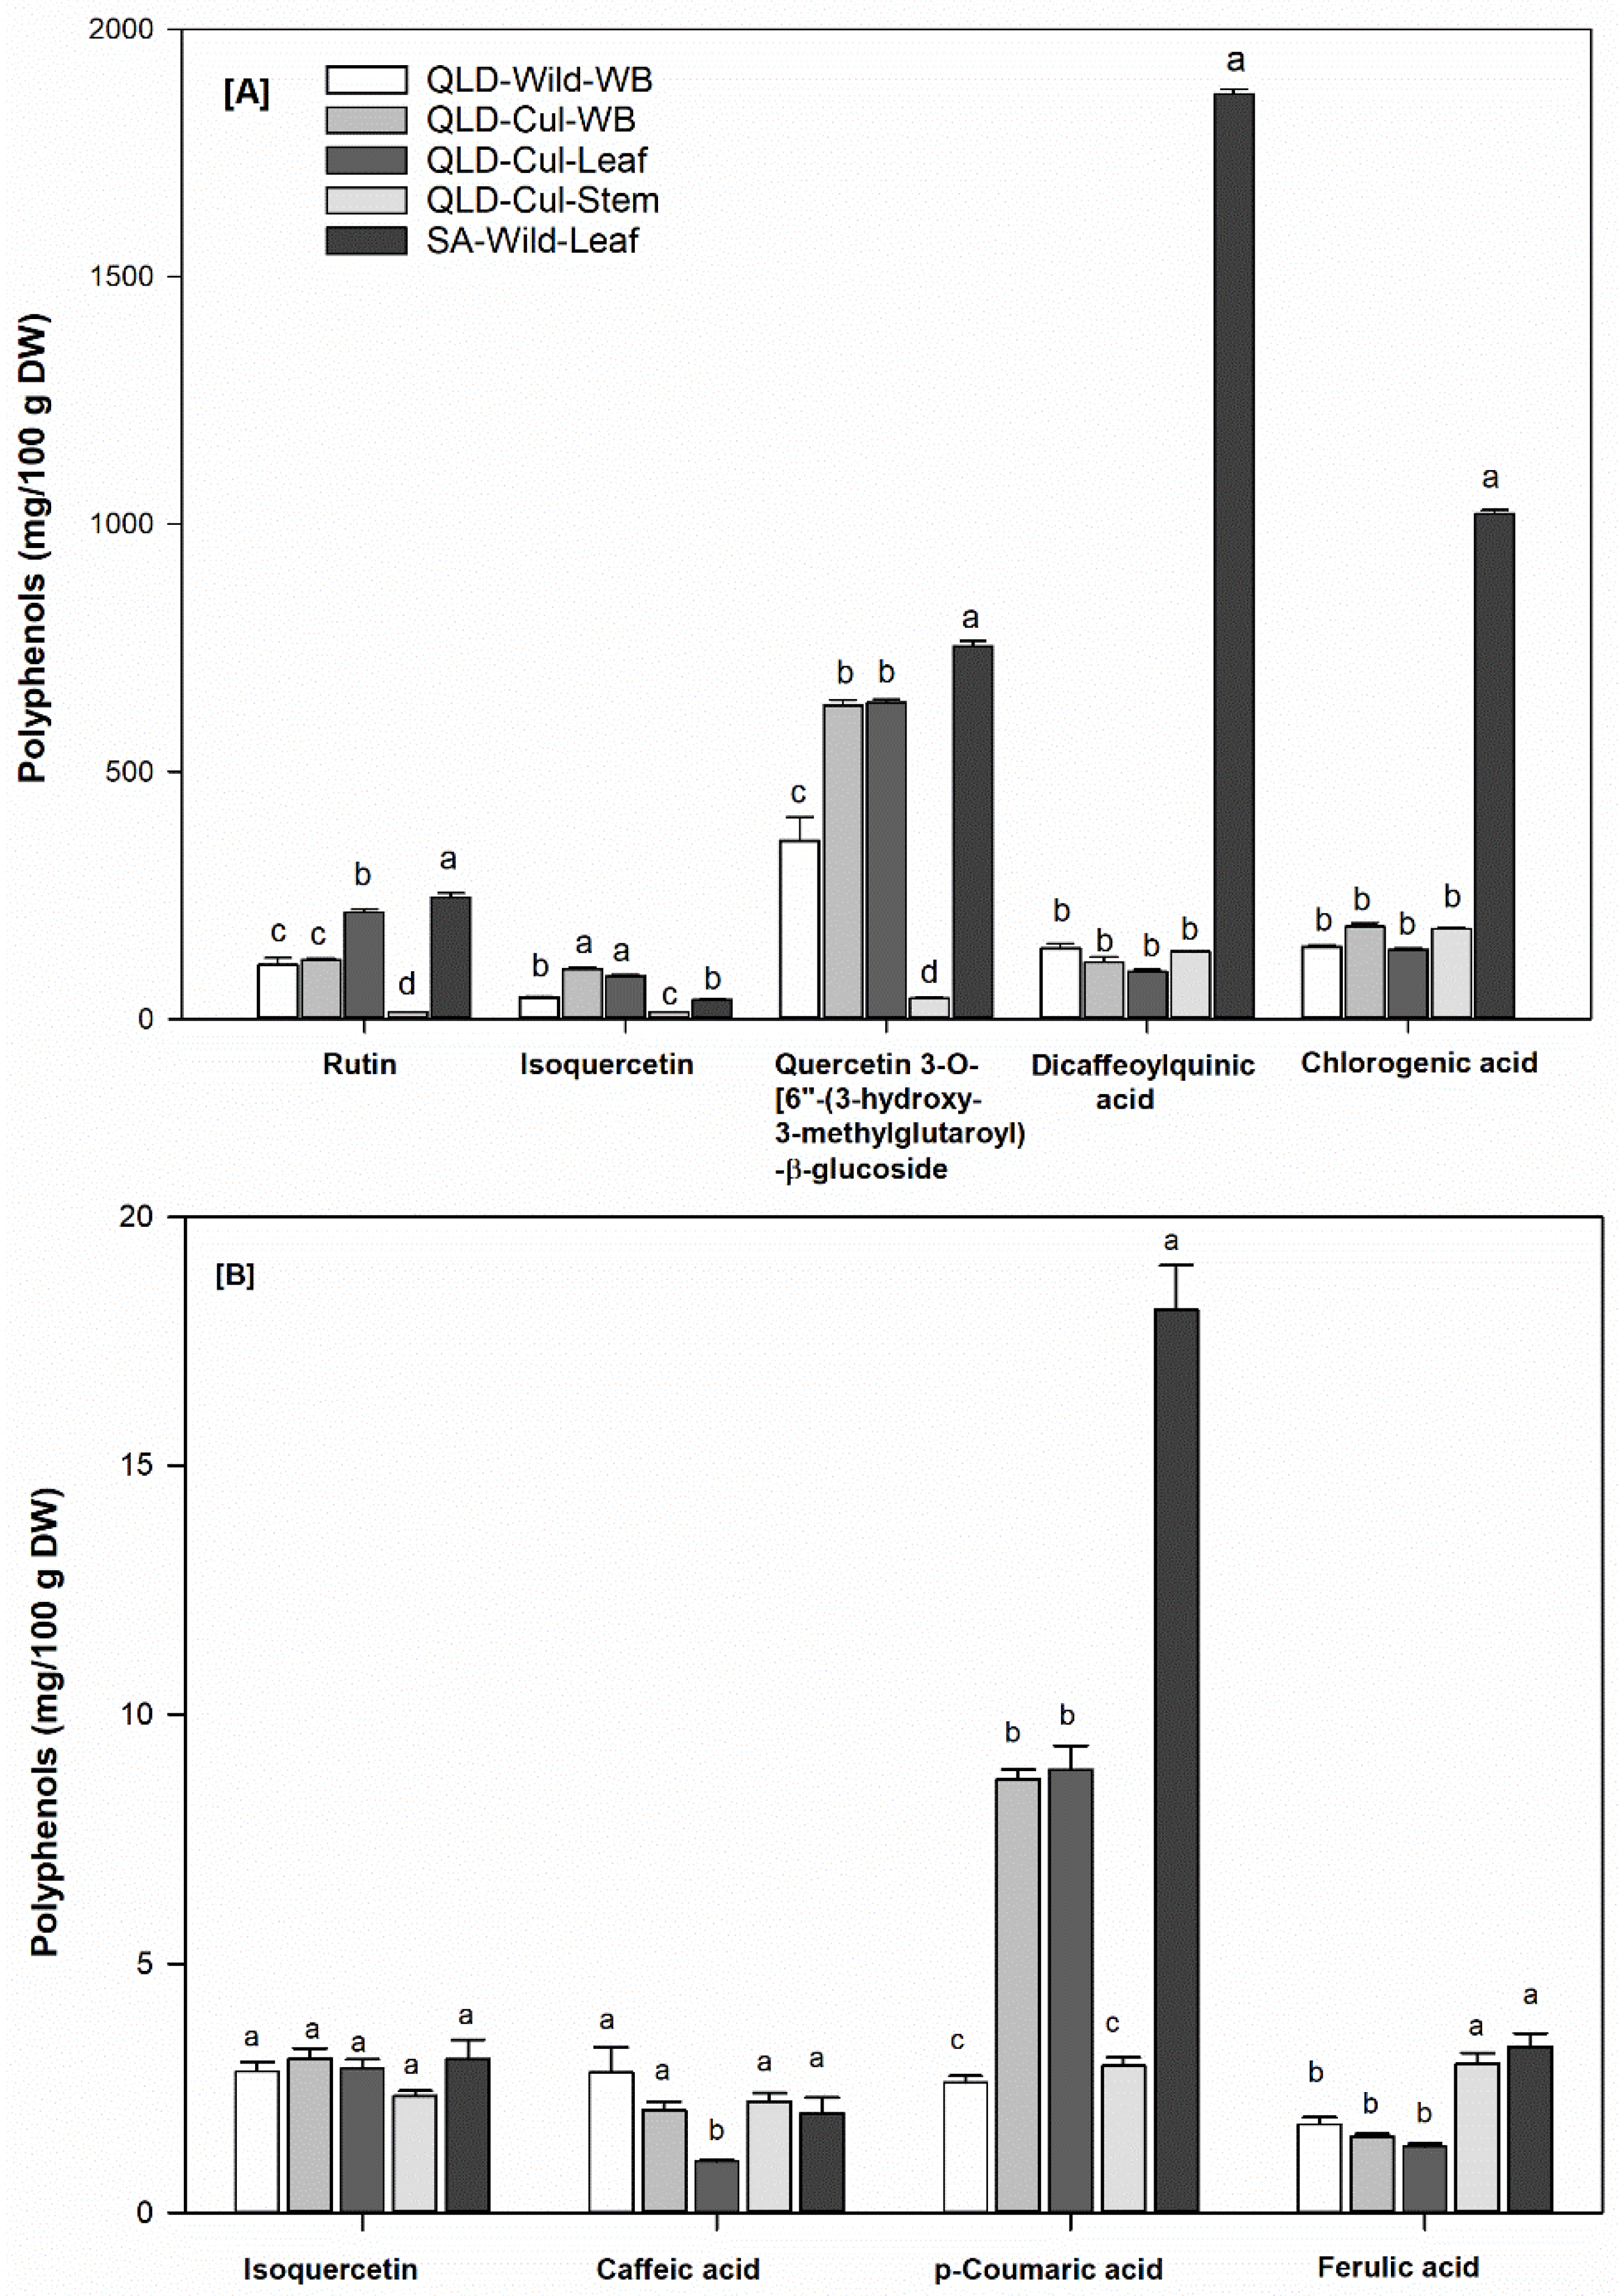
3.6. Individual Phenolic Compounds
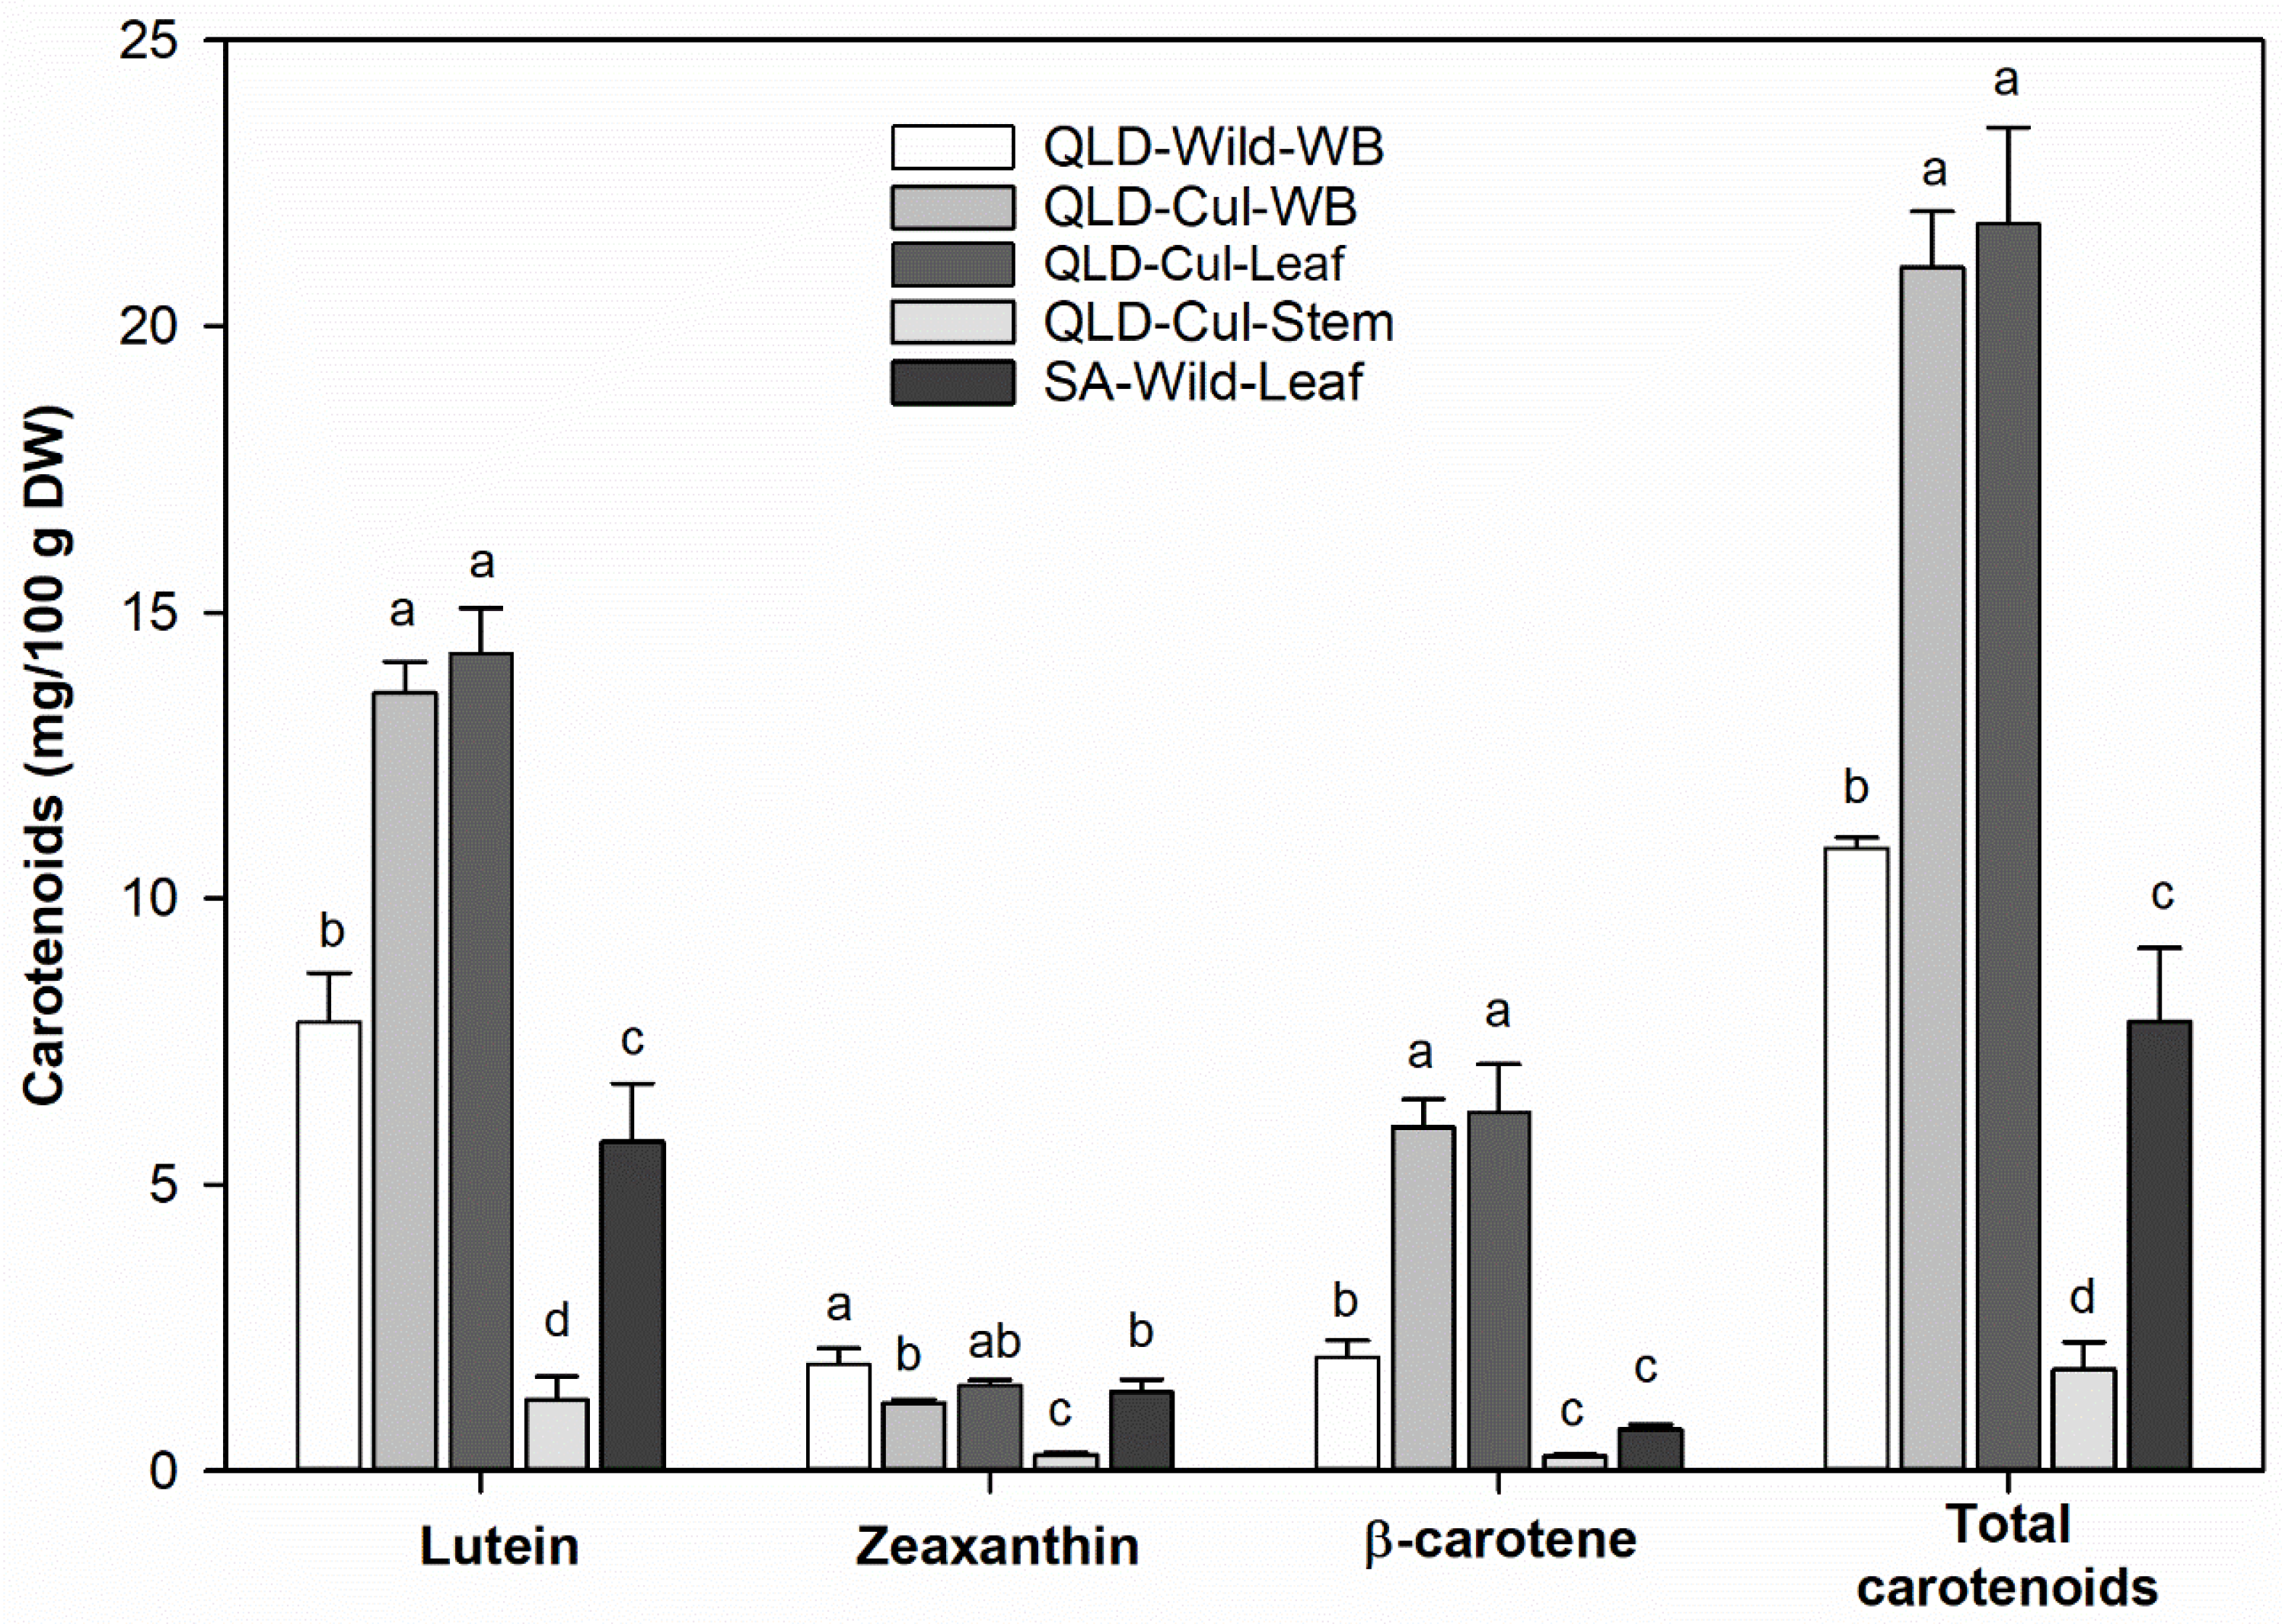
Figure 3A,B presents the predominant phenolic compounds identified in the studied P. angustifolium samples (further details are summarized in Supplementary Table S2 & Figure S1). In agreement with the TPC (Section 3.3), the total amount of free phenolic compounds was considerably higher than that of bound phenolics (689–3931 vs. 10.1–26.5 mg/100 g DW, data not shown), suggesting that the free polyphenols may be primarily responsible for potential biologic activities of P. angustifolium.
However, all samples showed a similar phenolic profile, the concentrations of individual phenolic compounds varied depending on the extract (free or bound), botanical tissues, growing condition and location. For instance, the free extract was rich in flavonoids, whereas phenolic acids were predominant in the bound extract (Figure 3). While the stem had significantly (p < 0.05) lower levels of free phenolic acids and flavonoids than the leaves, the leaves had lower levels of bound phenolic compounds compared to the stem, except for p-coumaric acid. Similar to the TPC, a significantly (p < 0.05) higher amount of phenolic acids and flavonoids (free > 3-fold and bound ca. 2-fold) was found in the SA leaves compared to the QLD grown samples (Figure 3), clearly indicating the effect of geographical location on individual polyphenols.
Previously, a number of studies have reported the presence of caffeic, ferulic and p-coumaric acids in methanolic extracts of P. tobira seeds [19] as well as rutin, isoquercitrin, isoquercitrin-hydroxymethylglutaroyl-β-glucoside and dicaffeoylquinic acids in the leaves of P. angustifolium [12] (Figure 1), which support the findings of the present study as shown in Figure 3A,B. Interestingly, chlorogenic acid, which has not been previously reported in P. angustifolium, was also detected in the studied samples (Figure 3A).

3.7. Carotenoids

Lutein, zeaxanthin and β-carotene could be identified as the main carotenoids in the P. angustifolium samples (Figure 4 and Supplementary Table S3 & Figure S2). Lutein was the predominant carotenoid (>70% of the total carotenoid content), followed by zeaxanthin or β-carotene (depending on the sample). The total carotenoid content varied from 1.8 to 21.8 mg/100 g DW, which is higher than that reported for sweet corn (3.7 mg/100 g DW [49]).
There was significant (p < 0.05) variation in carotenoid content between different botanical tissues. The stem had lower (p < 0.05) carotenoid levels than the leaves, suggesting that carotenoids are mainly synthesized and stored in the leaf tissue. An approximately 2-fold higher concentration of carotenoids (except for zeaxanthin) could be found in the cultivated sample compared to the wild samples collected from both QLD and SA. This is most likely due to differences in sample treatment and storage conditions (as also observed for vitamin C and folates). To the best of our knowledge, this is the first study reporting individual carotenoids in P. angustifolium.

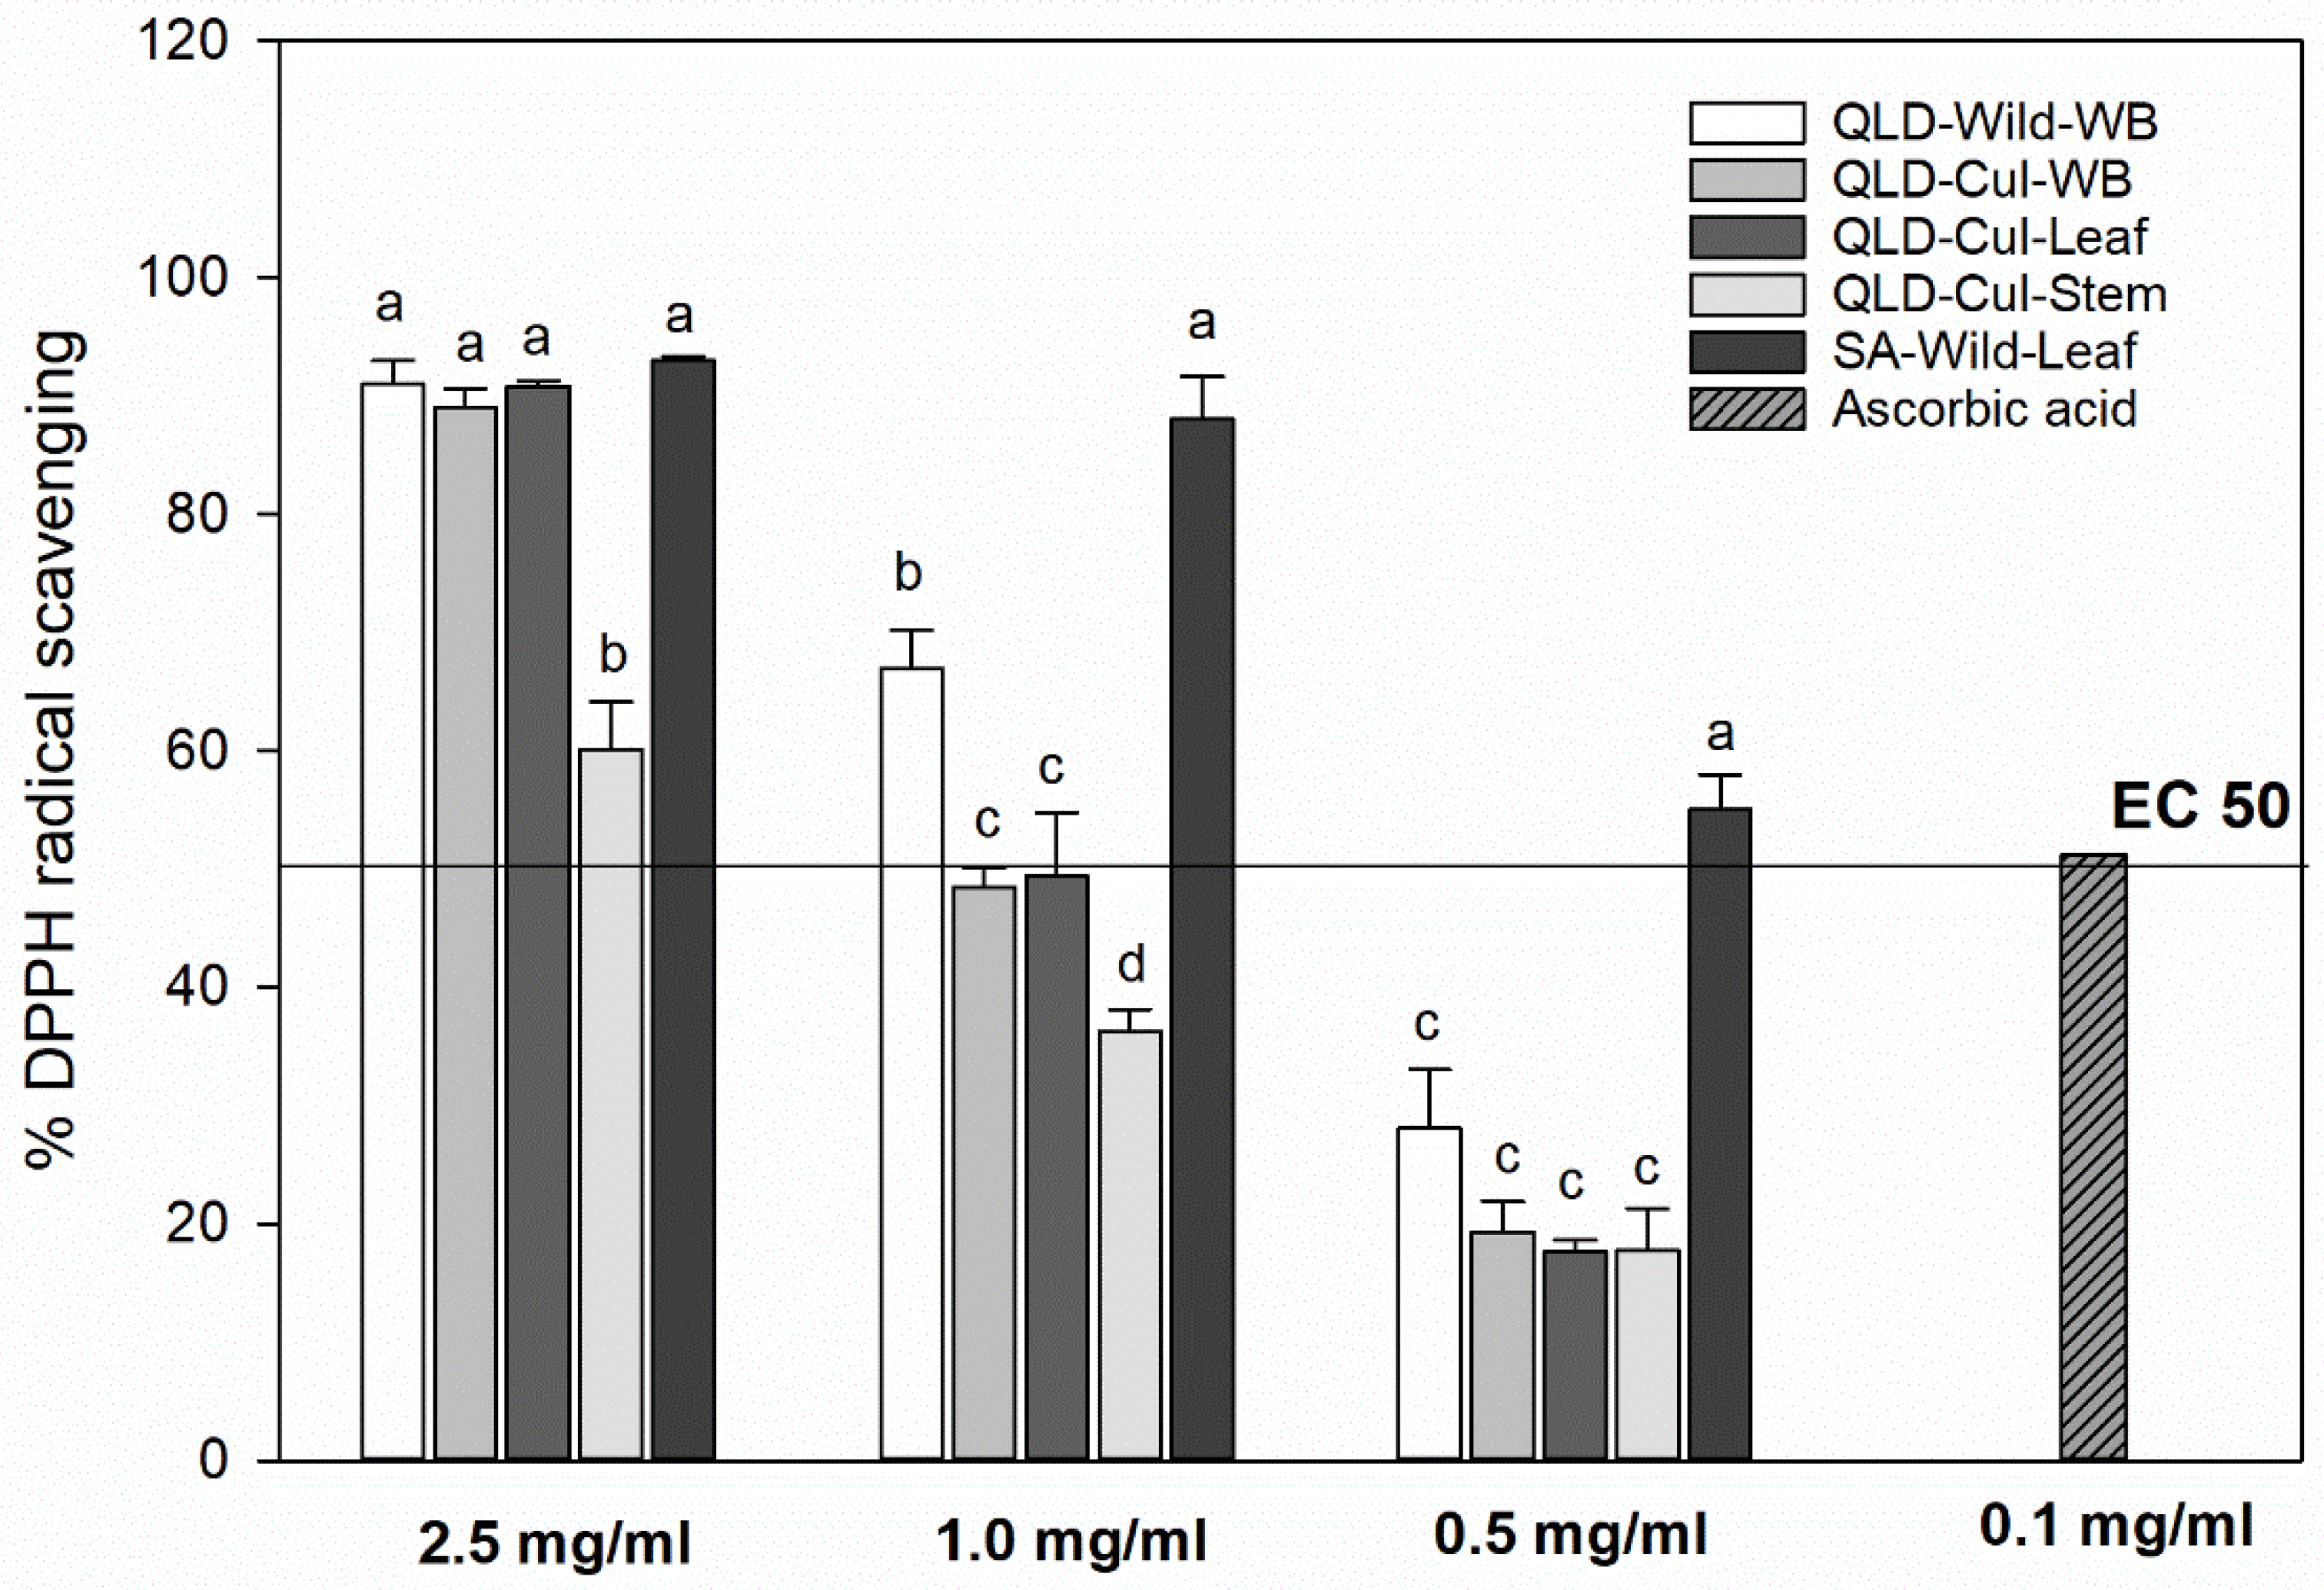
3.8. DPPH Radical-Scavenging Capacity

The leaf sample, collected from the wild in SA, exhibited a significantly (p < 0.05) higher DPPH radical-scavenging capacity at 0.5 and 1 mg powder/mL, followed by the QLD whole branch sample collected from the wild (QLD–Wild–WB) (Figure 5), which strongly correlates with the TPC and individual phenolic compounds. The cultivated samples showed significantly (p < 0.05) lower radical-scavenging capacity than the wild samples, except for the concentration of 2.5 mg powder/mL. The results also showed that the extracts from the SA leaves (0.5 g powder/mL) or from the QLD samples (0.7–1 g powder/mL) collected either from the wild or cultivated exhibited a similar DPPH radical-scavenging capacity (EC50) as 0.1 mg ascorbic acid (Figure 5). However, the cultivated leaf sample contained more vitamin C, folates and carotenoids than the samples collected from the wild (QLD and SA), more sample material was needed to reduce the initial DPPH radical concentration by 50% (EC50: 1 g powder/mL QLD cultivated leaves vs. 0.7 g powder/mL QLD wild leaves or 0.5-g powder/mL SA wild leaves). This clearly indicates a possible correlation of DPPH radical-scavenging capacity with polyphenols, as a result of their electron transfer/hydrogen donating ability. The SA leaves had the highest levels of TPC and tannins, resulting in the highest DPPH radical-scavenging capacity. The Pearson’s correlation coefficient test (Section 3.10) supports this interpretation.

3.9. Antimicrobial Susceptibility Test

Both methanolic and water extracts of the P. angustifolium samples showed inhibition against C. albicans, with inhibition zones being similar to the standard antibiotic solution (Table 5). However, no inhibition against E. coli and S. aureus was observed, except for the SA leaves which showed a moderate inhibition to S. aureus. The observed inhibition zones varied from 12.8 to 26.9 mm, suggesting a strong antimicrobial activity of the extracts from P. angustifolium against C. albicans. Although there was a substantial variation in bioactive compounds, depending on the botanical tissue, growing condition and geographical location, comparable antifungal activity was observed for all samples, except for the SA leaves, which showed higher antimicrobial activity (trend only, p > 0.05) compared to the QLD grown samples (Table 5). Furthermore, the water extract of the QLD whole branch sample collected from the wild showed significantly lower (nearly 2-fold; p < 0.05) inhibition compared to the cultivated sample, although those samples had similar levels of bioactive compounds. This suggests that the microbial inhibitory effect may be primarily driven by a synergistic effect of the polyphenol/bioactive compounds “complex” present in the extracts rather than a specific subclass or individual bioactive compound as previously hypothesized by Barbieri et al. [50].
A comparison between the two extraction methods showed that the water extract exhibited stronger antifungal activity than the methanolic extract, except for the QLD–Wild–WB sample (Table 5). Differences in the antimicrobial activity between the two extraction methods may be due to differences in the extraction efficiency resulting in higher or lower concentrations of specific bioactive compounds with antimicrobial activity (e.g., against C. albicans). The obtained results of antimicrobial activity are in agreement with the study of Vesoul and Cock [14], who previously reported a relatively low or no inhibitory effect of water and/or methanolic extracts of P. phylliraeoides against E. coli and S. aureus.

3.10. Pearson’s Correlation Analysis

The results of Pearson’s correlation test (Table 6) indicated a positive correlation (R2 = 0.64–0.92, p < 0.05) between polyphenols (e.g., TPC, rutin, quercetin 3-O-[6”-(3-hydroxy-3-methylglutaroyl)-β-glucoside], dicaffeoylquinic acid and tannins) and the DPPH radical-scavenging capacity. Saponins and polyphenols, particularly tannins, rutin and quercetin 3-O-[6″-(3-hydroxy-3-methylglutaroyl)-β-glucoside], one of the main phenolic compounds present in the free form, showed a positive (R2 = 0.76–0.81, p < 0.05) correlation with the antifungal activity. However, vitamin C (another strong antioxidant), folates and carotenoids were negatively correlated with the DPPH radical-scavenging capacity and antimicrobial activity (Table 6). This may be due to the relatively low concentrations of these vitamins and pro-vitamins in the tested samples, which were most likely too low to show any significant effects in reducing the DPPH radicals or antimicrobial activity. The results of the Pearson’s correlation test provided a general understanding on how bioactive compounds may contribute to the observed biologic effects of P. angustifolium.

4. Conclusions

The present study, to the best of our knowledge, reports for the first time the proximate composition, minerals and trace elements, vitamins and carotenoids in P. angustifolium leaves and stems collected from the wild or cultivated. P. angustifolium leaves could be identified as a rich source of saponins and polyphenols, whereas carotenoids, tannins and vitamins (B and C) were present at lower levels. The results indicate that multiple factors, such as growing condition, geographic location and different botanical tissues, can have a significant effect on the bioactive compounds in P. angustifolium and subsequently its bioactivity. However, further studies with more samples (total number and replicates), different seasons and growing locations, are strongly recommended to substantiate the results of the present study. The finding of the Pearson’s correlation suggests that only polyphenols have a significant correlation with the DPPH radical-scavenging capacity, whereas the antifungal activity against C. albicans was positively correlated with both polyphenols and saponins. This study further confirms the relationship between (phyto) chemicals and biologic properties in P. angustifolium, suggesting potential applications of this Australian indigenous plant as a functional (food) ingredient and/or a natural fungicide.

Supplementary Materials

The following are available online at https://www.mdpi.com/2304-8158/9/7/887/s1: Figure S1: Representative ion chromatograms and fragmentation patterns of detected phenolic compounds in P. angustifolium. Figure S2: Representative ion chromatograms and fragmentation patterns of detected carotenoids in P. angustifolium. Table S1: Details of chromatographic analysis of carotenoids, polyphenols, ascorbic acid and folates [51]. Table S2: Characterization of phenolic compounds detected in P. angustifolium by UHPLC-ESI-MS/MS scanning at negative mode. Table S3: Characterization of carotenoid compounds detected in P. angustifolium by UHPLC-APCI-MS/MS scanning at positive mode.

Author Contributions

Conceptualization, A.D.T.P., M.E.N. and Y.S.; methodology, A.D.T.P., M.C., U.T. and H.T.H.; software, A.D.T.P.; validation, A.D.T.P., M.E.N. and Y.S.; formal analysis, A.D.T.P., M.C. and U.T.; data curation, A.D.T.P.; writing—original draft preparation, A.D.T.P.; review and editing, M.C., H.T.H., U.T., M.E.N. and Y.S.; supervision, M.E.N. and Y.S.; funding acquisition, Y.S. All authors have read and agreed to the published version of the manuscript.

Funding

This research was funded by the Commonwealth Department of Industry and Science via the Innovation Connection Grant Scheme and The Australian Research Council (ARC) Industrial Transformation Training Centre for Uniquely Australian Foods (Grant number: IC180100045).

Acknowledgments

The authors acknowledge Ken Murray (Gumby Gumby Australia, Ltd.) for his support and collection of plant material. The authors acknowledge the Traditional Owners of the lands on which the P. angustifolium grows and respect the knowledge and experience the Traditional Owners hold regarding the care, harvest and use of these plants.

Conflicts of Interest

The authors declare no conflict of interest.

References

  1. Smith, T.; Gillespie, M.; Eckl, V.; Knepper, J.; Reynolds, C.M. Herbal Supplement Sales in US Increase by 9.4% in 2018. HerbalGram 2019, 123, 62–73. [Google Scholar]
  2. Cayzer, L.W.; Crisp, M.D.; Telford, I. Revision of Pittosporum (Pittosporaceae) in Australia. Aust. Syst. Bot. 2000, 13, 845–902. [Google Scholar] [CrossRef]
  3. Lassack, E.V.; Mccarthy, T. Australian Medicinal Plants; Methuen Australia: Sydney, Australia, 1983; p. 240. [Google Scholar]
  4. Latz, P. Bushfires and Bushtucker: Aboriginal Plant Use in Central Australia; Iad Press: Oxford, UK, 1995. [Google Scholar]
  5. Cock, I.; Winnett, V.; Sirdaarta, J.; Matthews, B. The potential of selected Australian medicinal plants with anti-Proteus activity for the treatment and prevention of rheumatoid arthritis. Pharmacogn. Mag. 2015, 11, S190. [Google Scholar] [CrossRef] [PubMed] [Green Version]
  6. Madikizela, B.; McGaw, L.J. Pittosporum viridiflorum Sims (Pittosporaceae): A review on a useful medicinal plant native to South Africa and tropical Africa. J. Ethnopharmacol. 2017, 205, 217–230. [Google Scholar] [CrossRef] [Green Version]
  7. Errington, S.G.; Jefferies, P.R. Triterpenoid sapogenins of Pittosporum phillyraeoides. Phytochemistry 1988, 27, 543–545. [Google Scholar] [CrossRef]
  8. Backer, C.; Jenett-Siems, K.; Siems, K.; Wurster, M.; Bodtke, A.; Chamseddin, C.; Crusemann, M.; Lindequist, U. Triterpene glycosides from the leaves of Pittosporum angustifolium. Planta Med. 2013, 79, 1461–1469. [Google Scholar] [CrossRef] [Green Version]
  9. Backer, C.; Jenett-Siems, K.; Siems, K.; Wurster, M.; Bodtke, A.; Niedermeyer, T.H.J.; Lindequist, U. New Mono and Bisdesmosidic Triterpene Glycosides from Pittosporum angustifolium Lodd. Z. Fur Nat. Sect. B A J. Chem. Sci. 2014, 69, 1026–1044. [Google Scholar] [CrossRef]
  10. Backer, C.; Jenett-Siems, K.; Siems, K.; Niedermeyer, T.H.J.; Wurster, M.; Bodtke, A.; Lindequist, U. Taraxastane-type triterpene saponins isolated from Pittosporum angustifolium Lodd. Z. Fur Nat. Sect. B A J. Chem. Sci. 2015, 70, 403–408. [Google Scholar] [CrossRef]
  11. Sadgrove, N.; Jones, G. Chemical and biological characterisation of solvent extracts and essential oils from leaves and fruit of two Australian species of Pittosporum (Pittosporaceae) used in aboriginal medicinal practice. J. Ethnopharmacol. 2013, 145, 813–821. [Google Scholar] [CrossRef]
  12. Bäcker, C.; Jenett-Siems, K.; Bodtke, A.; Lindequist, U. Polyphenolic compounds from the leaves of Pittosporum angustifolium. Biochem. Syst. Ecol. 2014, 55, 101–103. [Google Scholar] [CrossRef]
  13. Manase, M.J.; Mitaine-Offer, A.-C.; Miyamoto, T.; Tanaka, C.; Delemasure, S.; Dutartre, P.; Lacaille-Dubois, M.-A. New triterpenoid estersaponins from the root barks of Pittosporum verticillatum subsp. verticillatum and evaluation of cytotoxicities. Fitoterapia 2013, 91, 231–235. [Google Scholar] [CrossRef] [PubMed]
  14. Vesoul, J.; Cock, I. An examination of the medicinal potential of Pittosporum phylliraeoides: Toxicity, antibacterial and antifungal activities. Pharmacogn. Commun. 2011, 1, 8–17. [Google Scholar] [CrossRef] [Green Version]
  15. Association of Official Analytical Chemists. Official Methods of Analysis; Association of Official Analytical Chemists: Washington, DC, USA, 1997. [Google Scholar]
  16. Association of Official Analytical Chemists. Official Methods of Analysis; Association of Official Analytical Chemists: Washington, DC, USA, 1999. [Google Scholar]
  17. Association of Official Analytical Chemists. Official Methods of Analysis; Association of Official Analytical Chemists: Washington, DC, USA, 2000. [Google Scholar]
  18. Akter, S.; Netzel, M.E.; Fletcher, M.T.; Tinggi, U.; Sultanbawa, Y. Chemical and Nutritional Composition of Terminalia ferdinandiana (Kakadu Plum) Kernels: A Novel Nutrition Source. Foods 2018, 7, 60. [Google Scholar] [CrossRef] [PubMed] [Green Version]
  19. Rjeibi, I.; Ncib, S.; Ben Saad, A.; Souid, S. Evaluation of nutritional values, phenolic profile, aroma compounds and biological properties of Pittosporum tobira seeds. Lipids Health Dis. 2017, 16, 206. [Google Scholar] [CrossRef] [Green Version]
  20. Adom, K.K.; Liu, R.H. Antioxidant Activity of Grains. J. Agric. Food Chem. 2002, 50, 6182–6187. [Google Scholar] [CrossRef] [PubMed]
  21. Phan, A.D.T.; Chaliha, M.; Sultanbawa, Y.; Netzel, M.E. Nutritional Characteristics and Antimicrobial Activity of Australian Grown Feijoa (Acca sellowiana). Foods 2019, 8, 376. [Google Scholar] [CrossRef] [Green Version]
  22. Djuikwo, V.; Ejoh, A.; Inocent, G.; Mbofung, C.; Tanumihardjo, S. Determination of Major Carotenoids in Processed Tropical Leafy Vegetables Indigenous to Africa. Food Nutr. Sci. 2011, 2, 9. [Google Scholar] [CrossRef] [Green Version]
  23. Gupta, P.; Sreelakshmi, Y.; Sharma, R. A rapid and sensitive method for determination of carotenoids in plant tissues by high performance liquid chromatography. Plant Methods. 2015, 11, 5. [Google Scholar] [CrossRef] [Green Version]
  24. Striegel, L.; Chebib, S.; Netzel, M.E.; Rychlik, M. Improved Stable Isotope Dilution Assay for Dietary Folates Using LC-MS/MS and Its Application to Strawberries. Front. Chem. 2018, 6, 11. [Google Scholar] [CrossRef]
  25. Campos, F.M.; Ribeiro, S.M.R.; Della Lucia, C.M.; Pinheiro-Sant’Ana, H.M.; Stringheta, P.C. Optimization of methodology to analyze ascorbic and dehydroascorbic acid in vegetables. Química. Nova 2009, 32, 87–91. [Google Scholar] [CrossRef]
  26. Spinola, V.; Mendes, B.; Camara, J.S.; Castilho, P.C. An improved and fast UHPLC-PDA methodology for determination of L-ascorbic and dehydroascorbic acids in fruits and vegetables. Evaluation of degradation rate during storage. Anal. Bioanal. Chem. 2012, 403, 1049–1058. [Google Scholar] [CrossRef] [PubMed] [Green Version]
  27. Singleton, V.L.; Rossi, J.A. Colorimetry of total phenolics with phosphomolybdic-phosphotungstic acid reagents. Am. J. Enol. Vitic. 1965, 16, 144–158. [Google Scholar]
  28. Moore, J.; Yu, L. Methods for Antioxidant Capacity Estimation of Wheat and Wheat-Based Food Products. In Wheat Antioxidants; Yu, L., Ed.; John Wiley & Sons, Inc.: Hoboken, NJ, USA, 2007. [Google Scholar] [CrossRef]
  29. Karamac, M.; Kosinska, A.; Rybarczyk, A.; Amarowicz, R. Extraction and chromatographic separation of tannin fractions from tannin-rich plant material. Pol. J. Food Nutr. Sci. 2007, 57, 471–474. [Google Scholar]
  30. Price, M.L.; Vanscoyoc, S.; Butler, L.G. Critical Evaluation of Vanillin Reaction as an Assay for Tannin in Sorghum Grain. J. Agric. Food Chem. 1978, 26, 1214–1218. [Google Scholar] [CrossRef]
  31. Helaly, F.M.; Soliman, H.S.M.; Soheir, A.D.; Ahmed, A.A. Controlled release of migration of molluscicidal saponin from different types of polymers containing Calendula officinalis. Adv. Polym. Technol. 2001, 20, 305–311. [Google Scholar] [CrossRef]
  32. Dini, I.; Tenore, G.C.; Dini, A. Saponins in Ipomoea batatas tubers: Isolation, characterization, quantification and antioxidant properties. Food Chem. 2009, 113, 411–419. [Google Scholar] [CrossRef]
  33. Mosbah, H.; Louati, H.; Boujbiha, M.A.; Chahdoura, H.; Snoussi, M.; Flamini, G.; Ascrizzi, R.; Bouslema, A.; Achour, L.; Selmi, B. Phytochemical characterization, antioxidant, antimicrobial and pharmacological activities of Feijoa sellowiana leaves growing in Tunisia. Ind. Crop. Prod. 2018, 112, 521–531. [Google Scholar] [CrossRef]
  34. Food Standards Australia and New Zealand. Available online: https://www.foodstandards.gov.au/Pages/default.aspx (accessed on 15 April 2020).
  35. Otten, J.; Hellwig, J.; Meyers, L. Dietary Reference Intakes: The Essential Guide to Nutrient Requirements; National Academies Press: Washington, DC, USA, 2006. [Google Scholar]
  36. European Food Safety Authority. Safety of aluminium from dietary intake—Scientific Opinion of the Panel on Food Additives, Flavourings, Processing Aids and Food Contact Materials (AFC). EFSA J. 2008, 754, 1–34. [Google Scholar] [CrossRef]
  37. Leblanc, J.-C.; Malmauret, L.; GuÉrin, T.; Bordet, F.; Boursier, B.; Verger, P. Estimation of the dietary intake of pesticide residues, lead, cadmium, arsenic and radionuclides in France. Food Addit. Contam. 2000, 17, 925–932. [Google Scholar] [CrossRef]
  38. EFSA Panel on Contaminants in the Food Chain(CONTAM). Statement on tolerable weekly intake for cadmium. EFSA J. 2011, 9, 1975. [Google Scholar] [CrossRef]
  39. Cheung Chung, S.W.; Kwong, K.P.; Yau, J.C.; Wong, W.W. Dietary exposure to antimony, lead and mercury of secondary school students in Hong Kong. Food Addit. Contam. 2008, 25, 831–840. [Google Scholar] [CrossRef] [PubMed]
  40. Zhang, Y.; Zhou, W.-E.; Yan, J.-Q.; Liu, M.; Zhou, Y.; Shen, X.; Ma, Y.-L.; Feng, X.-S.; Yang, J.; Li, G.-H. A Review of the Extraction and Determination Methods of Thirteen Essential Vitamins to the Human Body: An Update from 2010. Molecules 2018, 23, 1484. [Google Scholar] [CrossRef] [PubMed] [Green Version]
  41. United States Department of Agriculture. USDA Food Composition Databases. 2019. Available online: https://ndb.nal.usda.gov/ndb/ (accessed on 15 April 2020).
  42. Shieh, P.; Govindasamy, A.; Kuo, D. Evaluation of antioxidant polyphenols in Taiwan’s medicinal plants. Asian J. Chem. 2009, 21, 5556–5562. [Google Scholar]
  43. Wandji, B.A.; Bomba, F.D.T.; Awouafack, M.D.; Nkeng-Efouet, P.A.; Kamanyi, A.; Nguelefack, T.B. Antinociceptive effects of the aqueous and methanol extracts of the leaves of Pittosporum mannii Hook. F. (Pittosporaceae) in mice. J. Ethnopharmacol. 2016, 187, 224–231. [Google Scholar] [CrossRef] [PubMed]
  44. Amoo, S.O.; Aremu, A.O.; Moyo, M.; Van Staden, J. Antioxidant and acetylcholinesterase-inhibitory properties of long-term stored medicinal plants. BMC Complement. Altern. Med. 2012, 12, 87. [Google Scholar] [CrossRef] [PubMed] [Green Version]
  45. Olaokun, O.; Mkolo, N.; Mogale, M.; King, P. Phytochemical Screening, Antioxidant, Anti-inflammatory and Glucose Utilization Activities of Three South African Plants Used Traditionally to Treat Diseases. Biol. Med. 2017, 9, 2. [Google Scholar] [CrossRef]
  46. Khokhar, S.; Magnusdottir, S.G.M. Total Phenol, Catechin, and Caffeine Contents of Teas Commonly Consumed in the United Kingdom. J. Agric. Food Chem. 2002, 50, 565–570. [Google Scholar] [CrossRef]
  47. Momeni, J.; Djialeu Ntchatchoua, W.P.; Akam, F.M.T.; Ngassoum, M.B. Antioxidant activities of some cameroonian plants extracts used in the treatment of intestinal and infectious diseases. Indian J. Pharm. Sci. 2010, 72, 140–144. [Google Scholar] [CrossRef] [Green Version]
  48. Savage, G.P. Saponins. In Encyclopedia of Food Sciences and Nutrition, 2nd ed.; Caballero, B., Ed.; Academic Press: Oxford, UK, 2003; pp. 5095–5098. [Google Scholar] [CrossRef]
  49. O’Hare, T.J.; Fanning, K.J.; Martin, I.F. Zeaxanthin biofortification of sweet-corn and factors affecting zeaxanthin accumulation and colour change. Arch. Biochem. Biophys. 2015, 572, 184–187. [Google Scholar] [CrossRef]
  50. Barbieri, R.; Coppo, E.; Marchese, A.; Daglia, M.; Sobarzo-Sánchez, E.; Nabavi, S.F.; Nabavi, S.M. Phytochemicals for human disease: An update on plant-derived compounds antibacterial activity. Microbiol. Res. 2017, 196, 44–68. [Google Scholar] [CrossRef]
  51. Rivera, S.M.; Christou, P.; Canela-Garayoa, R. Identification of carotenoids using mass spectrometry. Mass Spectrom. Rev. 2014, 33, 353–372. [Google Scholar] [CrossRef] [PubMed] [Green Version]
Figure 1. Main polyphenolic compounds identified in P. angustifolium leaves and stem.
Foods 09 00887 g001
Figure 2. Contents of vitamin C (A) and folates (B) in the studied P. angustifolium samples; Data present means ± SD (n = 3); Different letters indicate significant differences at α = 0.05; RDI for vitamin C and folates are reported at 45 mg/day and 400 µg/day for adults, respectively [34].
Foods 09 00887 g002
Figure 3. Free (A) and bound (B) phenolic compounds in the studied P. angustifolium samples; Data present means ± SD (n = 3); Different letters of individual phenolic compounds indicate significant differences at α = 0.05.
Foods 09 00887 g003
Figure 4. Carotenoids identified in the studied P. angustifolium samples. Data present means ± SD (n = 3); Different letters of individual carotenoid compounds indicate significant differences at α = 0.05.
Foods 09 00887 g004
Figure 5. 2,2-diphenyl-1-picrylhydrazyl (DPPH) radical-scavenging capacity of P. angustifolium extracts. EC50 value is the amount/concentration of the sample extract or ascorbic acid necessary to scavenge/reduce the initial DPPH radical concentration by 50% (50% effective concentration). Different letters within individual extract indicate significant differences at α = 0.05.
Foods 09 00887 g005
Table 1. Proximate composition of P. angustifolium whole branch samples collected in Queensland.
Proximate CompositionQLD_Wild_WBQLD_Cul_WB
Quantity (g/100 g DW) *
Protein7.210.6
FatTotal fat content4.63.4
Saturated fatty acids1.80.9
Monounsaturated fatty acids0.40.2
Polyunsaturated fatty acids2.42.3
Trans fatty acids<0.01<0.01
CarbohydrateTotal carbohydrate26.631.3
Soluble sugars6.39.5
Total dietary fiber45.243.3
Moisture5.21.7
Dry matter94.898.3
Ash11.29.6
* Data present means of duplicate analysis with a measurement of uncertainty below 10%; DW—dry weight.
Table 2. Minerals and trace elements of different P. angustifolium samples collected in Queensland.
Chemical ElementsQLD–Wild–WBQLD–Cul–WBQLD–Cul–LeafQLD–Cul–StemNutritional Information
mg/kg DW *
MineralsCa27,302 ± 190 a7879 ± 99 c10,095 ± 31 b3295 ± 194 d1200 mg/day AI [35]
K15,403 ± 8 d22,766 ± 179 b26,180 ± 120 a19,131 ± 528 c4.7 g/day AI [35]
Mg2547 ± 9 b2590 ± 21 b3284 ± 10 a989 ± 43 c350 mg/day EAR [35]
Na878 ± 3 c1161 ± 5 b2083 ± 15 a686 ± 19 d1300 mg/day AI [35]
P1194 ± 14 d2669 ± 31 b2844 ± 17 a2286 ± 37 c700 mg/day AI [35]
Trace elementsB68 ± 1.0 a48 ± 0.6 c57.7 ± 0.6 b16.7 ± 1.0 d
Al89 ± 4.4 a18 ± 0.6 c28.3 ± 0.2 b7.5 ± 0.1 d1.0 mg/kg BW/week TWI [36]
V **0.14 a0.04 c0.05 b0.02 d
Cr **0.33 a0.11 b0.16 b0.14 b35 µg/day AI [35]
Mn41.7 ± 0.6 b39.7 ± 0.6 c60.3 ± 0.6 a12.3 ± 0.6 d2.3 mg/day AI [35]
Fe116.7 ± 5.8 a48.3 ± 1.0 b56 ± 0.1 b17 ± 1.2 c8 mg/day RDA [35]
Co **0.1 a0.05 b0.05 b0.02 c
Ni0.9 ± 0.1 b1.1 ± 0.1 b1.57 ± 0.1 a1 ± 0.1 b
Cu8.1 ± 0.1 b8.9 ± 0.1 a6.8 ± 0.1 c7.6 ± 0.2 d900 µg/day AI [35]
Zn57 ± 1.0 c62 ± 0.1 b76.7 ± 1.2 a19.7 ± 1.0 d11 mg/day RDA [35]
As **0.03 c0.04 b0.06 a0.02 d128 µg/week for a 60 kg BW TWI [37]
Se **0.06 b0.08 a0.08 a0.04 c55 µg/day AI [35]
Sr140 ± 0.1 a47.3 ± 0.6 b57.7 ± 0.4 b32 ± 0.6 d
Mo **0.2 c0.7 b0.8 a0.2 c45 µg/day AI [35]
Ag<0.01<0.01<0.01<0.01
Cd **0.05 c0.06 b0.07 a0.06 b2.5 µg/kg BW/week TWI [38]
Sn<0.05<0.05<0.05<0.05
Sb<0.01<0.01<0.01<0.01
Ba36 ± 0.3 a3.3 ± 0.1 c4.0 ± 0.2 b3.4 ± 0.1 c
Hg **0.03 b0.05 a0.01 c<0.015 µg/kg BW/week TWI [39]
Pb **0.12 a0.06 c0.08 bc0.09 b25 µg/kg BW/week TWI [39]
* Data present means ± SD (n = 3); ** SD ≤ 0.01; Different letters at the same row indicate significant differences among the samples at α = 0.05; DW—dry weight; (-)—not available; RDA—recommended dietary allowance, AI—adequate intake, EAR—estimated average requirement; BW—body weight; TWI—tolerable weekly intake.
Table 3. Selected B vitamins in P. angustifolium whole branch samples collected in Queensland.
VitaminQLD–Wild–WBQLD–Cul–WBNutrition Information [34]
Quantity (per 100 g DW) *
B1 (Thiamin)<5 µg<5 µg1.1–1.2 mg/day RDI
B2 (Riboflavin)<5 µg73 µg1.6 mg/day RDI
B3 (Niacin)840 µg1300 µg14–16 mg/day RDI
B5 (Pantothenic acid)<5 µg300 µg4–6 mg/day RDI
B6 (Pyridoxine)180 µg59 µg1.7 mg/day RDI
B7 (Biotin)<5 µg<5 µg25–30 µg/day RDI
B12 (Cyanocobalamin)<5 µg<5 µg2.4 µg/day RDI
* Data present means of duplicate analysis with a measurement of uncertainty below 10%; DW—dry weight; RDI—recommended dietary intake for adults;
Table 4. TPC, tannins and saponins in the studied P. angustifolium samples.
SamplesTPC (mg GAE/100 g DW)Total (Condensed) Tannins (mg CaE/100 g DW)Total Saponins (mg OE/100 g DW)
FreeBoundTotal Free and Bound
QLD_Wild_WB1306 ± 41 b44.2 ± 7.7 c1350 ± 47 b32 ± 1.2 b3645 ± 351 ab
QLD_Cul_WB1177 ± 110 b44.6 ± 2 c1222 ± 112 b20 ± 2.6 bc2869 ± 343 b
QLD_Cul_Leaf1254 ± 59 b40.9 ± 1.4 c1295 ± 60 b26.1 ± 6.6 bc3871 ± 157 a
QLD_Cul_Stem653 ± 31 c76.3 ± 7.8 b730 ± 27 c15.9 ± 3.2 c1590 ± 223 c
SA_Wild_Leaf3985 ± 103 a90.9 ± 4.2 a4075 ± 99 a52 ± 6.4 a3250 ± 319 ab
Data present means ± SD (n= 3). Different letters at the same column indicate significant differences at α = 0.05.
Table 5. Antimicrobial activity of the studied P. angustifolium samples.
SamplesE. coliS. aureusC. albicans
Water ExtractionMeOH ExtractionWater ExtractionMeOH ExtractionWater ExtractionMeOH Extraction
Inhibition Zone (mm) *
QLD–Wild–WB13.6 ± 2.2 c19.5 ± 1.7 bc
QLD–Cul–WB24.7 ± 0.7 ab20.6 ± 0.6 ab
QLD–Cul–Leaf23.1 ± 1.6 ab21.2 ± 1.9 ab
QLD–Cul–Stem24.0 ± 0.8 ab21.0 ± 1.8 ab
SA–Wild–Leaf-12.8 ± 0.926.9 ± 1.6 a25.3 ± 2.4 ab
Antibiotic/antifungal control **29.255.827.1
(*) Data present means ± SD (n = 3); (**) antibiotic and antifungal control as stated in the method section; (-) No inhibition zone was observed. Different letters indicate significant differences among the samples at α = 0.05.
Table 6. Pearson’s correlation coefficients between bioactive compounds, DPPH radical-scavenging capacity and antifungal activity.
Bioactive Compounds% DPPH Free Radical-ScavengingC. albicans Inhibition
2.5 mg/mL1 mg/mL0.5 mg/mLWater Extract
(0.5 mg/mL)
MeOH Extract
(0.5 mg/mL)
TPC0.78 **0.87 ***0.92 ***0.240.76 *
Rutin0.76 **0.69 *0.66 *0.570.64
Isoquercetin−0.03−0.40−0.18−0.48−0.05
Quercetin 3-O-[6″-(3-hydroxy-3-methylglutaroyl)-β-glucoside]0.71 **0.65 *0.64 *0.600.81 *
Dicaffeoylquinic acid0.480.580.60 *0.480.36
Chlorogenic acid0.360.450.410.570.48
Vitamin C−0.58 *−0.65 *−0.73 **−0.32−0.42
Folates−0.59 *−0.68 *−0.64 *−0.36−0.36
Carotenoids−0.07−0.10−0.21−0.550.048
Saponins0.260.370.260.79 *0.31
Tannins0.75 **0.92 ***0.83 ***0.380.55
Statistical significance at *—p < 0.05, **—p < 0.01 and ***—p < 0.001.

