Article

Changes in Physical Meat Traits, Protein Solubility, and the Microstructure of Different Beef Muscles during Post-Mortem Aging

Institute of Animal Sciences, Chinese Academy of Agricultural Sciences, Beijing 100093, China
*
Author to whom correspondence should be addressed.
These authors contributed equally to this work.
Foods 2020, 9(6), 806; https://doi.org/10.3390/foods9060806
Submission received: 19 April 2020 / Revised: 11 June 2020 / Accepted: 17 June 2020 / Published: 19 June 2020

Abstract

:
This study was performed to compare the differences in pH, myofibril fragmentation index (MFI), total protein solubility (TPS), sarcoplasmic protein solubility (SPS), myofibrillar protein solubility (MPS), and the microstructure of seven beef muscles during aging. From the six beef carcasses of Xinjiang brown cattle, a total of 252 samples from semitendinosus (ST), longissimus thoracis (LT), rhomboideus (RH), gastrocnemius (GN), infraspinatus (IN), psoas major (PM), and biceps femoris (BF) muscles were collected, portioned, and assigned to six aging periods (1, 3, 7, 9, 11, and 14 day/s) and 42 samples were used per storage period. IN muscle showed the highest pH (p < 0.05) from 1 to 14 days and the lowest TPS (p < 0.01) from 9 to 14 days with respect to the other muscles. Moreover, the changes in IN were further supported by transmission electron microscopy due to the destruction of the myofibril structure. The highest value of MFI was tested in ST muscle from 7 to 14 days. The total protein solubility in PM, RH, and GN muscles were not affected (p > 0.05) as the aging period increased. The lowest TPS was found in the RH muscle on day 1, 3, and 7 and in the IN muscle on day 9, 11, and 14. The pH showed negative correlations with the MFI, TPS, and MPS (p < 0.01). The results suggest that changes in protein solubility and muscle fiber structure are related to muscle location in the carcass during aging. These results provide new insights to optimize the processing and storage of different beef muscles and enhance our understanding of the biological characteristics of Xinjiang brown cattle muscles.

1. Introduction

Meat and meat products are important nutrient-intensive foods that are widely consumed worldwide [1]. For consumers, tenderness is a critical indicator that drives their willingness to repurchase and acceptability [2,3]. There are still great variations in the tenderness between different parts of beef muscles [4,5]. In the beef industry, aging is often considered to be one of the important factors determining the ultimate tenderness of the meat [6,7]. Due to the differences between the biochemical characteristics of these muscles, they may cause different degrees of response to aging [4]. Therefore, the inconsistency of the tenderness of different muscles has become the main problem that currently exists in the meat processing industry during the aging process.
Reducing the intake of fat in meat is essential for maintaining consumer health and reducing the risk of illness [8]. In fact, the type of muscle fiber is one of the factors that affects the lean meat rate [9]. The muscle fiber type differs greatly among various body parts and is generally divided into slow-oxidized fiber (type I), fast oxido-glycolytic fiber (type IIA), and fast glycolytic fibers (type IIB and type IIX) [10,11]. Studies indicated that muscle fiber type was closely associated with muscle quality and more type IIB fiber might lead to poorer muscle quality and lower lean meat productivity [12,13]. Our previous unpublished study has shown that semitendinosus (ST) and longissimus thoracis (LT) muscles of Xinjiang brown cattle have large percentages of type IIB fibers (approximately 47.89% and 40.85%, respectively), rhomboideus (RH) and gastrocnemius (GN) muscles have high percentages of type IIA fibers (approximately 61.43% and 42.10%, respectively), and infraspinatus (IN), psoas major (PM), and biceps femoris (BF) muscles have large percentages of type I fibers (79.69%, 43.06%, and 39.75%, respectively). In the current study, we focused on these seven muscles, representing the characteristics of the three muscle fiber types.
Protein in skeletal muscle is a key factor in determining the type of muscle fiber. Establishing the relationship between muscle protein structure and functional properties will contribute to the understanding of the modification mechanism of meat products during processing and storage [14]. According to the solubility and location of protein, it can be divided into myofibrillar protein, sarcoplasmic protein, and matrix protein, which maintain the structural integrity of myofibrillar fiber [15,16]. These proteins are susceptible to oxidative degradation during aging, which may explain the meat tenderization after muscle fiber breakage [17]. Oxidation affects the chemical properties of proteins and changes in protein solubility can reflect the degree of protein denaturation [18,19]. Sarcoplasmic protein solubility (SPS) is sometimes used as a measure of muscle quality [20]. It has been well documented that precipitated or denatured sarcoplasmic proteins may bind to myofibrils, leading to a decrease in water holding capacity [21,22,23]. It is vital to the production of Xinjiang brown beef, for the lives of Xinjiang people, and for local meat production. However, there are still limited studies examining the changes in protein solubility between various parts of muscles of Xinjiang brown cattle during post-mortem aging.
Therefore, the aim of this research was to evaluate the changes in pH, myofibril fragmentation index (MFI), total protein solubility (TPS), SPS and myofibrillar protein solubility (MPS), and the microstructure of seven beef muscles (ST, LT, RH, GN, IN, PM, BF) during aging from 1 to 14 days.

2. Materials and Methods

2.1. Animals and Muscle Samples Preparation

Six Xinjiang brown bull calves of approximately 30 months of age were slaughtered at a local slaughterhouse (Yining, Xinjiang, China) according to the commercial procedures. The mean weight at slaughter was 566 ± 32 kg. All corn-fed calves were raised on the same farm to ensure background consistency and then slaughtered using electrical stunning on the same day. The carcasses were overhung in a cold room (3 ± 1 °C) for 24 h. All procedures were undertaken following the guidelines given by the Animal Care and Ethics Committee for animal experiments, Institute of Animal Science, Chinese Academy of Agricultural Sciences.
The semitendinosus (ST), longissimus thoracis (LT), rhomboideus (RH), gastrocnemius (GN), infraspinatus (IN), psoas major (PM), and biceps femoris (BF) muscles were collected from each carcass. The samples were kept on ice and transported to the laboratory after 50 min and all visible intermuscular and subcutaneous fat was removed. Prior to packaging, each sample was stamped with a date mark. Each muscle was further separated into three equal-length sections, resulting in six muscle sections (5 cm × 3 cm × 2 cm, 50 ± 0.05 g) per carcass, with 42 slices per aging period (six replications per muscle and per aging period). Afterwards, the samples were individually vacuum-packaged in a polyolefin bag and randomly assigned to aging at 3 ± 1 °C (relative humidity: 70–80%) for 1, 3, 7, 9, 11, and 14 days (within muscles, samples from the same carcass were not aged for the same time). Upon completion of each postmortem aging period, samples were taken to determine pH and transmission electron microscopy (TEM). The remaining samples were stored at −30 °C for further analysis within 2 weeks.

2.2. pH Measurement

The pH value of the beef muscles was measured at 1, 3, 7, 9, 11, and 14 days postmortem following the method described by Kim et al. [24], with minor modifications. Chopped meat (10 g) was mixed with 100 mL of distilled water for 15 s and then homogenized using an Ultra-Turrax T25 homogenizer (IKA-Werke, Gmbh & Co., Staufen in Breisgau, Germany) at 2800 g. The pH of the homogenate was measured using a pH meter equipped with an electrode (PB-10, the precision was 0.01, made by Sartorius Group, Goettingen, Germany). Each sample was determined three times.

2.3. Myofibril Fragmentation Index (MFI)

MFI was determined by modification of the method by Hou et al. [25]. Two gram samples were homogenized with a homogenizer (FJ200-S, Shanghai Specimen Model Co., Shanghai, China) at 10,000 g for 60 s (3 × 20 s with a 60 s break between bursts) at 4 ± 2 °C in 20 mL ice-cold buffer (100 mM KCl, 20 mM K2HPO4, 1 mM EGTA, 1 mM MgCl2, and 1 mM NaN3, pH 7.0). The homogenates were centrifuged using a LG10-24A model centrifuge (Peking Medical centrifuge Factory, Beijing, China) at 3000 g for 15 min at 4 °C and the supernatant was discarded. The pellets were homogenized in 20 mL of homogenizing buffer and centrifuged and the supernatant was discarded again. The resulting pellets were then resuspended in 5 mL of homogenizing buffer and filtered through a polyethylene strainer (200-mesh) to remove the fat and connective tissue. Then, 5 mL buffer was used to promote the passage of myofibrils through the strainer. The protein concentration of suspension was determined by the biuret method [26]. The protein concentration was diluted to 0.5 mg/mL and measured spectrophotometrically at 540 nm (UV 6100, Metash, Shanghai, China). MFI was calculated by multiplying A540 by 200.

2.4. Protein Solubility

The total protein solubility (TPS) and sarcoplasmic protein solubility (SPS) were measured using the procedure of Li et al. [27]. A 1 g sample of each muscle (six replications per muscle and per aging period) was homogenized with 10 mL cold 0.025 M potassium phosphate buffer (pH 7.2), which was then shaken at 4 °C for 12 h and centrifuged at 1500 g for 20 min. The total protein concentrations of the supernatants were assessed using the biuret method [26]. The step of SPS detection was that the muscle sample (1 g) was homogenized in ice-cold 20 mL 0.025 M potassium phosphate buffer (pH 7.2) and then carried out using the same shaking, homogenization, and centrifugation procedures mentioned above. Myofibrillar protein solubility (MPS) was calculated by TPS minus SPS. The value was expressed as micrograms of soluble protein per gram of meat.

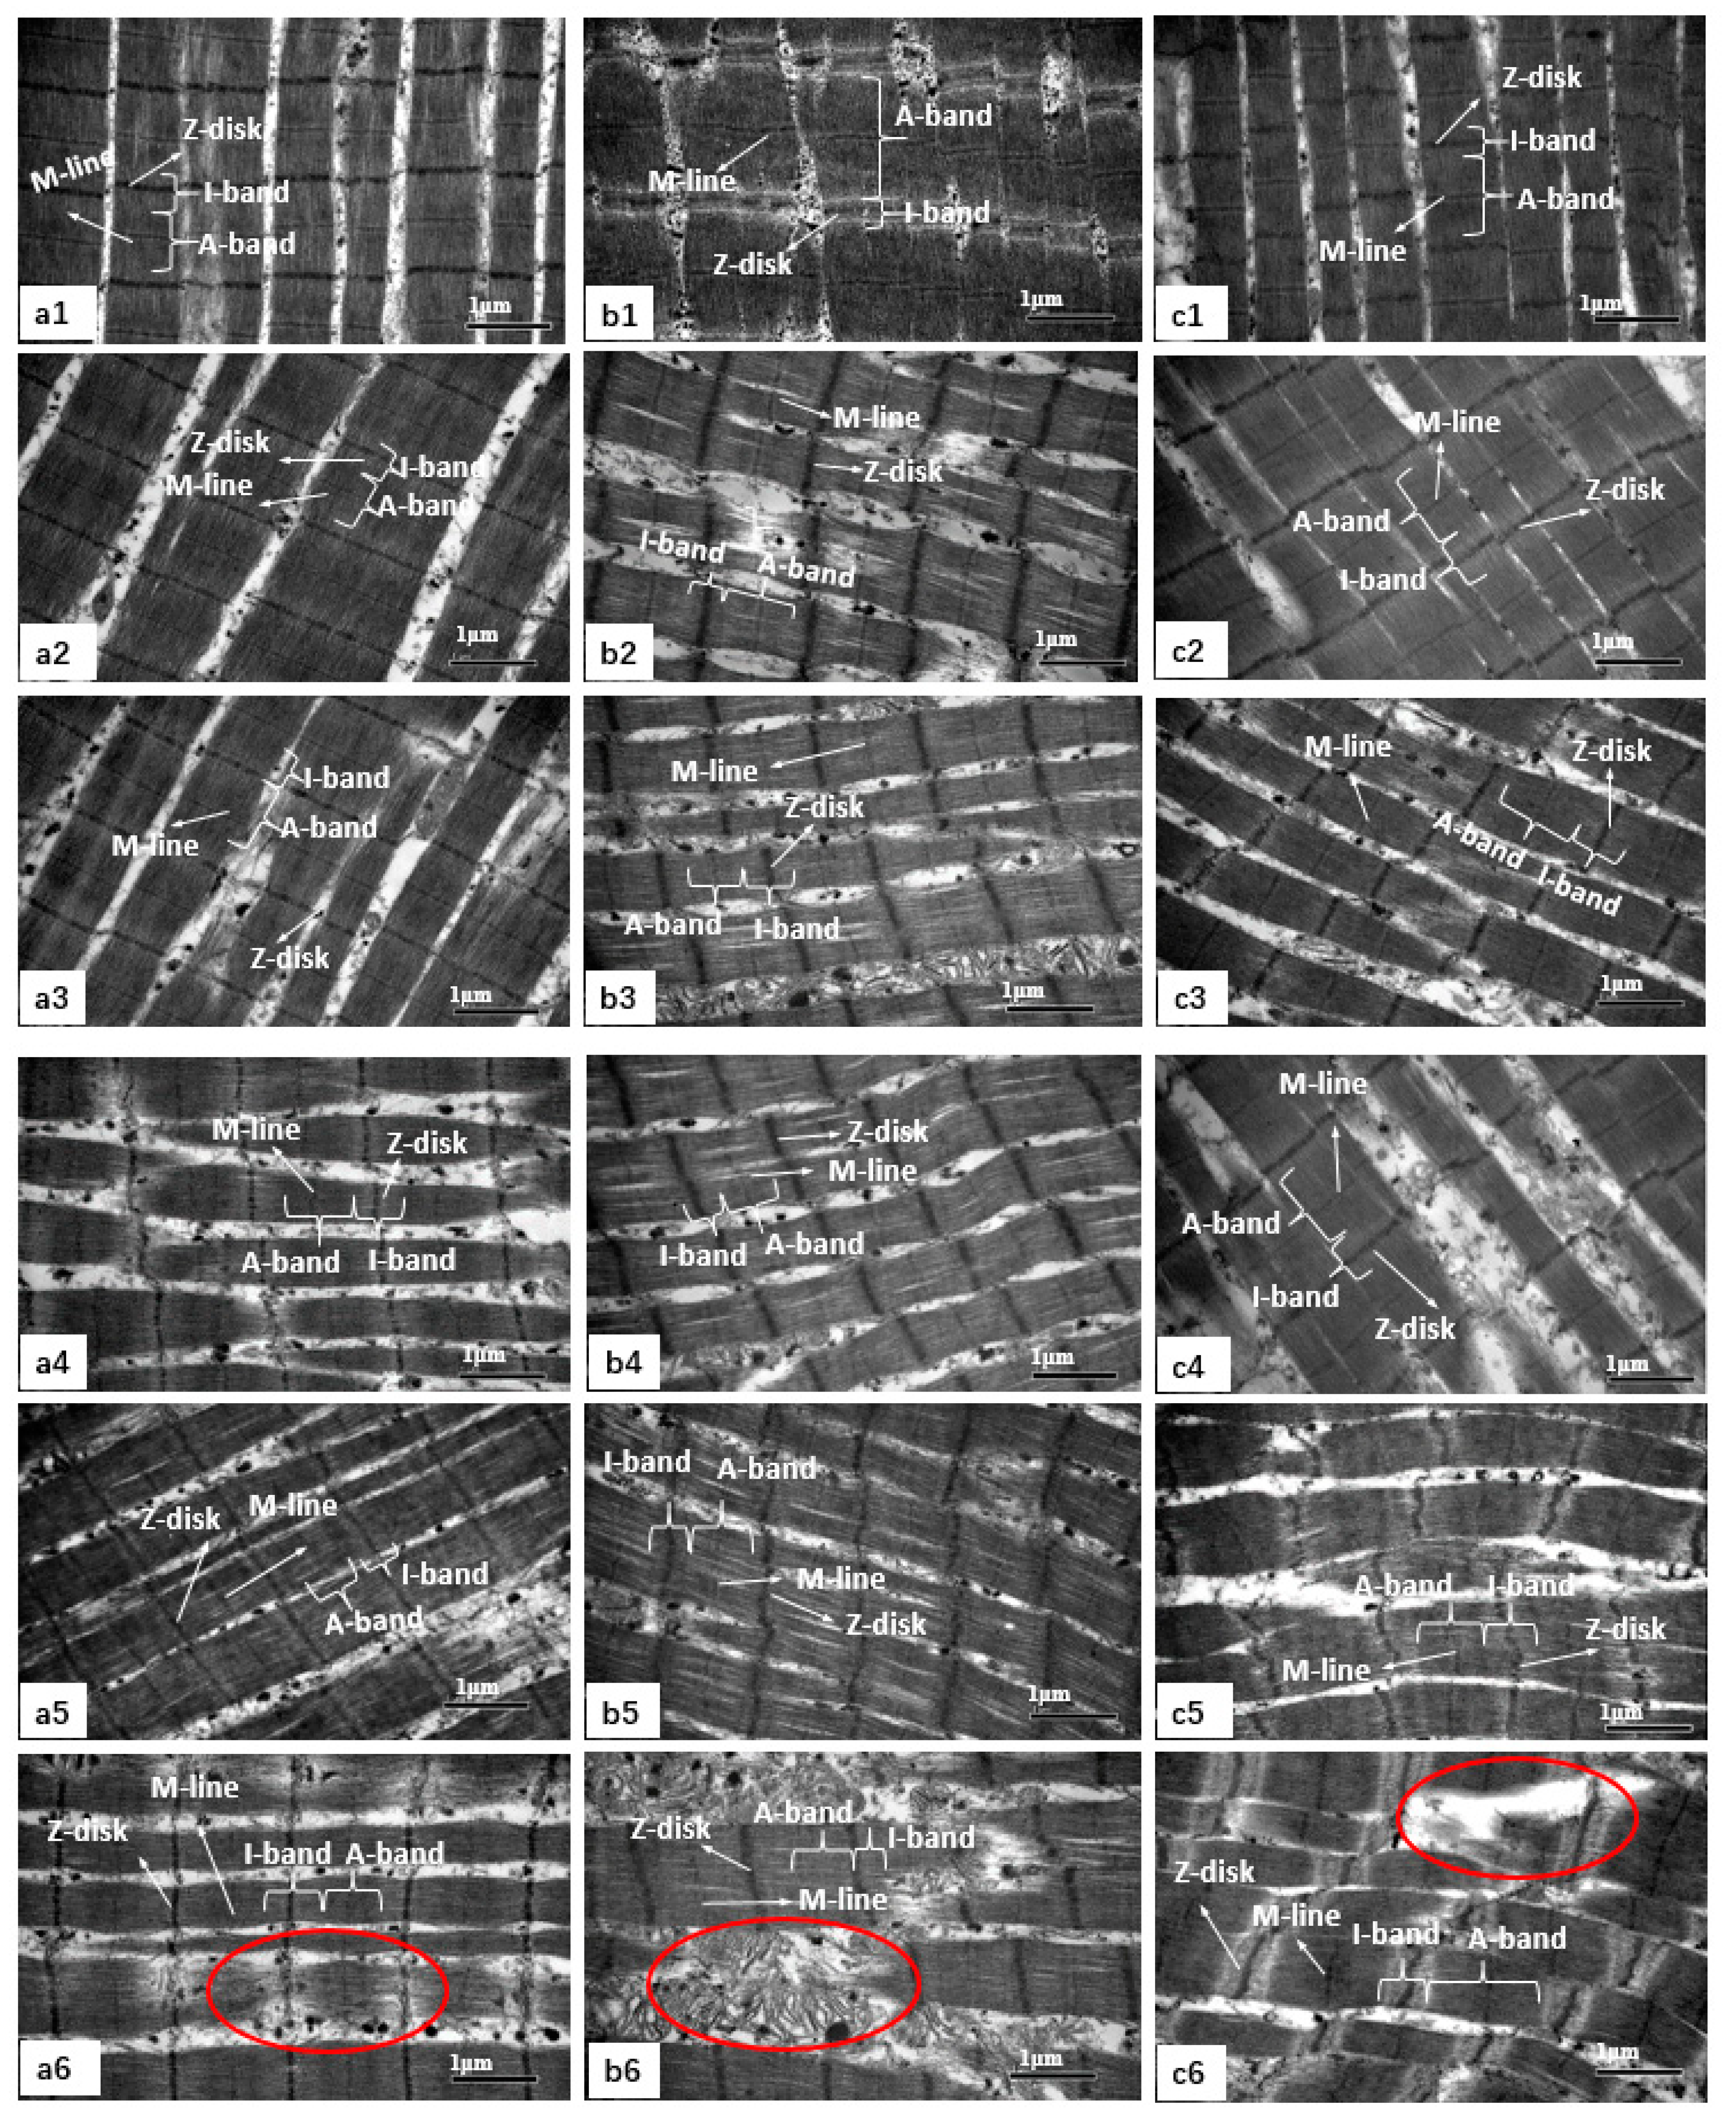
2.5. Microstructure Analysis

At each storage time point, strips (approximately 5 × 1 × 1 mm) were cut off from three muscles (ST, RH, and IN) and were selected using transmission electron microscopy (TEM). Muscle samples were fixed with 2.5% glutaraldehyde in 0.1 M phosphate buffer (pH 7.2) and 2% osmium tetroxide. Then, the gradually increasing concentrations of ethanol (50–100%, v/v) were used for dehydration. The solvent was then switched to acetone and the samples were dehydrated with acetone gradient, followed by replacing with propylene oxide and being embedded with resin. The samples were trimmed, sectioned (50–70 nm), and stained with uranyl acetate and lead citrate. The samples were viewed under TEM (Hitachi, H-7500, Japan) at required magnification as per the standard procedures.

2.6. Statistical Analysis

The experimental design was a randomized complete block design, where each carcass (n = 6) served as a block. Each measurement was performed in triplicate. To determine the significant effect by two factors (muscles and aging period), data analysis was performed using the SAS 9.2 program (SAS Institute, Cary, NC, USA) with muscles and aging period as the main effects, using two-way analysis of variance (ANOVA). Analysis of variance was performed on all the variables using the General Linear Model (GLM) procedure. Duncan’s multiple range test (p < 0.05) was used to determine the significance of the differences in the mean values for different samples. Pearson’s correlation coefficients were calculated for variables.

3. Results and Discussions

3.1. Changes in pH Value

The changes in pH values of beef muscles during aging are shown in Table 1. There was a considerable variation in pH between muscles. Compared to the IN muscle, the pH values in ST, LT, PM, and BF were lower at 1 day (p < 0.05). The difference in pH may be due to the rate of glycolysis between muscles [28]. Similar results were obtained in some studies of beef and lamb [29,30], indicating that the rate of decrease in the pH of PM accelerated. Aging had no significant impact on pH in PM muscles (p > 0.05) from 1 to 14 days. Except for IN and PM, no significant changes were observed (p > 0.05) in the pH of the remaining six muscles from 3 to 14 days of aging. In terms of value, the pH of IN showed the highest value (p < 0.05) of all the muscles in the whole aging period. IN had more type I muscle fibers and its main characteristics were higher oxidative metabolism and lower glycogen content [31]. Therefore, in this study, we can speculate that lower glycolysis capacity would result in a higher pH of IN muscle, which might influence proteolysis.

3.2. Changes in Myofibril Fragmentation Index (MFI)

Changes in MFI of different beef muscles during aging are displayed in Table 2. The highest MFI was observed in the RH muscle at 1 day (p < 0.05). The ST muscle had the highest MFI from day 7 onwards (p < 0.05). Compared with the other muscles, the MFI values of IN and LT were found to be lower from 3 to 11 days (p < 0.05). MFI is used as an important indicator of I band rupture and interstitial fibril connection breakage [32]. These results seem to indicate that the degree of rupture of muscle fibers in the I band is greater in ST muscles during aging, resulting in changes in the integrity and solubility of myofibrillar proteins [33,34]. The MFI of each individual muscle increased significantly with the aging period (p < 0.05) and this is in agreement with Li et al. [35]. However, the difference in MFI change was very small in the later days of the aging period. This might be due to the fact that as the aging period increases, the degree of variation in myofibril breaks becomes smaller [36].

3.3. Changes in Protein Solubility

The results of the changes in TPS, SPS, and MPS during aging are shown in Table 3. No significant changes (p > 0.05) were evidenced in TPS of RH, GN, and PM muscles and in MPS of IN and BF muscles during aging. In regard to SPS, there were no significant differences in SPS between different muscles at day 11 and 14 (p > 0.05). IN muscle exhibited a lower TPS at day 9, 11, and 14 than that at day 7 (p < 0.05). LT muscles had the highest TPS and MPS among all muscles at day 14 (p < 0.05). The SPS of RH was significantly lower than that of IN and GN at day 7 and 9 (p < 0.05). Protein solubility was an important indicator of protein properties, which was attributed to protein denaturation [37]. In this study, the results indicated that IN muscle had a high extent of protein denaturation after 9 days [19]. The solubility of myofibrillar protein increased with the aging period up to day 7 and then did not change significantly. This is related to the characteristics of myofibrillar proteins [38,39]. During aging, myofibrillar protein bonds were weakened and more protein hydrolysis was released, which resulted in higher MPS [40]. However, myofibrillar proteins are gradually unfolded as the aging period increases, exposing hydrophobic groups and resulting in almost no change in MPS [41].

3.4. Pearson Correlations

Correlation coefficients among pH, MFI, TPS, SPS, and MPS of all muscles during aging are presented in Table 4. MFI, TPS, and MPS are negatively correlated with pH (p < 0.01). MFI is positively correlated with MPS (p < 0.05), whereas no correlations with TPS and SPS are observed (p > 0.05). The correlation coefficients of TPS with MPS are higher than those of SPS, indicating that TPS was affected to a larger extent by the denaturation of MPS than that of SPS. These results suggest that pH is a more important determinant for protein solubility than MFI in this study. Moreover, the correlation can further explain the results of protein solubility and confirm that the variation in protein solubility of different muscles may be due to pH changes.

3.5. Changes in Muscle Microstructure

The changes in the microstructure of muscle (ST, RH, and IN) by TEM are shown in Figure 1. In ST, RH, and IN muscles, the sarcoplasmic reticulum around the sarcomeres can be clearly distinguished and the myofibrils are tightly combined with the visible I-band and A-band and the Z-disk and M-line can be differentiated on day 1 and day 3 (Figure 1(a1,a2,b1,b2,c1,c2)). After day 7, the overall integrity of the myofibrils diminishes (Figure 1(a3,b3,c3)). The M-line located on the centre of the A-band looks vague and the Z-disk and I-band junctions are weakened after day 9. The Z-disk is distorted but undamaged, although some longitudinal splits are evident in RH muscles (Figure 1(b4,b5)). The worst myofibrillar structure is observed in IN muscle, in which the overlapping structure of thick and thin filaments is destroyed, the skeletal muscle structure is severely broken, and the Z-disk is distorted and weakened (Figure 1(c4,c5)). At day 14, IN muscle shows fractures in the Z-disk, as well as fragmentation at the junction of the I-band and Z-disk (Figure 1(c6)). Pan and Yeh [42] found that cracking of muscle fibers and shortening of sarcomere could largely reduce the tenderness of the meat. Aside from mechanical damage, muscle fiber structure was also affected by endogenous proteases during aging [43,44]. Moczkowska et al. [45] had reported that BF muscles were more sensitive to oxidation than LL muscles and the extent of this phenomenon depends on the type of muscle examined. In this study, TEM results showed that IN muscle had a longer sarcomere length and a greater degree of rupture in the muscle fiber structure, as expected because this muscle has a higher proportion of type I fiber (approximately 79.69%), which predicted that the aging rate would be faster. These results are in accordance with the MFI described above. On the other hand, previous research shows that the concentration of coenzyme Q10, carnosine, and taurine in IN muscle was higher than that in LT muscle [46], implying a higher concentration of functional bioactive compounds in oxidized muscle. These results suggest that oxidized muscle accelerates the improvement of meat tenderness.

4. Conclusions

In this study, it can be concluded that the meat characteristics of different beef muscles responded differently to the storage time and were significantly affected by carcass position. The meat quality parameters of IN muscle were improved, which was due to its higher pH value, lower MFI and TPS, and greater degree of myofibril rupture, followed by ST and RH. However, there is little difference in meat quality parameters among other muscles. Therefore, for IN, it can be suggested that the characteristics are particularly suitable for producing high-quality beef products. Additionally, a significant interaction between pH and protein solubility was observed. Further research should be conducted to explore the mechanism of how pH affects protein solubility (for example, to assess its effect on cathepsin activity).

Author Contributions

Conceptualization, S.-S.Z.; methodology, Y.-H.F. and K.-X.W.; software, C.-C.X.; validation, C.-C.X.; formal analysis, C.-C.X. and S.-S.Z.; investigation, P.X.; resources, Y.-H.F.; data curation, Y.-H.F.; writing—original draft, Y.-H.F.; writing—review and editing, C.-C.X.; visualization, B.-Z.S.; supervision, S.-S.Z.; project administration, C.-C.X.; funding acquisition, P.X. All authors have read and agreed to the published version of the manuscript.

Funding

This study was funded by grants from the Program of National Beef Cattle and Yak Industrial Technology System (CARS-37) and the Modern Agricultural Industry Technology System and Beef Industry Innovation Construction Project of Hebei Province (HBCT2018130204).

Acknowledgments

The authors thank Haipeng Li for their valuable assistance during the muscle sampling work.

Conflicts of Interest

We declare that we have no conflict of interest.

References

  1. Jiménez-Colmenero, F.; Herrero, A.; Cofrades, S.; Ruiz-Capillas, C. Meat: Eating Quality and Preservation. In The Encyclopedia of Food and Health; Caballero, B., Finglas, P., Toldrá, F., Eds.; Oxford Academic Press: Kidlington, UK, 2016; Volume 3, pp. 685–692. [Google Scholar]
  2. Dobbs, L.M.; Jensen, K.L.; Leffew, M.B.; English, B.C.; Lambert, D.M.; Clark, C.D. Consumer willingness to pay for Tennessee beef. J. Food Distrib. Res. 2016, 47, 38–61. [Google Scholar]
  3. O’Quinn, T.G.; Legako, J.F.; Brooks, J.C.; Miller, M.F. Evaluation of the contribution of tenderness, juiciness, and flavor to the overall consumer beef eating experience. Trans. Anim. Sci. 2018, 2, 26–36. [Google Scholar] [CrossRef] [Green Version]
  4. Nair, M.N.; Canto, A.C.; Rentfrow, G.; Suman, S.P. Muscle-specific effect of aging on beef tenderness. LWT Food Sci. Technol. 2019, 100, 250–252. [Google Scholar] [CrossRef]
  5. Von Seggern, D.D.; Calkins, C.R.; Johnson, D.D.; Brickler, J.E.; Gwartney, B.L. Muscle profiling: Characterizing the muscles of the beef chuck and round. Meat Sci. 2005, 71, 39–51. [Google Scholar] [CrossRef]
  6. Neath, K.E.; Del Barrio, A.N.; Lapitan, R.M.; Herrera, J.R.V.; Cruz, L.C.; Fujihara, T.; Muroya, S.; Chikuni, K.; Hirabayashi, M.; Kanai, Y. Difference in tenderness and pH decline between water buffalo meat and beef during postmortem aging. Meat Sci. 2007, 75, 499–505. [Google Scholar] [CrossRef]
  7. Hanzelková, Š.; Simeonovová, J.; Hampel, D.; Dufek, A.; Šubrt, J. The effect of breed, sex and aging time on tenderness of beef meat. Acta Vet. Brno 2011, 80, 191–196. [Google Scholar] [CrossRef] [Green Version]
  8. Jiménez-Colmenero, F.; Herrero, A.M.; Ruiz-Capillas, C.; Cofrades, S. Meat and functional foods. In Handbook of Meat and Meat Processing; Hui, Y.H., Ed.; CRC Press, Taylor & Francis Group: Boca Raton, FL, USA, 2012; pp. 225–248. [Google Scholar]
  9. Lee, S.H.; Joo, S.T.; Ryu, Y.C. Skeletal muscle fiber type and myofibrillar proteins in relation to meat quality. Meat Sci. 2010, 86, 166–170. [Google Scholar] [CrossRef]
  10. Choi, Y.M.; Kim, B.C. Muscle fiber characteristics, myofibrillar protein isoforms, and meat quality. Livest. Sci. 2009, 122, 105–118. [Google Scholar] [CrossRef]
  11. Jeong, J.Y.; Jeong, T.C.; Yang, H.S.; Kim, G.D. Multivariate analysis of muscle fiber characteristics, intramuscular fat content and fatty acid composition in porcine longissimus thoracis muscle. Livest. Sci. 2017, 202, 13–20. [Google Scholar] [CrossRef]
  12. Hwang, Y.H.; Kim, G.D.; Jeong, J.Y.; Hur, S.J.; Joo, S.T. The relationship between muscle fiber characteristics and meat quality traits of highly marbled Hanwoo (Korean native cattle) steers. Meat Sci. 2010, 86, 456–461. [Google Scholar] [CrossRef]
  13. Kim, G.D.; Yang, H.S.; Jeong, J.Y. Comparison of characteristics of myosin heavy chain-based fiber and meat quality among four bovine skeletal muscles. Korean J. Food Sci. Anim. Resour. 2016, 36, 819. [Google Scholar] [CrossRef] [PubMed] [Green Version]
  14. Herrero, A.M.; Carmona, P.; Jiménez-Colmenero, F.; Ruiz-Capillas, C. Applications of vibrational spectroscopy to study protein structural changes in muscle and meat batter systems. In Applications of Vibrational Spectroscopy to Food Science; Chalmers, J., Griffiths, P., Li-Chan, E., Eds.; John Wiley & Sons: West Sussex, UK, 2010; pp. 315–328. [Google Scholar]
  15. Smuder, A.J.; Kavazis, A.N.; Hudson, M.B.; Nelson, W.B.; Powers, S.K. Oxidation enhances myofibrillar protein degradation via calpain and caspase-3. Free Radic. Biol. Med. 2010, 49, 1152–1160. [Google Scholar] [CrossRef] [PubMed] [Green Version]
  16. Veiseth-Kent, E.; Hollung, K.; Ofstad, R.; Aass, L.; Hildrum, K.I. Relationship between muscle microstructure, the calpain system, and shear force in bovine longissimus dorsi muscle. J. Anim. Sci. 2010, 88, 3445–3451. [Google Scholar] [CrossRef] [PubMed]
  17. Hopkins, D.L.; Thompson, J.M. The degradation of myofibrillar proteins in beef and lamb using denaturing electrophoresis—An overview. J. Muscle Foods 2002, 13, 81–102. [Google Scholar] [CrossRef]
  18. Marcos, B.; Kerry, J.P.; Mullen, A.M. High pressure induced changes on sarcoplasmic protein fraction and quality indicators. Meat Sci. 2010, 85, 115–120. [Google Scholar] [CrossRef] [Green Version]
  19. Santos, M.D.; Delgadillo, I.; Saraiva, J.A. Extended preservation of raw beef and pork meat by hyperbaric storage at room temperature. Int. J. Food Sci. 2020, 55, 1171–1179. [Google Scholar] [CrossRef]
  20. Joo, S.; Kauffman, R.; Kim, B.; Park, G. The relationship of sarcoplasmic and myofibrillar protein solubility to colour and water-holding capacity in porcine longissimus muscle. Meat Sci. 1999, 52, 291–297. [Google Scholar] [CrossRef]
  21. Dai, Y.; Miao, J.; Yuan, S.Z.; Liu, Y.; Li, X.M.; Dai, R.T. Colour and sarcoplasmic protein evaluation of pork following water bath and ohmic cooking. Meat Sci. 2013, 93, 898–905. [Google Scholar] [CrossRef] [PubMed]
  22. Liu, J.; Arner, A.; Puolanne, E.; Ertbjerg, P. On the water-holding of myofibrils: Effect of sarcoplasmic protein denaturation. Meat Sci. 2016, 119, 32–40. [Google Scholar] [CrossRef] [PubMed]
  23. Wilson, G.G., III; van Laack, R.L.J.M. Sarcoplasmic proteins influence water-holding capacity of pork myofibrils. J. Sci. Food Agric. 1999, 79, 1939–1942. [Google Scholar] [CrossRef]
  24. Kim, H.J.; Sujiwo, J.; Kim, H.J.; Jang, A. Effects of dipping chicken breast meat inoculated with Listeria monocytogenes in lyophilized scallion, garlic, and kiwi extracts on its physicochemical quality. Food Sci. Anim. Resour. 2019, 39, 418. [Google Scholar] [CrossRef] [PubMed]
  25. Hou, X.; Liang, R.; Mao, Y.; Zhang, Y.; Niu, L.; Wang, R.; Liu, C.; Liu, Y.; Luo, X. Effect of suspension method and aging time on meat quality of Chinese fattened cattle M. Longissimus Dorsi. Meat Sci. 2014, 96, 640–645. [Google Scholar] [CrossRef]
  26. Gornall, A.G.; Bardawill, C.J.; David, M.M. Determination of serum proteins by means of the biuret reaction. J. Biol. Chem. 1949, 177, 751–766. [Google Scholar] [PubMed]
  27. Li, Y.J.; Li, J.L.; Zhang, L.; Gao, F.; Zhou, G.H. Effects of dietary starch types on growth performance, meat quality and myofibre type of finishing pigs. Meat Sci. 2017, 131, 60–67. [Google Scholar] [CrossRef]
  28. Anderson, M.J.; Lonergan, S.M.; Fedler, C.A.; Prusa, K.J.; Binning, J.M.; Huff-Lonergan, E. Profile of biochemical traits influencing tenderness of muscles from the beef round. Meat Sci. 2012, 91, 247–254. [Google Scholar] [CrossRef]
  29. Melody, J.L.; Lonergan, S.M.; Rowe, L.J.; Huiatt, T.W.; Mayes, M.S.; Huff-Lonergan, E. Early postmortem biochemical factors influence tenderness and water-holding capacity of three porcine muscles. J. Anim. Sci. 2004, 82, 1195–1205. [Google Scholar] [CrossRef] [PubMed]
  30. Ilian, M.A.; Morton, J.D.; Kent, M.P.; Le Couteur, C.E.; Hickford, J.; Cowley, R.; Bickerstaffe, R. Intermuscular variation in tenderness: Association with the ubiquitous and muscle-specific calpains. J. Anim. Sci. 2001, 79, 122–132. [Google Scholar] [CrossRef] [Green Version]
  31. Shen, L.Y.; Luo, J.; Lei, H.G.; Jiang, Y.Z.; Bai, L.; Li, M.Z.; Tang, G.Q.; Li, X.W.; Zhang, S.H.; Zhu, L. Effects of muscle fiber type on glycolytic potential and meat quality traits in different Tibetan pig muscles and their association with glycolysis-related gene expression. Genet. Mol. Res. 2015, 14, 14366–14378. [Google Scholar] [CrossRef]
  32. McDonagh, M.B.; Fernandez, C.; Oddy, V.H. Hind-limb protein metabolism and calpain system activity influence post-mortem change in meat quality in lamb. Meat Sci. 1999, 52, 9–18. [Google Scholar] [CrossRef]
  33. Knorr, D.; Zenker, M.; Heinz, V.; Lee, D.U. Applications and ultrasonics in food potential of processing. Trends Food Sci. Technol. 2004, 15, 261–266. [Google Scholar] [CrossRef]
  34. Xiong, G.; Fu, X.; Pan, D.; Qi, J.; Xu, X.; Jiang, X. Influence of ultrasound-assisted sodium bicarbonate marination on the curing efficiency of chicken breast meat. Ultrason. Sonochem. 2020, 60, 104808. [Google Scholar] [CrossRef] [PubMed]
  35. Li, K.; Zhang, Y.; Mao, Y.; Cornforth, D.; Dong, P.; Wang, R.; Zhu, H.; Luo, X. Effect of very fast chilling and aging time on ultra-structure and meat quality characteristics of Chinese Yellow cattle M. Longissimus Lumborum. Meat Sci. 2012, 92, 795–804. [Google Scholar] [CrossRef] [PubMed]
  36. Aroeira, C.N.; Torres Filho, R.A.; Fontes, P.R.; Ramos, A.L.; Castillo, C.J.C.; Hopkins, D.L.; Ramos, E.M. Comparison of different methods for determining the extent of myofibrillar fragmentation of chilled and frozen/thawed beef across postmortem aging periods. Meat Sci. 2020, 160, 107955. [Google Scholar] [CrossRef] [PubMed]
  37. Choi, Y.M.; Lee, S.H.; Choe, J.H.; Rhee, M.S.; Lee, S.K.; Joo, S.T.; Kim, B.C. Protein solubility is related to myosin isoforms, muscle fiber types, meat quality traits, and postmortem protein changes in porcine longissimus dorsi muscle. Livest. Sci. 2010, 127, 183–191. [Google Scholar] [CrossRef]
  38. Li, F.; Wang, B.; Liu, Q.; Chen, Q.; Zhang, H.; Xia, X.; Kong, B. Changes in myofibrillar protein gel quality of porcine longissimus muscle induced by its stuctural modification under different thawing methods. Meat Sci. 2019, 147, 108–115. [Google Scholar] [CrossRef] [PubMed]
  39. Qian, S.; Li, X.; Wang, H.; Mehmood, W.; Zhong, M.; Zhang, C.; Blecker, C. Effects of low voltage electrostatic field thawing on the changes in physicochemical properties of myofibrillar proteins of bovine Longissimus dorsi muscle. J. Food Eng. 2019, 261, 140–149. [Google Scholar] [CrossRef]
  40. Li, S.; Zheng, Y.; Xu, P.; Zhu, X.; Zhou, C. L-Lysine and L-arginine inhibit myosin aggregation and interact with acidic amino acid residues of myosin: The role in increasing myosin solubility. Food Chem. 2018, 242, 22–28. [Google Scholar] [CrossRef]
  41. Maity, I.; Rasale, D.B.; Das, A.K. Sonication induced peptide-appended bolaamphiphile hydrogels for in situ generation and catalytic activity of Pt nanoparticles. Soft Matter 2012, 8, 5301–5308. [Google Scholar] [CrossRef]
  42. Pan, B.S.; Yeh, W.T. Biochemical and morphological changes in grass shrimp (Penaeus monodon) muscle following freezing by air blast and liquid nitrogen methods. J. Food Biochem. 1993, 17, 147–160. [Google Scholar] [CrossRef]
  43. Zhang, M.; Li, F.; Diao, X.; Kong, B.; Xia, X. Moisture migration, microstructure damage and protein structure changes in porcine longissimus muscle as influenced by multiple freeze-thaw cycles. Meat Sci. 2017, 133, 10–18. [Google Scholar] [CrossRef]
  44. Alahakoon, A.U.; Faridnia, F.; Bremer, P.J.; Silcock, P.; Oey, I. Pulsed electric fields effects on meat tissue quality and functionality. In Handbook of Electroporation; Miklavcic, D., Ed.; Springer: Cham, Switzerland, 2016; Volume 4, pp. 2455–2475. [Google Scholar]
  45. Moczkowska, M.; Półtorak, A.; Montowska, M.; Pospiech, E.; Wierzbicka, A. The effect of the packaging system and storage time on myofibrillar protein degradation and oxidation process in relation to beef tenderness. Meat Sci. 2017, 130, 7–15. [Google Scholar] [CrossRef] [PubMed]
  46. Purchas, R.W.; Zou, M. Composition and quality differences between the longissimus and infraspinatus muscles for several groups of pasture-finished cattle. Meat Sci. 2008, 80, 470–479. [Google Scholar] [CrossRef] [PubMed]
Figure 1. Transmission electron microscopy (TEM) images of beef muscles during different aging periods. TEM images at original magnifications of ×25,000. (a1a6): The microstructure of semitendinosus (ST) at day 1, 3, 7, 9, 11, and 14. (b1b6): The microstructure of rhomboideus (RH) at day 1, 3, 7, 9, 11, and 14. (c1c6): The microstructure of infraspinatus (IN) at day 1, 3, 7, 9, 11, and 14. Red circles indicate the fracturing zones.
Foods 09 00806 g001
Table 1. Changes in pH values of different beef muscles during aging.
ItemsAging (Days)SEM
13791114
ST5.65 a,y5.45 ab,x5.54 b,xy5.50 a,xy5.45 ab,x5.38 a,x0.028
LT5.64 a,y5.38 a,x5.41 a,x5.39 a,x5.37 a,x5.40 ab,x0.027
RH5.76 ab,y5.55 bc,x5.53 b,x5.62 ab,x5.56 b,x5.55 ab,x0.028
GN5.72 ab,y5.46 ab,x5.53 b,x5.51 a,x5.38 a,x5.45 ab,x0.032
IN5.87 b,z5.66 c,xy5.70 c,xy5.76 b,yz5.73 c,xyz5.56 b,x0.029
PM5.59 a5.51 ab5.53 b5.58 ab5.51 ab5.55 ab0.022
BF5.67 a,y5.45 ab,x5.42 a,x5.47 a,x5.43 ab,x5.51 ab,x0.026
SEM0.0260.0230.0220.0380.0300.022
ST, semitendinosus; LT, longissimus thoracis; RH, rhomboideus; GN, gastrocnemius; IN, infraspinatus; PM, psoas major; BF, biceps femoris. a–c Values within a column with different superscript are significantly different (p < 0.05). x–z Values within a row with different superscript are significantly different (p < 0.05). SEM, standard error of the mean. n = 6 in each muscle at each aging period.
Table 2. Changes in the myofibril fragmentation index (MFI) of different beef muscles during aging.
ItemsAging (days)SEM
13791114
ST102.57 d,x107.93 c,x154.13 d,y157.53 e,y156.50 e,y189.93 e,z7.47
LT81.87 bc,x83.10 a,x86.97 a,xy88.27 a,xy88.90 a,xy92.60 a,y1.17
RH122.23 e,x129.93 d,xy131.73 c,xy132.97 cd,xy133.77 c,xy143.43 cd,y2.11
GN87.97 c,x105.87 c,y128.56 c,z131.70 c,z131.37 c,z136.93 c,z4.41
IN68.80 a,x76.87 a,xy79.77 a,xy84.37 a,y87.63 a,y101.83 ab,z2.62
PM75.90 ab,x93.47 b,y98.90 b,y111.87 b,z110.93 b,z110.07 b,z3.27
BF99.43 d,w122.87 d,x130.67 c,x141.80 d,y144.33 d,yz152.47 d,z4.33
SEM3.954.195.775.765.627.07
ST, semitendinosus; LT, longissimus thoracis; RH, rhomboideus; GN, gastrocnemius; IN, infraspinatus; PM, psoas major; BF, biceps femoris. a–c Values within a column with different superscript are significantly different (p < 0.05). x–z Values within a row with different superscript are significantly different (p < 0.05). SEM, standard error of the mean. n = 6 in each muscle at each aging period.
Table 3. Changes in protein solubility of different beef muscles during aging.
ItemsAging (days)SEM
13791114
Total Protein Solubility, mg/g
ST172.77 ab,x190.83 bc,yz207.59 c,z183.39 ab,xy192.81 ab,yz193.16 bc,yz3.19
LT181.08 bcd,x198.36 c,xy193.45 b,xy195.42 ab,xy200.21 b,y200.06 c,y2.42
RH169.00 a174.24 a176.05 a183.80 ab181.94 ab185.91 ab2.25
GN189.47 d187.76 abc196.72 bc198.46 b185.01 ab194.29 bc2.01
IN176.24 abc,x185.24 abc,x195.85 bc,y178.47 a,x177.82 a,x179.02 a,x1.95
PM183.20 cd191.27 bc187.48 ab184.91 ab187.58 ab189.43 abc1.30
BF179.64 bc,x179.67 ab,x208.62 c,y183.42 ab,x186.39 ab,x187.92 ab,x2.94
SEM1.692.252.672.312.481.77
Sarcoplasmic Protein Solubility, mg/g
ST59.71 abc,xy57.20 ab,xy60.66 b,y49.57 ab,x50.90 xy50.53 xy1.51
LT68.31 c,y65.49 b,y50.83 a,x48.75 ab,x51.99 x51.51 x2.17
RH51.35 a,xy59.33 ab,y48.77 a,x42.00 a,x46.14 x44.02 x1.70
GN62.45 bc,yz58.45 ab,yz67.01 b,z55.05 b,xy48.67 x55.15 xy1.73
IN55.69 ab,yz52.04 a,xy62.61 b,z52.65 b,xy45.06 x46.51 xy1.76
PM51.93 a,y59.08 ab,z47.68 a,x48.06 ab,x47.51 x44.08 w1.21
BF55.29 ab,x60.24 ab,xy70.66 b,y48.20 ab,x49.23 x57.48 xy2.31
SEM1.551.192.141.151.021.68
Myofibrillar Protein Solubility, mg/g
ST113.07 a,x133.63 b,y146.93 b,y133.81 ab,y141.91 y142.63 abc,y3.28
LT112.77 a,x132.87 b,y142.62 ab,y146.67 b,y148.22 y148.55 c,y3.59
RH117.66 ab,x114.90 a,x127.28 a,xy141.80 ab,y135.80 y141.89 abc,y3.10
GN127.01 de,x129.31 b,xy129.71 a,xy143.41 ab,y136.34 xy139.14 abc,xy2.15
IN120.55 bc133.20 b133.23 ab125.82 a132.75132.52 ab1.91
PM131.27 e,x132.18 b,x139.80 ab,xy136.85 ab,xy140.06 xy145.34 bc,y1.62
BF124.35 cd119.44 ab137.96 ab135.22 ab137.16130.44 a2.55
SEM1.572.092.172.372.331.86
ST, semitendinosus; LT, longissimus thoracis; RH, rhomboideus; GN, gastrocnemius; IN, infraspinatus; PM, psoas major; BF, biceps femoris. a–c Values within a column with different superscript are significantly different (p < 0.05). x–z Values within a row with different superscript are significantly different (p < 0.05). SEM, standard error of the mean. n = 6 in each muscle at each aging period.
Table 4. Pearson correlation coefficients for pH, MFI, and protein solubility.
MFITPSSPSMPS
pH−0.314 **−0.419 **−0.032−0.377 **
MFI 0.086−0.1440.183 *
TPS 0.300 **0.743 **
SPS −0.416 **
MFI, myofibril fragmentation index; TPS, total protein solubility; SPS, sarcoplasmic protein solubility; MPS, myofibrillar protein solubility. * p < 0.05; ** p < 0.01. n = 6 in each muscle at each aging period.

