Article

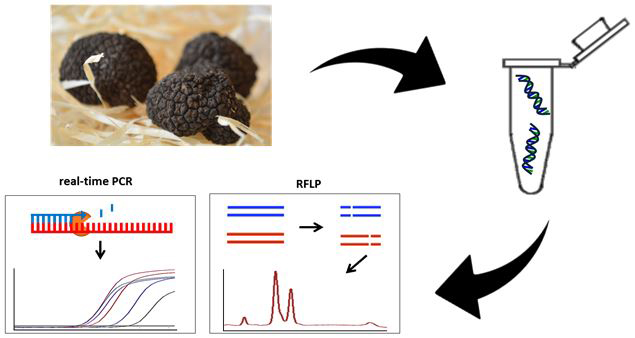
Food Authentication: Identification and Quantitation of Different Tuber Species via Capillary Gel Electrophoresis and Real-Time PCR

1
Hamburg School of Food Science, Institute of Food Chemistry, University of Hamburg, Grindelallee 117, 20146 Hamburg, Germany
2
LUFA-ITL GmbH, Dr.-Hell-Straße 6, 24107 Kiel, Germany
*
Author to whom correspondence should be addressed.
Foods 2020, 9(4), 501; https://doi.org/10.3390/foods9040501
Submission received: 23 March 2020 / Revised: 10 April 2020 / Accepted: 10 April 2020 / Published: 16 April 2020
(This article belongs to the Special Issue Novel Analytical Methods in Food Analysis)

Abstract

:
Truffles are hypogeous fungi mainly found in Europe and Asia. Due to their special aroma and taste, some truffle species are sold on the international market at an extremely high price. Among the economically relevant species, the white Alba truffle (Tuber magnatum) and the black Périgord truffle (T. melanosporum) are the most appreciated species. The fruiting bodies of the Asian black truffle are morphologically very similar to T. melanosporum, and those of the Bianchetto truffle (T. albidum Pico) are similar to T. magnatum, but are of little economic value. Highly valued species are adulterated with cheaper ones, especially. Because of this problem, the aim of this study was the development of methods for detecting possible admixtures to protect consumers from fraud. This study is based on seven different truffle species (117 fruiting bodies) from different growing regions. Additionally, selected truffle products were included. Using this material, a real-time PCR (polymerase chain reaction) assay allowing the detection and quantitation of Asian black truffles in T. melanosporum up to 0.5% was developed. In addition, a capillary gel electrophoresis assay was designed, which allows the identification and quantitation of different species. The methods can be used to ensure the integrity of truffle products.

Graphical Abstract

1. Introduction

Truffles are underground fungi belonging to the class of the Ascomycetes in the order Pezizales [1,2]. They grow in an ectomycorrhizal symbiosis with roots of different trees and shrubs, e.g., oak, poplar, willow, hazel [3], and Cistus [4]. Tuber spp. are mainly distributed in Europe, Asia, North Africa, and America [5,6]. At least 180 Tuber species exist worldwide [6], 70–75 species have been well described [7], and 32 species are currently listed in Europe [8].
Under specific environmental conditions, such as calcareous soil with a neutral pH [9], truffles produce hypogeous edible ascocarps. The unique aroma and taste emitted from the fruiting bodies are responsible for the gastronomical desirability; therefore, some truffles represent some of the most highly prized edible and valuable mushrooms worldwide [10].
T. magnatum is the most expensive truffle species in general [6]. It is mainly distributed in Italy, but it can also be found in the area around Balkan [11], France, and Switzerland [6]. Another white (or whitish) truffle with lesser economic value, T. albidum Pico, is morphologically and biochemically similar to T. magnatum, which can be subject to fraud [12]. It is also possible that roots initially colonized by T. magnatum have produced other white truffles, such as T. albidum Pico [5].
Among the black truffles is the Périgord truffle T. melanosporum, the most expensive species which is highly valued for its organoleptic properties [13], and, therefore, there is a risk of fraud. The natural distribution area is mainly France, Spain, and Italy [14]. The Asian black truffles, such as T. indicum and T. himalayense, are closely related to T. melanosporum, and the fruiting bodies are morphologically very similar [15]. Because of the larger production value, T. indicum is sold at a lower price and imported from China to Europe, North America, and Australia [16,17,18]. Cases have been reported where T. indicum has been sold as T. melanosporum, and incorrect inoculations and incidence of ectomycorrhiza from T. indicum in T. melanosporum truffle orchards have been found [16,18,19,20]. Due to the lower price, admixture from the Asian black truffles with T. melanosporum is sometimes observed in food products. Since the microscopic identification of truffle fruiting bodies is difficult, molecular methods have been introduced to analyze different truffle species that are morphologically similar.
One region of the DNA suited for the molecular analysis of fungi is the rDNA (ribosomal DNA), which contains two variable non-coding regions, the internal transcribed spacer (ITS) region 1 and 2, between the highly conserved 17S, 5.8S and 25S rRNA (ribosomal RNA) genes [21]. The ITS regions are widely used to analyze ectomycorrhizal communities of mycorrhizal fungi and fungal species in the field, and it is recommended to be used as the primary fungal barcode [22,23]. Another advantage of the ITS region is the repetitive character resulting in a low detection limit [24,25,26].
Molecular methods based on the ITS region have also been widely used for the identification of truffle species [27,28,29,30,31,32]. Methods targeting the rDNA region for detecting admixtures from lower prized truffle species in T. melanosporum were developed, enabling the qualitative detection of ectomycorrhiza or ascocarps from T. indicum in T. melanosporum [20,30,33,34]. Different real-time PCR (polymerase chain reaction) methods for truffles were developed, e.g., for the analysis of truffle grounds and the quantitation of mycelium in soil [35,36,37,38]. Furthermore, real-time PCR assays for the detection of T. melanosporum in processed food products and for the quantitation of T. aestivum in mycelium have been developed [35,39,40]. To our knowledge, there is currently no real-time-PCR method available, which can quantify Asian truffles in T. melanosporum.
To detect possible admixtures of cheaper truffle species and to protect consumers from fraud, the aim of this study was to develop methods to detect such possible admixtures. The DNA-based methods can be used for quality control in the food industry or in official food control to ensure the integrity of truffle products.
The present paper reports the application of molecular techniques, real-time PCR, capillary gel electrophoresis (CGE), and restriction fragment length polymorphism (RFLP) to identify and quantify admixtures of different truffle species. A specific primer pair (with minor modifications) for T. indicum [33] and a new T. melanosporum specific primer pair suitable for real-time PCR with hybridization probes were used. The real-time PCR technology with hybridization probes was chosen for the real-time PCR assay. Compared to assays with SYBR Green I, hybridization probes are more specific because the fluorescent signal is derived from a specific probe and thus, is sequence-specific [41]. Moreover, a quantitative CGE based method for species differentiation and a RFLP assay combined with CGE were developed. The RFLP offers an alternative to real-time PCR as an easy to use method. The methods developed were tested on fruit bodies and truffle products from retail outlets.

2. Materials and Methods

2.1. Sample Material

In total, 117 fruiting bodies of different truffle species from distinct origins were analyzed (see Table 1). Upon arrival, all fruiting bodies were frozen in liquid nitrogen and stored at –80 °C. Furthermore, canned truffle fruiting bodies and food products containing truffles purchased at retail locations were used.

2.2. DNA Isolation

For DNA isolation of the matrix mixtures, commercially available kits (QIAGEN DNeasy® Plant Mini Kit (QIAGEN, Hilden, Germany), peqGOLD Fungal DNA Mini Kit (VWR International GmbH, Darmstadt, Germany)) were used. DNA purity was determined photometrically using a DS-11 Spectrophotometer (DeNovix Inc., Wilmington, USA). DNA concentration was determined fluorometrically (QuantusTM Fluorometer, Promega GmbH, Mannheim, Germany).
For a high sample throughput, the simple “alkaline” and the “modified PCI (phenol-chloroform-iso-amyl alcohol)” DNA extraction method, originally developed for tissue samples of chicken embryos [42], were used with slight modifications. In the “alkaline method”, approximately 25 mg of sample material was incubated for 20 min at 75 °C in 100 µL 0.2 M NaOH after grinding with a micropistille in a 1.5 mL reaction tube. Afterward, 300 µL 0.04 M Tris/HCl was added. One microliter of the liquid phase was used directly for PCR. Additionally, the “modified PCI method” was used as followed: Approximately 25 mg sample material was ground in 500 µL extraction buffer (0.1 M Tris/HCl, 55 mM CTAB, 1.4 M NaCl, and 20 mM EDTA, pH 8.0) [43] with a micropistille in a 1.5 mL reaction tube and incubated for 30 min at 65 °C. Five hundred microliters chloroform were added and centrifuged at 10,000 × g for 5 min. The supernatant was transferred to a new 2 mL reaction tube and mixed with 500 µL isopropanol and incubated for 30 min at 4 °C. After repeated centrifugation for 15 min, the supernatant was discarded, and the pellet was washed with 500 μL 70% ethanol. The DNA pellet was vacuum-dried and dissolved in 50 μL water. One microliter was used directly for PCR.

2.3. Preparation of Spiked Sample Material

2.3.1. DNA Mixtures

The DNA isolated from different truffle fruiting bodies was adjusted to a concentration of 5 ng/µL and mixed in different ratios (0.1%, 0.5%, 1%, 5%, 10%, 20%, 40%, 70% DNA isolated from T. indicum in DNA isolated from T. melanosporum; 5%, 20%, 40%, 80% DNA isolated from T. albidum Pico in DNA isolated from T. magnatum).
Additionally, mixtures of PCR amplicons were prepared by mixing PCR products from different fruiting bodies in different ratios after PCR (20%, 40%, 50% T. indicum in T. melanosporum PCR amplicons; 5%, 20%, 40%, 80% T. indicum in T. aestivum and T. albidum Pico in T. magnatum PCR amplicons).

2.3.2. Matrix Mixtures of Fruiting Bodies

Spiked samples of two distinct truffle species were produced by weighing out ground fruiting bodies of different truffle species in a 2 mL reaction tube (4.3%, 4.6%, 7.4%, 13.5%, 18.28%, 20.4%, 32.2% and 11.2%, 21.7%, 28.3%, 47.5% T. indicum in T. melanosporum). The ground powder was mixed in 500 µL DNA isolation buffer using a bead ruptor (Bead Ruptor 24; Biolabproducts GmbH, Bebensee, Germany) and the DNA isolation protocol was continued.

2.4. Real-Time PCR

To detect and quantify possible contamination with lower-priced Asian truffles of the T. indicum complex (T. indicum/himalayense) in higher priced truffles, such as T. melanosporum, a specific primer pair (with minor modifications) designed from Paolocci et al. (1997) [32] was used (Indi-fw/ITS4LNG, see Table 2). This primer pair targets the ITS2 region on the rDNA. Additionally, a primer pair specific for T. melanosporum (Mela-fw/Mela-rv, see Table 2), also located in the ITS2 region, was designed using the sequences from Paolocci et al. (1997) [32] as templates, which was able to detect the presence of T. melanosporum.
For real-time PCR assays, hybridization probes labeled with a fluorophore (Hex, Cy5) and a quencher (BHQ2) were designed, taking care that no overlapping of fluorescence maxima occurred. All primer and probe sequences, including the fluorophores and quenchers, used in this work are listed in Table 2.
The real-time PCR assay was performed in a volume of 10 μL including 1× Taq reaction buffer (Biozym Scientific GmbH, Hessisch Oldendorf, Germany), 0.8 mM dNTPs (each 2.5 mM, Bioline GmbH, Luckenwalde, Germany), 0.5 U Taq polymerase (Biozym Taq DNA Polymerase, Biozym Scientific GmbH, Hessisch Oldendorf, Germany), 50 nM of each primer (Life Technologies, Darmstadt, Germany), 40 nM of the fluorescently labeled probe (Eurofins Genomics GmbH, Ebersberg, Germany), and 1 µL of isolated DNA.
For real-time PCR, a CFX96 Touch System thermocycler (Bio-Rad Laboratories GmbH, Munich, Germany) was used. Real-time PCR was performed with the following two-step temperature program: initial denaturation for 300 s at 95 °C followed by 30 cycles with 20 s denaturation at 95 °C and 60 s annealing and elongation at 60 °C, finished by final elongation for 600 s at 72 °C.

Practical Determination of LoD

To determine the LoD (limit of detection) of the developed real-time PCR DNA, mixtures of T. melanosporum and T. indicum (0.1%, 0.5%, 1%, 5%, 10%, 20%, 40%, 70% DNA isolated from T. indicum in DNA isolated from T. melanosporum) were measured in duplicate using the primer pair specific for T. indicum with 10 ng DNA in each PCR reaction.

2.5. Isolation of DNA Fragments from Agarose Gels

For the isolation of PCR fragments from agarose gels, the peqGOLD® Gel Extraction Kit (VWR International GmbH, Erlangen, Germany) was used according to the manufacturer’s information.

2.6. RFLP and CGE

For the amplification reactions, the primers ITS1 and ITS4 [21] amplifying the ITS region were used. The PCR prior to the RFLP was performed in a volume of 10 μL including 1× Taq reaction buffer (Biozym Scientific GmbH, Hessisch Oldendorf, Germany), 0.8 mM dNTPs (each 2.5 mM, Bioline GmbH, Luckenwalde, Germany), 0.5 U Taq polymerase (Biozym Taq DNA Polymerase, Biozym Scientific GmbH, Hessisch Oldendorf, Germany), 1 μM of each primer (Life Technologies, Darmstadt, Germany), and 1 µL of isolated DNA. The thermal cycle profile was as follows: initial denaturation for 300 s at 95 °C, 35 cycles with denaturation for 20 s at 95 °C, annealing for 20 s at 47.3 °C, elongation for 20 s at 72 °C, and final elongation for 300 s at 72 °C. PCR amplicons were visualized with agarose gel electrophoresis (AGE) on 1.5% agarose gels stained with 0.001% ethidium bromide. The gels were visualized under UV light (254 nm, Biostep, Felix 1040, Biostep GmbH, Jahnsdorf, Germany).
The restriction enzyme CviQI (Thermo Fisher Scientific Inc., Waltham, United States; restriction sequence: G/TAC) was used for restriction. To carry out the reaction, 1 U of restriction enzyme, 2 μL of PCR products, 0.8 µL corresponding buffer in a total volume of 8 µL were used. The reaction mixture was incubated at 25 °C for approximately 8 h without heat inactivation.
Detection of PCR products was carried out by AGE (see above). Quantitation by capillary gel electrophoresis was performed according to the manufacturer instructions on a 2100 Bioanalyzer (Agilent Technologies, Santa Clara, United States) using the Agilent DNA 7500 Kit (Agilent Technologies, Santa Clara, CA, United States) and on a Fragment AnalyzerTM (Advanced Analytical Technologies, Inc, Ankeny, IA, United States).

3. Results and Discussion

3.1. Real-Time PCR

3.1.1. Primer Specificity
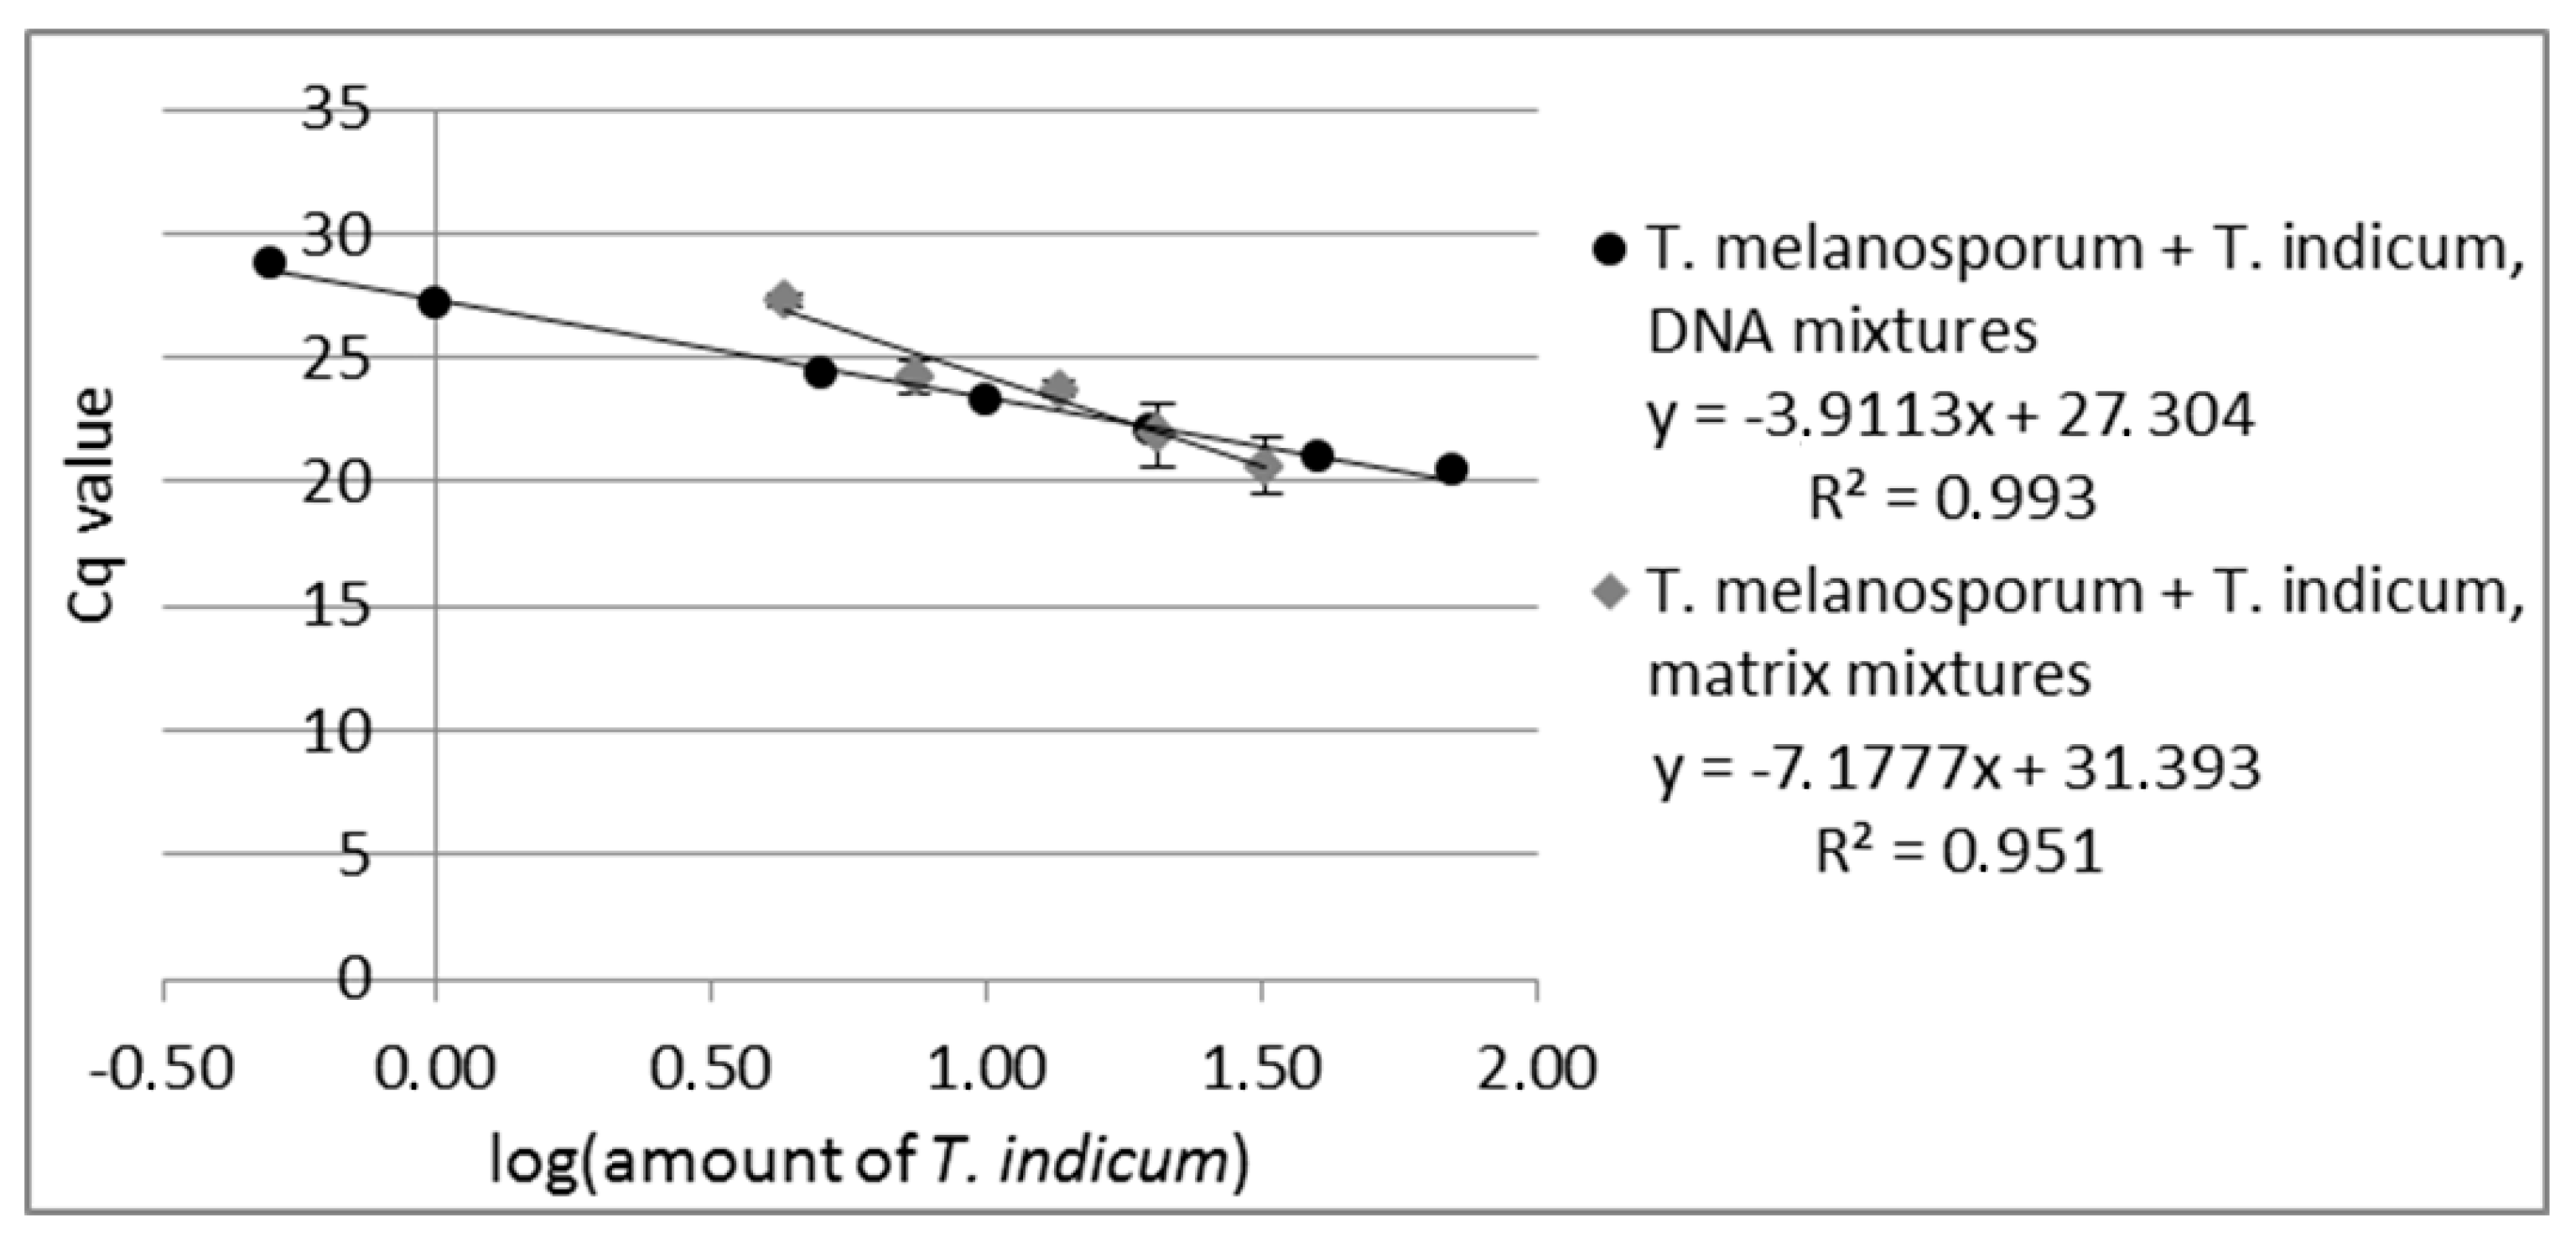
For the detection and quantitation of potential impurities of Asian black truffles in T. melanosporum a specific primer pair (with minor modifications) designed from Paolocci et al. (1997) [32] specific for these species was used in combination with a hybridization probe. In addition, a hybridization probe and a primer pair specific for T. melanosporum were designed to check the presence of this high prized truffle in the samples. The T. melanosporum specific primer pair was designed so that the length for the amplification product was about 140 bp. So the amplification length was similar to the amplification product of the T. indicum specific primer pair, and it meets the requirements for the hybridization probes [44] and allows an analysis of fragmented DNA as it could occur in processed food [24].
The specificity of the used primer was tested with DNA isolated from all samples of different Tuber spp. listed in Table 1. As can be seen in Table S1, the specific primer pair for T. indicum showed only positive PCR results with the Asian black truffles T. indicum and T. himalayense. Cross contaminations can be ruled out because none of the samples from other Tuber species showed positive Cq values. This demonstrates the suitability of the real-time assay for the detection and possible quantitation of T. indicum/himalayense and T. melanosporum without cross amplifications. This opens up the possibility to use this primer pair to detect possible admixtures of the cheaper Asian black truffles in higher-priced species, such as T. melanosporum. A similar performance was observed for the T. melanosporum specific primer, which gave only positive signals with the analyzed DNA isolated from T. melanosporum. In addition, the T. melanosporum fruiting bodies canned in saltwater from food retail showed positive Cq values in real-time PCR, showing that the real-time PCR assay also works with processed food. The ranging Cq values for analyzed fruiting bodies can be explained by the DNA isolation method used (“alkaline method”, “modified PCI method” [42]) because the concentration of DNA was not adjusted to a uniform level for specificity test. Since the specificity of the primer pairs should be tested qualitatively, the non-adjusted DNA concentration did not affect the specificity test negatively.

3.1.2. Quantitation

Primer suitability for quantitation was tested by measuring DNA mixtures over the concentration range from 0.1% to 70% T. indicum in T. melanosporum DNA. The real-time assay of the DNA mixtures showed a reliable amplification over the concentration range from 0.5% to 70% T. indicum in T. melanosporum DNA (see Figure 1, measuring values are shown in Table S2) with an R2 of 0.993 (Equitation for R2 see Equitation S1). Due to the fact that the last measured standard (0.1% T. indicum in T. melanosporum DNA) gave no measurable signal, the LoD of the real-time PCR assay was set at 0.5% T. indicum in T. melanosporum for the T. indicum specific real-time assay.
PCR can be influenced by the sample matrix [45], e.g., by coextracted substances. It is also possible that the DNA from some truffle species can be more easily isolated or that the DNA from some species contains more PCR inhibitors. This would lead to an inhomogeneous PCR amplification by samples with more than one truffle species. To assess these effects, five different matrix mixtures of T. indicum with T. melanosporum were prepared (4.3%, 7.4%, 13.5%, 20.4%, 32.2% T. indicum). For the matrix experiments, DNA from each matrix mixture was isolated and analyzed via real-time PCR with both real-time systems, the T. indicum and the T. melanosporum specific primers, in triplicate with 10 ng DNA pro PCR reaction. As in the case of the analyzed DNA mixtures, the standard curve of the matrix mixtures revealed a linear correlation between the Cq values plotted against the logarithm of T. indicum content in T. melanosporum with an R2 of 0.951 (see Figure 1). Eventually, coextracted PCR inhibitors could lead to PCR efficiency under 100%. The results obtained show that the developed real-time PCR opens the possibility to quantify the content of T. indicum admixtures in T. melanosporum also in matrix mixtures, to determine the rate of fraud by replacing expensive truffles by cheaper ones.
Furthermore, two matrix mixtures of T. melanosporum fruiting bodies with different amounts of T. indicum (MM1: 18.28%, MM2: 4.60% T. indicum) were analyzed in duplicate via real-time PCR with T. melanosporum and T. indicum specific primer pair. Calculation of the T. indicum content was performed using absolute quantitation with an external calibration curve of DNA mixtures (0.1% to 70% T. indicum in T. melanosporum DNA) and with the external calibration curve of matrix mixtures used above. Using the calibration curve of DNA mixtures for MM1 and MM2, a T. indicum amount of 19.44% ± 6.4% or 2.32% ± 0.7%, respectively, was calculated, and using the calibration curve of matrix mixtures a T. indicum amount of 17.97% ± 3.16% (MM1) or 5.84% ± 0.92% (MM2) was calculated. The results show that the use of the matrix calibration curve leads to an improvement in quantitative results by compensating matrix effects. These results indicate that it should also be possible to determine the T. indicum content in food products or other matrices using a standard curve with a matrix comparable to the sample.

3.2. RFLP and CGE

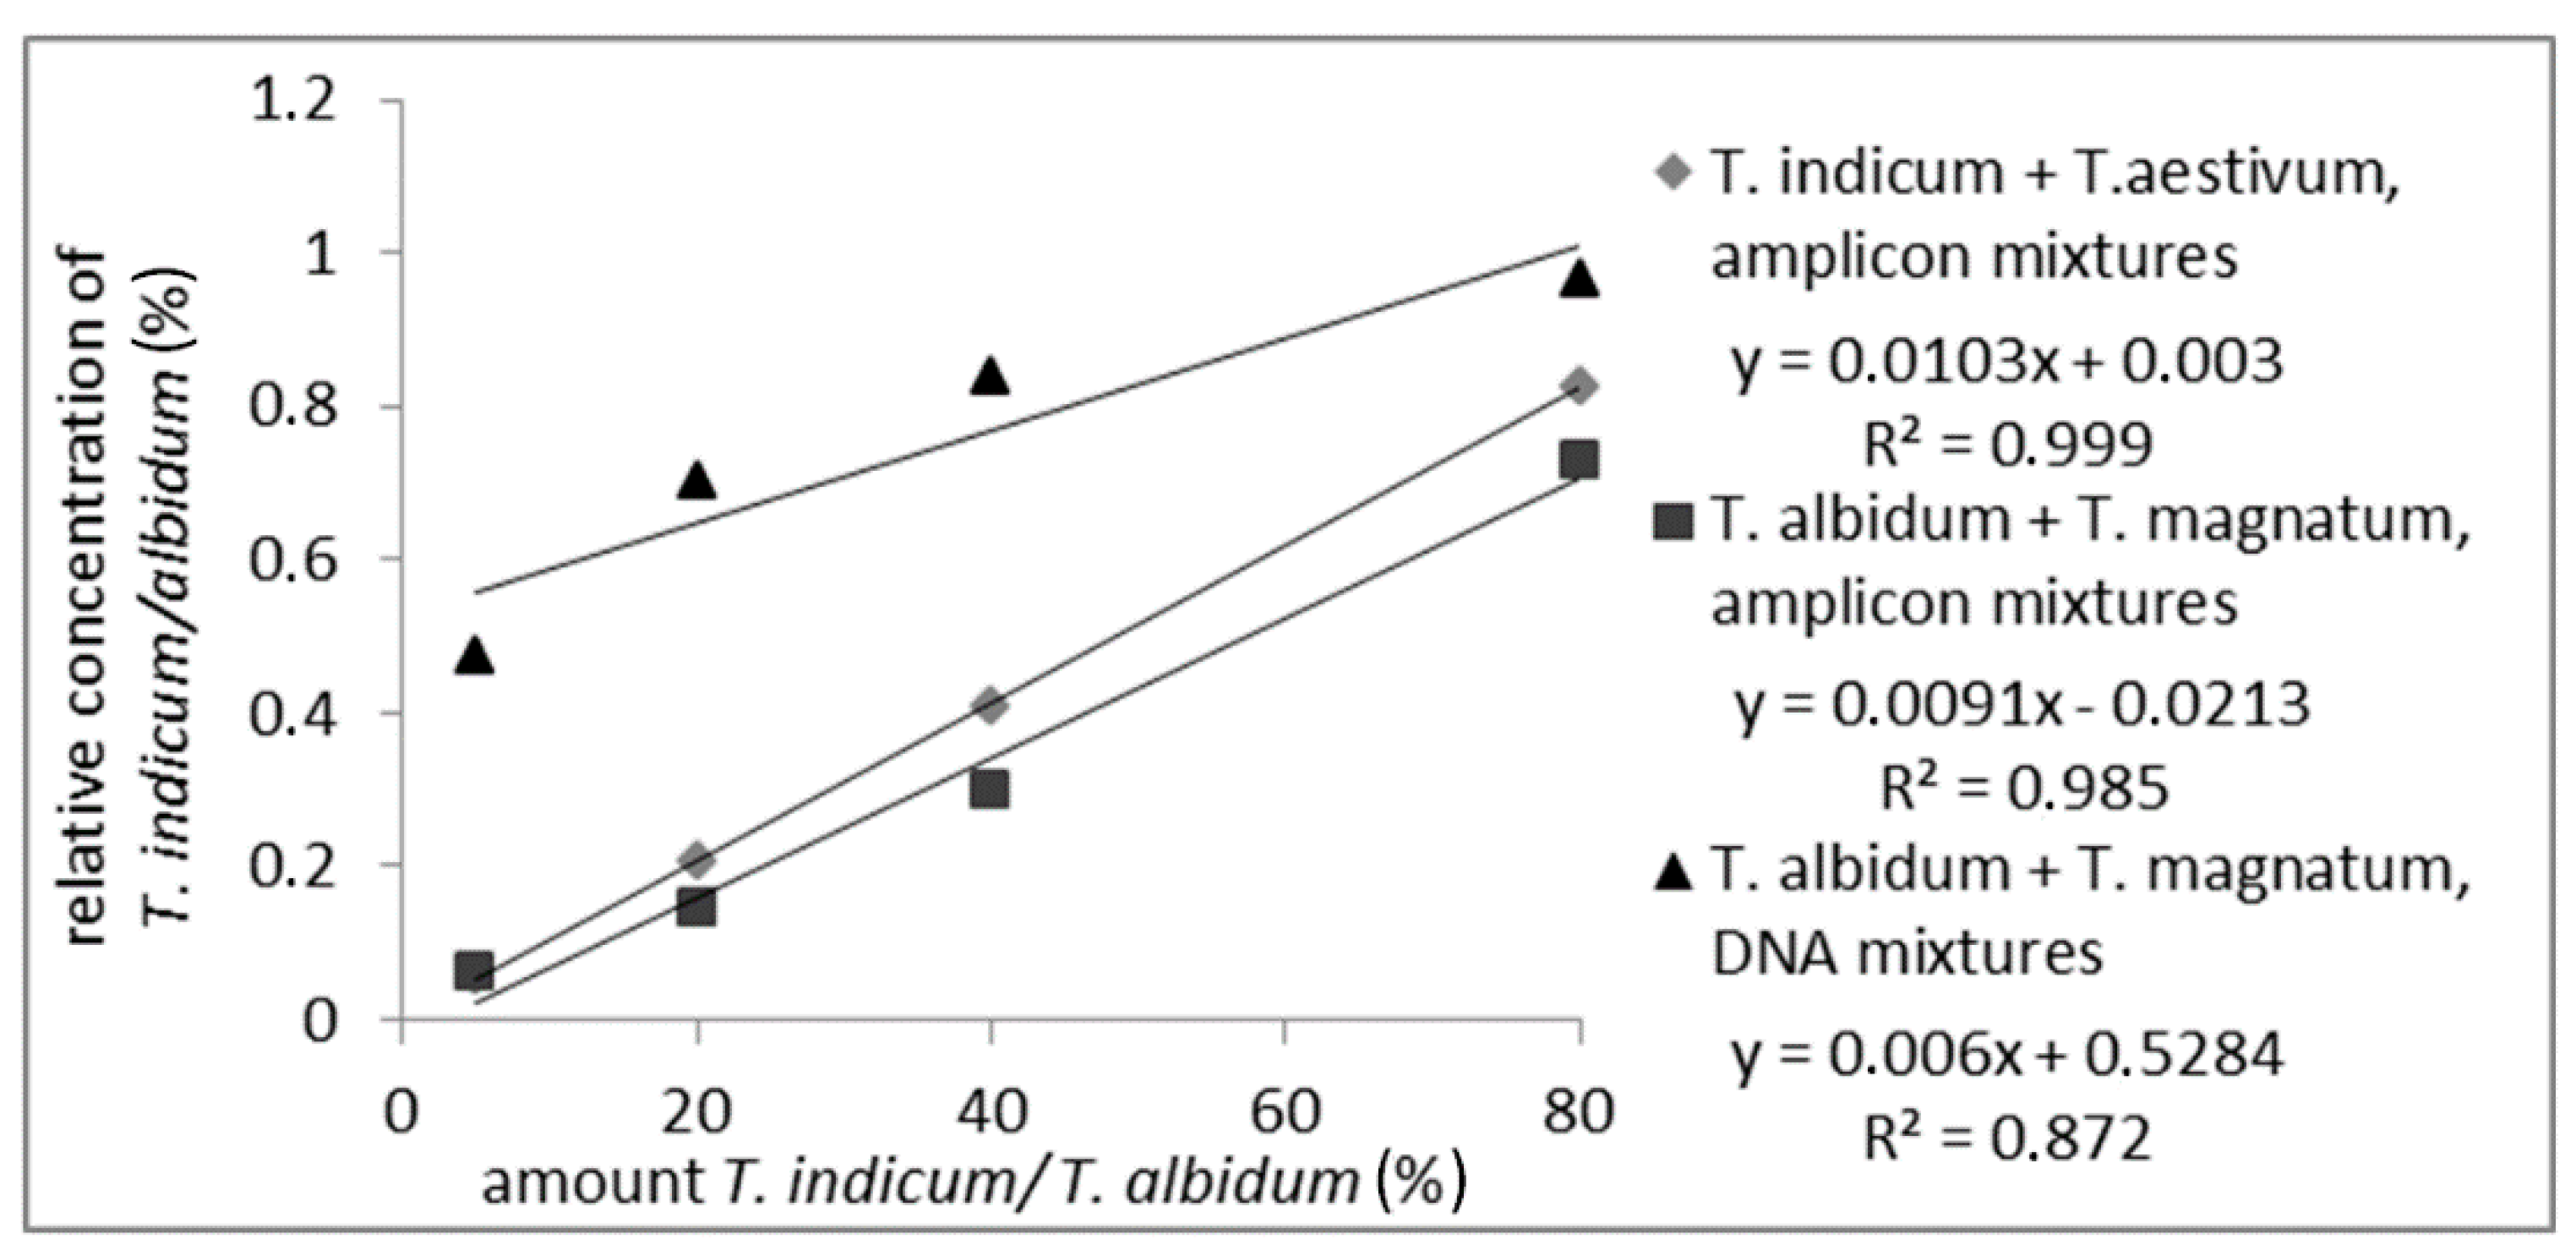
3.2.1. PCR-Amplification of the ITS Region, Evaluation via CGE

The primers ITS1/ITS4 amplify the ITS1, 5.8S, and ITS2 regions. PCR amplification of DNA with this primer pair from the different Tuber spp. resulted in bands on agarose gels with different lengths. T. himalayense, T. indicum, T. melanosporum, and T. magnatum generated bands with approximately 630 bp. Amplicons from T. aestivum DNA were approximately 50 bp longer. T. albidum Pico DNA resulted in bands on agarose gels with about 550 bp, and T. brumale DNA resulted in bands with approximately 900 bp (see Figures S1–S6). In contrast to the findings of Paolocci et al. (1995), the analyzed T. aestivum samples used in this study showed only one band on agarose gels with approximately 700 bp, which was also shown in, e.g., [46]. The fact that T. brumale showed the longest and T. albidum Pico the shortest amplicon length (900 bp and 500 bp, respectively) was also detected by other groups [47,48].
Due to the fact that T. aestivum, T. albidum Pico, and T. brumale showed fragments different in size compared with the other truffle species analyzed, an identification and quantitation of these species or another truffle species mixed with T. aestivum, T. albidum Pico and T. brumale should be possible via CGE.
To prove whether the detection and quantitation of T. indicum in a mixture with T. aestivum or T. albidum Pico mixed with T. magnatum based on the different amplicon length is possible, different mixtures of PCR amplicons produced with ITS1/ITS4 primers were prepared. Mixtures from T. indicum with T. aestivum and from T. magnatum with T. albidum Pico with 5%, 20%, 40%, and 80% T. indicum/albidum Pico PCR amplicons were analyzed on CGE and the relative peak area from T. indicum and T. albidum Pico was integrated. Additionally, isolated DNA of T. albidum Pico and T. magnatum were mixed prior to PCR to check if the PCR had an influence on the quantitation via the different ITS amplicon length on CGE.
As shown in Figure 2 (measuring values are shown in Table S3), a correlation between the relative peak-area of the measured PCR-amplicons from T. indicum or T. albidum Pico and the amount of the corresponding truffle species could be detected over the whole range of analyzed samples with an R2 of 0.999 or 0.985, respectively. The R2 of 0.872 of the DNA mixture was lower than the R2 of the amplicon mixtures, but a linear correlation was still visible. The decline in the R2 can be explained by inhomogeneous samples, or matrix effect occurred during PCR. These results show that a quantitation of a truffle species mixed with another species is possible via just the different lengths of the PCR-amplicons, which makes the analysis fast and simple because no digestion with restriction enzymes is necessary.

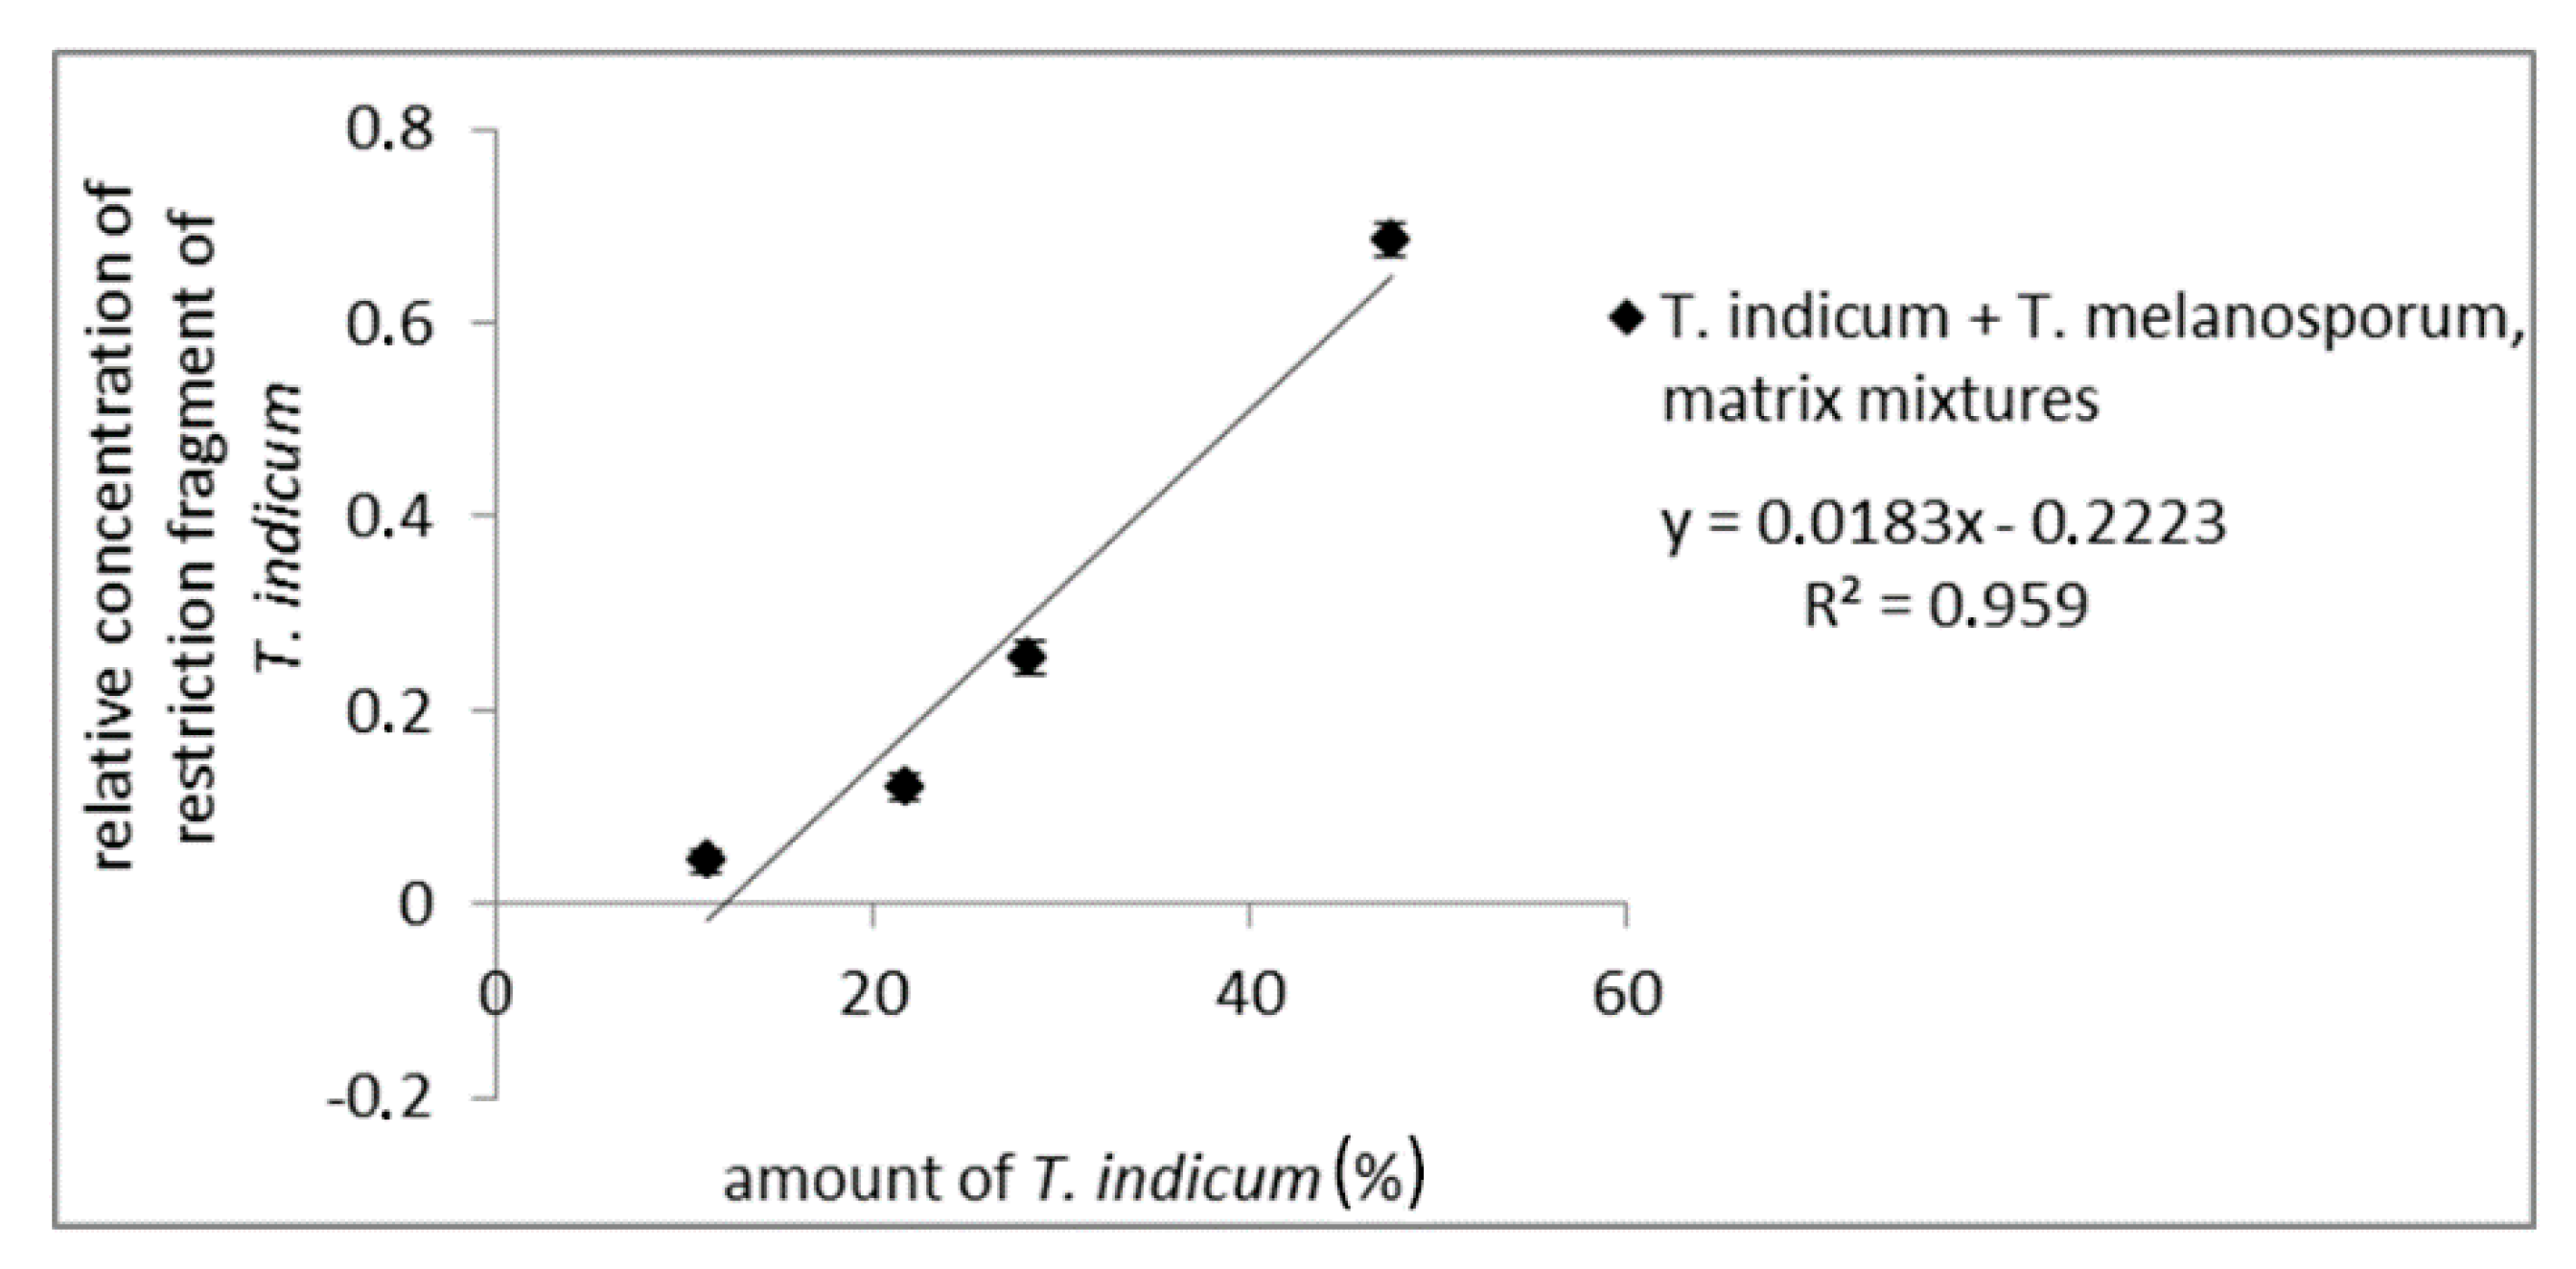
3.2.2. RFLP of the ITS Region, Evaluation via CGE

Due to the same length of the region amplified with the ITS1/ITS4 primers, a differentiation of the highly prized black Périgord truffle T. melanosporum and the Asian black truffles is not possible by comparing the ITS amplicon length. Thus, a differentiation and quantitation of admixtures from Asian black truffles of the T. indicum group in T. melanosporum with RFLP and CGE analysis of the ITS1, 5.8S, and ITS2 regions amplified by ITS1/ITS4 primers were performed. As, for example, shown by Roux et al. (1999) [49] and Paolocci et al. (1997) [32], a differentiation between various Tuber species via RFLP is possible. But according to our knowledge, this is the first approach to use this technique for a quantitation of possible admixtures from Asian black truffles in T. melanosporum via CGE.
It is known from the literature that genetic differences exist in the ITS region of Tuber species, especially in T. aestivum. Compared to T. aestivum, the other analyzed Tuber species show a relatively low intraspecific divergence [48,50].
In 2018, Qiao et al. [50] sequenced and analyzed a 500 bp long fragment of the ITS region from 476 truffle ascocarps of the T. indicum complex and revealed 54 haplotypes. In the scope of this work, we compared the 476 published ITS sequences with each other, and the restriction site from the endonuclease CviQI was examined. The sequences can basically be divided into three groups. (i) The first group with one restriction side after base number 30 includes 258 ascocarps, the majority of analyzed samples, (ii) the second group with two restriction sides after base number 60 and 336, 64 and 340 or 60 and 337 includes 203 ascocarps. (iii) The third group, including 15 ascocarps, just a minority of samples shows no restriction sides. In this work, 25 ascocarps of Asian black truffles were analyzed with RFLP from the ITS region. All fruiting bodies but one showed the same restriction pattern with two bands (150 and 500 bp). To compare the obtained restriction profile with the sequences published by Qiao et al. (2018) [50], some ITS amplicons were sequenced (Sanger sequencing, Eurofins Genomics GmbH, Ebersberg, Germany) showing that they are similar to the first group with one restriction side after base number 30. The fruiting body showing a divergent restriction pattern (see Figure S6) belongs to one ascocarp collected in Yunnan, and the sequence comparisons showed that the obtained sequence is similar to the second group with two restriction sides.
The 20 fruiting bodies from T. melanosporum analyzed via RFLP showed a uniform species-specific restriction pattern (see Figure S5), indicating that this should not hinder a differentiation of T. melanosporum and T. indicum.
To check if quantitative assays for a quantitation of admixtures from the Asian black truffles in T. melanosporum were possible mixtures of PCR amplicons from T. melanosporum with 20%, 40%, and 50%, Asian black truffles were prepared and incubated with the restriction enzyme CviQI. For the mixtures, samples from the Asian black truffles showing one restriction side were used. The restriction fragments were analyzed via AGE (data not shown) and CGE. The CGE-chromatograms from T. melanosporum and T. indicum/himalayense measured separately are shown in Figure S7. For CGE evaluation, the long restriction fragments (T. indicum/himalayense: 500 bp; T. melanosporum: 430 bp) were used. Figure 3 presents the results of the quantitative evaluation, which demonstrate a linear relationship between the Asian black truffle content and the relative amount of characteristic restriction fragments (measuring values are shown in Table S4). It is important to note that a linear correlation could only be observed when the concentration of the characteristic restriction fragment was brought into relation with the total concentration of detected restriction fragments. Otherwise, no linear correlation could be observed. So the total concentration of detected restriction fragments and variations in the measured sample volume were considered.
To test the influences of the truffle matrix on the quantitative evaluation mixtures of fruiting bodies from T. melanosporum, different amounts of T. indicum were prepared. After DNA-isolation, PCR-amplification with the ITS1/ITS4 primer pair, and digestion with CviQI, PCR fragments were analyzed via AGE (results not shown) and CGE. For each matrix mixture, PCR and enzymatic digestion were performed in a fourfold determination. For a quantitative analysis, the detected concentration of the long restriction fragment relative to the total amount of all detected fragments was plotted against the amount of Asian truffle. As can be seen from Figure 4, the relative peak intensity correlates with the T. indicum amount (R2 of 0.959), demonstrating a possible quantitative determination of possible admixtures with Asian black truffles in T. melanosporum samples (measuring values are shown in Table S5). This was comparable with the results of PCR amplicon mixtures. The obtained results show that the CGE assay can be used to determine the amount of admixtures from Asian black truffles in T. melanosporum, e.g., for quality control to ensure the integrity of truffle products.

4. Conclusions

The results achieved in the present work show that the developed real-time PCR assay with species-specific primer and the CGE-methods allows the identification of different commercially relevant truffle species. The applied real-time PCR is suited to detect and quantify admixtures from Asian black truffles in T. melanosporum up to 0.5%. According to our best knowledge, there is no publication to quantify possible admixtures of T. indicum in T. melanosporum neither with real-time PCR nor with other molecular biological methods. The developed CGE-method based on the ITS region—with and without restriction digestion—offers a promising alternative to real-time PCR. The molecular biological methods developed can be used for quality control in the food industry or in official food control to ensure the integrity of truffle products.

Supplementary Materials

The following are available online at https://www.mdpi.com/2304-8158/9/4/501/s1, Table S1: Results of the specificity test of the specific real-time primers, Table S2: Measuring values that were used as the basis for preparing the standard curves for Figures 1, Table S3: Measuring values that were used as the basis for preparing the standard curves for Figures 2, Table S4: Measuring values that were used as the basis for preparing the standard curves for Figures 3, Table S5: Measuring values that were used as the basis for preparing the standard curves for Figures 4, Figure S1: Results from the amplification with the ITS1/4 primer pair, DNA isolated of T. magnatum fruiting bodies, Figure S2: Results from the amplification with the ITS1/4 primer pair, DNA isolated of T. albidum Pico fruiting bodies, Figure S3: Results from the amplification with the ITS1/4 primer pair, DNA isolated of T. aestivum fruiting bodies, Figure S4: Results from the amplification with the ITS1/4 primer pair, DNA isolated of T. brumale fruiting bodies and food truffle products, Figure S5: Results from the amplification with the ITS1/4 primer pair and the RFLP assay with CviQI, DNA isolated of T. melanosporum fruiting bodies, Figure S6: Results from the amplification with the ITS1/4 primer pair and the RFLP assay with CviQI, DNA isolated from T. indicum/himalayense fruiting bodies, Figure S7: CGE-chromatogram, PCR-fragments generated with ITS1/ITS4 primer pair after digestion with CviQI, (A) T. indicum DNA: 130 bp, 498 bp; (B) T. melanosporum: 193 bp, 438 bp.

Author Contributions

Conceptualization, S.S.; methodology, S.S.; validation, S.S. and J.P.; formal analysis, S.S.; investigation, S.S.; resources, M.F.; data curation, S.S., M.S., J.P., and H.-V.T., writing—original draft preparation, S.S.; writing—review and editing, C.L., H.-V.T., and M.F.; visualization, S.S.; supervision, M.F.; project administration, M.F.; funding acquisition, M.F. All authors have read and agreed to the published version of the manuscript.

Funding

This study was performed within the project “Food Profiling-Development of analytical tools for the experimental verification of the origin and identity of food”. This Project (Funding reference number: 2816500914) is supported by means of the Federal Ministry of Food and Agriculture (BMEL) by a decision of the German Bundestag (parliament). Project support is provided by the Federal Institute for Agriculture and Food (BLE) within the scope of the program for promoting innovation.

Acknowledgments

The authors gratefully thank our project partner, “LA BILANCIA Trüffelhandels GmbH”, for providing sample material.

Conflicts of Interest

The authors declare no conflict of interest. The funders had no role in the design of the study; in the collection, analyses, or interpretation of data; in the writing of the manuscript, or in the decision to publish the results.

References

  1. Trappe, J.M.; Molina, R.; Luoma, D.L.; Cázares, E.; Pilz, D.; Smith, J.E.; Castellano, M.A.; Miller, S.L. Diversity, ecology, and conservation of truffle fungi in forests of the Pacific Northwest. 2009. Available online: https://www.fs.fed.us/pnw/pubs/pnw_gtr772.pdf (accessed on 21 March 2020).
  2. Læssøe, T.; Hansen, K. Truffle trouble: What happened to the Tuberales? Mycol. Res. 2007, 111, 1075–1099. [Google Scholar] [CrossRef] [PubMed]
  3. Harley, J.L.; Smith, S.E. Mycorrhizal symbiosis; Academic Press Inc.: Lodon, UK, 1983. [Google Scholar]
  4. Giovannetti, G.; Fontana, A. Mycorrhizal synthesis between Cistaceae and Tuberaceae. New Phytol. 1982, 92, 533–537. [Google Scholar] [CrossRef]
  5. Mello, A.; Fontana, A.; Meotto, F.; Comandini, O.; Bonfante, P. Molecular and morphological characterization of Tuber magnatum mycorrhizas in a long-term survey. Microbiol. Res. 2001, 155, 279–284. [Google Scholar] [CrossRef]
  6. Zambonelli, A.; Iotti, M.; Murat, C. True Truffle (Tuber Spp.) in the World: Soil Ecology, Systematics and Biochemistry; Springer: Cham, Switzerland, 2016. [Google Scholar]
  7. Bougher, N.L.; Lebel, T. Sequestrate (truffle-like) fungi of Australia and New Zealand. Aust. Syst. Bot. 2001, 14, 439–484. [Google Scholar] [CrossRef]
  8. Ceruti, A.; Fontana, A.; Nosenzo, C. Le specie europee del genere Tuber: Una revisione storica; Museo Regionale di Scienze Naturali di Torino: Torino, Italy, 2003. [Google Scholar]
  9. Chevalier, G.; Frochot, H. Ecology and possibility of culture in Europe of the Burgundy truffle (Tuber uncinatum Chatin). Agric. Ecosyst. Environ. 1990, 28, 71–73. [Google Scholar] [CrossRef]
  10. Pegler, D. Useful fungi of the world: Morels and truffles. Mycologist 2003, 17, 174–175. [Google Scholar] [CrossRef]
  11. Marjanovic, Z.; Saljnikov, E.; Milenkovic, M.; Grebenc, T. Ecological features of Tuber magnatum Pico in the conditions of West Balkans–soil characterization. In Proceedings of the 3rd international congress on truffles, Spoleto, Italy, 25–28 November 2008. [Google Scholar]
  12. Lazzari, B.; Gianazza, E.; Viotti, A. Molecular characterization of some truffle species. In Biotechnology of Ectomycorrhizae; Plenum Press: New York, NY, USA, 1995; pp. 161–169. [Google Scholar]
  13. Hall, I.R.; Yun, W.; Amicucci, A. Cultivation of edible ectomycorrhizal mushrooms. Trends Biotechnol. 2003, 21, 433–438. [Google Scholar] [CrossRef]
  14. Mello, A.; Murat, C.; Bonfante, P. Truffles: Much more than a prized and local fungal delicacy. FEMS Microbiol. Lett. 2006, 260, 1–8. [Google Scholar] [CrossRef]
  15. Favre, J.; Parguey Leduc, A.; Sejalon Delmas, N.; Dargent, R.; Kulifaj, M. The ascocarp of Tuber indicum (Chinese truffle) recently introduced in France: Preliminary study. C. r. hebd. séances Acad. sci. Serie 3 Sciences de la Vie (France) 1996, 319, 517–521. [Google Scholar]
  16. Bonito, G.; Trappe, J.M.; Donovan, S.; Vilgalys, R. The Asian black truffle Tuber indicum can form ectomycorrhizas with North American host plants and complete its life cycle in non-native soils. Fungal Ecol. 2011, 4, 83–93. [Google Scholar] [CrossRef]
  17. García-Montero, L.G.; Díaz, P.; Di Massimo, G.; García-Abril, A. A review of research on Chinese Tuber species. Mycol Prog. 2010, 9, 315–335. [Google Scholar] [CrossRef]
  18. Murat, C.; Zampieri, E.; Vizzini, A.; Bonfante, P. Is the Perigord black truffle threatened by an invasive species? We dreaded it and it has happened! New Phytol. 2008, 178, 699–702. [Google Scholar] [CrossRef] [PubMed]
  19. Paolocci, F.; Rubini, A.; Riccioni, C.; Granetti, B.; Arcioni, S. Cloning and characterization of two repeated sequences in the symbiotic fungus Tuber melanosporum Vitt. FEMS Microbiol. Ecol. 2000, 34, 139–146. [Google Scholar] [CrossRef] [PubMed]
  20. Séjalon-Delmas, N.; Roux, C.; Martins, M.; Kulifaj, M.; Bécard, G.; Dargent, R. Molecular tools for the identification of Tuber melanosporum in agroindustry. J. Agric. Food Chem. 2000, 48, 2608–2613. [Google Scholar] [CrossRef] [PubMed]
  21. White, T.J.; Bruns, T.; Lee, S.; Taylor, J. Amplification and direct sequencing of fungal ribosomal RNA genes for phylogenetics. PCR Protoc. Guide Methods Appl. 1990, 18, 315–322. [Google Scholar]
  22. Xu, J. Fungal DNA barcoding. Genome 2016, 59, 913–932. [Google Scholar] [CrossRef] [PubMed] [Green Version]
  23. Schoch, C.L.; Seifert, K.A.; Huhndorf, S.; Robert, V.; Spouge, J.L.; Levesque, C.A.; Chen, W.; Bolchacova, E.; Voigt, K.; Crous, P.W. Nuclear ribosomal internal transcribed spacer (ITS) region as a universal DNA barcode marker for Fungi. Proc. Natl. Acad. Sci. USA 2012, 109, 6241–6246. [Google Scholar] [CrossRef] [Green Version]
  24. Haase, I.; Brüning, P.; Matissek, R.; Fischer, M. Real-time PCR assays for the quantitation of rDNA from apricot and other plant species in marzipan. J. Agric. Food Chem. 2013, 6, 3414–3418. [Google Scholar] [CrossRef]
  25. Johnson, S.M.; Carlson, E.L.; Pappagianis, D. Determination of ribosomal DNA copy number and comparison among strains of Coccidioides. Mycopathologia 2015, 179, 45–51. [Google Scholar] [CrossRef]
  26. López-Calleja, I.M.; de la Cruz, S.; Pegels, N.; González, I.; García, T.; Martín, R. High resolution TaqMan real-time PCR approach to detect hazelnut DNA encoding for ITS rDNA in foods. Food Chem. 2013, 141, 1872–1880. [Google Scholar] [CrossRef]
  27. Bertini, L.; Potenza, L.; Zambonelli, A.; Amicucci, A.; Stocchi, V. Restriction fragment length polymorphism species-specific patterns in the identification of white truffles. FEMS Microbiol. Lett. 1998, 164, 397–401. [Google Scholar] [CrossRef] [PubMed]
  28. Gandeboeuf, D.; Dupre, C.; Chevalier, G.; Nicolas, P.; Roeckel-Drevet, P. Typing Tuber ectomycorrhizae by polymerase chain amplification of the internal transcribed spacer of rDNA and the sequence characterized amplified region markers. Can. J. Microbiol. 1997, 43, 723–728. [Google Scholar] [CrossRef] [PubMed]
  29. Henrion, B.; Chevalier, G.; Martin, F. Typing truffle species by PCR amplification of the ribosomal DNA spacers. Mycol. Res. 1994, 98, 37–43. [Google Scholar] [CrossRef]
  30. Mabru, D.; Dupré, C.; Douet, J.; Leroy, P.; Ravel, C.; Ricard, J.; Medina, B.; Castroviejo, M.; Chevalier, G. Rapid molecular typing method for the reliable detection of Asiatic black truffle (Tuber indicum) in commercialized products: Fruiting bodies and mycorrhizal seedlings. Mycorrhiza. 2001, 11, 89–94. [Google Scholar] [CrossRef]
  31. Murat, C.; Vizzini, A.; Bonfante, P.; Mello, A. Morphological and molecular typing of the below-ground fungal community in a natural Tuber magnatum truffle-ground. FEMS Microbiol. Lett. 2005, 245, 307–313. [Google Scholar] [CrossRef] [PubMed]
  32. Paolocci, F.; Rubini, A.; Granetti, B.; Arcioni, S. Typing Tuber melanosporum and Chinese black truffle species by molecular markers. FEMS Microbiol. Lett. 1997, 153, 255–260. [Google Scholar] [CrossRef]
  33. Paolocci, F.; Rubini, A.; Granetti, B.; Arcioni, S. Rapid molecular approach for a reliable identification of Tuber spp. ectomycorrhizae. FEMS Microbiol. Ecol. 1999, 28, 23–30. [Google Scholar] [CrossRef]
  34. Douet, J.; Castroviejo, M.; Mabru, D.; Chevalier, G.; Dupré, C.; Bergougnoux, F.; Ricard, J.; Médina, B. Rapid molecular typing of Tuber melanosporum, T. brumale and T. indicum from tree seedlings and canned truffles. Anal. Bioanal. Chem. 2004, 379, 668–673. [Google Scholar] [CrossRef]
  35. Gryndler, M.; Trilčová, J.; Hršelová, H.; Streiblová, E.; Gryndlerová, H.; Jansa, J. Tuber aestivum Vittad. mycelium quantified: Advantages and limitations of a qPCR approach. Mycorrhiza 2013, 23, 341–348. [Google Scholar] [CrossRef]
  36. Zampieri, E.; Rizzello, R.; Bonfante, P.; Mello, A. The detection of mating type genes of Tuber melanosporum in productive and non productive soils. Appl Soil Ecol. 2012, 57, 9–15. [Google Scholar] [CrossRef]
  37. Iotti, M.; Leonardi, M.; Lancellotti, E.; Salerni, E.; Oddis, M.; Leonardi, P.; Perini, C.; Pacioni, G.; Zambonelli, A. Spatio-temporal dynamic of Tuber magnatum mycelium in natural truffle grounds. PLoS ONE 2014, 9, e115921. [Google Scholar] [CrossRef] [PubMed] [Green Version]
  38. Salerni, E.; Iotti, M.; Leonardi, P.; Gardin, L.; D’Aguanno, M.; Perini, C.; Pacioni, P.; Zambonelli, A. Effects of soil tillage on Tuber magnatum development in natural truffières. Mycorrhiza 2014, 24, 79–87. [Google Scholar] [CrossRef] [PubMed]
  39. Parladé, J.; De la Varga, H.; De Miguel, A.M.; Sáez, R.; Pera, J. Quantification of extraradical mycelium of Tuber melanosporum in soils from truffle orchards in northern Spain. Mycorrhiza 2013, 23, 99–106. [Google Scholar] [CrossRef] [PubMed]
  40. Rizzello, R.; Zampieri, E.; Vizzini, A.; Autino, A.; Cresti, M.; Bonfante, P.; Mello, A. Authentication of prized white and black truffles in processed products using quantitative real-time PCR. Food Res. Int. 2012, 48, 792–797. [Google Scholar] [CrossRef]
  41. Holland, P.M.; Abramson, R.D.; Watson, R.; Gelfand, D.H. Detection of specific polymerase chain reaction product by utilizing the 5’–3’exonuclease activity of Thermus aquaticus DNA polymerase. Proc. Natl. Acad. Sci. USA 1991, 88, 7276–7280. [Google Scholar] [CrossRef] [Green Version]
  42. Haunshi, S.; Pattanayak, A.; Bandyopadhaya, S.; Saxena, S.C.; Bujarbaruah, K.M. A simple and quick DNA extraction procedure for rapid diagnosis of sex of chicken and chicken embryos. J. Poult. Sci. 2008, 45, 75–81. [Google Scholar] [CrossRef]
  43. Bruüning, P.; Haase, I.; Matissek, R.; Fischer, M. Marzipan: Polymerase chain reaction-driven methods for authenticity control. J. Agric. Food Chem. 2011, 59, 11910–11917. [Google Scholar] [CrossRef] [PubMed]
  44. Debode, F.; Marien, A.; Janssen, É.; Bragard, C.; Berben, G. Influence of the amplicon length on real-time PCR results. Biotechnol., Agron., Soc. Environ. 2017, 21, 3–11. [Google Scholar]
  45. Cankar, K.; Štebih, D.; Dreo, T.; Žel, J.; Gruden, K. Critical points of DNA quantification by real-time PCR–effects of DNA extraction method and sample matrix on quantification of genetically modified organisms. BMC Biotechnol. 2006, 6, 37. [Google Scholar] [CrossRef] [Green Version]
  46. Paolocci, F.; Rubini, A.; Riccioni, C.; Topini, F.; Arcioni, S. Tuber aestivum and Tuber uncinatum: Two morphotypes or two species? FEMS Microbiol. Lett. 2004, 235, 109–115. [Google Scholar] [CrossRef] [PubMed]
  47. Paolocci, F.; Angelini, P.; Cristofari, E.; Granetti, B.; Arcioni, S. Identification of Tuber spp and corresponding ectomycorrhizae through molecular markers. J. Agric. Food Chem. 1995, 69, 511–517. [Google Scholar] [CrossRef]
  48. Bonito, G.M.; Gryganskyi, A.P.; Trappe, J.M.; Vilgalys, R. A global meta-analysis of Tuber ITS rDNA sequences: Species diversity, host associations and long-distance dispersal. Mol. Ecol. 2010, 19, 4994–5008. [Google Scholar] [CrossRef] [PubMed]
  49. Roux, C.; Séjalon-Delmas, N.; Martins, M.; Parguey-Leduc, A.; Dargent, R.; Bécard, G. Phylogenetic relationships between European and Chinese truffles based on parsimony and distance analysis of ITS sequences. FEMS Microbiol. Lett. 1999, 180, 147–155. [Google Scholar] [CrossRef] [PubMed]
  50. Qiao, P.; Tian, W.; Liu, P.; Yu, F.; Chen, J.; Deng, X.; Wan, S.; Wang, R.; Wang, Y.; Guo, H. Phylogeography and population genetic analyses reveal the speciation of the Tuber indicum complex. Fungal Genet. Biol. 2018, 113, 14–23. [Google Scholar] [CrossRef] [PubMed]
Figure 1. Standard curve of real-time PCR of DNA-mixtures from T. melanosporum with T. indicum with 0.5%, 1%, 5%, 10%, 20%, 40%, 70% T. indicum DNA and standard curve of matrix-mixtures from T. melanosporum with T. indicum with 4.3%, 7.4%, 13.5%, 20.4, 32.2% T. indicum. Each DNA-mixture was analyzed in duplicate and each matrix mixture in triplicate to real-time PCR with the primer pair specific to T. indicum. The Cq values are plotted against the logarithm of T. indicum amount.
Foods 09 00501 g001
Figure 2. Standard curve of PCR-amplicon mixtures from T. indicum with T. aestivum and T. albidum Pico with T. magnatum with 5%, 20%, 40%, 80% T. indicum/albidum Pico and standard curve of DNA mixtures from T. albidum Pico with T. magnatum with 5%, 20%, 40%, 80% T. albidum Pico. The detected relative areas of PCR-amplicons are plotted against T. indicum or T. albidum Pico amount.
Foods 09 00501 g002
Figure 3. Standard curve of PCR-amplicon mixtures digested with CviQI from T. melanosporum with Asian black truffles added to 50%, 40%, and 20%. The concentration of the long restriction fragment of Asian truffles (500 bp) relative to the total concentration of restriction fragments is plotted against Asian truffle amount.
Foods 09 00501 g003
Figure 4. Standard curve of matrix mixtures from fruiting bodies of T. melanosporum with Asian black truffles with 11.2%, 21.7%, 28.3%, 47.5% Asian truffle. The concentration of the long restriction fragment (ITS1/ITS4 PCR amplicon digested with CviQI) of Asian truffles (500 bp) relative to the total concentration of restriction fragments is plotted against Asian truffle amount.
Foods 09 00501 g004
Table 1. Sample material used in this study.
Tuber SpeciesGeographical OriginFruiting Bodies Analyzed
Numbers with Regard to the OriginTotal Number
T. albidum PicoItaly55
T. indicumChina55
T. himalayenseDali, Yunnan, China2020
T. brumaleSarrion, Teruel, Spain22
T. melanosporumMarche, Italy2
France1
Australia2
Sarrion, Teruel, Spain8
Castello, Valencia, Spain6
unknown120
T. magnatumRomagna, Italy2
Buzet, Croatia1
Turin, Piemonte, Italy1
Italy5
L’Aquila, Abruzzo, Italy1
Perugia, Umbria, Italy1
Rome, Lazio, Italy1
Naples, Campania, Italy1
Ancona, Marche, Italy1
Campobasso, Molise, Italy115
T. aestivumunknown19
Romania15
Italy11
Hungary3
Toscana, Florence, Italy250
Processed food containing truffle:
T. melanosporum fruiting bodies canned in saltwater6
salt with dried T. aestivum 1
T. brumale chopped and cooked in sherry port wine stock1
Table 2. Primer and probe sequences and size of PCR products.
Primer/ProbesNameSequence 5′–3′Product Size (bp)
specific for T. melanosporumPrimer
Mela-fw
Mela-rv
Probe
ACGACGGACTTTATAAACGGTTATAA
AGCGGGTATCCCTCCCTGATT
Cy5–GACCTGGATCAGTCACAAGTCTTGTCTGGT-BHQ2
141
specific for
T. indicum/
T. himalayense
Primer
Indi-fw
ITS4LNG *
Probe
AACAACAGACTTTGTAAAGGGTT
TGATATGCTTAAGTTCAGCGGG
HEX-GGACCTAGATCAGTCACAAGTCATGTCTGG-BHQ2
146
fw = forward; rv = reverse, * Paolocci, et al. (1997) [32]

