What Drives Customer Satisfaction, Loyalty, and Happiness in Fast-Food Restaurants in China? Perceived Price, Service Quality, Food Quality, Physical Environment Quality, and the Moderating Role of Gender

Abstract
1. Introduction
2. Literature Review and Hypotheses
2.1. The Effect of Perceived Price, Food, Service, and Physical Environment Quality on Customer Satisfaction
2.2. The Effect of Perceived Price on Food, Service, and Physical Environment Quality
2.3. Customer Satisfaction, Loyalty, and Happiness
2.4. Gender Differences
2.4.1. Perceived Price, Restaurant Quality Dimensions, and Gender
2.4.2. Satisfaction, Loyalty, Happiness, and Gender
3. Methodology
3.1. Questionnaire
3.2. Data Collection
4. Analysis and Results
4.1. Exploratory Factor Analysis
4.2. SEM Model Analysis
4.3. Hypotheses Test Results
4.4. Moderating Effects of Gender
4.5. Happiness Mediation Test
5. Discussions and Conclusions
5.1. Discussions and Theoretical Implications
5.2. Managerial Implications
5.3. Limitations and Future Research
Author Contributions
Funding
Conflicts of Interest
References
- Zhuang, K.; Jiang, Y. An analysis of the development of the Chinese fast food industry. J. Asian Bus. Strategy 2016, 6, 85. [Google Scholar] [CrossRef]
- Shoemaker, S.; Dawson, M.; Johnson, W. How to increase menu prices without alienating your customers. Int. J. Contemp. Hosp. Manag. 2005, 17, 553–568. [Google Scholar] [CrossRef]
- Varki, S.; Colgate, M. The role of price perceptions in an integrated model of behavioral intentions. J. Serv. Res. 2001, 3, 232–240. [Google Scholar] [CrossRef]
- Ryu, K.; Han, H. Influence of the quality of food, service, and physical environment on customer satisfaction and behavioral intention in quick-casual restaurants: Moderating role of perceived price. J. Hosp. Tour. Res. 2010, 34, 310–329. [Google Scholar] [CrossRef]
- Ryu, K.; Lee, H.R.; Kim, W.G. The influence of the quality of the physical environment, food, and service on restaurant image, customer perceived value, customer satisfaction, and behavioral intentions. Int. J. Contemp. Hosp. Manag. 2012, 24, 200–223. [Google Scholar] [CrossRef]
- Ma, E.; Qu, H.; Eliwa, R.A. Customer loyalty with fine dining: The moderating role of gender. J. Hosp. Mark. Manag. 2014, 23, 513–535. [Google Scholar] [CrossRef]
- Lysonski, S. Receptivity of young Chinese to American and global brands: Psychological underpinnings. J. Consum. Mark. 2014, 31, 250–262. [Google Scholar] [CrossRef]
- Alexander, M.W. Customer delight: A review. Acad. Mark. Stud. J. 2010, 14, 39. [Google Scholar]
- Gong, T.; Yi, Y. The effect of service quality on customer satisfaction, loyalty, and happiness in five Asian countries. Psychol. Mark. 2018, 35, 427–442. [Google Scholar] [CrossRef]
- Sheehan, K.B. An investigation of gender differences in on-line privacy concerns and resultant behaviors. J. Interact. Mark. 1999, 13, 24–38. [Google Scholar] [CrossRef]
- World Bank. Available online: https://www.worldbank.org/ (accessed on 5 January 2020).
- Mitchell, V.W.; Vassos, V. Perceived risk and risk reduction in holiday purchases: A cross-cultural and gender analysis. J. Euromark. 1998, 6, 47–79. [Google Scholar] [CrossRef]
- Mokhlis, S. The influence of service quality on satisfaction: A gender comparison. Public Adm. Res. 2012, 1, 103. [Google Scholar] [CrossRef]
- Kotler, P.; Armstrong, G. Principles of Marketing; Pearson Education: Harlow, UK, 2010. [Google Scholar]
- Al-Msallam, S. Customer satisfaction and brand loyalty in the hotel industry. Int. J. Manag. Sci. Bus. Res. 2015, 4, 232–251. [Google Scholar]
- Campbell, M.C. Perceptions of price unfairness: Antecedents and consequences. J. Mark. Res. 1999, 36, 187–199. [Google Scholar] [CrossRef]
- Rothenberger, S. Fairness through transparency: The influence of price transparency on consumer perceptions of price fairness. Work. Pap. CEB 2015, 15, 1–37. [Google Scholar]
- Hanaysha, J. Testing the effects of food quality, price fairness, and physical environment on customer satisfaction in fast food restaurant industry. J. Asian Bus. Strategy 2016, 6, 31–40. [Google Scholar] [CrossRef]
- Gagić, S.; Tešanović, D.; Jovičić, A. The vital components of restaurant quality that affect guest satisfaction. Turizam 2013, 17, 166–176. [Google Scholar] [CrossRef]
- Abdullah, D.; Hamir, N.; Nor, N.M.; Krishnaswamy, J.; Rostum, A.M.M. Food quality, service quality, price fairness and restaurant re-patronage intention: The mediating role of customer satisfaction. Int. J. Acad. Res. Bus. Soc. Sci. 2018, 8, 211–226. [Google Scholar]
- Qin, H.; Prybutok, V.R. Service quality, customer satisfaction, and behavioral intentions in fast-food restaurants. Int. J. Qual. Serv. Sci. 2009, 1, 78–95. [Google Scholar] [CrossRef]
- Altamore, L.; Ingrassia, M.; Chironi, S.; Columba, P.; Sortino, G.; Vukadin, A.; Bacarella, S. Pasta experience: Eating with the five senses-A pilot study. AIMS Agric. Food 2018, 3, 493–520. [Google Scholar]
- Oliver, R.L. A cognitive model of the antecedents and consequences of satisfaction decisions. J. Mark. Res. 1980, 17, 460–469. [Google Scholar] [CrossRef]
- Zhao, J.; Huddleston, P. Antecedents of specialty food store loyalty. Int. Rev. Retail Distrib. Consum. Res. 2012, 22, 171–187. [Google Scholar] [CrossRef]
- Brunner, T.A.; Stöcklin, M.; Opwis, K. Satisfaction, image and loyalty: New versus experienced customers. Eur. J. Mark. 2008, 42, 1095–1105. [Google Scholar] [CrossRef]
- Booms, B.H.; Bitner, M.J. Marketing services by managing the environment. Cornell Hotel Restaur. Adm. Q. 1982, 23, 35–40. [Google Scholar] [CrossRef]
- Jang, S.S.; Namkung, Y. Perceived quality, emotions, and behavioral intentions: Application of an extended Mehrabian–Russell model to restaurants. J. Bus. Res. 2009, 62, 451–460. [Google Scholar] [CrossRef]
- Lim, H. Understanding American Customer Perceptions on Japanese Food and Services in the US. Master’s Thesis, University of Nevada, Las Vegas, NV, USA, 2010. [Google Scholar]
- Zeithaml, V.A. Consumer perceptions of price, quality, and value: A means-end model and synthesis of evidence. J. Mark. 1988, 52, 2–22. [Google Scholar] [CrossRef]
- Ryu, K. Dinescape, Emotions, and Behavioral Intentions in Upscale Restaurants. Ph.D Thesis, Kansas State University, Manhattan, KS, USA, 2005. [Google Scholar]
- Jani, D.; Han, H. Investigating the key factors affecting behavioral intentions. Int. J. Contemp. Hosp. Manag. 2011, 23, 1000–1018. [Google Scholar] [CrossRef]
- Yi, S.; Zhao, J.; Joung, H.-W. Influence of price and brand image on restaurant customers’ restaurant selection attribute. J. Foodserv. Bus. Res. 2018, 21, 200–217. [Google Scholar] [CrossRef]
- Chen, I.J.; Gupta, A.; Rom, W. A study of price and quality in service operations. Int. J. Serv. Ind. Manag. 1994, 5, 23–33. [Google Scholar] [CrossRef]
- Khadka, K.; Maharjan, S. Customer satisfaction and customer loyalty. Master’s Thesis, Centria University of Applied Sciences, Business Management, Lahti, Finland, 2017. [Google Scholar]
- Bennett, R.; Rundle-Thiele, S. Customer satisfaction should not be the only goal. J. Serv. Mark. 2004, 18, 514–523. [Google Scholar] [CrossRef]
- Dick, A.S.; Basu, K. Customer loyalty: Toward an integrated conceptual framework. J. Acad. Mark. Sci. 1994, 22, 99–113. [Google Scholar] [CrossRef]
- Bowen, J.T.; Chen, S.L. The relationship between customer loyalty and customer satisfaction. Int. J. Contemp. Hosp. Manag. 2001, 13, 213–217. [Google Scholar] [CrossRef]
- Anderson, E.W.; Sullivan, M.W. The antecedents and consequences of customer satisfaction for firms. Mark. Sci. 1993, 12, 125–143. [Google Scholar] [CrossRef]
- Lee, C.W.; Lee, S.H. The relation among consumption values of luxury brands, brand identification brand attachment, consumer happiness and self-construal. J. Distrib. Manag. Res. 2013, 16, 29–42. [Google Scholar]
- Sirgy, M.J.; Samli, A.C.; Meadow, H.L. The interface between quality of life and marketing: A theoretical framework. J. Mark. Public Policy 1982, 1, 69–84. [Google Scholar] [CrossRef]
- Sweeney, J.C.; Danaher, T.S.; McColl-Kennedy, J.R. Customer effort in value cocreation activities: Improving quality of life and behavioral intentions of health care customers. J. Serv. Res. 2015, 18, 318–335. [Google Scholar] [CrossRef]
- Shrum, L.; Lowrey, T.M.; Pandelaere, M.; Ruvio, A.A.; Gentina, E.; Furchheim, P.; Herbert, M.; Hudders, L.; Lens, I.; Mandel, N. Materialism: The good, the bad, and the ugly. J. Mark. Manag. 2014, 30, 1858–1881. [Google Scholar] [CrossRef]
- Nicolao, L.; Irwin, J.R.; Goodman, J.K. Happiness for sale: Do experiential purchases make consumers happier than material purchases? J. Consum. Res. 2009, 36, 188–198. [Google Scholar] [CrossRef]
- Fiske, S.T.; Stevens, L.E. What’s so Special about Sex? Gender Stereotyping and Discrimination; Sage Publications, Inc: Thousand Oaks, CA, USA, 1993. [Google Scholar]
- Hoffman, C.; Hurst, N. Gender stereotypes: Perception or rationalization? J. Personal. Soc. Psychol. 1990, 58, 197. [Google Scholar] [CrossRef]
- Argyle, M.; Henderson, M. The rules of friendship. J. Soc. Pers. Relatsh. 1984, 1, 211–237. [Google Scholar] [CrossRef]
- Noble, S.M.; Griffith, D.A.; Adjei, M.T. Drivers of local merchant loyalty: Understanding the influence of gender and shopping motives. J. Retail. 2006, 82, 177–188. [Google Scholar] [CrossRef]
- Blanck, H.M.; Gillespie, C.; Kimmons, J.E.; Seymour, J.D.; Serdula, M.K. Trends in fruit and vegetable consumption among US men and women, 1994–2005. Prev. Chronic Dis. 2008, 5, A35. [Google Scholar] [PubMed]
- Liebman, M.; Cameron, B.; Carson, D.; Brown, D.; Meyer, S. Dietary fat reduction behaviors in college students: Relationship to dieting status, gender and key psychosocial variables. Appetite 2001, 36, 51–56. [Google Scholar] [CrossRef] [PubMed]
- Snipes, R.L.; Thomson, N.F.; Oswald, S.L. Gender bias in customer evaluations of service quality: An empirical investigation. J. Serv. Mark. 2006, 20, 274–284. [Google Scholar] [CrossRef]
- Beldona, S.; Namasivayam, K. Gender and demand-based pricing: Differences in perceived (un) fairness and repatronage intentions. J. Hosp. Leis. Mark. 2006, 14, 89–107. [Google Scholar] [CrossRef]
- Adams, J.S. Inequity in social exchange. In Advances in Experimental Social Psychology; Elsevier: Amsterdam, The Netherlands, 1965; Volume 2, pp. 267–299. [Google Scholar]
- Lee, C.; Farh, J.L. The effects of gender in organizational justice perception. J. Organ. Behav. 1999, 20, 133–143. [Google Scholar] [CrossRef]
- Rocha, M.A.V.; Hammond, L.; Hawkins, D. Age, gender and national factors in fashion consumption. J. Fash. Mark. Manag. Int. J. 2005, 9, 380–390. [Google Scholar] [CrossRef]
- Ma, E.; Qu, H.; Njite, D. US customer perceptions toward Chinese restaurant service quality: An importance and performance approach. J. Foodserv. Bus. Res. 2011, 14, 290–308. [Google Scholar] [CrossRef]
- Qu, H. Determinant factors and choice intention for Chinese restaurant dining: A multivariate approach. J. Restaur. Foodserv. Mark. 1997, 2, 35–49. [Google Scholar] [CrossRef]
- Buda, R.; Sengupta, K.; Elsayed-Elkhouly, S. Employee and organizational perspectives of service quality: A cross-cultural Study in Kuwait, United States and Saudi Arabia. Int. J. Manag. 2006, 23, 430. [Google Scholar]
- Holbrook, M.B. Aims, concepts, and methods for the representation of individual differences in esthetic responses to design features. J. Consum. Res. 1986, 13, 337–347. [Google Scholar] [CrossRef]
- Devi Juwaheer, T. Gender bias in hotel guests’ perceptions of service quality: An empirical investigation of hotels in Mauritius. E-Rev. Tour. Res. 2011, 9, 164–189. [Google Scholar]
- Wilson, A.; Zeithaml, V.; Bitner, M.J.; Gremler, D. Services Marketing: Integrating Customer Focus Across the Firm; McGraw-Hill Education: London, UK, 2016. [Google Scholar]
- Peter, J.P.; Olson, J.C.; Grunert, K.G. Consumer Behaviour and Marketing Strategy; McGraw-Hill: London, UK, 1999. [Google Scholar]
- Ndhlovu, J.; Senguder, T. Gender and perception of service quality in the hotel industry. J. Am. Acad. Bus. 2002, 1, 301–307. [Google Scholar]
- Data Collection Methodology for the American Customer Satisfaction Index (ASCI): For the International Conference on Survey Measurement and Process Quality; Bristol, United Kingdom. 3 April 1995. Available online: http://xueshu.baidu.com/usercenter/paper/show?paperid=eed9e6507ee3fc7a5341ee36d4411232&site=xueshu_se (accessed on 8 April 1995).
- Carlson, R. Understanding women: Implications for personality theory and research. J. Soc. Iss. 1972, 28, 17–32. [Google Scholar] [CrossRef]
- Omar, M.S.; Ariffin, H.F.; Ahmad, R. Service quality, customers’ satisfaction and the moderating effects of gender: A study of Arabic restaurants. Procedia-Soc. Behav. Sci. 2016, 224, 384–392. [Google Scholar] [CrossRef]
- Han, H.; Ryu, K. Moderating role of personal characteristics in forming restaurant customers’ behavioral intentions: An upscale restaurant setting. J. Hosp. Leis. Mark. 2007, 15, 25–54. [Google Scholar] [CrossRef]
- Chui, W.H.; Wong, M.Y. Gender differences in happiness and life satisfaction among adolescents in Hong Kong: Relationships and self-concept. Soc. Indic. Res. 2016, 125, 1035–1051. [Google Scholar] [CrossRef]
- Kasiri, L.A.; Cheng, K.T.G.; Sambasivan, M.; Sidin, S.M. Integration of standardization and customization: Impact on service quality, customer satisfaction, and loyalty. J. Retail. Consum. Serv. 2017, 35, 91–97. [Google Scholar] [CrossRef]
- Hanaysha, J. Restaurant location and price fairness as key determinants of brand equity: A study on fast food restaurant industry. Bus. Econ. Res. 2016, 6, 310–323. [Google Scholar] [CrossRef]
- Han, H.; Kim, W. Outcomes of relational benefits: Restaurant customers’ perspective. J. Travel Tour. Mark. 2009, 26, 820–835. [Google Scholar] [CrossRef]
- Gefen, D.; Straub, D.; Boudreau, M.-C. Structural equation modeling and regression: Guidelines for research practice. Commun. Assoc. Inf. Syst. 2000, 4, 7. [Google Scholar] [CrossRef]
- Henseler, J. PLS-MGA: A non-parametric approach to partial least squares-based multi-group analysis. In Challenges at the Interface of Data Analysis, Computer Science, and Optimization; Springer: Berlin/Heidelberg, Germany, 2012; pp. 495–501. [Google Scholar]
- Kroonenberg, P.M. Latent variable path modeling with partial least squares. J. Am. Stat. Assoc. 1990, 85, 909–911. [Google Scholar] [CrossRef]
- Hair, J.F.; Sarstedt, M.; Pieper, T.M.; Ringle, C.M. The use of partial least squares structural equation modeling in strategic management research: A review of past practices and recommendations for future applications. Long Range Plan. 2012, 45, 320–340. [Google Scholar] [CrossRef]
- Chung, N.; Kwon, S.J. Effect of trust level on mobile banking satisfaction: A multi-group analysis of information system success instruments. Behav. Inf. Technol. 2009, 28, 549–562. [Google Scholar] [CrossRef]
- Henseler, J.; Ringle, C.M.; Sarstedt, M. Using partial least squares path modeling in advertising research: Basic concepts and recent issues. In Handbook of Research on International Advertising; Edward Elgar Publishing: Cheltenham, UK, 2012; Volume 252. [Google Scholar]
- Müller, J.M.; Kiel, D.; Voigt, K.-I. What drives the implementation of Industry 4.0? The role of opportunities and challenges in the context of sustainability. Sustainability 2018, 10, 247. [Google Scholar] [CrossRef]
- Pérez-Villarreal, H.H.; Martínez-Ruiz, M.P.; Izquierdo-Yusta, A. Testing Model of Purchase Intention for Fast Food in Mexico: How do Consumers React to Food Values, Positive Anticipated Emotions, Attitude toward the Brand, and Attitude toward Eating Hamburgers? Foods 2019, 8, 369. [Google Scholar] [CrossRef]
- Chin, W.W.; Marcolin, B.L.; Newsted, P.R. A partial least squares latent variable modeling approach for measuring interaction effects: Results from a Monte Carlo simulation study and an electronic-mail emotion/adoption study. Inf. Syst. Res. 2003, 14, 189–217. [Google Scholar] [CrossRef]
- Fornell, C.; Bookstein, F.L. Two structural equation models: LISREL and PLS applied to consumer exit-voice theory. J. Mark. Res. 1982, 19, 440–452. [Google Scholar] [CrossRef]
- Hair, J.F., Jr.; Hult, G.T.M.; Ringle, C.; Sarstedt, M. A Primer on Partial Least Squares Structural Equation Modeling (PLS-SEM); Sage Publications: Thousand Oaks, CA, USA, 2016. [Google Scholar]
- Maroco, A.; Maroco, J. Service Quality, customer Satisfaction and Loyalty. Eur. J. Tour. Hosp. Recreat. 2013, 4, 119–145. [Google Scholar]
- Hu, L.; Bentler, P.M. Cutoff criteria for fit indexes in covariance structure analysis: Conventional criteria versus new alternatives. Struct. Equ. Model. Multidiscip. J. 1999, 6, 1–55. [Google Scholar] [CrossRef]
- Bentler, P.M.; Bonett, D.G. Significance tests and goodness of fit in the analysis of covariance structures. Psychol. Bull. 1980, 88, 588. [Google Scholar] [CrossRef]
- Hair, J.F.; Black, W.C.; Babin, B.J.; Anderson, R.E.; Tatham, R.L. Multivariate Data Analysis (Vol. 6); Pearson Prentice Hall: Upper Saddle River, NJ, USA, 2006. [Google Scholar]
- Werts, C.E.; Linn, R.L.; Jöreskog, K.G. Intraclass reliability estimates: Testing structural assumptions. Educ. Psychol. Meas. 1974, 34, 25–33. [Google Scholar] [CrossRef]
- Thompson, R.; Barclay, D.; Higgins, C.A. The partial least squares approach to causal modeling: Personal computer adoption and use as an illustration. Technol. Stud. Spec. Issue Res. Methodol. 1995, 2, 284–324. [Google Scholar]
- Bagozzi, R.P.; Yi, Y. On the evaluation of structural equation models. J. Acad. Mark. Sci. 1988, 16, 74–94. [Google Scholar] [CrossRef]
- Fornell, C.; Larcker, D.F. Evaluating structural equation models with unobservable variables and measurement error. J. Mark. Res. 1981, 18, 39–50. [Google Scholar] [CrossRef]
- Cognitive and Affective Antecedents of and Behavioral Intentions Connected to Delight, Satisfaction, Dissatisfaction, and Outrage in the Dutch Academic Education Market. Available online: http://arno.unimaas.nl/show.cgi (accessed on 1 January 2020).


| Variable | Observed Variables | Items | Source |
|---|---|---|---|
| Perceived Price (PP) | PP1 | The price of the fast food is reasonable. | Adapted from [18,69,70] |
| PP2 | Based on the food, the price here is fair. | ||
| PP3 | The price of the fast food is affordable. | ||
| Food Quality (FQ) | FQ1 | The food smells good. | Adapted from [5,18] |
| FQ2 | The food is delicious. | ||
| FQ3 | The food is fresh. | ||
| FQ4 | The food looks attractive to me. | ||
| Service Quality (SQ) | SQ1 | Staff members are friendly. | Adapted from [5,21] |
| SQ2 | Staff members are very helpful. | ||
| SQ3 | Staff members serve quickly and promptly. | ||
| SQ4 | I feel comfortable with staff members’ service. | ||
| Physical Environment Quality (PQ) | PQ2 | The restaurant environment is clean. | Adapted from [5,18] |
| PQ3 | The lighting in the restaurant is comfortable. | ||
| PQ4 | The temperature in the restaurant is comfortable. | ||
| Satisfaction (SA) | SA1 | The overall experience of this fast-food restaurant is satisfying. | Adapted from [5,18] |
| SA2 | I think my decision to visit this restaurant was a wise one. | ||
| SA3 | This restaurant meets most of my expectations. | ||
| Loyalty (LY) | LY1 | I will continue to visit this restaurant. | Adapted from [5,9] |
| LY2 | I will recommend this restaurant to others. | ||
| LY3 | I will say positive things about this restaurant to others. | ||
| Happiness (HA) | HA1 | I think visiting this fast-food restaurant will contribute to customer happiness. | Adapted from [9] |
| HA2 | By visiting this restaurant, customers’ quality of life will be improved. | ||
| HA3 | This restaurant provides a happy and enjoyable dining experience for my family and friends. | Self-developed |
| Variable | Frequency | Percent % | |
|---|---|---|---|
| Gender | Male | 126 | 41.3 |
| Female | 179 | 58.7 | |
| Age | 20 and under | 40 | 13.1 |
| 21–30 | 192 | 63.0 | |
| 31–40 | 62 | 20.3 | |
| 41–50 | 10 | 3.3 | |
| above 50 | 1 | 0.3 | |
| Education | below high school | 13 | 4.3 |
| high school/vocational school/technical school | 31 | 10.2 | |
| junior college | 39 | 12.8 | |
| undergraduate | 155 | 50.8 | |
| graduate and above | 67 | 22.0 | |
| Frequency of Visiting Fast-Food Restaurants | 1–2 times every 6 months | 63 | 20.6 |
| 2 times every 3 months | 40 | 13.1 | |
| once a month | 58 | 19.0 | |
| 2–3 times a month | 80 | 26.2 | |
| 1–3 times a week | 49 | 16.1 | |
| more than 3 times a week | 15 | 4.9 | |
| Monthly Income | less or equal to 1000 RMB | 29 | 9.5 |
| 1001–1500 RMB | 32 | 10.5 | |
| 1501–2000 RMB | 30 | 9.8 | |
| 2001–3000 RMB | 21 | 6.9 | |
| 3001–5000 RMB | 72 | 23.6 | |
| 5001–8000 RMB | 74 | 24.3 | |
| more than 8000 RMB | 47 | 15.4 | |
| total | 305 | 100.0 | |
| KMO and Bartlett’s Test | |||
|---|---|---|---|
| KMO Measure of Sampling Adequacy | Bartlett’s Test of Sphericity | ||
| 0.944 | Approx. Chi-Square | Df | Sig. |
| 4095.278 | 253 | 0.000 | |
| Rotated Component Matrix a | |||||||
|---|---|---|---|---|---|---|---|
| Component | |||||||
| 1 | 2 | 3 | 4 | 5 | 6 | 7 | |
| SQ1 | 0.782 | ||||||
| SQ3 | 0.757 | ||||||
| SQ2 | 0.683 | ||||||
| SQ4 | 0.682 | ||||||
| PP1 | 0.828 | ||||||
| PP2 | 0.816 | ||||||
| PP3 | 0.788 | ||||||
| FQ1 | 0.761 | ||||||
| FQ4 | 0.707 | ||||||
| FQ2 | 0.682 | ||||||
| FQ3 | 0.546 | ||||||
| HA2 | 0.782 | ||||||
| HA3 | 0.666 | ||||||
| HA1 | 0.657 | ||||||
| PQ3 | 0.757 | ||||||
| PQ4 | 0.741 | ||||||
| PQ2 | 0.721 | ||||||
| LY1 | 0.752 | ||||||
| LY4 | 0.630 | ||||||
| LY2 | 0.610 | ||||||
| SA4 | 0.663 | ||||||
| SA2 | 0.661 | ||||||
| SA1 | 0.639 | ||||||
| Extraction Method: Principal Component Analysis. Rotation Method: Equamax with Kaiser Normalization. | |||||||
| Variables | Outer Loadings (CFA) | Cronbach’s Alpha | rho_A | Composite Reliability | Average Variance Extracted (AVE) | |
|---|---|---|---|---|---|---|
| perceived price | PP1 | 0.868 | 0.852 | 0.853 | 0.91 | 0.771 |
| PP2 | 0.884 | |||||
| PP3 | 0.883 | |||||
| food quality | FQ1 | 0.827 | 0.85 | 0.85 | 0.899 | 0.69 |
| FQ2 | 0.863 | |||||
| FQ3 | 0.799 | |||||
| FQ4 | 0.832 | |||||
| service quality | SQ1 | 0.804 | 0.846 | 0.851 | 0.896 | 0.684 |
| SQ2 | 0.849 | |||||
| SQ3 | 0.821 | |||||
| SQ4 | 0.832 | |||||
| physical environment quality | PQ2 | 0.844 | 0.791 | 0.793 | 0.878 | 0.706 |
| PQ3 | 0.861 | |||||
| PQ4 | 0.815 | |||||
| satisfaction | SA1 | 0.859 | 0.822 | 0.824 | 0.894 | 0.738 |
| SA2 | 0.882 | |||||
| SA4 | 0.835 | |||||
| loyalty | LY1 | 0.835 | 0.825 | 0.826 | 0.895 | 0.741 |
| LY2 | 0.884 | |||||
| LY4 | 0.862 | |||||
| happiness | HA1 | 0.876 | 0.854 | 0.855 | 0.911 | 0.774 |
| HA2 | 0.880 | |||||
| HA3 | 0.885 | |||||
| FQ | HA | LY | PP | PQ | SA | SQ | |
|---|---|---|---|---|---|---|---|
| food quality | 0.831 | ||||||
| happiness | 0.615 | 0.88 | |||||
| loyalty | 0.591 | 0.696 | 0.861 | ||||
| perceived price | 0.525 | 0.513 | 0.458 | 0.878 | |||
| physical environment quality | 0.594 | 0.533 | 0.539 | 0.365 | 0.84 | ||
| satisfaction | 0.669 | 0.692 | 0.71 | 0.546 | 0.613 | 0.859 | |
| service quality | 0.609 | 0.51 | 0.544 | 0.411 | 0.506 | 0.566 | 0.827 |
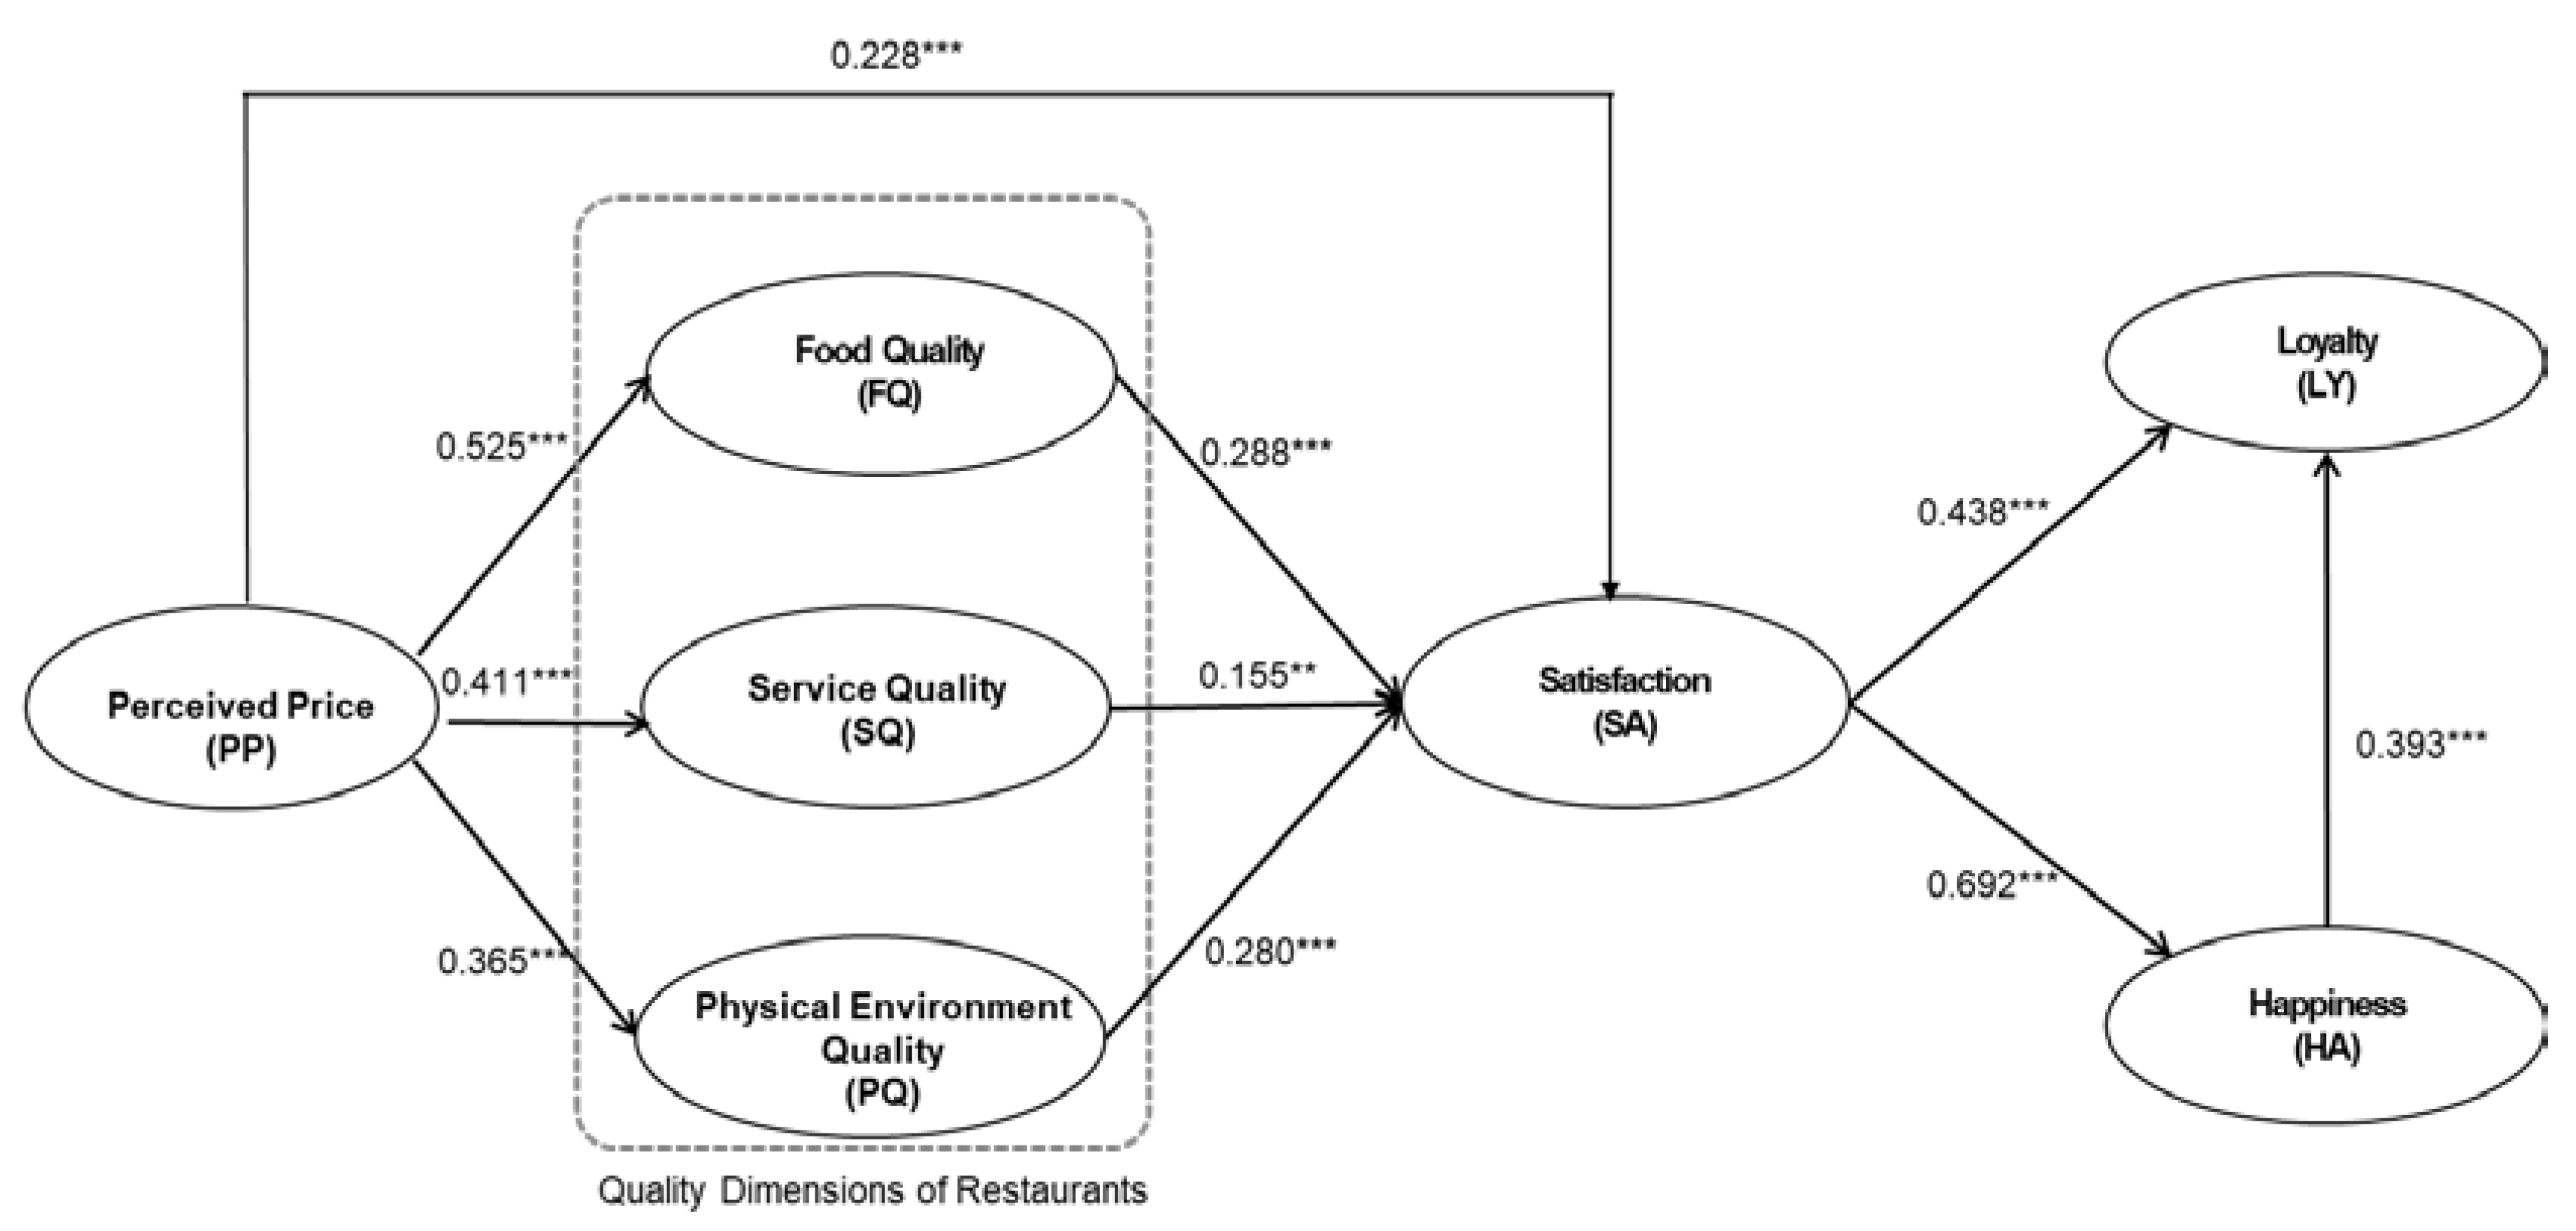
| Hypotheses | β | STDEV | T Statistics | p Values | Result | |
|---|---|---|---|---|---|---|
| H1 | perceived price → satisfaction | 0.228 | 0.054 | 4.255 | 0.000 | accepted |
| H2 | food quality → satisfaction | 0.288 | 0.068 | 4.253 | 0.000 | accepted |
| H3 | service quality → satisfaction | 0.155 | 0.058 | 2.663 | 0.008 | accepted |
| H4 | physical environment quality → satisfaction | 0.280 | 0.054 | 5.209 | 0.000 | accepted |
| H5 | perceived price → food quality | 0.525 | 0.052 | 10.037 | 0.000 | accepted |
| H6 | perceived price → service quality | 0.411 | 0.053 | 7.809 | 0.000 | accepted |
| H7 | perceived price → physical environment quality | 0.365 | 0.046 | 7.942 | 0.000 | accepted |
| H8 | satisfaction → loyalty | 0.438 | 0.061 | 7.178 | 0.000 | accepted |
| H9 | satisfaction → happiness | 0.692 | 0.03 | 23.138 | 0.000 | accepted |
| H10 | happiness → loyalty | 0.393 | 0.065 | 6.063 | 0.000 | accepted |
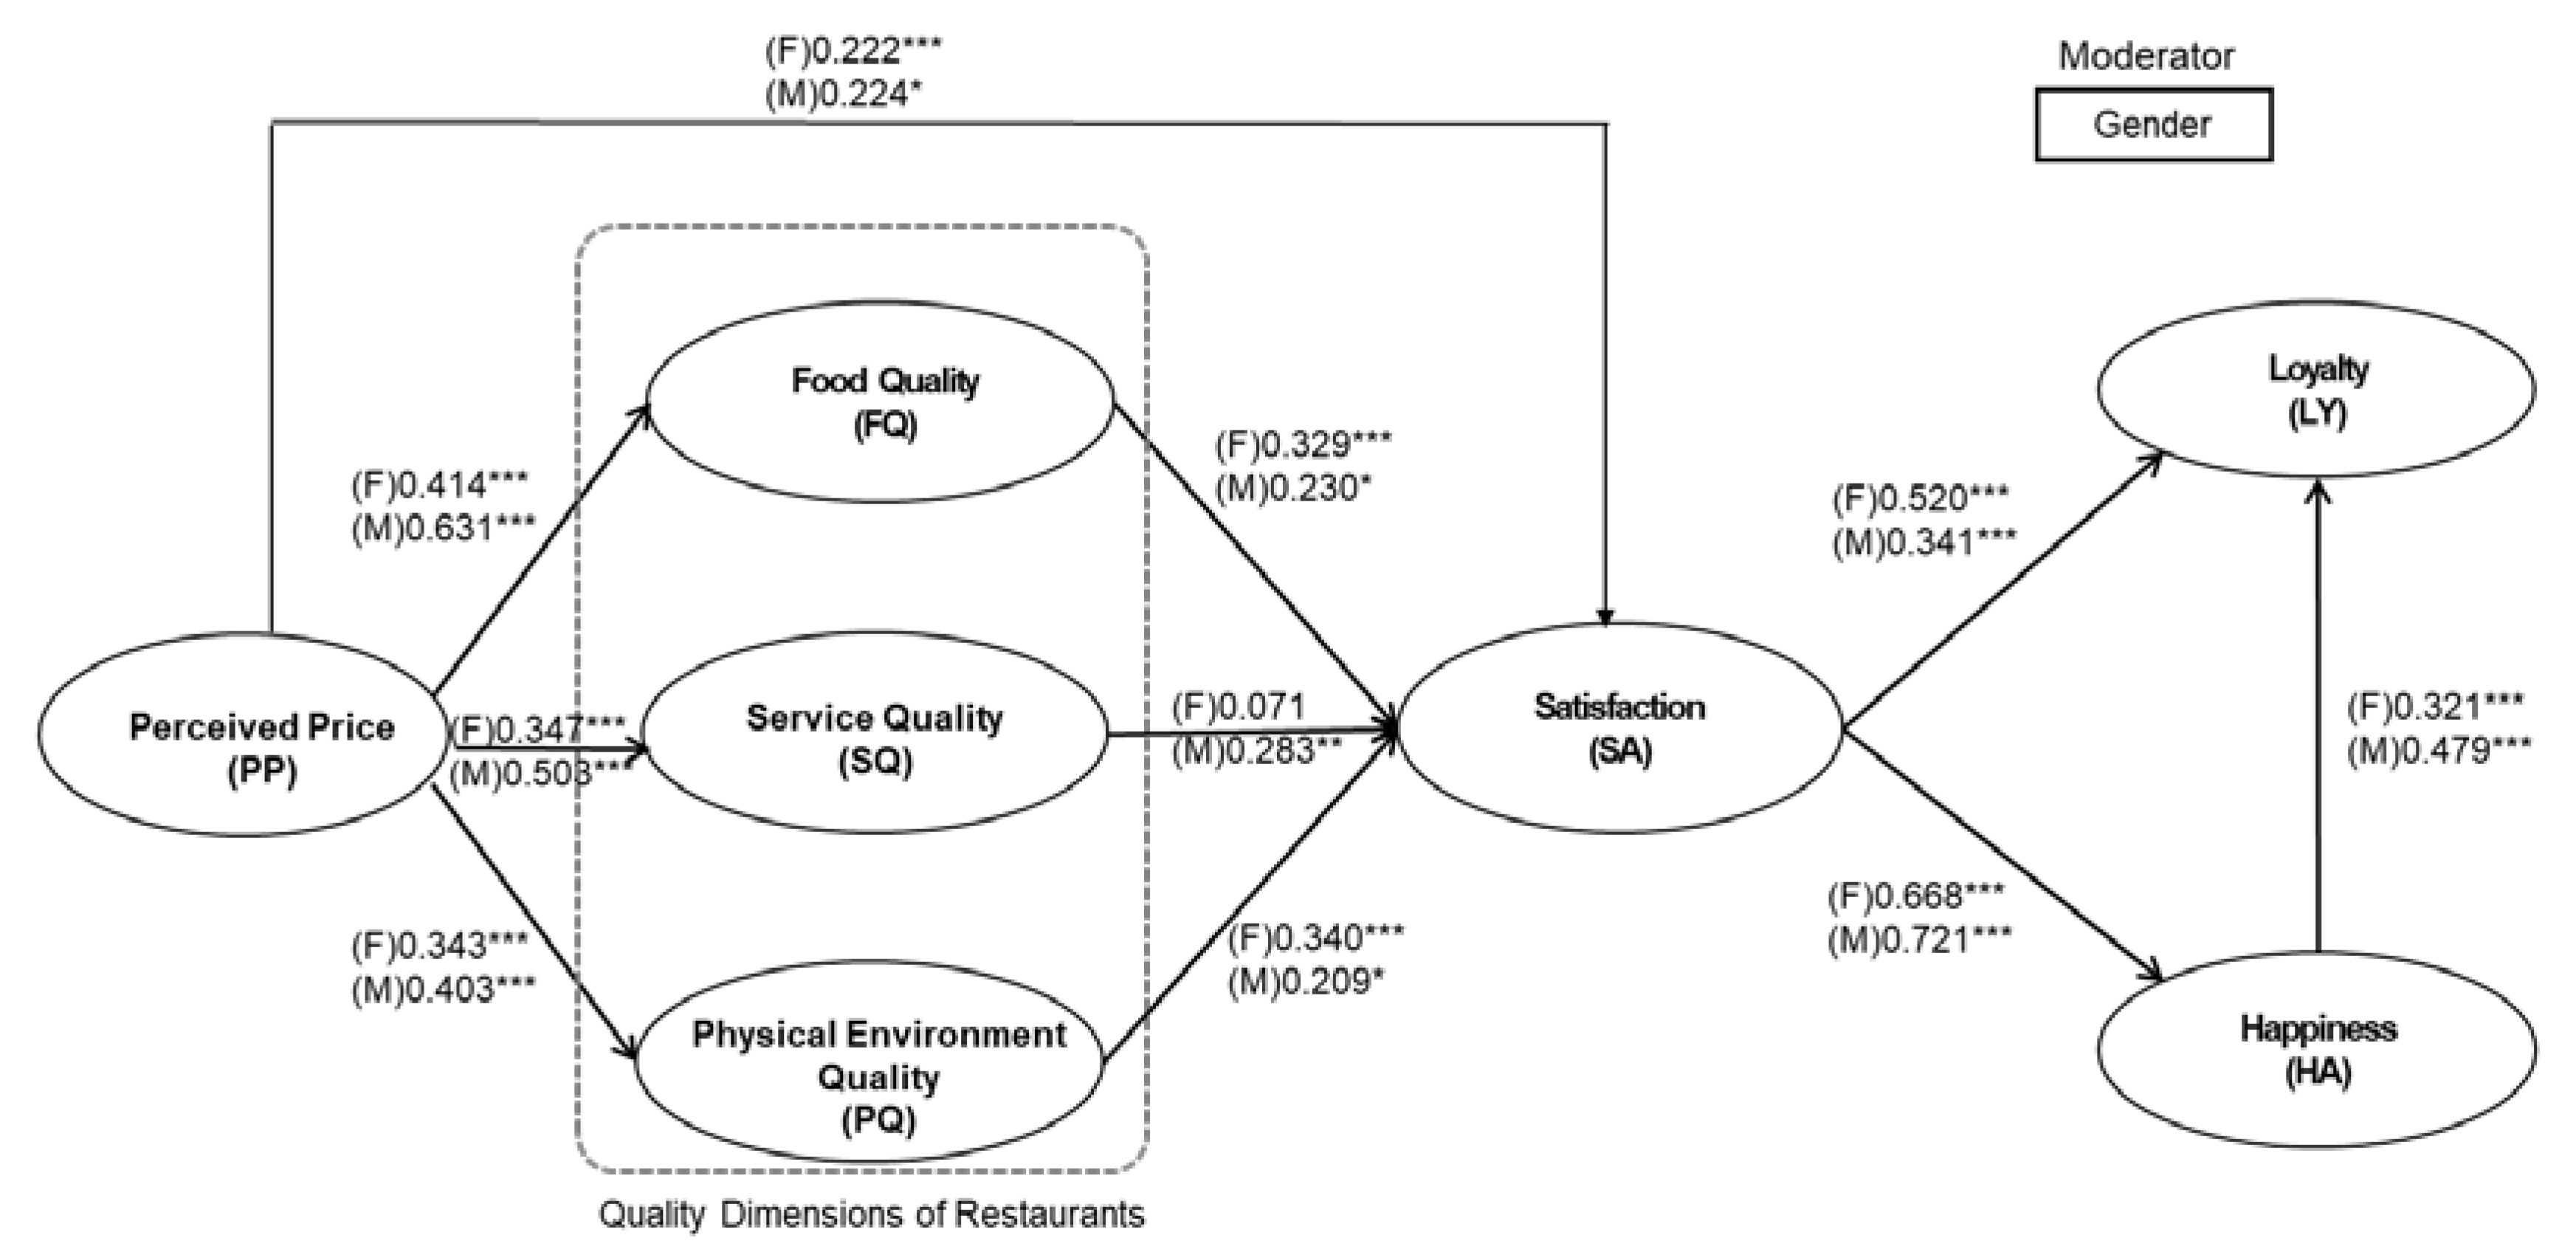
| Hypotheses | Path Coefficients (β) | p-Values | STDEV | Path Coefficients-Diff | ||||
|---|---|---|---|---|---|---|---|---|
| (F) | (M) | (F) | (M) | (F) | (M) | p-Value | ||
| H1 | perceived price → satisfaction | 0.222 | 0.224 | 0.000 | 0.012 | 0.058 | 0.089 | 0.980 |
| H2 | food quality → satisfaction | 0.329 | 0.230 | 0.000 | 0.036 | 0.083 | 0.111 | 0.465 |
| H3 | service quality → satisfaction | 0.071 | 0.283 | 0.332 | 0.002 | 0.073 | 0.090 | 0.064 * |
| H4 | physical environment quality → satisfaction | 0.340 | 0.209 | 0.000 | 0.015 | 0.071 | 0.089 | 0.247 |
| H5 | perceived price → food quality | 0.414 | 0.631 | 0.000 | 0.000 | 0.065 | 0.067 | 0.024 * |
| H6 | perceived price → service quality | 0.347 | 0.503 | 0.000 | 0.000 | 0.064 | 0.076 | 0.118 |
| H7 | perceived price → physical environment quality | 0.343 | 0.403 | 0.000 | 0.000 | 0.064 | 0.061 | 0.512 |
| H8 | satisfaction → loyalty | 0.520 | 0.341 | 0.000 | 0.000 | 0.085 | 0.079 | 0.139 |
| H9 | satisfaction → happiness | 0.668 | 0.721 | 0.000 | 0.000 | 0.041 | 0.044 | 0.390 |
| H10 | happiness → loyalty | 0.321 | 0.479 | 0.000 | 0.000 | 0.080 | 0.095 | 0.207 |
| Group | Stage | Effects | |||
|---|---|---|---|---|---|
| 1st (SA→HA) | 2nd (HA→LY) | Indirect Effects | Direct Effects | Total Effects | |
| whole group | 0.692 *** | 0.393 *** | 0.272 *** | 0.438 *** | 0.710 *** |
| female | 0.668 *** | 0.321 *** | 0.215 *** | 0.520 *** | 0.735 *** |
| male | 0.721 *** | 0.479 *** | 0.345 *** | 0.341 *** | 0.686 *** |
© 2020 by the authors. Licensee MDPI, Basel, Switzerland. This article is an open access article distributed under the terms and conditions of the Creative Commons Attribution (CC BY) license (http://creativecommons.org/licenses/by/4.0/).
Share and Cite
Zhong, Y.; Moon, H.C. What Drives Customer Satisfaction, Loyalty, and Happiness in Fast-Food Restaurants in China? Perceived Price, Service Quality, Food Quality, Physical Environment Quality, and the Moderating Role of Gender. Foods 2020, 9, 460. https://doi.org/10.3390/foods9040460
Zhong Y, Moon HC. What Drives Customer Satisfaction, Loyalty, and Happiness in Fast-Food Restaurants in China? Perceived Price, Service Quality, Food Quality, Physical Environment Quality, and the Moderating Role of Gender. Foods. 2020; 9(4):460. https://doi.org/10.3390/foods9040460
Chicago/Turabian StyleZhong, Yongping, and Hee Cheol Moon. 2020. "What Drives Customer Satisfaction, Loyalty, and Happiness in Fast-Food Restaurants in China? Perceived Price, Service Quality, Food Quality, Physical Environment Quality, and the Moderating Role of Gender" Foods 9, no. 4: 460. https://doi.org/10.3390/foods9040460
APA StyleZhong, Y., & Moon, H. C. (2020). What Drives Customer Satisfaction, Loyalty, and Happiness in Fast-Food Restaurants in China? Perceived Price, Service Quality, Food Quality, Physical Environment Quality, and the Moderating Role of Gender. Foods, 9(4), 460. https://doi.org/10.3390/foods9040460