Abstract
Milk phospholipids (MPLs) have been used as ingredients for food fortification, such as bakery products, yogurt, and infant formula, because of their technical and nutritional functionalities. Starting from either buttermilk or beta serum as the original source, this review assessed four typical extraction processes and estimated that the life-cycle carbon footprints (CFs) of MPLs were 87.40, 170.59, 159.07, and 101.05 kg CO2/kg MPLs for membrane separation process, supercritical fluid extraction (SFE) by CO2 and dimethyl ether (DME), SFE by DME, and organic solvent extraction, respectively. Regardless of the MPL content of the final products, membrane separation remains the most efficient way to concentrate MPLs, yielding an 11.1–20.0% dry matter purity. Both SFE and solvent extraction processes are effective at purifying MPLs to relatively higher purity (76.8–88.0% w/w).
1. Introduction
Milk phospholipids (MPLs) consist of a subclass of polar lipids, namely glycerophospholipids and sphingolipids [1]. Glycerophospholipids comprise a glycerol moiety with two fatty acids esterified at positions sn-1 and sn-2 and a hydroxyl group at sn-3 position, linked to a phosphate group and a polar moiety [1]. The molecular structure of the latter determines the types of glycerophospholipids, namely phosphatidylcholine (PC), phosphatidylserine (PS), phosphatidylethanolamine (PE), phosphatidylinositol (PI), phosphatidyl-glycerol (PG), and phosphatidic acid (PA) [2]. Sphingolipids consist of a sphingosine backbone (2-amino-4-octadecene-1,3-diol) connected to a fatty acid via an amide bond and a polar head. Sphingomyelin (SM), a prominent subclass of sphingolipids, has a phosphocholine residue [1]. In raw bovine milk, the diameters of milk fat globules (MFGs) are around 0.2–15 µm; these MFGs are enveloped by an approximately 15-nm thick tri-layer MFG membrane (MFGM) [3,4]. The composition of MFGM is 30–75% polar lipids, and 25–70% protein, respectively [5]. MPLs lie within the MFGM constructing its backbone. MPLs represent 0.4–1% of the total milk lipids [6], which change with season, lactose stage, and feed [7].
MPLs have exhibited nutraceutical properties due the unique composition of this group of phospholipids. MPLs contain high proportions of SM [8] and PS [9] (24% and 12%, respectively), subclasses which are virtually absent in other sources, such as soy (0% and 0.5%, respectively) and egg yolk lecithin (1.5% and 0%, respectively) [10]. PS is associated with cognitive function and releasing stress, and is replaced by inactive cholesterol as the brain ages [11,12]. SM has been found to be effective in inhibiting colon tumors [13]. Also, MPLs have been implicated in mitigating the risks of Alzheimer’s disease and repairing cognitive ability [14], restoring immunological defenses, reducing the incidence of cardiovascular diseases [15,16], and reducing cholesterol absorption and total liver lipids [17]. In addition, MPLs may narrow the gap between formula-fed and breastfed infants concerning neurodevelopment, infectious diseases, and cholesterol metabolism [18,19]. Phospholipid-coated fats, e.g., human breast MFGs, will be properly digested and absorbed, not only due to the size of the MFGs, but also due to the ratio of MFGM proteins to phospholipids [20]. Bovine MPL-enriched ingredients may be used to produce breast milk analogs. For instance, one formula recipe consists of subclasses according to a weight-relative ratio of SM > PC > PE > PS > PI, with 21.1–29.7% SM and 10.2–13.3% PS (both based on total MPLs, similar to those of human breast milk (37.5% and 9%, respectively) [21]. Another infant formula comprises 150 mg/L MPLs [22], mimicking that of breast milk (15–20 mg/dL milk [21] and 0.3–1.0% of the total lipids [23]).
Aside from nutritional value and health benefits, MPLs may provide technical functionalities in food systems, for example, MPLs have been used in the preparation of liposomes [24] and constructing vesicles of bioactive compounds [25]; they are also food emulsifiers and surfactants, foaming agents, texture improvers for bakery goods, and may improve moisture retention for yogurt [26,27].
Many research works and reviews are available on fractionation from buttermilk (BM) and beta serum (BS) [26], isolating MFGs by washing and centrifugation [5], and the membrane separation of polar lipids [8]. However, there is no standard large-scale manufacturing process adopted by the dairy industry. This is due to many reasons. First, the native MFGM is fragile. Shear and turbulent fluid flow can cause damage to the MFGM [28]. These treatments are commonly involved in handling raw milk on farms, in transportation, in silos at manufacturing plants, and during cream separation. Damage to the MFGM may cause associated materials, including MPLs, to deplete from the native MFGs to the aqueous phase of milk. Therefore, more than half of MPLs in raw milk remains in skim milk [29,30]. Second, uncertainties and variables are involved in the MPL fractionation processes. For example, cream washing for removing non-MFGM associated proteins may be performed before butter churning for increased yield or the concentration of MPLs in the resulting BM, or in the retentate of BM after tangential filtration. However, the cream washing procedure may cause a significant change to the MPL composition in BM from unwashed cream [31,32]. Although the mechanism is not clear, it may relate to the physicality of different washing processes. Zheng’s group revealed that different washing procedures induce various degrees of damage to MFGM. Therefore, washing may alter the composition of MPL in the fat phase of the washed cream [4,33]. This review aimed to assess different dairy streams rich in MPLs, to evaluate their extraction processes, compare their process intensity and efficiency, and to estimate their life-cycle carbon footprints (CFs) using ISO 14067 and greenhouse gas (GHG) protocols.
2. Milk Phospholipid Extraction from Dairy Products
2.1. Dairy By-Products Rich in Phospholipids
Commercial MPL products are usually derived from dairy products, such as BM [34], BS [8], acid cheese whey BM [35,36], whey protein phospholipids concentrate (WPPC) [37], or whey BM [38]. The dairy streams in Table 1 comprise 2.29%–26.02% MPLs on a dry matter (DM) basis, varying with sources and processes.

Table 1.
Dairy product composition (g/100 g).
BM is the product that remains after the removal of butter by churning cream, which may have been concentrated and/or dried as butter milk powder [39], as illustrated in Figure 1. Acid BM, a by-product of lactic butter, is made by churning cultured cream. Furthermore, whey BM is produced via the churning of whey cream during cheese making [40]. WPPC is a by-product produced during the microfiltration (MF) of whey for manufacturing whey protein isolate (WPI). The permeate phase (milk-fat-discriminated phase) from this process goes forward for WPI manufacturing and the fat-remaining phase (retentate phase) containing residual whey proteins is further concentrated for producing WPPC. A typical WPPC is comprises more than 12% fat and 50% protein (DM), and less than 8% ash and 6% moisture [37].
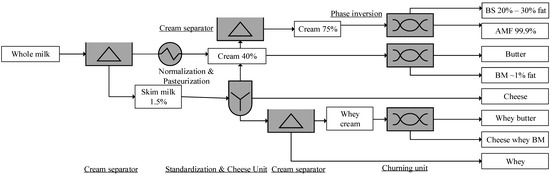
Figure 1.
Buttermilk (BM) and beta serum (BS) production process [26]. AMF, anhydrous milk fat. % indicates the fat content.
BM, the serum phase resulting from the churning of cream, comprises milk proteins and residual fat [34]. In terms of protein, lactose, ash, and DM contents, BS and BM are very similar to those of cream products (Table 1) [41]. For instance, BM (FDC ID 454974) protein content is 3.33%, which is the same as that of cream (FDC ID 495516). Though the fat content of BM is only one-tenth of cream, MPLs of BM are 4–27-fold that of raw milk, as shown in Table 1. The empirical equation MPL = 0.0137 × FC provides an estimation of the MPL content (g/L) of a dairy product, where FC is the fat content of cream [42]. For instance, the estimated BM MPL content of anhydrous milk fat (AMF) from 80% cream, and of butter from 40% cream, is 1.1 and 0.55 g/kg, respectively. Whey BM, a by-product of whey butter, comprises sixfold the MPL content of raw milk, as seen in Table 1 [38].
BM and BS, the most abundant source of MPLs [43], have been underexplored or even treated as a waste stream [44]. For instance, a New Zealand-based dairy manufacturer used two-thirds of their BM for standardization, only one-tenth for BM powder (BMP), and their annual output of MPL concentrate is 320 metric tons [44]. The annual BM output in Canada was 14.1 metric kilotons (18% of butter and 0.5% of bulk liquid [45]), compared to 20 kilotons in Belgium, 16 kilotons in Denmark, and 124.5 kilotons in Germany [46]. In 2013, approximately 5.2 million tons of BM was produced worldwide, similar to that of butter [34]. Worldwide, the annual BMP production was estimated at 410 kilotons (≈9.5% of butter), which has downstream applications for producing ice cream, ingredients-baked foods, low-fat Cheddar cheese, reduced-fat cheese, pizza cheese [40], or in the replacement of skim milk powder for low-fat yogurt [47].
2.2. Commercialized Milk Phospholipid Products and Concentrate
Phosphoric 500/600/700 and Gangolac 600 (products manufactured by Fonterra) comprise 34%, 75%, 62%, and 15% MPLs, respectively, representing one source of highly-purified MPLs [52,53]. Arla Foods Amba have developed phospholipid-rich, concentrated dairy milk commodities for infant milk formulas and skin care. It has been claimed that Lacprodan® MFGM 10 supports physiological development of the infant gut and provides infants with similar health benefits to breast milk because of their similarities in fatty acid profile [54]. Arla dairy products PL 20/75 consist of 20% and 75% MPLs, respectively [55].
As illustrated in the patents in Table 2, both filtration and solvent extraction are validated processes for manufacturing MPLs. Acetone and supercritical CO2 are effective solvents for de-fatting. Tatua [56] and Synlait [57] have concentrated MPLs to 5–12.8% (w/w, DM basis). Lecico has used membrane separation to produce Lipamine M20 (20% purity) [58].
Table 2.
Proprietary/patented manufacturing technologies of milk phospholipids (kg/100 kg products).
2.3. Laboratory Extraction of Milk Phospholipids
Intact MFGM makes up 2–6% of the total mass of MFG [26]. However, MFGM represents 60%–70% of the total milk phospholipids [69]. Raw bovine milk comprises 0.2–0.4 g MPLs/kg, and raw milk is generally a laboratory source of MPLs [5,70]. Intact MFGs can be isolated with low-speed centrifugation. The cream layer from raw milk skimming can be washed with phosphate buffered saline (PBS; pH 6.8, 0.1 M, 1:10, v/v) and centrifuged at 390 g for 10 min at 10 °C. The final cream layer after three washes is the large MFG fraction [71]. Different from isolating intact MFGM, Sanches-Juanes et al. [72] ruptured MFGM and recrystallized milk lipids, and starting from raw milk, they washed cream with a 0.15 M NaCl solution and precipitated casein using centrifugation at 5000× g.
Cream washing is a step used to remove casein and other non-MFGM materials from cream [44]. After centrifugation, casein will precipitate, with lipid stratification at the top layer [73]. Also, calcium, naturally present in casein micelles, can form a complex between MFGM and the casein micelles through its binding to the phospho-casein and phospholipids of MFGM, leaving impurities with MPLs [74]. In addition, washing causes a severe loss of phospholipids, almost 60% per wash [32]. Hence, washing facilities for separating MPLs are costly and energy-intensive [44], thereby they are mainly only used for laboratory purposes [5,73,75].
In addition to washing and centrifugation, the microfiltration of raw milk has been applied to produce MFGM material. It has been found that a 1.4-μm ceramic membrane was superior to 0.8 μm, yielding a high-purity MFGM material, which was composed of 7% phospholipids and 30% protein [76].
For analysis purposes, MPL samples are usually prepared using solvent extraction. The Folch [77] and Bligh [78] methods use chloroform and methanol to dissolve lipids. Other lipophilic extraction formulas include the Mojonnier solvents [79], dichloromethane [80], and the ammoniacal ethanolic solution of lipids with dimethyl ether and light petroleum in the Röse–Gottlieb extraction [81,82]. The total lipid content in samples can be determined with a gravimetric assay, Gerber-van Gulik butyrometer, infrared spectroscopy according to an International Dairy Federation (IDF) method [81], or gas chromatography equipped with a flame ionization detector [83].
To determine the MPLs and their subclasses, solid-phase extraction can fractionate polar lipids from non-polar lipids. Silica-gel-bonded cartridges or silica gel plates can be used for such a purpose [84]. The obtained MPLs can be solvent dried using a vacuum and stored at −20 °C before using [85]. In addition, chloroform and methanol are also valid elution solvents [86]. Total MPLs can be measured using the IDF molybdate assay [87], Fourier transform infrared spectroscopy [88], or a fluorescence assay on cleaved choline group [89]. Both nuclear magnetic resonance of 31P and chromatography can quantify MPLs and their subclasses [90,91]. High-performance liquid chromatography coupling with detectors as a charged aerosol detector, evaporative light-scattering detector, and mass spectroscopy is more acceptable than thin layer chromatography [92].
3. Processes for Industrial Manufacturing of Milk Phospholipids
3.1. Solvent Extraction
Many kinds of polar solvents have been used to extract MPLs, such as ethanol and alkanes [21,66]. To separate casein from MPLs, proteins can also be thermally denatured or in an acid solution (pH 4.6) [48,81], the aggregated particles are subsequently filtrated. Regarding fractionation of MPL from WPPC, ethanol (70% v/v) at 60–80 °C denatures proteins; after filtration the MPL concentration is ≈45.8% in the filtrate in Figure 2a [48]. This notable method uses no toxic solvent. However, the incompleteness of the phospholipid recovery may be a concern [48].
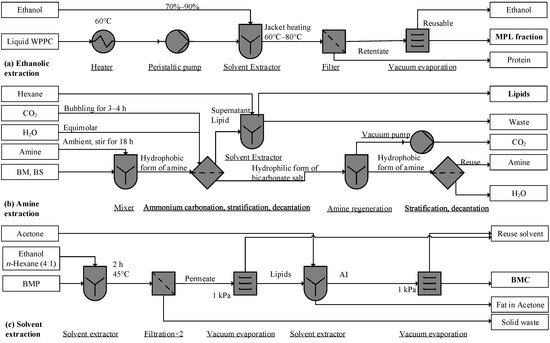
Figure 2.
Process flow diagram of solvent extraction unit: (a) adapted from Price et al. [48], (b) Ota et al. [93], and (c) Shulman et al. [21]. BMC, buttermilk concentrate; MPL, milk phospholipid; AI, acetone insoluble; WPPC, whey protein phospholipid concentrate (liquid, reconstituted from powder).
Compared to 58.1% recovery by ethanol, the tertiary amine CyNMe2 (N,N-dimethylcycloexylamine) yielded a 99.96% recovery rate of MPLs. At various solvent–sample weight ratios, the lipid extraction was conducted at ambient temperature. The dissolved MPLs in the amine were released by bubbling CO2 at atmospheric pressure, which converts CyNMe2 into the carbonate salt in Figure 2b. By injecting nitrogen and removing CO2, the carbonate salt regenerated into the amine form for reuse (Figure 2b). Though the recovery rate for BM was as high as 99.96 ± 1.2%, the extraction rates for BS and concentrated BM were only 7.57 ± 0.59% and 77.27 ± 4.51%, respectively. Aside from the input sensitivity, the amine may interact with dairy components and cause toxic consequences [93], and the chemical facilities required may be incompatible in a dairy factory setting.
MPLs can be dissolved in ethanol and alkanes [21,67,68], and may not dissolve in acetone, ethyl acetate, and 2-pentanone [21,67,68]. Lipid BMP (100 g) dissolved in ethanolic hexane (1:4 v/v, 800 mL) under constant agitation at 45 °C for 2 h will produce an extract. The permeate of vacuum filtration (repeated twice) can then be vacuum-dried at 1 kPa (Figure 2c). The residue (≈20 g) is then defatted twice with 120 mL acetone, and the resulting acetone is insoluble (AI, ≈7 g), composed of mainly polar lipids, and in the final step vacuum, is dried again at 1 kPa [21]. However, acetone poses a degree of toxicity, as acetone residue in defatted MPLs may reach 5–10 ppm. Further, acetone can form a mesityl oxide via a condensation reaction, causing an off flavor [94]. Hence, toxic residues in acetone-insoluble fractions need analysis and monitoring.
3.2. Supercritical Fluid Extraction
Supercritical CO2 with ethanol as a co-solvent can be used to extract MPLs effectively, yielding purities of 26.26% and 16.88% from WPPC and BMP extractions, respectively (Figure 3a). The SFE operation can be conducted at 50–60 °C [95] and 350–550 bar [49]. The SFE co-solvent (CO2 and 20% ethanol) allowed for complete extraction of PE, PC, and SM. However, neither PS (i.e., the vital compounds for cognitive function) nor PI were extracted [61,96]. Therefore, the co-solvent method may be an invalid industrial process due to the incompleteness of PS/PI recovery. In addition to co-solvents, dimethyl ether near the critical point (DME, 20%–30% solubility, 333 K, 40 bar) and supercritical CO2 are able to dissolve polar and neutral lipids, respectively [59].
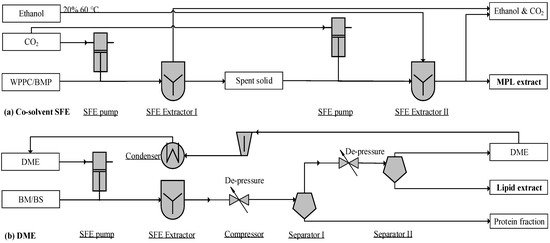
Figure 3.
Process flow diagram of a supercritical fluid extraction (SFE) unit: (a) adapted from Li [49] and (b) Kala et al. [97]; WPPC, whey protein phospholipid concentrate; BS, beta serum; BM, buttermilk; BMP, buttermilk powder; DME, dimethyl ether.
Supercritical fluid DME has been used to extract polar lipids, resulting in a yield of 69.1–77.8%. The SFE process shown in Figure 3b can accept both liquid and powder inputs [59,97]. This unit can work with CO2 and DME in two-stages, extracting neutral and polar lipids, separately. In addition to a two-step operation, this unit can also operate a single extraction with DME. Near-critical DME dissolves both polar and non-polar lipids in the SFE chamber. Through a two-stage de-pressurization, lipids are separated from the protein fraction, whereas vaporized DME is compressed and condensed for reuse (Figure 3b). This method features properties such as non-toxicity, a compact skid, feeding flexibility, and a high content of MPLs (65.7–75.5 g MPLs per 100 g DM). However, the MPL recovery rate (69.1–77.8%) needs further improvement.
3.3. Enrichment of Milk Phospholipids via Filtration
BM or BS is composed of milk fat, casein and whey protein, lactose, and ash. The particle sizes range from 0.4–4 µm for MFGM fragments or phospholipid micelles [98], 0.02–0.3 µm for casein, 0.03–0.06 µm for whey protein, and 0.002 µm for lactose and ash, respectively [99]. The size of MFG is around 0.2–15 µm [3]. As illustrated in Figure 4, the MF unit removes lactose and whey protein, and UF separates the smaller casein proteins from MPLs. Due to the size overlap of casein micelles and MPL particles, their separation is usually incomplete. Casein micelles disintegrate into peptides and amino acids in the proteolysis unit [34,42], and hydrolysates enter into the permeate stream during the subsequent UF operation [42,96]. Alcalase (E.E. 3.4.21.62), a serine-type endoprotease with esterase activity, catalyzes amino esters at pH 7.5 and 35–60 °C [96], while tryptic and peptic hydrolysis may be carried out at 42 °C for 2–16 h, at a pH of 7.7 and 2.0, respectively [42].
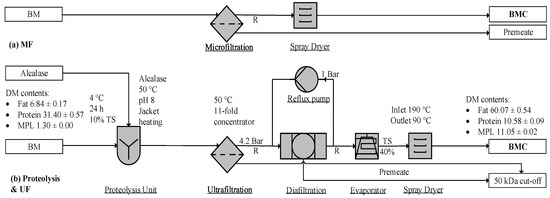
Figure 4.
Filtration to enrich milk phospholipids (MPLs): (a) microfiltration (MF) [98] and (b) ultrafiltration (UF) [96]. BM, buttermilk; BMC, BM concentrate; TS, total solid; R, retentate.
Membrane filtration is a typical process for enriching BM (Figure 4a). Proteolytic treatment plus UF, as illustrated in Figure 4b, successfully differentiates MFGM from protein particles and yields product purities of 14 ± 3.4% (DM) [42] and 11.05 ± 0.02% (DM) [96]. The combined process of proteolysis and membrane separation can yield a 100% recovery rate of MPLs from BM, as illustrated in Table 3. Considering membrane units exist in most dairy factories [99,100], the process remains the most effective method for concentrating MPLs, requiring less investment than the other processes [101]. As illustrated in Table 3, this method [96] recovered more MPLs than the other processes.
Table 3.
Process to purify MPLs and achieved purity (g MPLs/100 g dry product).
3.4. Available Processes for Extracting Milk Phospholipids
In brief, there are three options for the large-scale manufacturing of MPLs, including solvent extraction [21,68], SFE [59,97], and proteolysis plus membrane concentration [34,42,82,96]. The membrane concentration of MPLs have yielded a 20% (w/w, DM basis) purity, as achieved by Lecico [58] and Arla [10]. Tatua [56] and Westland and Synlait [44] have extracted MPLs from BS powder (2.28%, w/w, DM basis), achieving approximately 12.8% (w/w, DM basis) purity using membrane filtration. The proteolysis and UF unit recovers MPLs completely [34,82,96] and cost-effectively [44]. This process is more efficient than SFE and solvent extraction, whereas SFE and solvent extractions are effective steps for manufacturing high purity MPLs. Therefore, the three processes have features of a high recovery rate, facility availability, and food compatibility, representing current industrial practices (in Table 3).
4. Carbon Footprint
4.1. Life-Cycle Accessment Method of Carbon Footprint
The ISO 14,040 life-cycle assessment (LCA) is an internationally accepted methodology used to calculate a product’s environmental footprint [103]. Life-cycle carbon footprints (CFs) of dairy products cover the direct emission from the dairy factory (scope 1); the energy carrier footprint for factory operations (natural gas, steam, power, nitrogen, and compressed air in scope 2); and the raw material, packaging, and logistics in scope 3. In addition, the life-cycle CF comprises the emissions from the dairy farm (upstream) and distribution center (downstream) [104]. The boundaries are set as shown in Figure 5a. The CFs of MPL products were reported as equivalent CO2 emission for one kg of MPLs, according to the ISO 14,067 reporting standards [105].
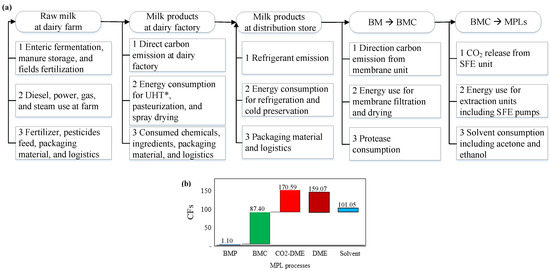
Figure 5.
(a) Boundary definition of the life-cycle carbon footprints (CFs) of dairy products and exemplary emissions from scope 1 (direction emission), scope 2 (energy carriers), and scope 3 (raw material procured, packaging material, and transportation). (b) Cascade of CFs of BMP, BMC, and MPLs using the following processes: “CO2-DEM” (supercritical CO2 and DME), “DME” (supercritical DME), and “Solvent” (hexane and ethanol extraction and acetone de-fatting, kg equivalent CO2/products). Scopes of BM CFs: adapted from References [45,106,107,108,109]. MPLs, milk phospholipids; BM, buttermilk; BMC, BM concentrate; DME, dimethyl ether; SFE, supercritical fluid extraction. * Ultra High Temperature processing.
The CF of BM (baseline CF, 1.10 kg CO2/kg BM powder) was cited directly from data derived from the Unified Livestock Industry and Crop Emissions Estimation System (ULICEES) model in Canada [45]. The data abides by the Intergovernmental Panel on Climate Change (IPCC) methodology [106]; it covers emissions like methane [45], nitrous oxide [107], and carbon dioxide using the F4E2 model [108]; and uses an allocation matrix to partition six inventory flows (i.e., fuel, power, raw milk transportation, alkaline/acid, water, and waste water) into 11 major dairy products [109].
In this study, BM was assumed as the starting material for producing MPLs. Therefore, the CF for producing BM was set as the baseline. The CF of MPLs in Figure 5b and Table 4 is a sum of the CF of BM (as the baseline) and the CF for extracting MPLs from BM at dairy factories. The starting amount of BM was assumed to be 100 kg (1.3%, w/w, DM basis). Since MPLs are considered as the target products, CF of protein in the MPL fractions was not included in the estimations.
Table 4.
Normalized carbon footprints of milk phospholipids (kg CO2/kg MPLs).
The CF of BM concentrate (BMC) via membrane separation (MS) was calculated using the equation: CFBMC = CFBM + CFMS, where CFBMC, CFBM, and CFMS were the CF of BMC, BM, and MS, respectively. The CF of MPL products using SFE or solvent extraction was calculated using the equation CFMPLs = CFBMC + CFSFE or CFMPLs = CFBMC + CFSol where CFMPLs, CFBMC, CFSFE, and CFSol were the CF for the MPL product, BMC, SFE, and solvent extraction process, respectively, as illustrated in Figure 5b. The CF for BMP (1.5% purity) was 1.10 kg CO2/kg MPL, and the CF of BMC (11.0% purity) was 87.40 kg CO2/kg MPL, as calculated in Table 5. Starting from BMC, the CFs of MPL products were 170.59, 159.07, and 101.05 kg CO2/kg MPL for processes of CO2-DME supercritical fluid extraction, DME SFE, and organic solvent extraction, respectively.
Table 5.
Comparison of the carbon footprint of milk phospholipids in commercial dairy products (kg CO2/kg product).
4.2. Carbon Footprint Estimation
In Table 4, four MPL enrichment processes were used as references for estimating and comparing the total CFs. The membrane separation process was used to concentrate MPL from the original BM. The resulting product was a BM concentrate (BMC), which may be further processed to yield MPL products by either using an SFE technique or a solvent extraction method. The CF of “utility” consumed for the three individual MPL enrichment methods was obtained by multiplying the utility amount and CF conversion factor, which represents the amount of carbon emission for a unit weight of utility. Normalized CF: CFNormalized = CF/CMPLs, where CMPLs was the MPL purity (g MPLs per 100 g product).
The normalized CF of the product uisng membrane separation was as high as 87.4 kg CO2/kg BMC since the BMC comprised of only 11.05% MPLs. The CFs for products using SFE and solvent extraction were much higher than their baseline (CFBMC) because of the intensive process during purification. As shown in Table 4, the CFs of fractions using SFE were 170.59 and 159.07 kg CO2/kg MPLs for CO2/DME co-extraction and DME extraction, respectively. CO2/DME co-SFE exhibited a higher environmental impact compared to supercritical DME extraction due to direct emissions from co-SFE. Solvent extraction demonstrated a lower environmental impact and a higher MPL recovery rate than SFE. However, the products obtained using solvent extraction were less food-compatible than SFE unit-extracted products.
MPLs from proteolysis and filtration processes carry 87.40 kg equivalent CO2/kg product, much higher than all the milk fat products (Table 5). With less CF than SFE and solvent extraction, membrane separation is the most efficient process in terms of process intensity, energy consumption, and environmental impact. In addition, this process is compatible with most dairy factories. Membrane separation is a necessary step for concentrating BM into BMC. BMC can then be purified using SFE (DME). The relevant processes with a significant MPL CF include membrane filtration, evaporation and spray drying, SFE, and solvent recovery, the improvement of which offer opportunities to reduce the CF of the final products. For example, 0.1-µm polymeric spiral-wound MF membranes have been used to separate casein from milk, exhibiting a higher energy efficiency at 0.024 (MF) and 0.015 (DF) kWh/kg permeate than that of graded permeability membrane (0.143 and 0.077 kWh/kg permeate for MF and DF, respectively [110]. Furthermore, permeate flux, volume concentration ratio, transmembrane pressure, and temperature all had an impact on the energy efficiency of membrane UF, ranging from 0.26–0.33 kWh/kg retentate [116]. Another approach toward reducing the environmental impact is to improve the purity of MPLs during filtration by differentiating the particle size of casein micelles (i.e., hydrolysis) from the fragmented MFGM and subsequent application of membrane filtration.
5. Conclusions
This paper identified three dairy streams for milk phospholipid (MPL) manufacturing at an industrial scale: buttermilk, beta serum, and whey protein phospholipid concentrate. The life-cycle CFs of the MPLs were 87.40, 170.59, 159.07, and 101.05 kg CO2/kg MPLs for the membrane separation process, CO2/DME supercritical fluid extraction, SFE by DME, and organic solvent extraction, respectively. The extracted products comprised 11.1, 76.8, 69.9, and 88.0% MPLs, with recovery rate of 100, 69.1, 67.4, and 100%, respectively. In conclusion, to improve the efficiency of an MPL concentration process, casein in BM needs to be proteolyzed before running UF/DF processes. By doing so, it is possible to achieve full recovery of MPLs from BM; moreover, this method may result in a relatively low CF. SFE using dimethyl ether is the most effective method for the production of high-purity (≈66.8%) MPL products, albeit at the cost of a high CF. This study provided insights into the best available industrial practices for extracting MPLs and estimating their life-cycle CFs.
Author Contributions
Conceptualization, Z.H., H.Z., and C.S.B.; investigation, Z.H.; writing—original draft preparation, Z.H.; writing—review and editing, L.S., H.Z., M.S.M., C.S.B., L.L., and D.K. All authors have read and agreed to the published version of the manuscript.
Funding
This research received no external funding.
Conflicts of Interest
The authors declare no conflicts of interest.
References
- Ortega-Anaya, J.; Jiménez-Flores, R. Symposium review: The relevance of bovine milk phospholipids in human nutrition—Evidence of the effect on infant gut and brain development. J. Dairy Sci. 2018, 102, 1–11. [Google Scholar] [CrossRef]
- Verardo, V.; Arráez-Román, A.M.G.-C.D.; Hettinga, K. Recent advances in phospholipids from colostrum, milk and dairy by-products. Int. J. Mol. Sci. 2017, 18, 173. [Google Scholar] [CrossRef] [PubMed]
- Zheng, H.; Jimenez-Flores, R.; Gragson, D.; Everett, D.W. Phospholipid architecture of the bovine milk fat globule membrane using giant unilamellar vesicles as a model. J. Agric. Food Chem. 2014, 62, 3236–3243. [Google Scholar] [CrossRef] [PubMed]
- Zheng, H.; Jiménez-Flores, R.; Everett, D.W. Lateral lipid organization of the bovine milk fat globule membrane is revealed by washing processes. J. Dairy Sci. 2014, 97, 5964–5974. [Google Scholar] [CrossRef] [PubMed]
- Holzmüller, W.; Kulozik, U. Technical difficulties and future challenges in isolating membrane material from milk fat globules in industrial settings—A critical review. Int. Dairy J. 2016, 61, 51–66. [Google Scholar] [CrossRef]
- Lopez, C.; Blot, M.; Briard-Bion, V.; Cirie, C.; Graulet, B. Butter serums and buttermilks as sources of bioactive lipids from the milk fat globule membrane: Differences in their lipid composition and potentialities of cow diet to increase n-3 PUFA. Food Res. Int. 2017, 100, 864–872. [Google Scholar] [CrossRef] [PubMed]
- Liu, Z.; Logan, A.; Cocks, B.G.; Rochfort, S. Seasonal variation of polar lipid content in bovine milk. Food Chem. 2017, 237, 865–869. [Google Scholar] [CrossRef]
- Gassi, J.Y.; Blot, M.; Beaucher, E.; Robert, B.; Leconte, N.; Camier, B.; Rousseau, F.; Bourlieu, C.; Jardin, J.; Briard-Bion, V.; et al. Preparation and characterisation of a milk polar lipids enriched ingredient from fresh industrial liquid butter serum: Combination of physico-chemical modifications and technological treatments. Int. Dairy J. 2016, 52, 26–34. [Google Scholar] [CrossRef]
- Burling, H.; Andersson, I.; Schneider, M. Phosphatidylserine Enriched Milk Fractions for the Formulation of Functional Foods. U.S. Patent Application No. 8231922B2, 31 July 2012. [Google Scholar]
- Burling, H.; Graverholt, G. Milk—A new source for bioactive phospholipids for use in food formulations. Lipid Technol. 2008, 20, 229–231. [Google Scholar] [CrossRef]
- Castro-Gómez, P.; Garcia-Serrano, A.; Visioli, F.; Fontecha, J. Relevance of dietary glycerophospholipids and sphingolipids to human health. Prostaglandins Leukot. Essent. Fat. Acids 2015, 101, 41–51. [Google Scholar] [CrossRef]
- Burling, H.; Andersson, I.; Schneider, M. Phosphatidylserine Enriched Milk Fractions for the Formulation of Functional Foods. W.O. Patent Application No. 128465A1, 7 December 2006. [Google Scholar]
- Kuchta-Noctor, A.M.; Murray, B.A.; Stanton, C.; Devery, R.; Kelly, P.M. Anticancer activity of buttermilk against SW480 colon cancer cells is associated with caspase-independent cell death and attenuation of Wnt, Akt, and ERK signaling. Nutr. Cancer 2016, 68, 1234–1246. [Google Scholar] [CrossRef] [PubMed]
- Contarini, G.; Povolo, M. Phospholipids in milk fat: Composition, biological and technological significance, and analytical strategies. Int. J. Mol. Sci. 2013, 14, 2808–2831. [Google Scholar] [CrossRef] [PubMed]
- Hernell, O.; Timby, N.; Domellöf, M.; Lönnerdal, B. Clinical benefits of milk fat globule membranes for infants and children. J. Pediatr. 2016, 173, S60–S65. [Google Scholar] [CrossRef] [PubMed]
- Timby, N.; Hernell, O.; Vaarala, O.; Melin, M.; Lönnerdal, B.; Domellöf, M. Infections in infants fed formula supplemented with bovine milk fat globule membranes. J. Pediatr. Gastroenterol. Nutr. 2015, 60, 384–389. [Google Scholar] [CrossRef] [PubMed]
- Küllenberg, D.; Taylor, L.A.; Schneider, M.; Massing, U. Health effects of dietary phospholipids. Lipids Health Dis. 2012, 11, 1–16. [Google Scholar] [CrossRef] [PubMed]
- Rutenberg, D. Infant Formula Supplemented with Phospholipids. W.O. Patent Application No. 105609A1, 24 December 2003. [Google Scholar]
- Timby, N.; Domellöf, M.; Lönnerdal, B.; Hernell, O. Supplementation of infant formula with bovine milk fat globule membrane. Adv. Nutr. 2017, 8, 351–355. [Google Scholar] [CrossRef]
- Braak, V.D.; Maria, C.C.; Thomassen, G.; Acton, D.S.; Abrahamse, E. Nutrition with Large Lipid Globules Comprising Vegetable Fat Coated with Milk Phospholipids for Lipid Digestion. W.O. Patent Application No. 163881A1, 13 Octorber 2016. [Google Scholar]
- Shulman, A.; Zuabi, R.; Dror, G.B.; Twito, Y.; Pelled, D.; Herzog, Y. Polar Lipid Mixtures, Their Preparation and Uses. U.S. Patent Application No. 9814252B2, 8 August 2017. [Google Scholar]
- Rueda, R.; Barranco, A.; Ramirez, M.; Vazquez, E.; Valverde, E.; Prieto, P.; Dohnalek, M.H. Enriched Infant Formulas. U.S. Patent Application No. 0057178A1, 6 March 2008. [Google Scholar]
- Lopez, C.; Menard, O. Human milk fat globules: Polar lipid composition and in situ structural investigations revealing the heterogeneous distribution of proteins and the lateral segregation of sphingomyelin in the biological membrane. Colloids Surf. B Biointerfaces 2011, 83, 29–41. [Google Scholar] [CrossRef]
- Thompson, A.K.; Haisman, D.; Singh, H. Physical stability of liposomes prepared from milk fat globule membrane and soya phospholipids. J. Agric. Food Chem. 2006, 5, 6390–6397. [Google Scholar] [CrossRef]
- Huang, Z.; Stipkovits, L.; Zheng, H.; Serventi, L.; Brennan, C.S. Bovine milk fats and their replacers in baked goods: A review. Foods 2019, 8, 383. [Google Scholar] [CrossRef]
- Vanderghem, C.; Deroanne, C.; Bodson, P.; Blecker, C. Milk fat globule membrane and buttermilks: From composition to valorization. Biotechnol. Agron. Soc. Environ. 2010, 14, 485–500. [Google Scholar]
- Phan, T.T.Q.; Le, T.T.; Van de Walle, D.; Van der Meeren, P.; Dewettinck, K. Combined effects of milk fat globule membrane polar lipids and protein concentrate on the stability of oil-in-water emulsions. Int. Dairy J. 2016, 52, 42–49. [Google Scholar] [CrossRef]
- Huppertz, T.; Kelly, A. Physical chemistry of milk fat globules. In Advanced Dairy Chemistry Volume 2 Lipids; Springer: New York, NY, USA, 2006; pp. 173–212. [Google Scholar]
- Britten, M.; Lamothe, S.; Robitaille, G. Effect of cream treatment on phospholipids and protein recovery in butter-making process. Int. J. Food Sci. Technol. 2008, 43, 651–657. [Google Scholar] [CrossRef]
- Rombaut, R.; Camp, J.V.; Dewettinck, K. Phospho- and sphingolipid distribution during processing of milk, butter and whey. Int. J. Food Sci. Technol. 2006, 41, 435–443. [Google Scholar] [CrossRef]
- Lamothe, S.; Robitaille, G.; St-Gelais, D.; Britten, M. Butter making from caprine creams: Effect of washing treatment on phospholipids and milk fat globule membrane proteins distribution. J. Dairy Res. 2008, 75, 439–443. [Google Scholar] [CrossRef]
- Morin, P.; Britten, M.; Jimenez-Flores, R.; Pouliot, Y. Microfiltration of buttermilk and washed cream buttermilk for concentration of milk fat globule membrane components. J. Dairy Sci. 2007, 90, 2132–2140. [Google Scholar] [CrossRef]
- Zheng, H.; Jiménez-Flores, R.; Everett, D.W. Bovine milk fat globule membrane proteins are affected by centrifugal washing processes. J. Agric. Food Chem. 2013, 61, 8403–8411. [Google Scholar] [CrossRef]
- Barry, K.M.; Dinan, T.G.; Kelly, P.M. Selective enrichment of dairy phospholipids in a buttermilk substrate through investigation of enzymatic hydrolysis of milk proteins in conjunction with ultrafiltration. Int. Dairy J. 2017, 68, 80–87. [Google Scholar] [CrossRef]
- Rombaut, R.; Dejonckheere, V.; Dewettinck, K. Filtration of milk fat globule membrane fragments from acid buttermilk cheese whey. J. Dairy Sci. 2007, 90, 1662–1673. [Google Scholar] [CrossRef]
- Rombaut, R.; Dewettinck, K. Thermocalcic aggregation of milk fat globule membrane fragments from acid buttermilk cheese whey. J. Dairy Sci. 2007, 90, 2665–2674. [Google Scholar] [CrossRef]
- Levin, M.A.; Burrington, K.J.; Hartel, R.W. Composition and functionality of whey protein phospholipid concentrate and delactosed permeate. J. Dairy Sci. 2016, 99, 6937–6947. [Google Scholar] [CrossRef]
- Costa, M.R.; Elias-Argote, X.E.; Jiménez-Flores, R.; Gigante, M.L. Use of ultrafiltration and supercritical fluid extraction to obtain a whey buttermilk powder enriched in milk fat globule membrane phospholipids. Int. Dairy J. 2010, 20, 598–602. [Google Scholar] [CrossRef]
- Food and Agriculture Organization-World Health Organization. Milk and Milk Products; World Health Organization, Food and Agriculture Organization of the United Nations: Rome, Italy, 2007. [Google Scholar]
- Dairymark. Buttermilk—A Strategic Review of Opportunities and Applications; Shainwright Consulting and Research Group Pty Ltd.: Norwood, Australia, 2007; p. 84. [Google Scholar]
- United States Department of Agriculture. National Nutrient Database for Standard Reference Software v.3.9.5.3; United States Department of Agriculture, Ed.; United States Department of Agriculture: Washington, DC, USA, 1 April 2018. Available online: http://ndb.nal.usda.gov/ndb (accessed on 6 January 2020).
- Konrad, G.; Kleinschmidt, T.; Lorenz, C. Ultrafiltration of whey buttermilk to obtain a phospholipid concentrate. Int. Dairy J. 2013, 30, 39–44. [Google Scholar] [CrossRef]
- Lambert, S.; Leconte, N.; Blot, M.; Rousseau, F.; Robert, B.; Camier, B.; Gassi, J.-Y.; Cauty, C.; Lopez, C.; Gésan-Guiziou, G. The lipid content and microstructure of industrial whole buttermilk and butter serum affect the efficiency of skimming. Food Res. Int. 2016, 83, 121–130. [Google Scholar] [CrossRef]
- Ireland, E.R. Developing a Better Buttermilk Solution. Master’s Thesis, Engineering Management, University of Canterbury, Canterbury, New Zealand, 2014. [Google Scholar]
- Verge, X.P.; Maxime, D.; Dyer, J.A.; Desjardins, R.L.; Arcand, Y.; Vanderzaag, A. Carbon footprint of Canadian dairy products: Calculations and issues. J. Dairy Sci. 2013, 96, 6091–6104. [Google Scholar] [CrossRef]
- Ali, A.H. Current knowledge of buttermilk: Composition, applications in the food industry, nutritional and beneficial health characteristics. Int. J. Dairy Technol. 2018, 72, 169–182. [Google Scholar] [CrossRef]
- Yildiz, N.; Bakirci, I. Investigation of the use of whey powder and buttermilk powder instead of skim milk powder in yogurt production. J. Food Sci. Technol. 2019, 56, 4429–4436. [Google Scholar] [CrossRef]
- Price, N.; Fei, T.; Clark, S.; Wang, T. Extraction of phospholipids from a dairy by-product (whey protein phospholipid concentrate) using ethanol. J. Dairy Sci. 2018, 101, 8778–8787. [Google Scholar] [CrossRef]
- Li, B. Selective Extraction of Phospholipids from Dairy Powders Using Supercritical Fluid Extraction. Ph.D. Thesis, Kansas State University, Manhattan, KS, USA, 2017. [Google Scholar]
- Spence, A.J.; Jimenez-Flores, R.; Qian, M.; Goddik, L. Phospholipid enrichment in sweet and whey cream buttermilk powders using supercritical fluid extraction. J. Dairy Sci. 2009, 92, 2373–2381. [Google Scholar] [CrossRef]
- Fauquant, J.; Beaucher, E.; Sinet, C.; Robert, B.; Lopez, C. Combination of homogenization and cross-flow microfiltration to remove microorganisms from industrial buttermilks with an efficient permeation of proteins and lipids. Innov. Food Sci. Emerg. Technol. 2014, 21, 131–141. [Google Scholar] [CrossRef]
- Thompson, A. Structure and Properties of Liposomes Prepared from Milk Phospholipids. Ph.D. Thesis, Massey University, Palmerston North, New Zealand, 2005. [Google Scholar]
- Li, Z. Encapsulation of Bioactive Salmon Protein Hydrolysates with Chitosan-Coated Liposomes. Master’s Thesis, Master of Science, Dalhousie University, Halifax, NS, Canada, 2014. [Google Scholar]
- Sokol, E.; Ulven, T.; Faergeman, N.J.; Ejsing, C.S. Comprehensive and quantitative profiling of lipid species in human milk, cow milk and a phospholipid-enriched milk formula by GC and MS/MS(ALL). Eur. J. Lipid Sci. Technol. 2015, 117, 751–759. [Google Scholar] [CrossRef]
- Arla Foods Ingredients: Ingredients for the Next Generation. Available online: https://www.foodingredientsfirst.com/supplier-profiles/Arla-Foods-Ingredients.html (accessed on 27 February 2020).
- Tatua Specialty Nutritional Ingredients: Phospholipids. Available online: https://www.tatua.com/specialty-nutritionals-ingredients/phospholipids/ (accessed on 1 January 2020).
- Moukarzel, S. The Complexity of Understanding Human Milk Components and Infant Brain Development. Ph.D. Thesis, Human Nutrition, University of British Columbia, Vancouver, BC, Canada, 2016. [Google Scholar]
- Lecico Milk Phospholipids. Available online: http://www.lecico.de/en/products/milk-phospholipids (accessed on 23 January 2020).
- Fletcher, K.; Catchpole, O.; Grey, J.B.; Pritchard, M. Beta-Serum Dairy Products, Neutral Lipid-Depleted and/or Polar Lipid-Enriched Dairy Products, and Processes for Their Production. U.S. Patent Application No. 8471002B2, 25 June 2013. [Google Scholar]
- Meggle. Composition Richly Containing Polar Lipid and Method of Manufacturing the Same. E.P. Patent Application No. 2168438A1, 31 March 2010.
- Catchpole, O.J.; Tallon, S.J. Process for Separation Lipid Materials. W.O. Patent Application No. 123424A1, 20 April 2007. [Google Scholar]
- Dalemans, D.; Blecker, C.; Bodson, P.; Danthine, S.; Deroanne, C.; Paquot, M. Milk Ingredient Enriched in Polar Lipids and Uses Thereof. U.S. Patent Application No. 0068293A1, 18 March 2010. [Google Scholar]
- Dwwettinck, K.; Boone, M. Method for Obtaining Products Enriched in Phospho- and Sphingolipids. W.O. Patent Application No. 0234062A1, 2 May 2002. [Google Scholar]
- Gnanasambandam, R.; Patel, H. Methods of Concentrating Phospholipds. U.S. Patent Application No. 0335778A1, 7 November 2018. [Google Scholar]
- Sato, I. Method of Separation and Recovery of Lipid in Membrane Material of Fat Globule. JP Patent Application No. 336230A, 8 December 2005. [Google Scholar]
- Suzuki, A.; Shioda, M.; Imai, M. Manufacturing Method of Sphingoid Base-Containing Extract. JP Patent Application No. 052912A, 29 August 2018. [Google Scholar]
- Bruecher, T.; Demey, J.; Katte, M.; Molnar, J.; Tirok, S. Method for the Fractionation of Phospholipids from Phospholipid-Containing Material. U.S. Patent Application No. 9567356B2, 14 February 2017. [Google Scholar]
- Nyberg, L.; Burling, H. Method for Extracting Sphingomyelin. U.S. Patent Application No. 5677472, 14 October 1997. [Google Scholar]
- Dewettinck, K.; Rombaut, R.; Thienpont, N.; Le, T.T.; Messens, K.; Van Camp, J. Nutritional and technological aspects of milk fat globule membrane material. Int. Dairy J. 2008, 18, 436–457. [Google Scholar] [CrossRef]
- Lu, J.; Argov-Argama, N.; Anggrek, J.; Boeren, S.; Hooijdonk, T.V.; Vervoort, J.; Hetting, K.A. The protein and lipid composition of the membrane of milk fat globules depends on their size. J. Dairy Sci. 2016, 99, 4726–4738. [Google Scholar] [CrossRef] [PubMed]
- Jing, L. The Biology of Milk Synthesis from a Proteomics Perspective. Ph.D. Thesis, Wageningen University, Wageningen, Holland, 2013. [Google Scholar]
- Bezelgues, J.B.; Morgan, F.; Palomo, G.; Crosset-Perrotin, L.; Ducret, P. Short communication: Milk fat globule membrane as a potential delivery system for liposoluble nutrients. J. Dairy Sci. 2009, 92, 2524–2528. [Google Scholar] [CrossRef] [PubMed]
- Holzmüller, W.; Müller, M.; Himbert, D.; Kulozik, U. Impact of cream washing on fat globules and milk fat globule membrane proteins. Int. Dairy J. 2016, 59, 52–61. [Google Scholar] [CrossRef]
- Spitsberg, V.L.; Ivanov, L.; Shritz, V. Recovery of milk fat globule membrane (MFGM) from buttermilk: Effect of Ca-binding salts. J. Dairy Res. 2019, 86, 374–376. [Google Scholar] [CrossRef]
- Holzmüller, W.; Kulozik, U. Isolation of milk fat globule membrane (MFGM) material by coagulation and diafiltration of buttermilk. Int. Dairy J. 2016, 63, 88–91. [Google Scholar] [CrossRef]
- Hansen, S.F.; Hogan, S.A.; Tobin, J.; Rasmussen, J.T.; Larsen, L.B.; Wiking, L. Microfiltration of raw milk for production of high-purity milk fat globule membrane material. J. Food Eng. 2020, 276, 109887. [Google Scholar] [CrossRef]
- Bourlieua, C.; Cheillan, D.; Blota, M.; Daira, P.; Trauchessec, M.; Ruet, S.; Gassi, J.-Y.; Beaucher, E.; Robert, B.; Leconte, N.; et al. Polar lipid composition of bioactive dairy co-products buttermilk and butterserum: Emphasis on sphingolipid and ceramide isoforms. Food Chem. 2018, 240, 67–74. [Google Scholar] [CrossRef]
- Cheema, M.; Smith, P.B.; Patterson, A.D.; Hristov, A.; Hart, F.M. The association of lipophilic phospholipids with native bovine casein micelles in skim milk: Effect of lactation stage and casein micelle size. J. Dairy Sci. 2017, 101, 8672–8687. [Google Scholar] [CrossRef]
- Gallier, S.; Gragson, D.; Cabral, C.; Jimenez-Flores, R.; Everett, D.W. Composition and fatty acid distribution of bovine milk phospholipids from processed milk products. J. Agric. Food Chem. 2010, 58, 10503–10511. [Google Scholar] [CrossRef]
- Claumarchirant, L.; Cilla, A.; Matencio, E.; Sanchez-Siles, L.M.; Castro-Gomez, P.; Fontecha, J.; Alegría, A.; Lagarda, M.J. Addition of milk fat globule membrane as an ingredient of infant formulas for resembling the polar lipids of human milk. Int. Dairy J. 2016, 61, 228–238. [Google Scholar] [CrossRef]
- Ferreiro, T.; Martínez, S.; Gayoso, L.; Rodríguez-Otero, J.L. Evolution of phospholipid contents during the production of quark cheese from buttermilk. J. Dairy Sci. 2016, 99, 4154–4159. [Google Scholar] [CrossRef] [PubMed]
- Barry, K.M.; Dinan, T.G.; Murray, B.A.; Kelly, P.M. Comparison of dairy phospholipid preparative extraction protocols in combination with analysis by high performance liquid chromatography coupled to a charged aerosol detector. Int. Dairy J. 2016, 56, 179–185. [Google Scholar] [CrossRef]
- Rodríguez-Alcal, L.M.; Castro-Gomez, P.; Felipe, X.; Noriega, L.; Fontecha, J. Effect of processing of cowmilk by high pressures under conditions up to 900 MPa on the composition of neutral, polar lipids and fatty acids. LWT Food Sci. Technol. 2015, 62, 265–270. [Google Scholar] [CrossRef]
- Zou, X.; Guo, Z.; Jin, Q.; Huang, J.; Cheong, L.; Xu, X.; Wang, X. Composition and microstructure of colostrum and mature bovine milk fat globule membrane. Food Chem. 2015, 185, 362–370. [Google Scholar] [CrossRef]
- Haddadian, Z.; Eyres, G.T.; Bremer, P.; Everett, D.W. Polar lipid composition of the milk fat globule membrane in buttermilk made using various cream churning conditions or isolated from commercial samples. Int. Dairy J. 2018, 81, 138–142. [Google Scholar] [CrossRef]
- Walczak, J.; Pomastowski, P.; Bocian, S.; Buszewski, B. Determination of phospholipids in milk using a new phosphodiester stationary phase by liquid chromatography-matrix assisted desorption ionization mass spectrometry. J. Chromatogr. A 2016, 1432, 39–48. [Google Scholar] [CrossRef]
- Vilamarim, R.; Bernardo, J.; Videira, R.A.; Valentão, P.; Veiga, F.; Andrade, P.B. An egg yolk’s phospholipid-pennyroyal nootropic nanoformulation modulates monoamino oxidase-A (MAO-A) activity in SH-SY5Y neuronal model. J. Funct. Foods 2018, 46, 335–344. [Google Scholar] [CrossRef]
- Kala, R.; Samková, E.; Pecová, L.; Hanuš, O.; Sekmokas, K.; Riaukienė, D. An overview of determination of milk fat: Development, quality control measures, and application. Acta Univ. Agric. Silvic. Mendel. Brun. 2018, 66, 1055–1064. [Google Scholar] [CrossRef]
- Shrestha, P.; Davis, D.A.; Veeranna, R.P.; Carey, R.F.; Viollet, C.; Yarchoan, R. Hypoxia-inducible factor-1 alpha as a therapeutic target for primary effusion lymphoma. PLoS Pathog. 2017, 13, e1006628. [Google Scholar] [CrossRef]
- Hickey, C.D.; Diehl, B.W.K.; Nuzzo, M.; Millqvist-Feurby, A.; Wilkinson, M.G.; Sheehana, J.J. Influence of buttermilk powder or buttermilk addition on phospholipid content, chemical and bio-chemical composition and bacterial viability in Cheddar style-cheese. Food Res. Int. 2017, 102, 748–758. [Google Scholar] [CrossRef] [PubMed]
- Xu, S.; Walkling-Ribeiro, M.; Griffiths, M.W.; Corredig, M. Pulsed electric field processing preserves the antiproliferative activity of the milk fat globule membrane on colon carcinoma cells. J. Dairy Sci. 2015, 98, 2867–2874. [Google Scholar] [CrossRef] [PubMed]
- Rodríguez-Alcalá, L.M.; Fontecha, J. Major lipid classes separation of buttermilk, and cows, goats and ewes milk by high performance liquid chromatography with an evaporative light scattering detector focused on the phospholipid fraction. J. Chromatogr. A 2010, 1217, 3063–3066. [Google Scholar] [CrossRef] [PubMed]
- Cheng, S.; Rathnakumar, K.; Martinez-Monteagudo, S.I. Extraction of dairy phospholipids using switchable solvents: A feasibility study. Foods 2019, 8, 265. [Google Scholar] [CrossRef]
- Hutton, K.J.; Guymon, J.S. Process for Producing Deoiled Phosphatides. CA Patent Application No. 2354705, 20 October 2009. [Google Scholar]
- Ota, M.; Oda, E.; Kataoka, S.; Sato, Y.; Inomata, H. Supercritical fluid extraction of high-value natural products from buttermilk analyzed by a dynamic extraction model. Nippon Shokuhin Kagaku Kogaku Kaishi 2018, 65, 251–258. [Google Scholar] [CrossRef]
- Barry, K.M.; Dinan, T.G.; Kellya, P.M. Pilot scale production of a phospholipid-enriched dairy ingredient by means of an optimised integrated process employing enzymatic hydrolysis, ultrafiltration and super-critical fluid extraction. Innov. Food Sci. Emerg. Technol. 2017, 41, 301–306. [Google Scholar] [CrossRef]
- Catchpole, O.J.; Tallon, S.J.; Grey, J.B.; Fletcher, K.; Fletcher, A.J. Extraction of lipids from a specialist dairy stream. J. Supercritic. Fluids 2008, 45, 314–321. [Google Scholar] [CrossRef]
- Astaire, J.C.; Ward, R.; German, J.B.; Jiménez-Flores, R. Concentration of polar MFGM lipids from buttermilk by microfiltration and supercritical fluid extraction. J. Dairy Sci. 2003, 86, 2297–2307. [Google Scholar] [CrossRef]
- Tomasula, P.M.; Bonnaillie, L.M. Crossflow microfiltration in the dairy industry. In Emerging Dairy Processing Technologies, 1st ed.; Datta, N., Tomasula, P., Eds.; John Wiley & Sons, Ltd.: Oxford, UK, 2015; pp. 1–32. [Google Scholar]
- Pimentel, L.; Gomes, A.; Pintado, M.; Rodríguez-Alcalá, L.M. Isolation and analysis of phospholipids in dairy foods. J. Analytic. Methods Chem. 2016, e9827369, 1–12. [Google Scholar] [CrossRef] [PubMed]
- Kim, S.-H.; Min, C.-S. Fouling reduction using the resonance vibration in membrane separation of whole milk. J. Indust. Eng. Chem. 2019, 75, 123–129. [Google Scholar] [CrossRef]
- Sachdeva, S.; Buchheim, W. Recovery of phospholipids from buttermilk using membrane processing. Kieler Milchwirtsch. Forsch. 1997, 49, 47–68. [Google Scholar]
- ISO 14044:2006(en) Environmental Management—Life Cycle Assessment—Requirements and Guidelines. Available online: https://www.iso.org/obp/ui/#iso:std:iso:14044:ed-1:v1:en (accessed on 27 February 2020).
- Famiglietti, J.; Guerci, M.; Proserpio, C.; Ravaglia, P.; Motta, M. Development and testing of the product environmental footprint milk tool: A comprehensive LCA tool for dairy products. Sci. Total Environ. 2019, 648, 1614–1626. [Google Scholar] [CrossRef] [PubMed]
- International Standard Organization. Greenhouse Gases—Carbon Footprint of Products—Requirements and Guidelines for Quantification; International Standard Organization: Geneva, Switzerland, 2018; pp. 1–11. [Google Scholar]
- Intergovernmental Panel on Climate Change. Guidelines for National Greenhouse Gas Inventories. Volume 4: Agriculture, Forestry and Other Land Use; Intergovernmental Panel on Climate Change: New York, NY, USA, 2006; p. 132. [Google Scholar]
- Verge, X.P.; Dyer, J.A.; Worth, D.E.; Smith, W.N.; Desjardins, R.L.; McConkey, B.G. A greenhouse gas and soil carbon model for estimating the carbon footprint of livestock production in Canada. Animals (Basel) 2012, 2, 437–454. [Google Scholar] [CrossRef] [PubMed]
- Dyer, J.A.; Desjardins, R.L. Simulated farm fieldwork, energy consumption and related greenhouse gas emissions in Canada. Biosys. Eng. 2003, 85, 503–513. [Google Scholar] [CrossRef]
- Feitz, A.J.; Lundie, S.; Dennien, G.; Morain, M.; Jones, M. Generation of an industry-specific physico-chemical allocation matrix. Application in the dairy industry and implications for systems analysis (9 pp). Int. J. Life Cycle Assess. 2005, 12, 109–117. [Google Scholar] [CrossRef]
- Mercier-Bouchard, D.; Benoit, S.; Doyen, A.; Britten, M.; Pouliot, Y. Process efficiency of casein separation from milk using polymeric spiral-wound microfiltration membranes. J. Dairy Sci. 2017, 100, 8838–8848. [Google Scholar] [CrossRef]
- Ang, B.W.; Su, B. Carbon emission intensity in electricity production: A global analysis. Energy Policy 2016, 94, 56–63. [Google Scholar] [CrossRef]
- Azapagic, A. CCaLC BIOCHEM V3.0 Carbon Footprint Calculator (Database of Ecoinvent 3), Funded by the Carbon Trust, EPSRC and NERC (Grant Number EP/F003501/1); The University of Manchester: Manchester, UK, 9 January 2013. [Google Scholar]
- Matzen, M.; Demirel, Y. Methanol and dimethyl ether from renewable hydrogen and carbon dioxide: Alternative fuels production and life-cycle assessment. J. Clean. Prod. 2016, 139, 1068–1077. [Google Scholar] [CrossRef]
- Albarelli, J.Q.; Santos, D.T.; Cocero, M.J.; Meireles, M.A.A. Perspectives on the integration of a supercritical fluid extraction plant to a sugarcane biorefinery: Thermo-economical evaluation of CO2 recycle systems. Food Sci. Technol. 2017, 38, 13–18. [Google Scholar] [CrossRef]
- Natolino, A. Application of Supercritical Fluids Technology on Winery by-Products. Ph.D. Thesis, University of Udine, Udine, Italy, 2016. [Google Scholar]
- Methot-Hains, S.; Benoit, S.; Bouchard, C.; Doyen, A.; Bazinet, L.; Pouliot, Y. Effect of transmembrane pressure control on energy efficiency during skim milk concentration by ultrafiltration at 10 and 50 degrees C. J. Dairy Sci. 2016, 99, 8655–8664. [Google Scholar] [CrossRef]
- Zhao, R.; Xu, Y.; Wen, X.; Zhang, N.; Cai, J. Carbon footprint assessment for a local branded pure milk product: A lifecycle based approach. Food Sci. Technol. 2017, 38, 98–105. [Google Scholar] [CrossRef]
- Berlina, J. Environmental life cycle assessment (LCA) of Swedish semi-hard cheese. Int. Dairy J. 2002, 12, 939–953. [Google Scholar] [CrossRef]
© 2020 by the authors. Licensee MDPI, Basel, Switzerland. This article is an open access article distributed under the terms and conditions of the Creative Commons Attribution (CC BY) license (http://creativecommons.org/licenses/by/4.0/).