Optimization of the Enzymatic Protein Hydrolysis of By-Products from Seabream (Sparus aurata) and Seabass (Dicentrarchus labrax), Chemical and Functional Characterization


Abstract
:1. Introduction
2. Materials and Methods
2.1. Seabream and Seabass By-Products
2.2. Optimization of Enzyme Hydrolysis
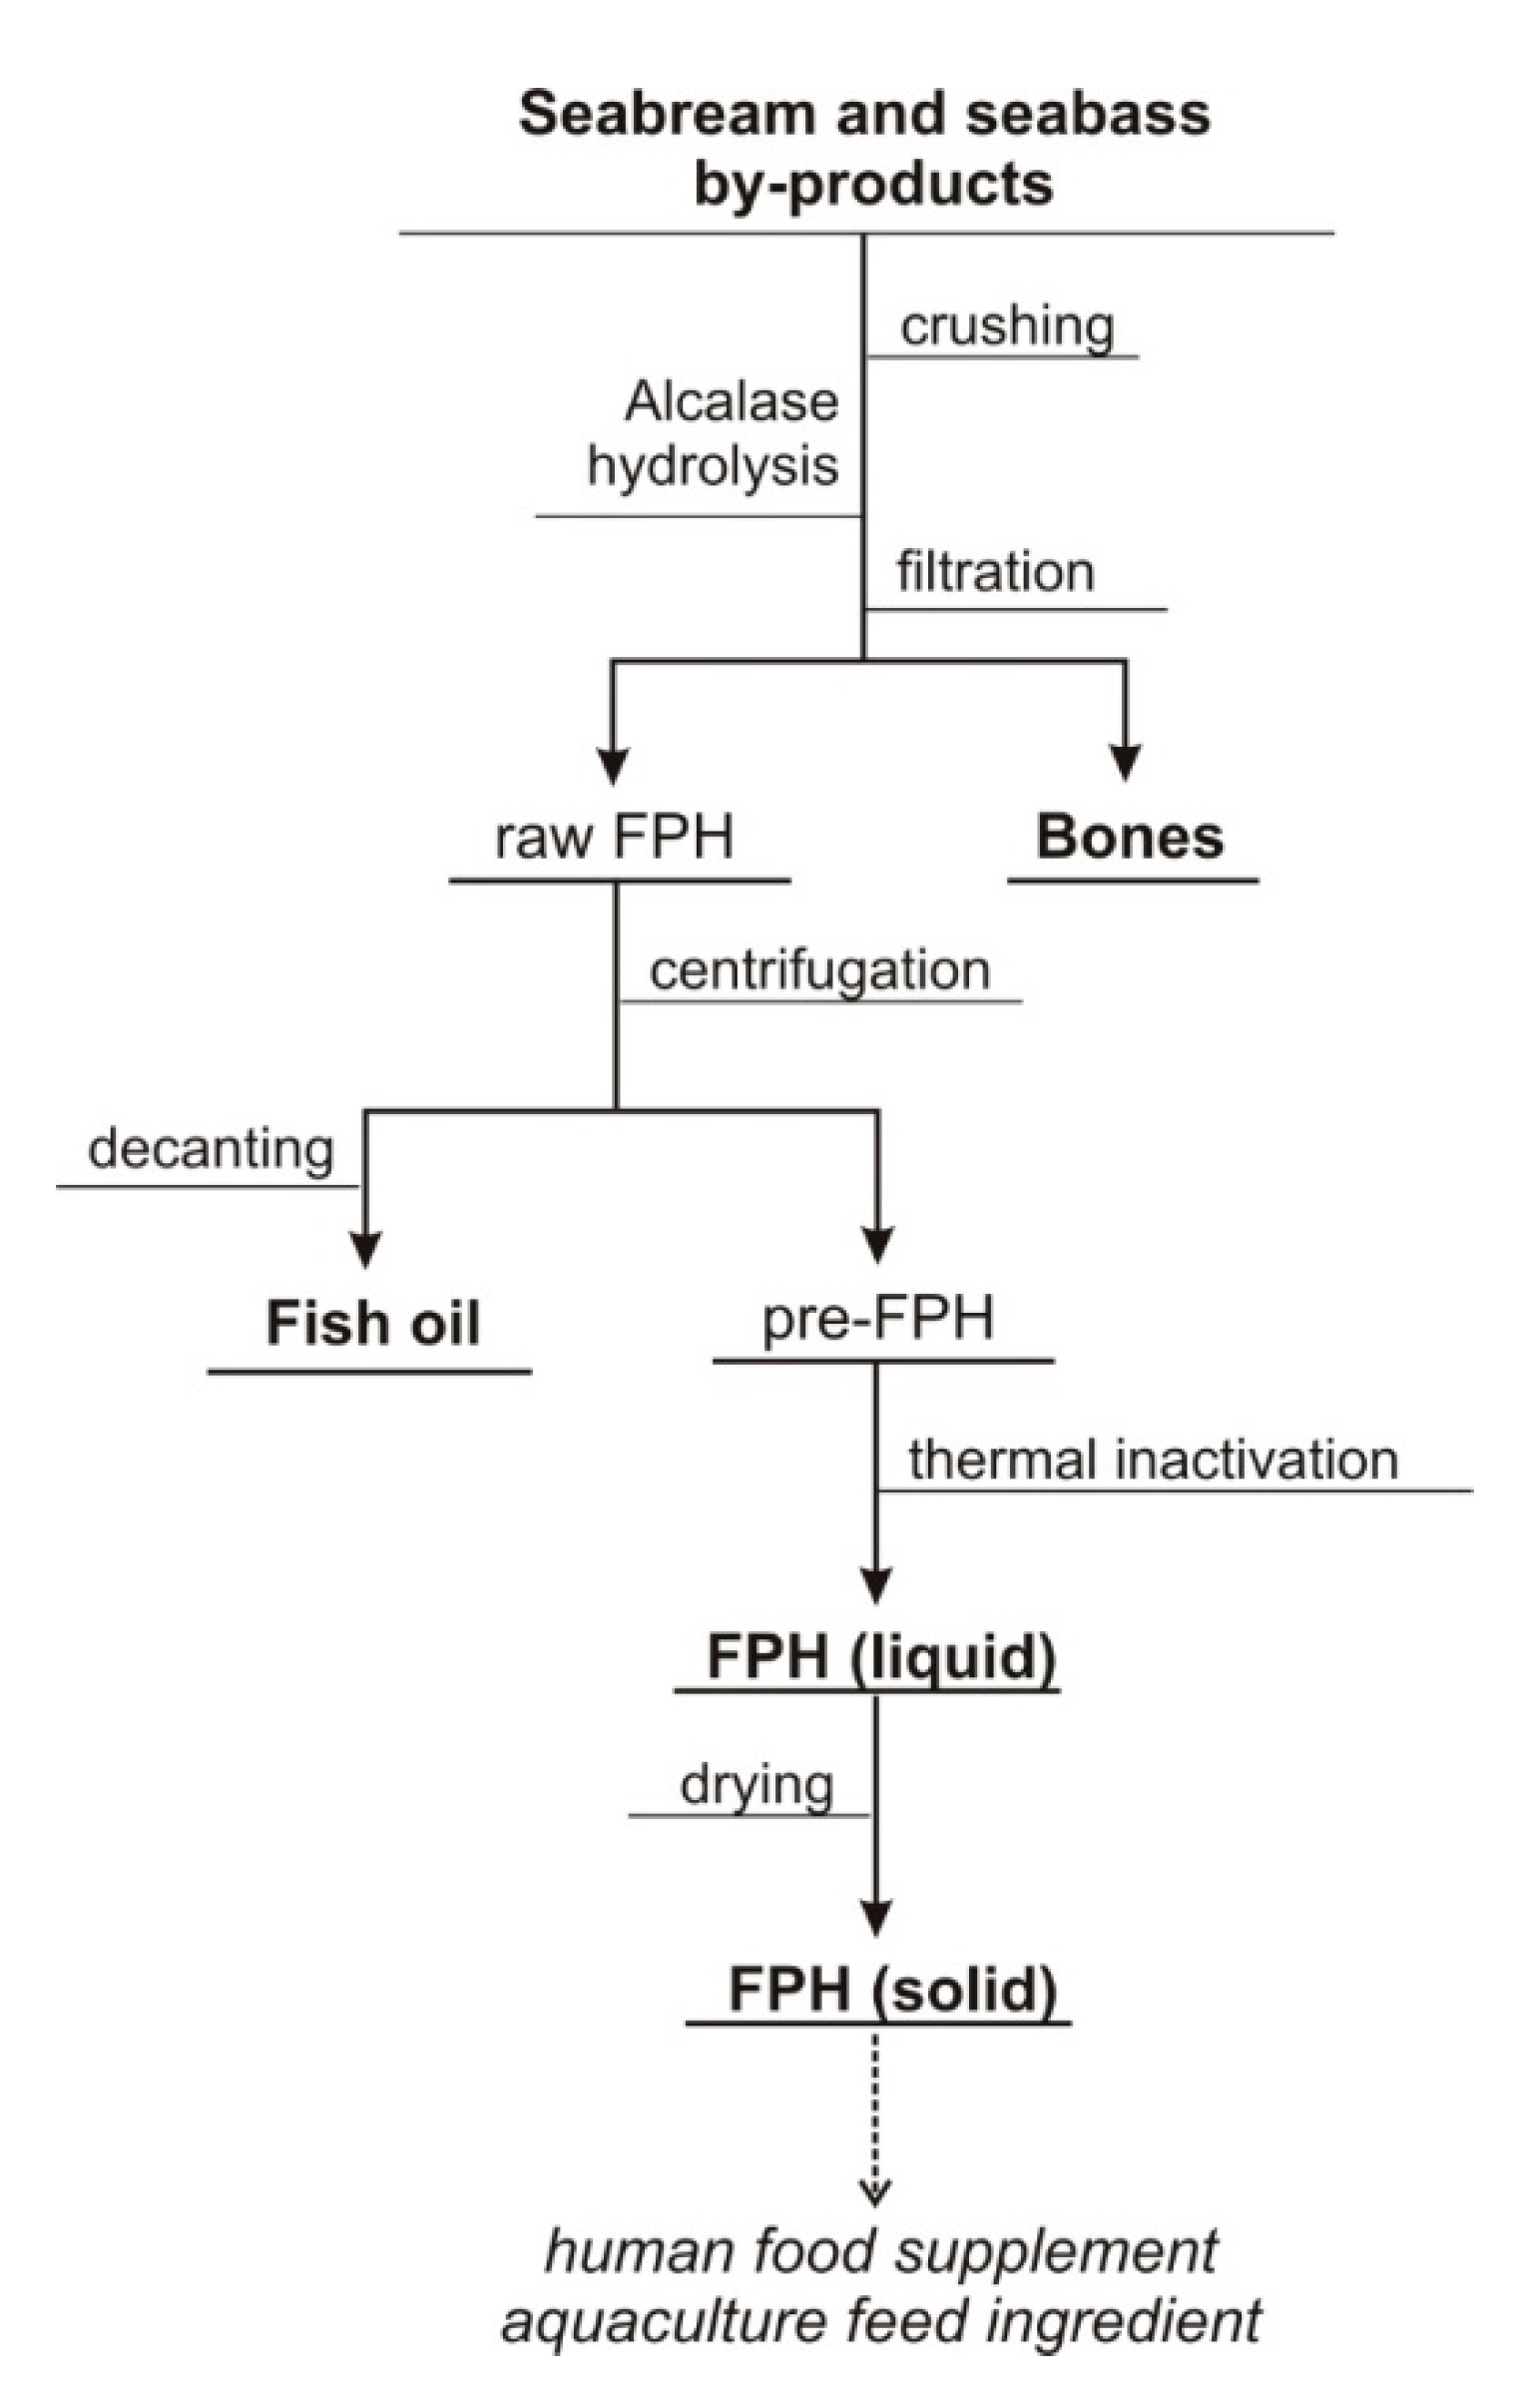
2.3. Production of Enzymatic Hydrolysates
2.4. Chemical and Biological Analyses of Substrates and Bioproducts Obtained
2.5. Numerical and Statistical Analyses
3. Results and Discussion
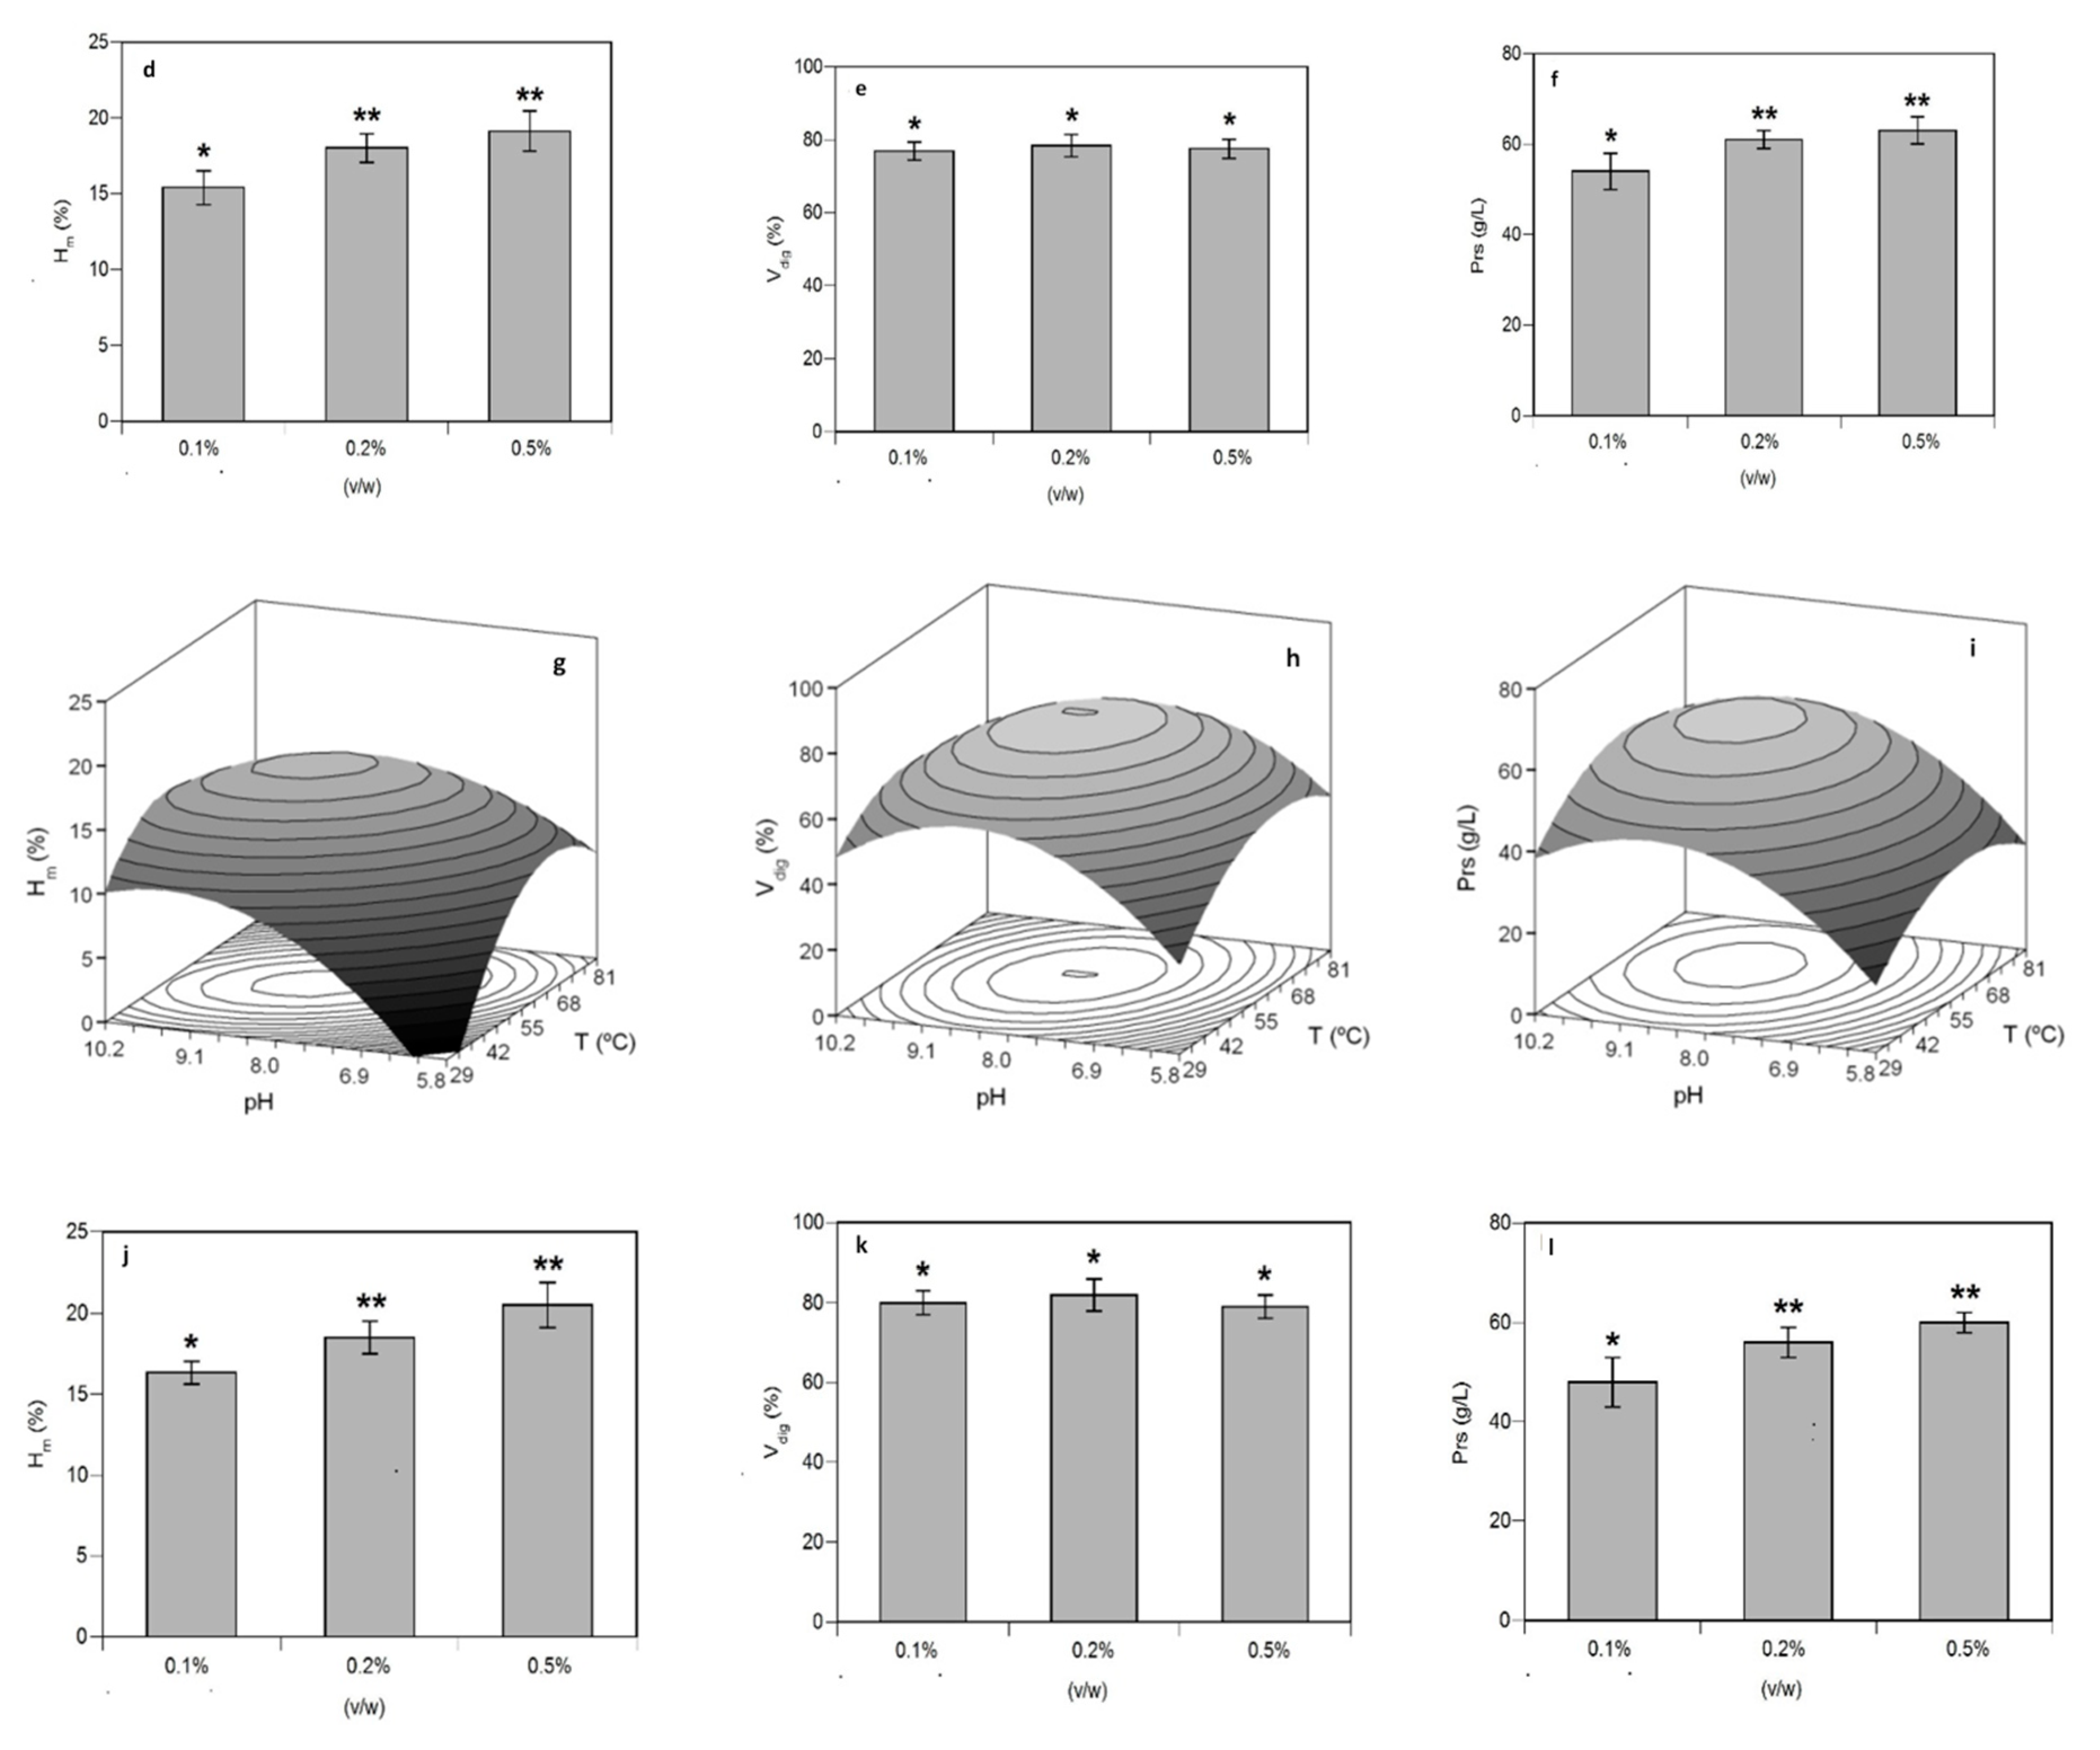
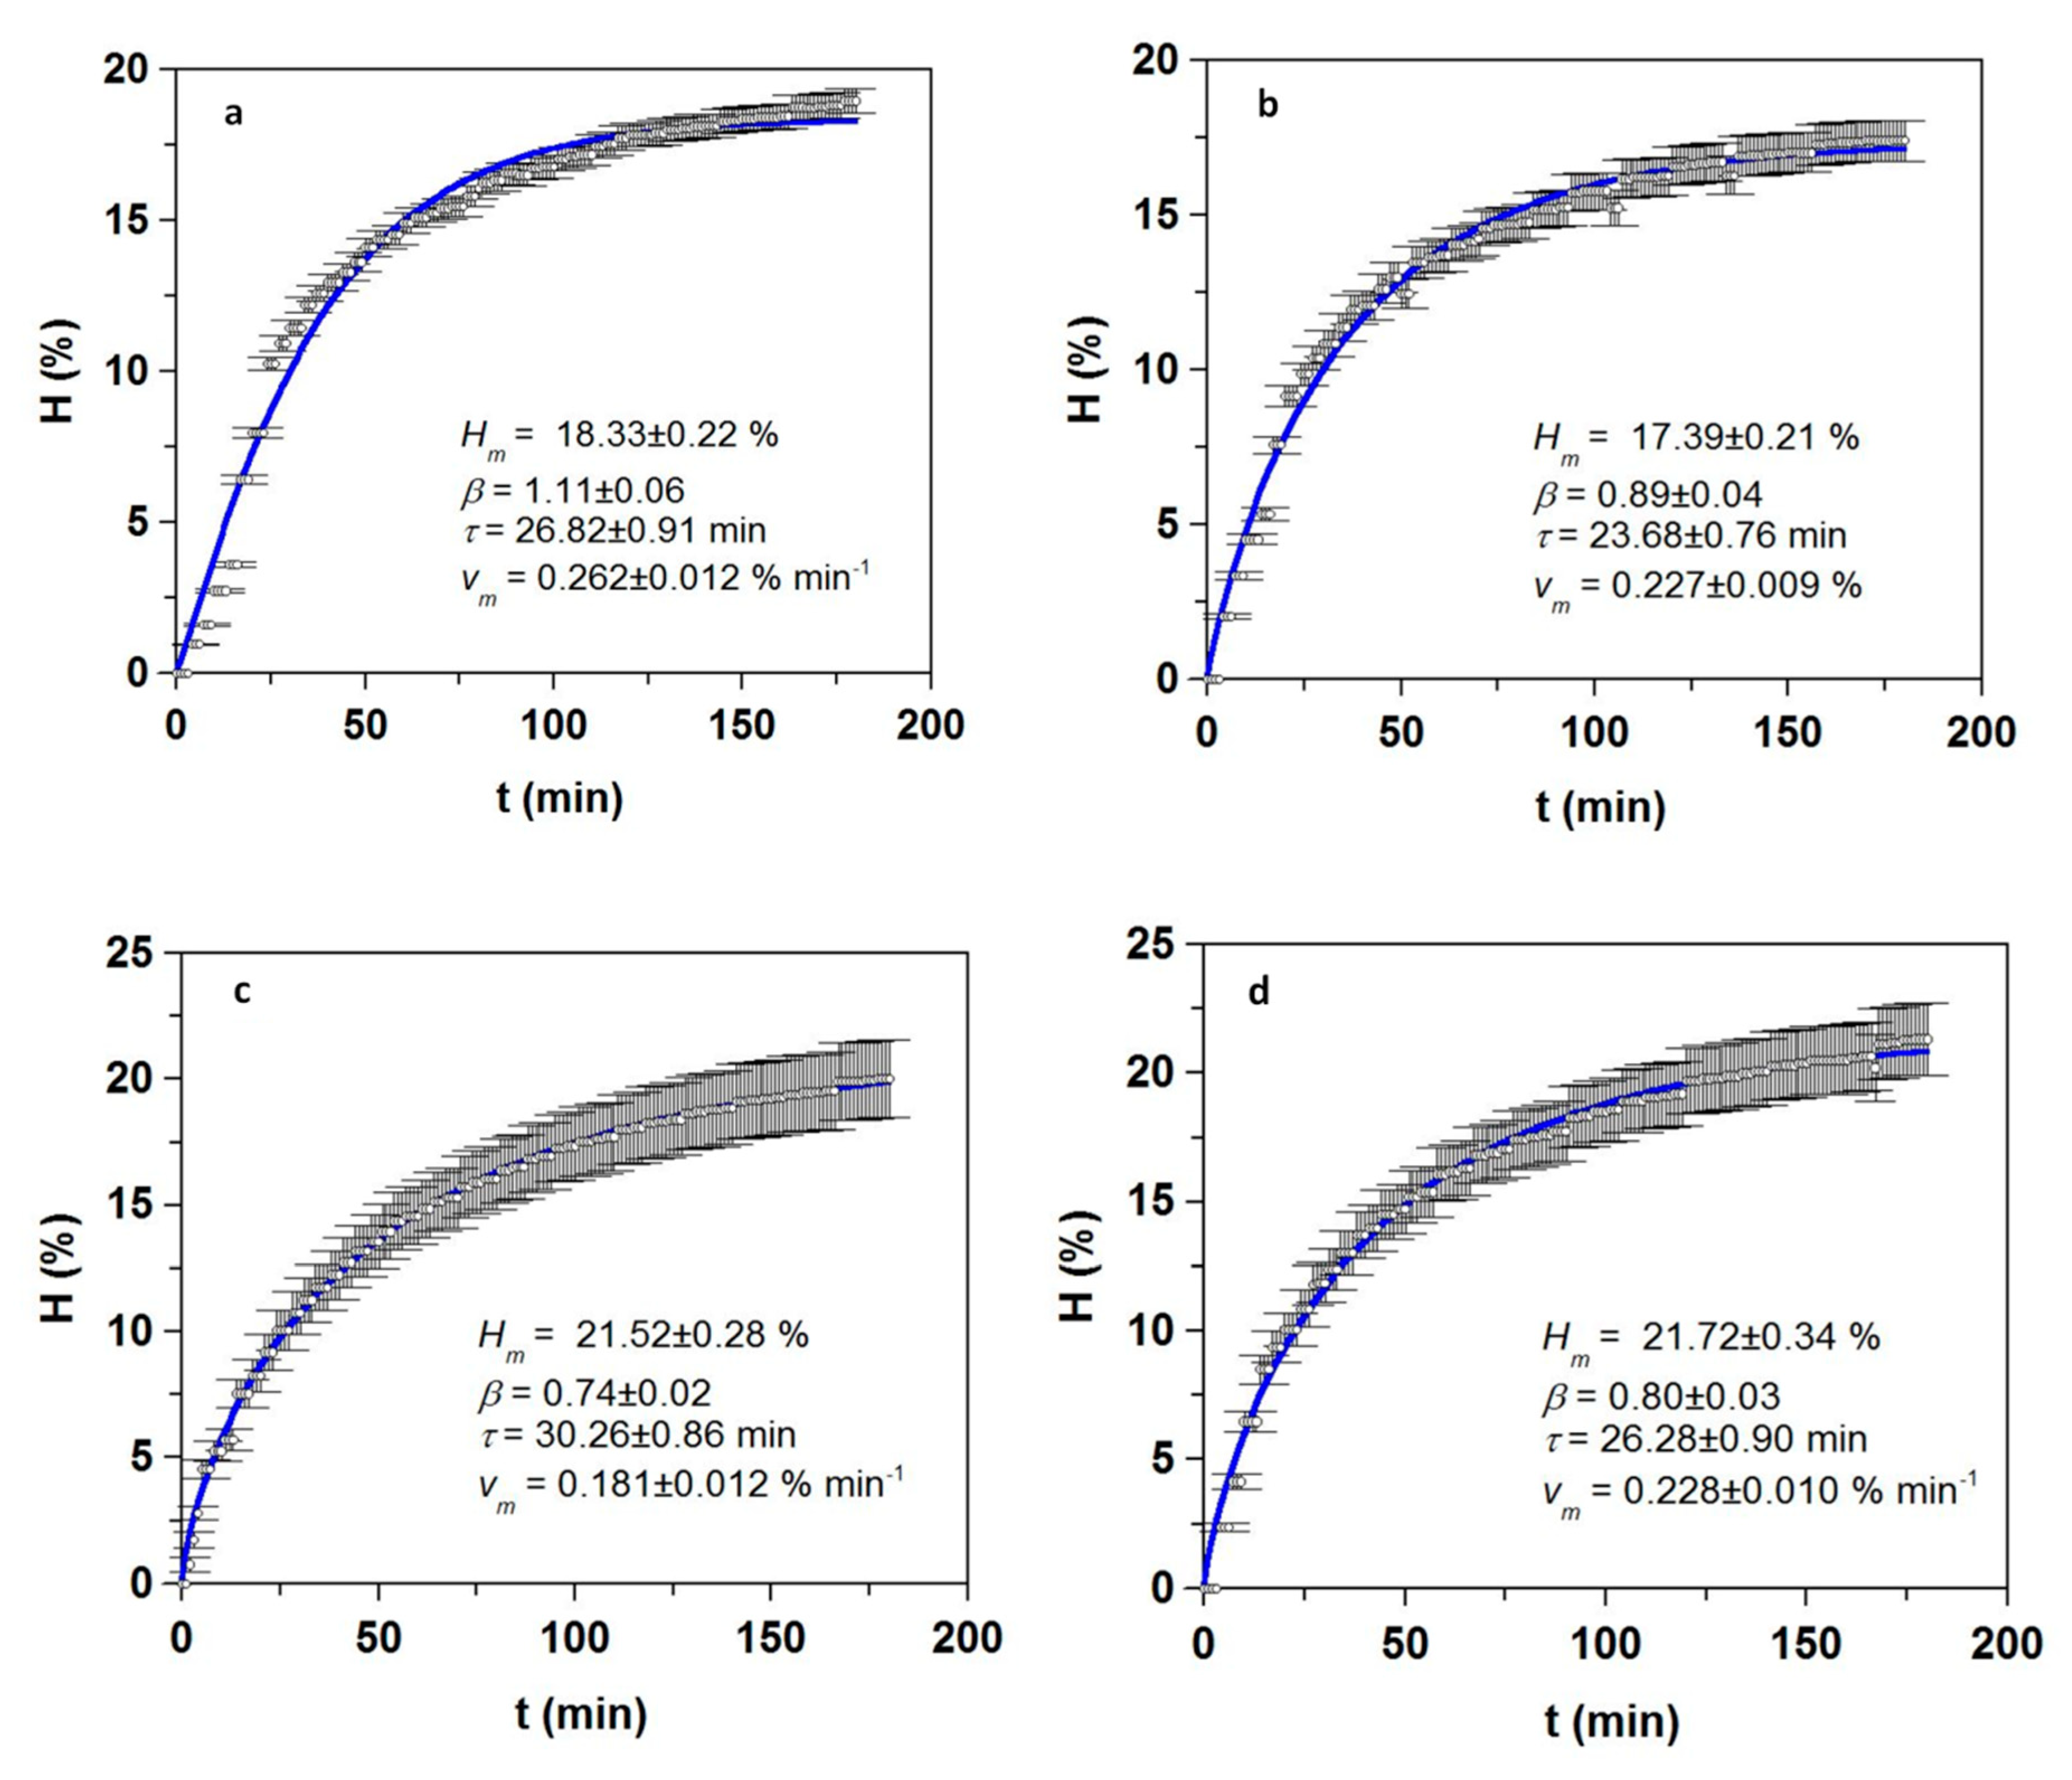
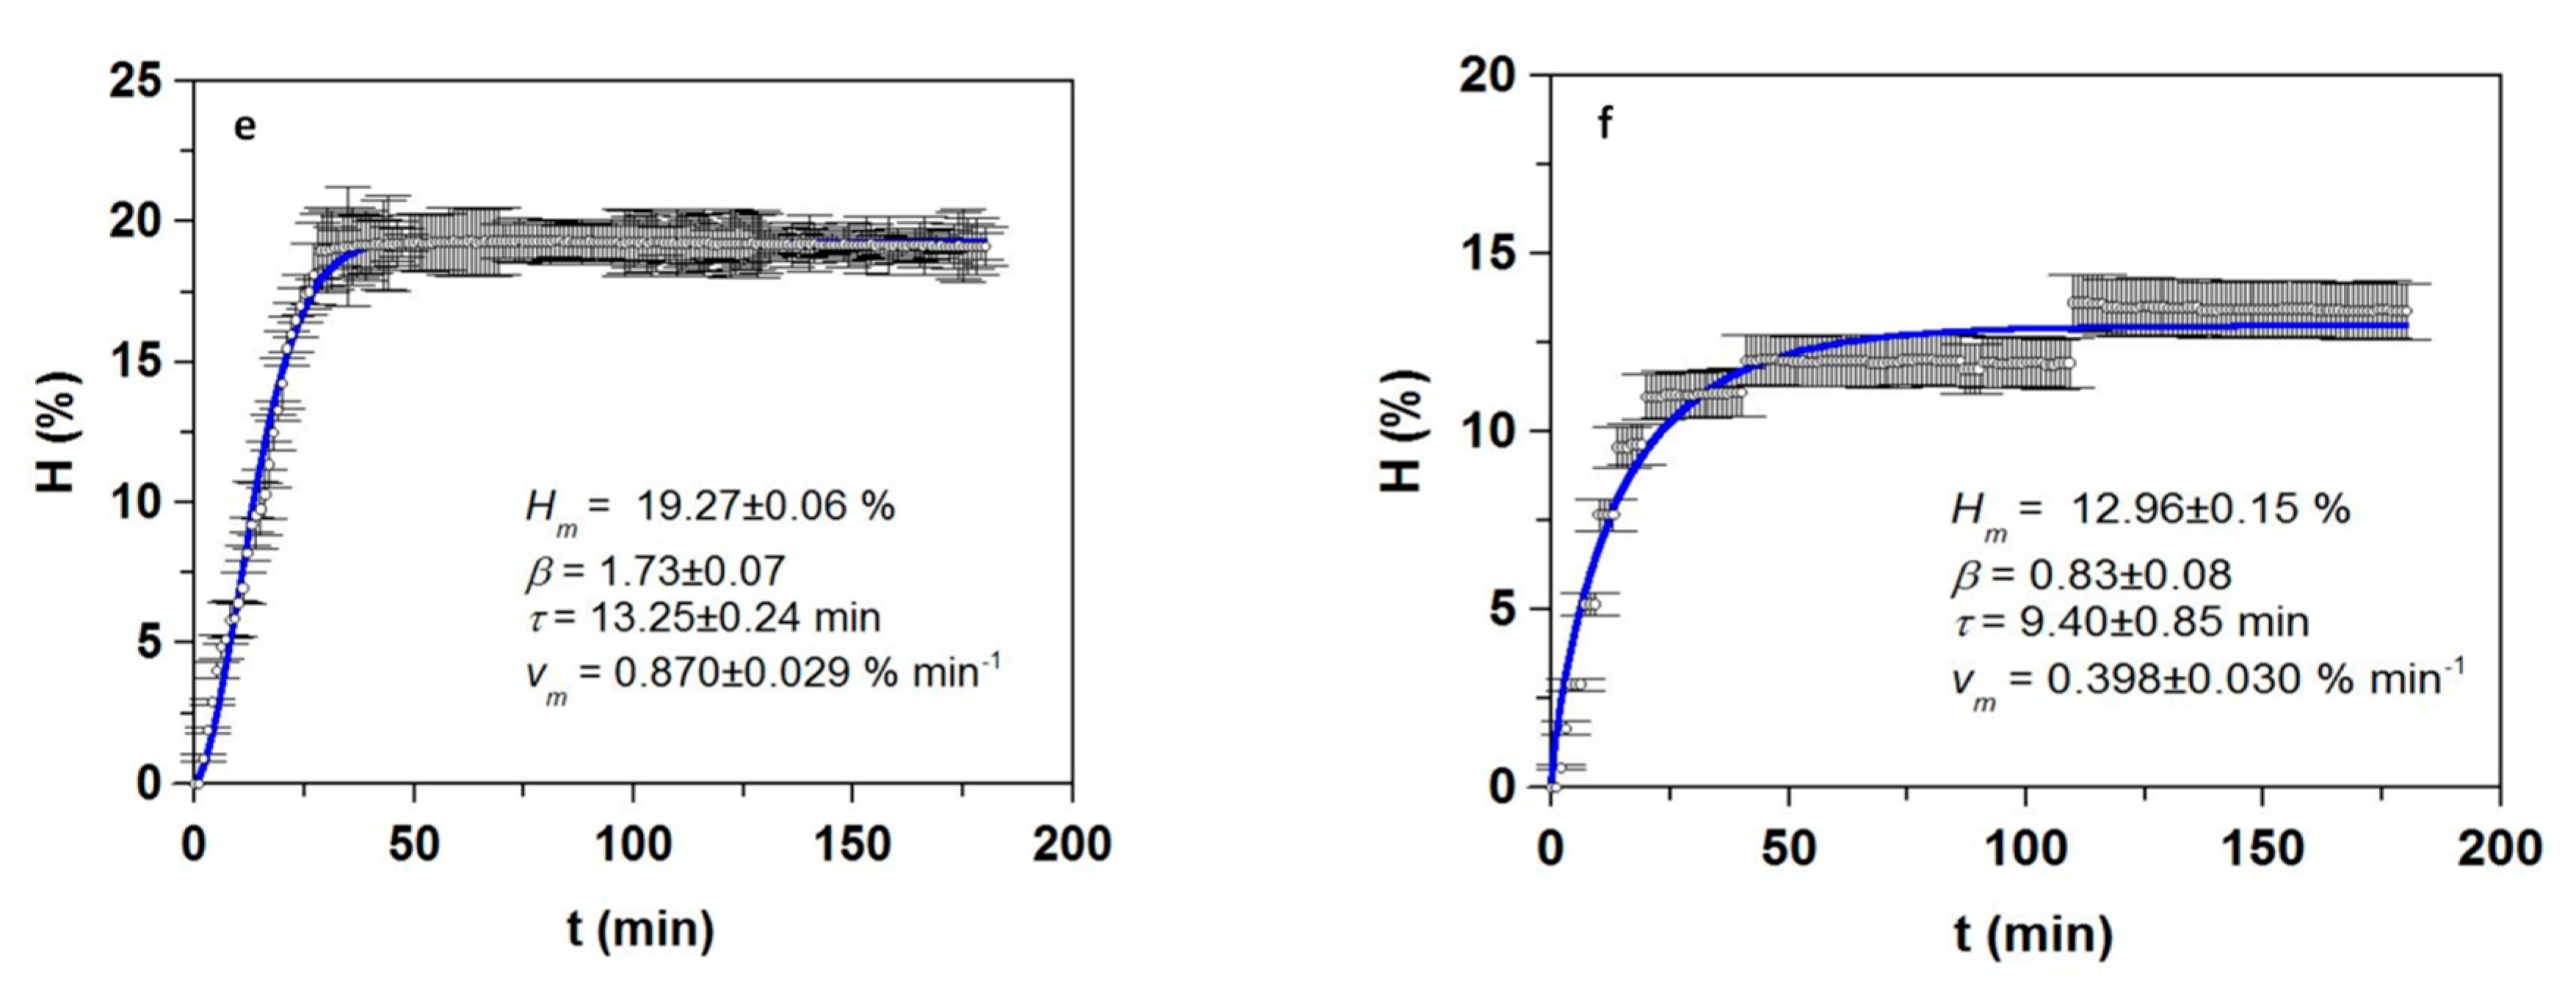
3.1. Optimization of Proteolysis and FPH Production
3.2. Chemical Characterization
3.3. Antioxidant and Antihypertensive Activities of FPHs
4. Conclusions
Supplementary Materials
Author Contributions
Funding
Acknowledgments
Conflicts of Interest
References
- FAO. The State of World Fisheries and Aquaculture 2018-Meeting the Sustainable Development Goals; Licence CC BY-NC-SA 3.0 IGO; FAO: Rome, Italy, 2018. [Google Scholar]
- FAO. Fishery Statistical Collections—Global Capture Production; FAO: Rome, Italy, 2017. [Google Scholar]
- FAO. GLOBEFISH Highlights April 2019 ISSUE, with Jan.–Dec. 2018 Statistics—A Quarterly Update on World Seafood Markets; Globefish Highlights No. 2-2019. CC BY-NC-SA 3.0 IGO; FAO: Rome, Italy, 2019. [Google Scholar]
- Station, T.R. Yield and Nutritional Value of the Commercially More Important Fish Species; Food & Agriculture Organization: Rome, Italy, 1989; ISBN 9251028702. [Google Scholar]
- Yenmak, S.; Joerakate, W.; Poompuang, S. Prediction of fillet yield in hatchery populations of Asian sea bass, Lates calcarifer (Bloch, 1790) using body weight and measurements. Int. Aquat. Res. 2018, 10, 253–261. [Google Scholar] [CrossRef] [Green Version]
- Pateiro, M.; Munekata, P.E.S.; Domínguez, R.; Wang, M.; Barba, F.J.; Bermúdez, R.; Lorenzo, J.M. Nutritional Profiling and the Value of Processing By-Products from Gilthead Sea Bream (Sparus aurata). Mar. Drugs 2020, 18, 101. [Google Scholar] [CrossRef] [PubMed] [Green Version]
- Munekata, P.E.S.; Pateiro, M.; Domínguez, R.; Zhou, J.; Barba, F.J.; Lorenzo, J.M. Nutritional Characterization of Sea Bass Processing By-Products. Biomolecules 2020, 10, 232. [Google Scholar] [CrossRef] [PubMed] [Green Version]
- Chalamaiah, M.; Dinesh kumar, B.; Hemalatha, R.; Jyothirmayi, T. Fish protein hydrolysates: Proximate composition, amino acid composition, antioxidant activities and applications: A review. Food Chem. 2012, 135, 3020–3038. [Google Scholar] [CrossRef]
- Idowu, A.T.; Benjakul, S.; Sinthusamran, S.; Sookchoo, P.; Kishimura, H. Protein hydrolysate from salmon frames: Production, characteristics and antioxidative activity. J. Food Biochem. 2019, 43, e12734. [Google Scholar] [CrossRef]
- Da Rocha, M.; Alemán, A.; Baccan, G.C.; López-Caballero, M.E.; Gómez-Guillén, C.; Montero, P.; Prentice, C. Anti-Inflammatory, Antioxidant, and Antimicrobial Effects of Underutilized Fish Protein Hydrolysate. J. Aquat. Food Prod. Technol. 2018, 27, 592–608. [Google Scholar] [CrossRef] [Green Version]
- Harnedy, P.A.; Parthsarathy, V.; McLaughlin, C.M.; O’Keeffe, M.B.; Allsopp, P.J.; McSorley, E.M.; O’Harte, F.P.M.; FitzGerald, R.J. Blue whiting (Micromesistius poutassou) muscle protein hydrolysate with in vitro and in vivo antidiabetic properties. J. Funct. Foods 2018, 40, 137–145. [Google Scholar] [CrossRef] [Green Version]
- Vázquez, J.A.; Rodríguez-Amado, I.; Sotelo, C.G.; Sanz, N.; Pérez-Martín, R.I.; Valcárcel, J. Production, Characterization, and Bioactivity of Fish Protein Hydrolysates from Aquaculture Turbot (Scophthalmus maximus) Wastes. Biomolecules 2020, 10, 310. [Google Scholar] [CrossRef] [PubMed] [Green Version]
- Halim, N.R.A.; Yusof, H.M.; Sarbon, N.M. Functional and bioactive properties of fish protein hydolysates and peptides: A comprehensive review. Trends Food Sci. Technol. 2016, 51, 24–33. [Google Scholar] [CrossRef]
- Akagündüz, Y.; Mosquera, M.; Giménez, B.; Alemán, A.; Montero, P.; Gómez-Guillén, M.C. Sea bream bones and scales as a source of gelatin and ACE inhibitory peptides. LWT-Food Sci. Technol. 2014, 55, 579–585. [Google Scholar] [CrossRef] [Green Version]
- Fahmi, A.; Morimura, S.; Guo, H.C.; Shigematsu, T.; Kida, K.; Uemura, Y. Production of angiotensin I converting enzyme inhibitory peptides from sea bream scales. Process. Biochem. 2004, 39, 1195–1200. [Google Scholar] [CrossRef]
- Yilmaz, Ş.; Çakli, Ş.; Erol, N.; Erdem, Ö.; Sen Yilmaz, B.; Yavuz, A. Determination of some functional properties of enzymatically hydrolyzed fish protein from Sea Bass (Dicentrarchus labrax) by-products and its effect in Whiting Mince (Merlangius merlangus). Dtsch. Leb. 2016, 112, 261–269. [Google Scholar]
- Erol, N.D.; Erdem, Ö.A.; Çaklı, Ş. Stability of fish protein hydrolysate from heads of gilthead sea bream (Sparus aurata), european sea bass (Dicentrarchus labrax) and rainbow trout (Oncorhyncus mykiss) during storage. Su Ürünleri Derg. 2017, 34, 327–336. [Google Scholar]
- Box, G.E.P.; Hunter, J.S.; Hunter, W.G. Statistics for Experimenters: Design, Innovation, and Discovery; Wiley-Interscience: New York, NY, USA, 2005; Volume 2. [Google Scholar]
- Adler-Nissen, J. Enzymic Hydrolysis of Food Proteins; Elsevier Applied Science Publishers: Amsterdam, The Netherlands, 1986; ISBN 0853343861. [Google Scholar]
- Vázquez, J.A.; Blanco, M.; Massa, A.E.; Amado, I.R.; Pérez-Martín, R.I. Production of fish protein hydrolysates from Scyliorhinus canicula discards with antihypertensive and antioxidant activities by enzymatic hydrolysis and mathematical optimization using response surface methodology. Mar. Drugs 2017, 15, 306. [Google Scholar] [CrossRef]
- Vázquez, J.A.; Fernández-Compás, A.; Blanco, M.; Rodríguez-Amado, I.; Moreno, H.; Borderías, J.; Pérez-Martín, R.I. Development of bioprocesses for the integral valorisation of fish discards. Biochem. Eng. J. 2019, 144, 198–208. [Google Scholar] [CrossRef]
- AOAC Association of Official Analytical ChLLLLLOLOemistry. Methods of Analysis; AOAC International: Rockville, MD, USA, 1997. [Google Scholar]
- Bligh, E.G.; Dyer, W.J. A rapid method of total lipid extraction and purification. Can. J. Biochem. Physiol. 1959, 37, 911–917. [Google Scholar] [CrossRef] [PubMed] [Green Version]
- Lepage, G.; Roy, C.C. Direct transesterification of all classes of lipids in a one-step reaction. J. Lipid Res. 1986, 27, 114–120. [Google Scholar]
- Dubois, M.; Gilles, K.A.; Hamilton, J.K.; Rebers, P.A.; Smith, F. Colorimetric method for determination of sugars and related substances. Anal. Chem 1956, 28. [Google Scholar] [CrossRef]
- Lowry, O.H.; Rosebrough, N.J.; Farr, A.L.; Randall, R.J. Protein measurement with the Folin phenol reagent. J. Biol. Chem. 1951, 193, 265–275. [Google Scholar]
- Spackman, D.H.; Stein, W.H.; Moore, S. Chromatography of amino acids on sulphonated polystyrene resins. An improved system. Anal. Chem. 1958, 30, 1190–1205. [Google Scholar] [CrossRef]
- Miller, E.L.; Bimbo, A.P.; Walters, D.E.; Barlow, S.M.; Sheridan, B. Collaborators: Determination of Nitrogen Solubility in Dilute Pepsin Hydrochloric Acid Solution of Fishmeal: Interlaboratory Study. J. AOAC Int. 2019, 85, 1374–1381. [Google Scholar] [CrossRef] [Green Version]
- Prieto, M.A.; Curran, T.P.; Gowen, A.; Vázquez, J.A. An efficient methodology for quantification of synergy and antagonism in single electron transfer antioxidant assays. Food Res. Int. 2015, 67, 284–298. [Google Scholar] [CrossRef] [Green Version]
- Prieto, M.A.; Vázquez, J.A.; Murado, M.A. Crocin bleaching antioxidant assay revisited: Application to microplate to analyse antioxidant and pro-oxidant activities. Food Chem. 2015, 167, 299–310. [Google Scholar] [CrossRef] [PubMed] [Green Version]
- Estévez, N.; Fuciños, P.; Sobrosa, A.C.; Pastrana, L.; Pérez, N.; Luisa Rúa, M. Modeling the angiotensin-converting enzyme inhibitory activity of peptide mixtures obtained from cheese whey hydrolysates using concentration–response curves. Biotechnol. Prog. 2012, 28, 1197–1206. [Google Scholar] [CrossRef] [Green Version]
- Amado, I.R.; Vázquez, J.A.; González, M.P.; Murado, M.A. Production of antihypertensive and antioxidant activities by enzymatic hydrolysis of protein concentrates recovered by ultrafiltration from cuttlefish processing wastewaters. Biochem. Eng. J. 2013, 76, 43–54. [Google Scholar] [CrossRef]
- Vázquez, J.A.; Fraguas, J.; Novoa-Carvallal, R.; Reis, R.L.; Antelo, L.T.; Pérez-Martín, R.I.; Valcarcel, J. Isolation and chemical characterization of chondroitin sulfate from cartilage by-products of blackmouth catshark (Galeus melastomus). Mar. Drugs 2018, 16, 344. [Google Scholar] [CrossRef] [PubMed] [Green Version]
- Vázquez, J.A.; Ramos, P.; Valcarcel, J.; Antelo, L.T.; Novoa-Carballal, R.; Reis, R.L.; Pérez-Martín, R.I. An integral and sustainable valorisation strategy of squid pen by-products. J. Clean. Prod. 2018, 201. [Google Scholar] [CrossRef]
- Gbogouri, G.A.; Linder, M.; Fanni, J.; Parmentier, M. Influence of Hydrolysis Degree on the Functional Properties of Salmon Byproducts Hydrolysates. J. Food Sci. 2004, 69, C615–C622. [Google Scholar] [CrossRef]
- Safari, R.; Motamedzadegan, A.; Ovissipour, M.; Regenstein, J.M.; Gildberg, A.; Rasco, B. Use of hydrolysates from yellowfin tuna (Thunnus albacares) heads as a complex nitrogen source for lactic acid bacteria. Food Bioprocess. Technol. 2012, 5, 73–79. [Google Scholar] [CrossRef]
- Aspmo, S.I.; Horn, S.J.; Eijsink, V.G. Enzymatic hydrolysis of Atlantic cod (Gadus morhua L.) viscera. Process. Biochem. 2005, 40, 1957–1966. [Google Scholar] [CrossRef]
- Vázquez, J.A.; Sotelo, C.G.; Sanz, N.; Pérez-Martín, R.I.; Rodríguez-Amado, I.; Valcarcel, J. Valorization of Aquaculture By-Products of Salmonids to Produce Enzymatic Hydrolysates: Process Optimization, Chemical Characterization and Evaluation of Bioactives. Mar. Drugs 2019, 17, 676. [Google Scholar] [CrossRef] [Green Version]
- Vázquez, J.A.; Fraguas, J.; Mirón, J.; Valcárcel, J.; Pérez-Martín, R.I.; Antelo, L.T. Valorisation of fish discards assisted by enzymatic hydrolysis and microbial bioconversion: Lab and pilot plant studies and preliminary sustainability evaluation. J. Clean. Prod. 2020, 246, 119027. [Google Scholar] [CrossRef]
- Vázquez, J.A.; Menduíña, A.; Nogueira, M.; Durán, A.I.; Sanz, N.; Valcarcel, J. Optimal Production of Protein Hydrolysates from Monkfish By-Products: Chemical Features and Associated Biological Activities. Molecules 2020, 25, 4068. [Google Scholar] [CrossRef] [PubMed]
- Shen, Q.; Guo, R.; Dai, Z.; Zhang, Y. Investigation of Enzymatic Hydrolysis Conditions on the Properties of Protein Hydrolysate from Fish Muscle (Collichthys niveatus) and Evaluation of Its Functional Properties. J. Agric. Food Chem. 2012, 60, 5192–5198. [Google Scholar] [CrossRef] [PubMed]
- Cinq-Mars, C.D.; Li-Chan, E.C.Y. Optimizing Angiotensin I-Converting Enzyme Inhibitory Activity of Pacific Hake (Merluccius productus) Fillet Hydrolysate Using Response Surface Methodology and Ultrafiltration. J. Agric. Food Chem. 2007, 55, 9380–9388. [Google Scholar] [CrossRef]
- Hayes, M.; Mora, L.; Hussey, K.; Aluko, R.E. Boarfish protein recovery using the pH-shift process and generation of protein hydrolysates with ACE-I and antihypertensive bioactivities in spontaneously hypertensive rats. Innov. Food Sci. Emerg. Technol. 2016, 37, 253–260. [Google Scholar] [CrossRef]
- Theodore, A.E.; Raghavan, S.; Kristinsson, H.G. Antioxidative Activity of Protein Hydrolysates Prepared from Alkaline-Aided Channel Catfish Protein Isolates. J. Agric. Food Chem. 2008, 56, 7459–7466. [Google Scholar] [CrossRef]


| Mo (%) | OM (%) | Ash (%) | Lip (%) | Pr-tN (%) | |
|---|---|---|---|---|---|
| Sb_He | 65.3 ± 1.2 | 28.3 ± 1.8 | 6.4 ± 0.5 | 28.5 ± 2.2 | 52.3 ± 2.7 |
| Sb_FT | 63.8 ± 1.9 | 30.6 ± 0.7 | 5.6 ± 0.8 | 40.3 ± 3.1 | 49.5 ± 1.8 |
| Sb_Vis | 70.2 ± 2.0 | 28.2 ± 1.5 | 1.6 ± 0.3 | 35.7 ± 4.1 | 47.2 ± 3.1 |
| Sbass_He | 63.1 ± 1.5 | 29.7 ± 0.7 | 7.2 ± 0.5 | 39.2 ± 2.0 | 49.9 ± 2.8 |
| Sbass_FT | 62.6 ± 2.0 | 32.2 ± 2.3 | 5.2 ± 0.4 | 44.9 ± 1.4 | 43.1 ± 2.0 |
| Sbass_Vis | 72.3 ± 0.9 | 27.2 ± 1.0 | 0.5 ± 0.2 | 54.2 ± 0.9 | 36.8 ± 0.8 |
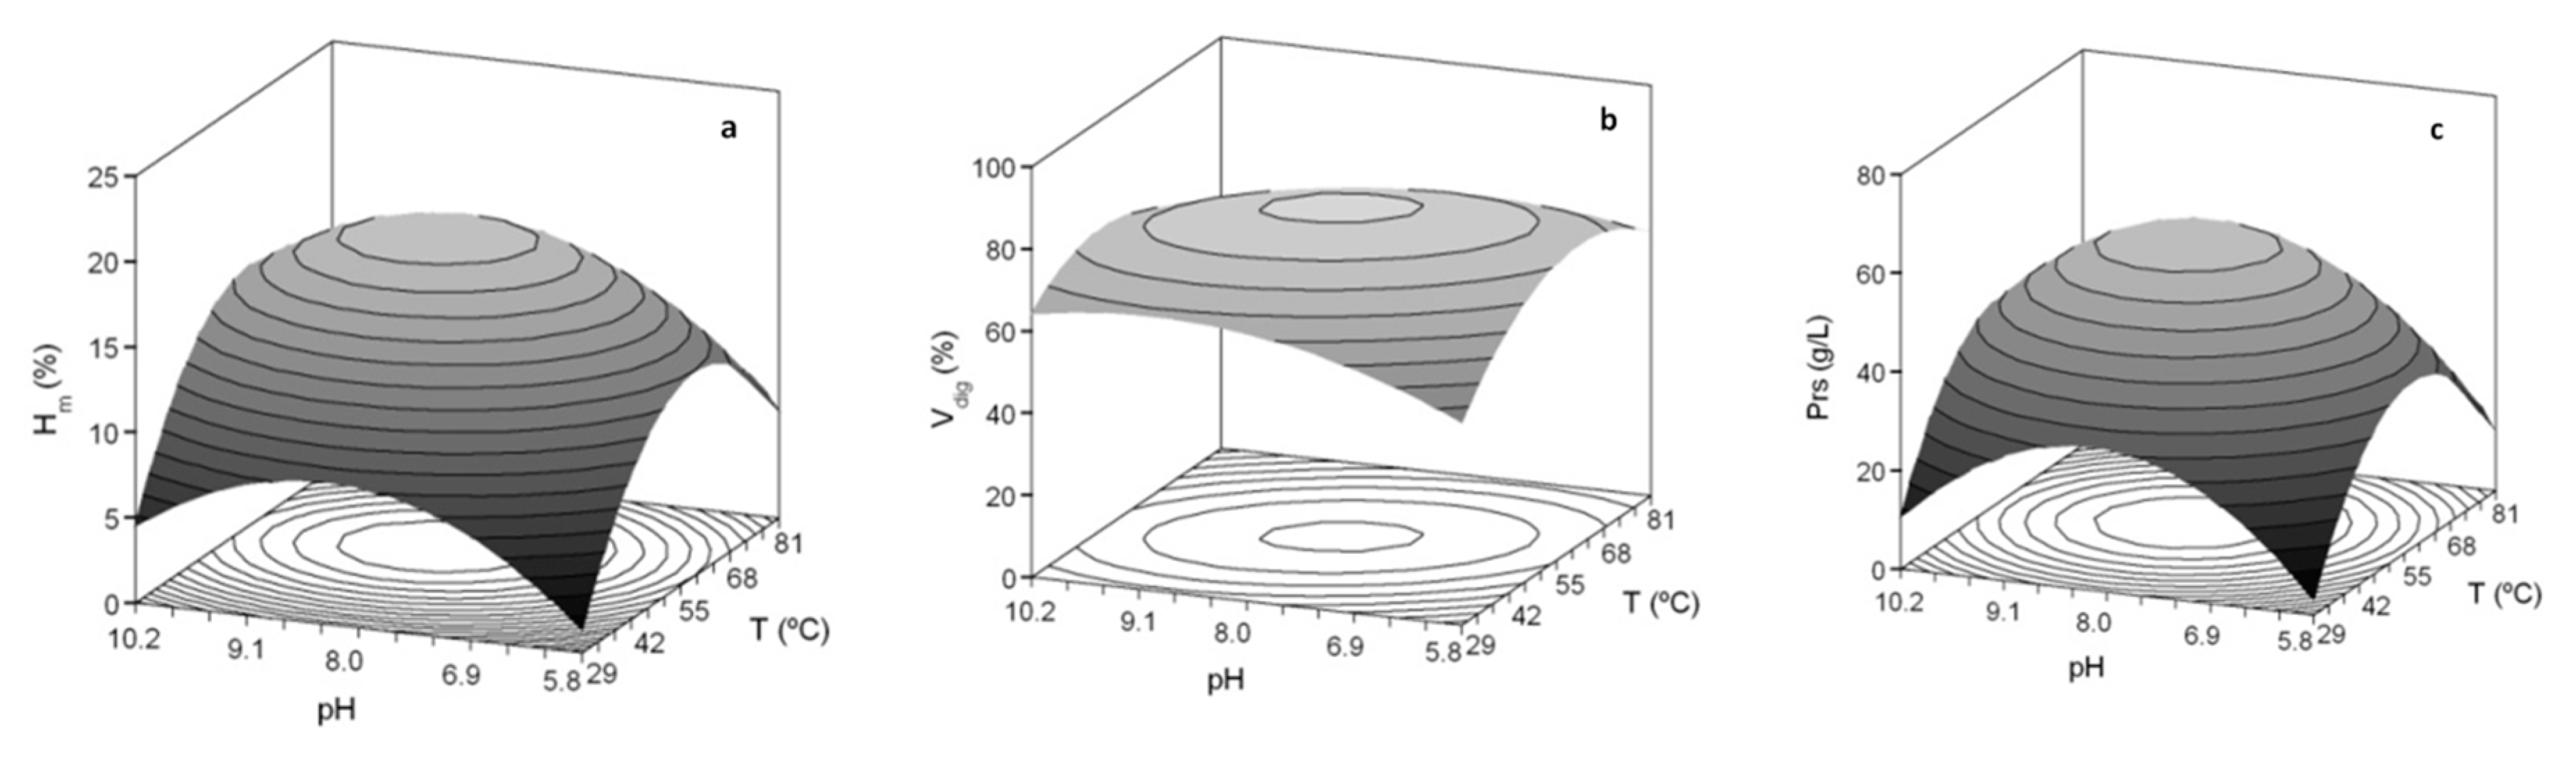
| Second Order Models | Topt (°C) | pHopt | Ymax | ||
|---|---|---|---|---|---|
| Sb_He | Hm (%) = 18.69 + 1.64 T + 1.07 pH − 3.56 T2 − 2.35 pH2 | 0.885 | 59.1 | 8.32 | 19.0% |
| Vdig (%) = 80.87 − 3.26 TpH − 6.98 T2 − 3.70 pH2 | 0.858 | 55.0 | 8.00 | 80.9% | |
| Prs (g/L) = 59.69 + 3.00 T + 2.53 pH − 11.67 T2 − 9.87 pH2 | 0.848 | 57.3 | 8.18 | 60.0 g/L | |
| Sbass_He | Hm (%) = 17.14 + 1.09 T + 1.73 pH − 1.79 TpH − 3.04 T2 − 2.28 pH2 | 0.781 | 56.4 | 8.49 | 17.5% |
| Vdig (%) = 79.78 + 2.76 T + 3.16 pH − 2.58 TpH − 6.62 T2 − 10.19 pH2 | 0.891 | 58.2 | 8.19 | 80.2% | |
| Prs (g/L) = 59.70 + 3.13 T + 7.31 pH− 4.84 T2 − 7.41 pH2 | 0.871 | 60.7 | 8.70 | 62.0 g/L |
| FPH | mb (%) | Vdig (%) | Oil (%) | Prs (g/L) | Pr-tN (g/L) | TS (g/L) | Dig (%) |
|---|---|---|---|---|---|---|---|
| Sb_He | 19.9 ± 0.5 | 79.9 ± 0.8 | 5.9 ± 0.3 | 61.6 ± 1.6 | 63.9 ± 1.4 | 1.8 ± 0.2 | 89.6 ± 1.4 |
| Sb_FT | 14.0 ± 0.5 | 77.5 ± 2.0 | 10.6 ± 0.9 | 81.2 ± 3.1 | 83.5 ± 2.4 | 1.3 ± 0.1 | 90.7 ± 2.4 |
| Sb_Vis | 7.3 ± 2.1 | 89.0 ± 2.0 | 3.9 ± 0.2 | 37.9 ± 1.7 | 42.5 ± 1.1 | 0.8 ± 0.1 | 87.8 ± 3.9 |
| Sbass_He | 19.2 ± 1.3 | 79.2 ± 1.1 | 8.1 ± 0.4 | 63.3 ± 0.4 | 65.6 ± 2.0 | 1.4 ± 0.1 | 90.3 ± 1.5 |
| Sbass_FT | 10.6 ± 0.4 | 77.6 ± 0.0 | 13.8 ± 0.5 | 73.0 ± 9.5 | 74.9 ± 1.2 | 1.7 ± 0.2 | 91.3 ± 1.8 |
| Sbass_Vis | - | 88.6 ± 5.6 | 27.5 ± 2.1 | 33.0 ± 1.6 | 36.1 ± 1.9 | 0.9 ± 0.1 | 86.3 ± 2.4 |
| Amino Acids | Sb_He | Sb_FT | Sb_Vis | Sbass_He | Sbass_FT | Sbass_Vis |
|---|---|---|---|---|---|---|
| Asp | 9.46 ± 0.03 | 10.80 ± 0.01 | 9.52 ± 0.00 | 9.25 ± 0.17 | 9.82 ± 0.03 | 9.69 ± 0.16 |
| Thr | 4.52 ± 0.03 | 4.30 ± 0.07 | 4.63 ± 0.07 | 4.31 ± 0.05 | 4.48 ± 0.04 | 4.80 ± 0.03 |
| Ser | 4.82 ± 0.01 | 4.68 ± 0.04 | 5.07 ± 0.07 | 4.89 ± 0.06 | 4.62 ± 0.02 | 5.60 ± 0.03 |
| Glu | 13.83 ± 0.11 | 15.11 ± 0.11 | 12.91 ± 0.85 | 13.63 ± 0.07 | 14.21 ± 0.05 | 13.04 ± 0.21 |
| Gly | 10.04 ± 0.08 | 8.63 ± 0.17 | 8.57 ± 0.01 | 10.84 ± 0.11 | 9.66 ± 0.01 | 7.75 ± 0.04 |
| Ala | 7.39 ± 0.08 | 7.69 ± 0.15 | 7.23 ± 0.07 | 7.60 ± 0.01 | 7.56 ± 0.04 | 7.54 ± 0.01 |
| Cys | 0.62 ± 0.01 | 0.89 ± 0.01 | 0.97 ± 0.09 | 0.69 ± 0.10 | 0.68 ± 0.05 | 0.96 ± 0.16 |
| Val | 4.36 ± 0.01 | 3.70 ± 0.23 | 4.90 ± 0.02 | 4.23 ± 0.06 | 4.15 ± 0.03 | 5.54 ± 0.11 |
| Met | 2.95 ± 0.14 | 3.33 ± 0.14 | 2.83 ± 0.05 | 2.76 ± 0.04 | 3.04 ± 0.01 | 2.62 ± 0.11 |
| Ile | 3.38 ± 0.17 | 2.58 ± 0.04 | 3.65 ± 0.01 | 3.17 ± 0.04 | 3.40 ± 0.01 | 4.03 ± 0.22 |
| Leu | 6.65 ± 0.14 | 7.07 ± 0.09 | 7.54 ± 0.01 | 6.31 ± 0.06 | 6.72 ± 0.03 | 7.75 ± 0.13 |
| Tyr | 3.42 ± 0.02 | 3.59 ± 0.05 | 3.51 ± 0.08 | 3.34 ± 0.02 | 3.07 ± 0.02 | 3.99 ± 0.21 |
| Phe | 4.03 ± 0.07 | 4.64 ± 0.12 | 4.93 ± 0.23 | 4.14 ± 0.09 | 3.98 ± 0.01 | 4.96 ± 0.15 |
| His | 2.36 ± 0.05 | 2.67 ± 0.02 | 2.26 ± 0.01 | 2.07 ± 0.01 | 2.13 ± 0.01 | 2.08 ± 0.05 |
| Lys | 7.13 ± 0.07 | 7.81 ± 0.12 | 7.62 ± 0.06 | 6.93 ± 0.11 | 8.05 ± 0.07 | 7.55 ± 0.01 |
| Arg | 6.56 ± 0.15 | 5.73 ± 0.05 | 6.37 ± 0.06 | 6.39 ± 0.09 | 6.47 ± 0.02 | 5.28 ± 0.06 |
| OHPro | 2.70 ± 0.05 | 1.92 ± 0.14 | 2.42 ± 0.69 | 3.18 ± 0.13 | 2.31 ± 0.13 | 1.85 ± 0.17 |
| Pro | 5.79 ± 0.16 | 4.84 ± 0.02 | 5.06 ± 0.04 | 6.27 ± 0.10 | 5.66 ± 0.03 | 4.97 ± 0.40 |
| TEAA/TAA (%) | 41.94 ± 0.37 | 41.84 ± 0.35 | 44.73 ± 0.11 | 40.32 ± 0.29 | 42.42 ± 0.10 | 44.61 ± 0.59 |
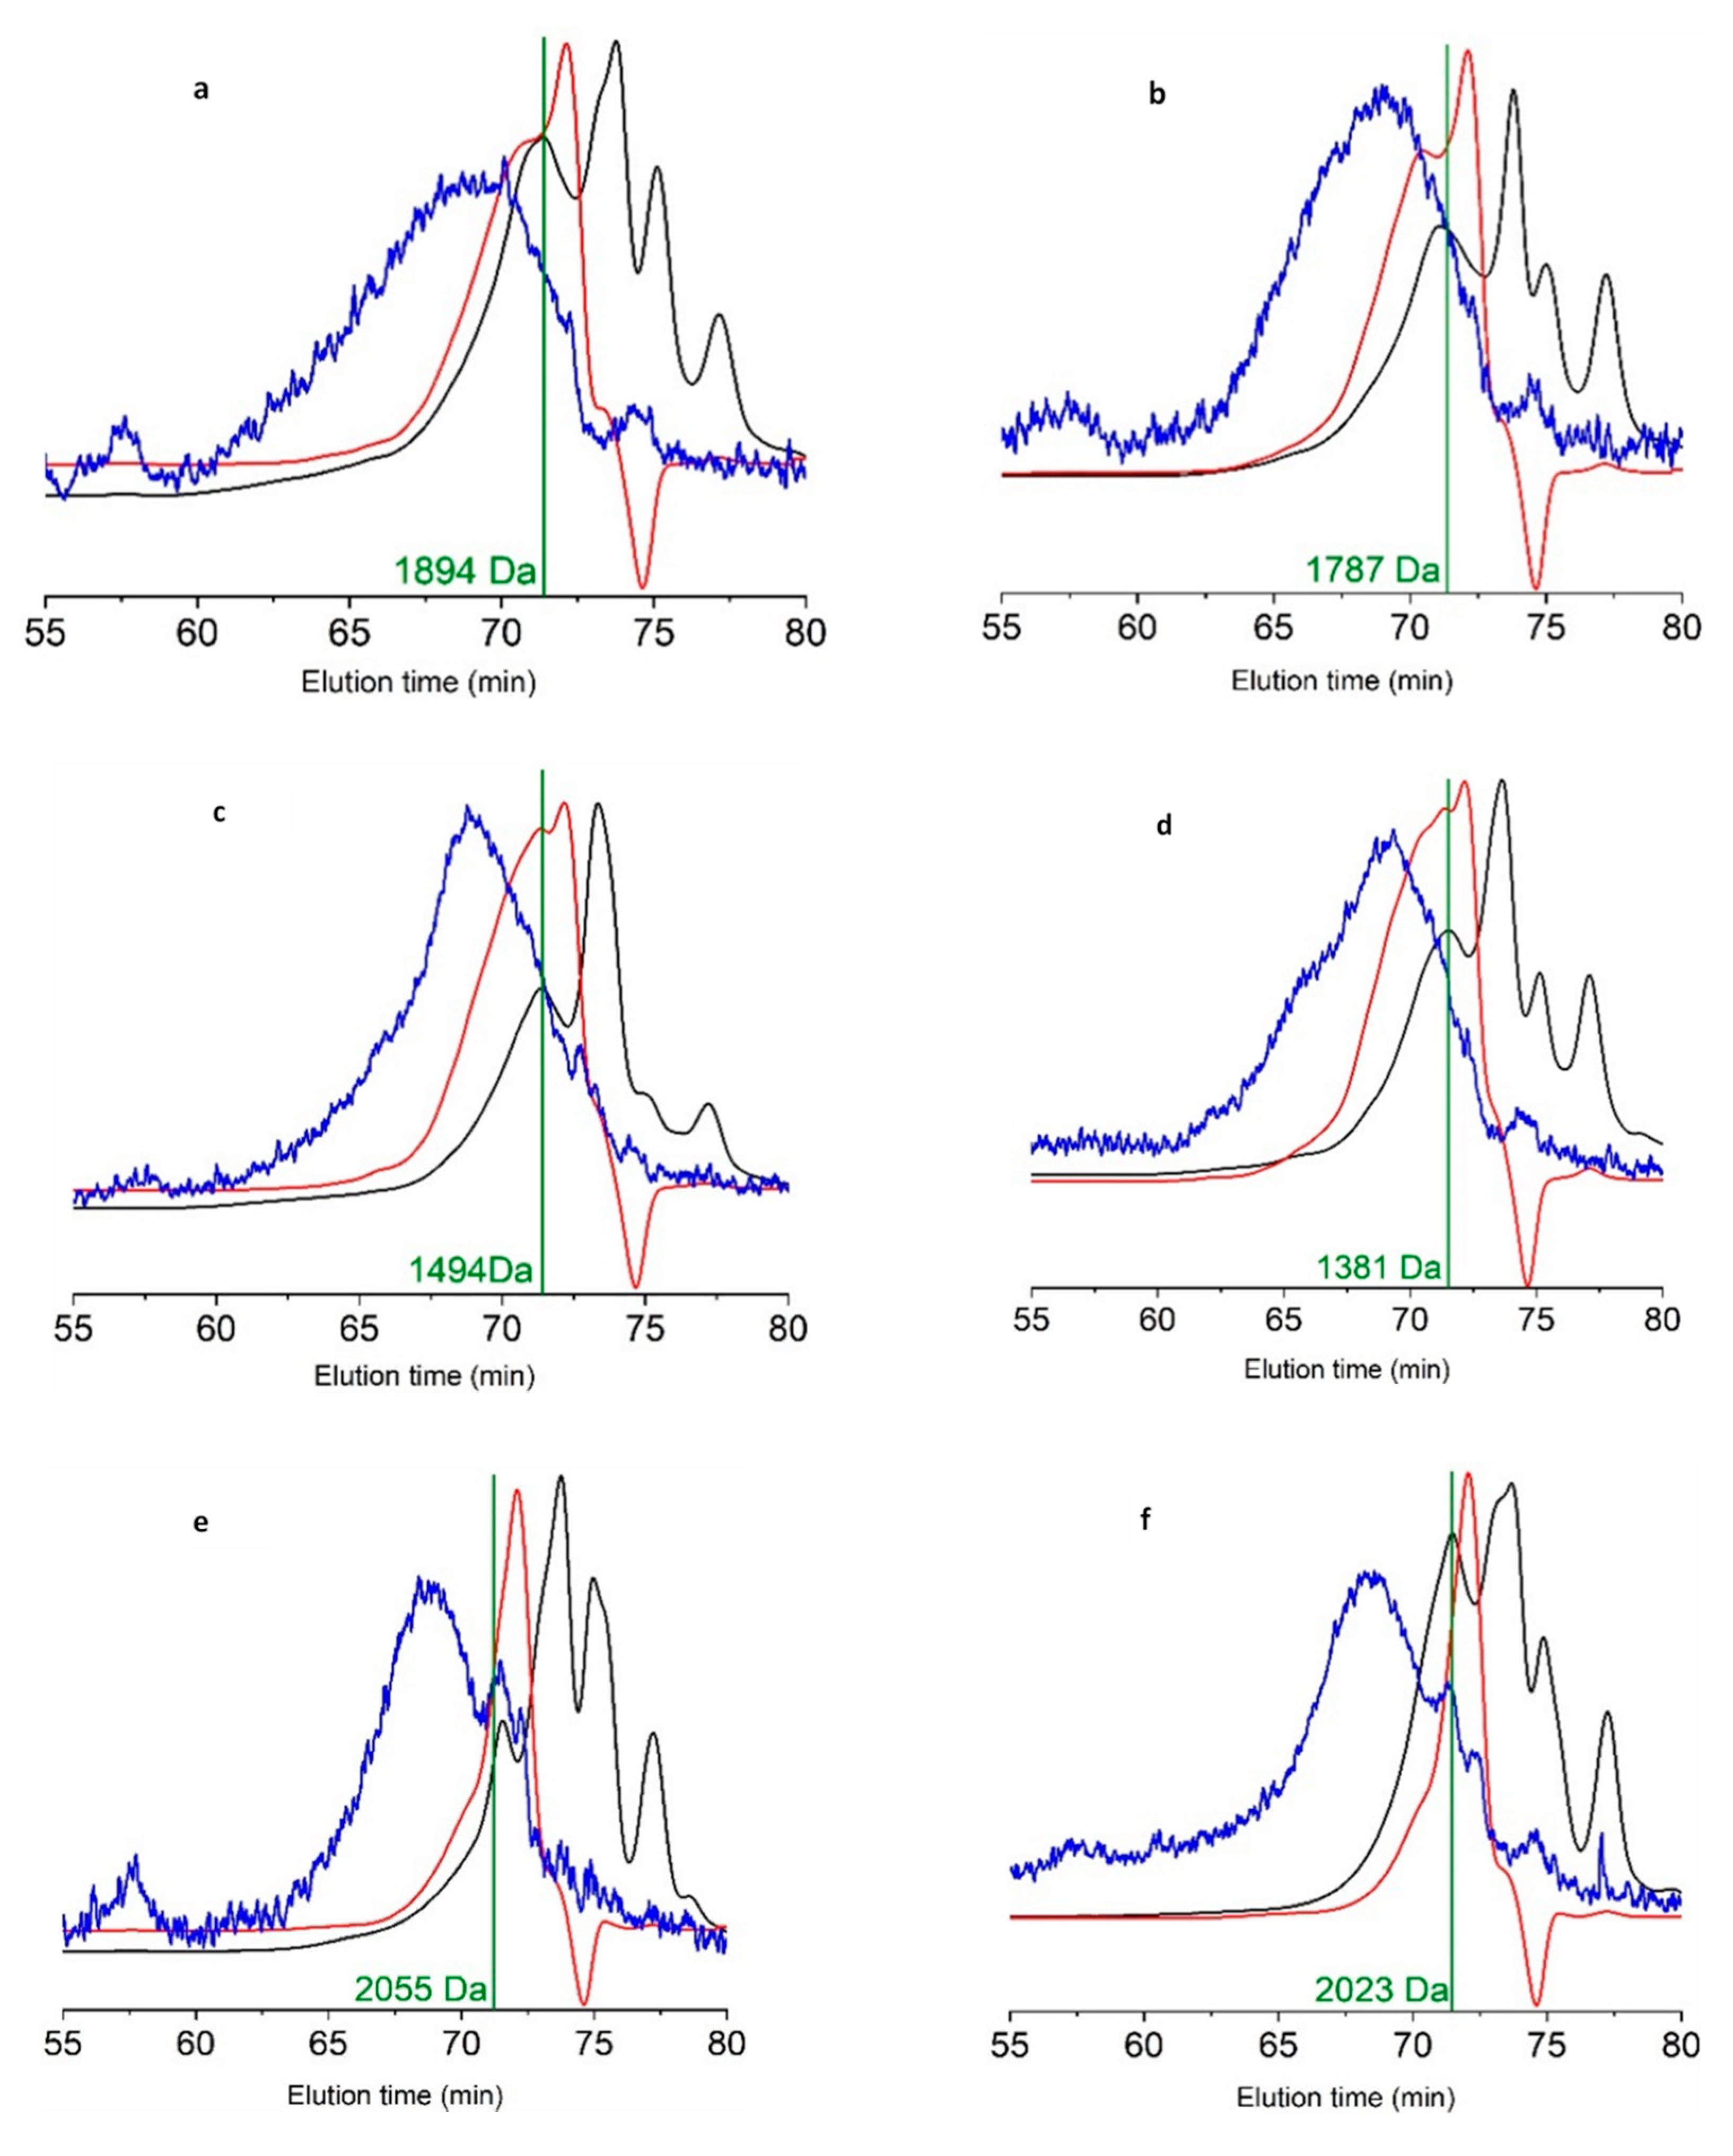
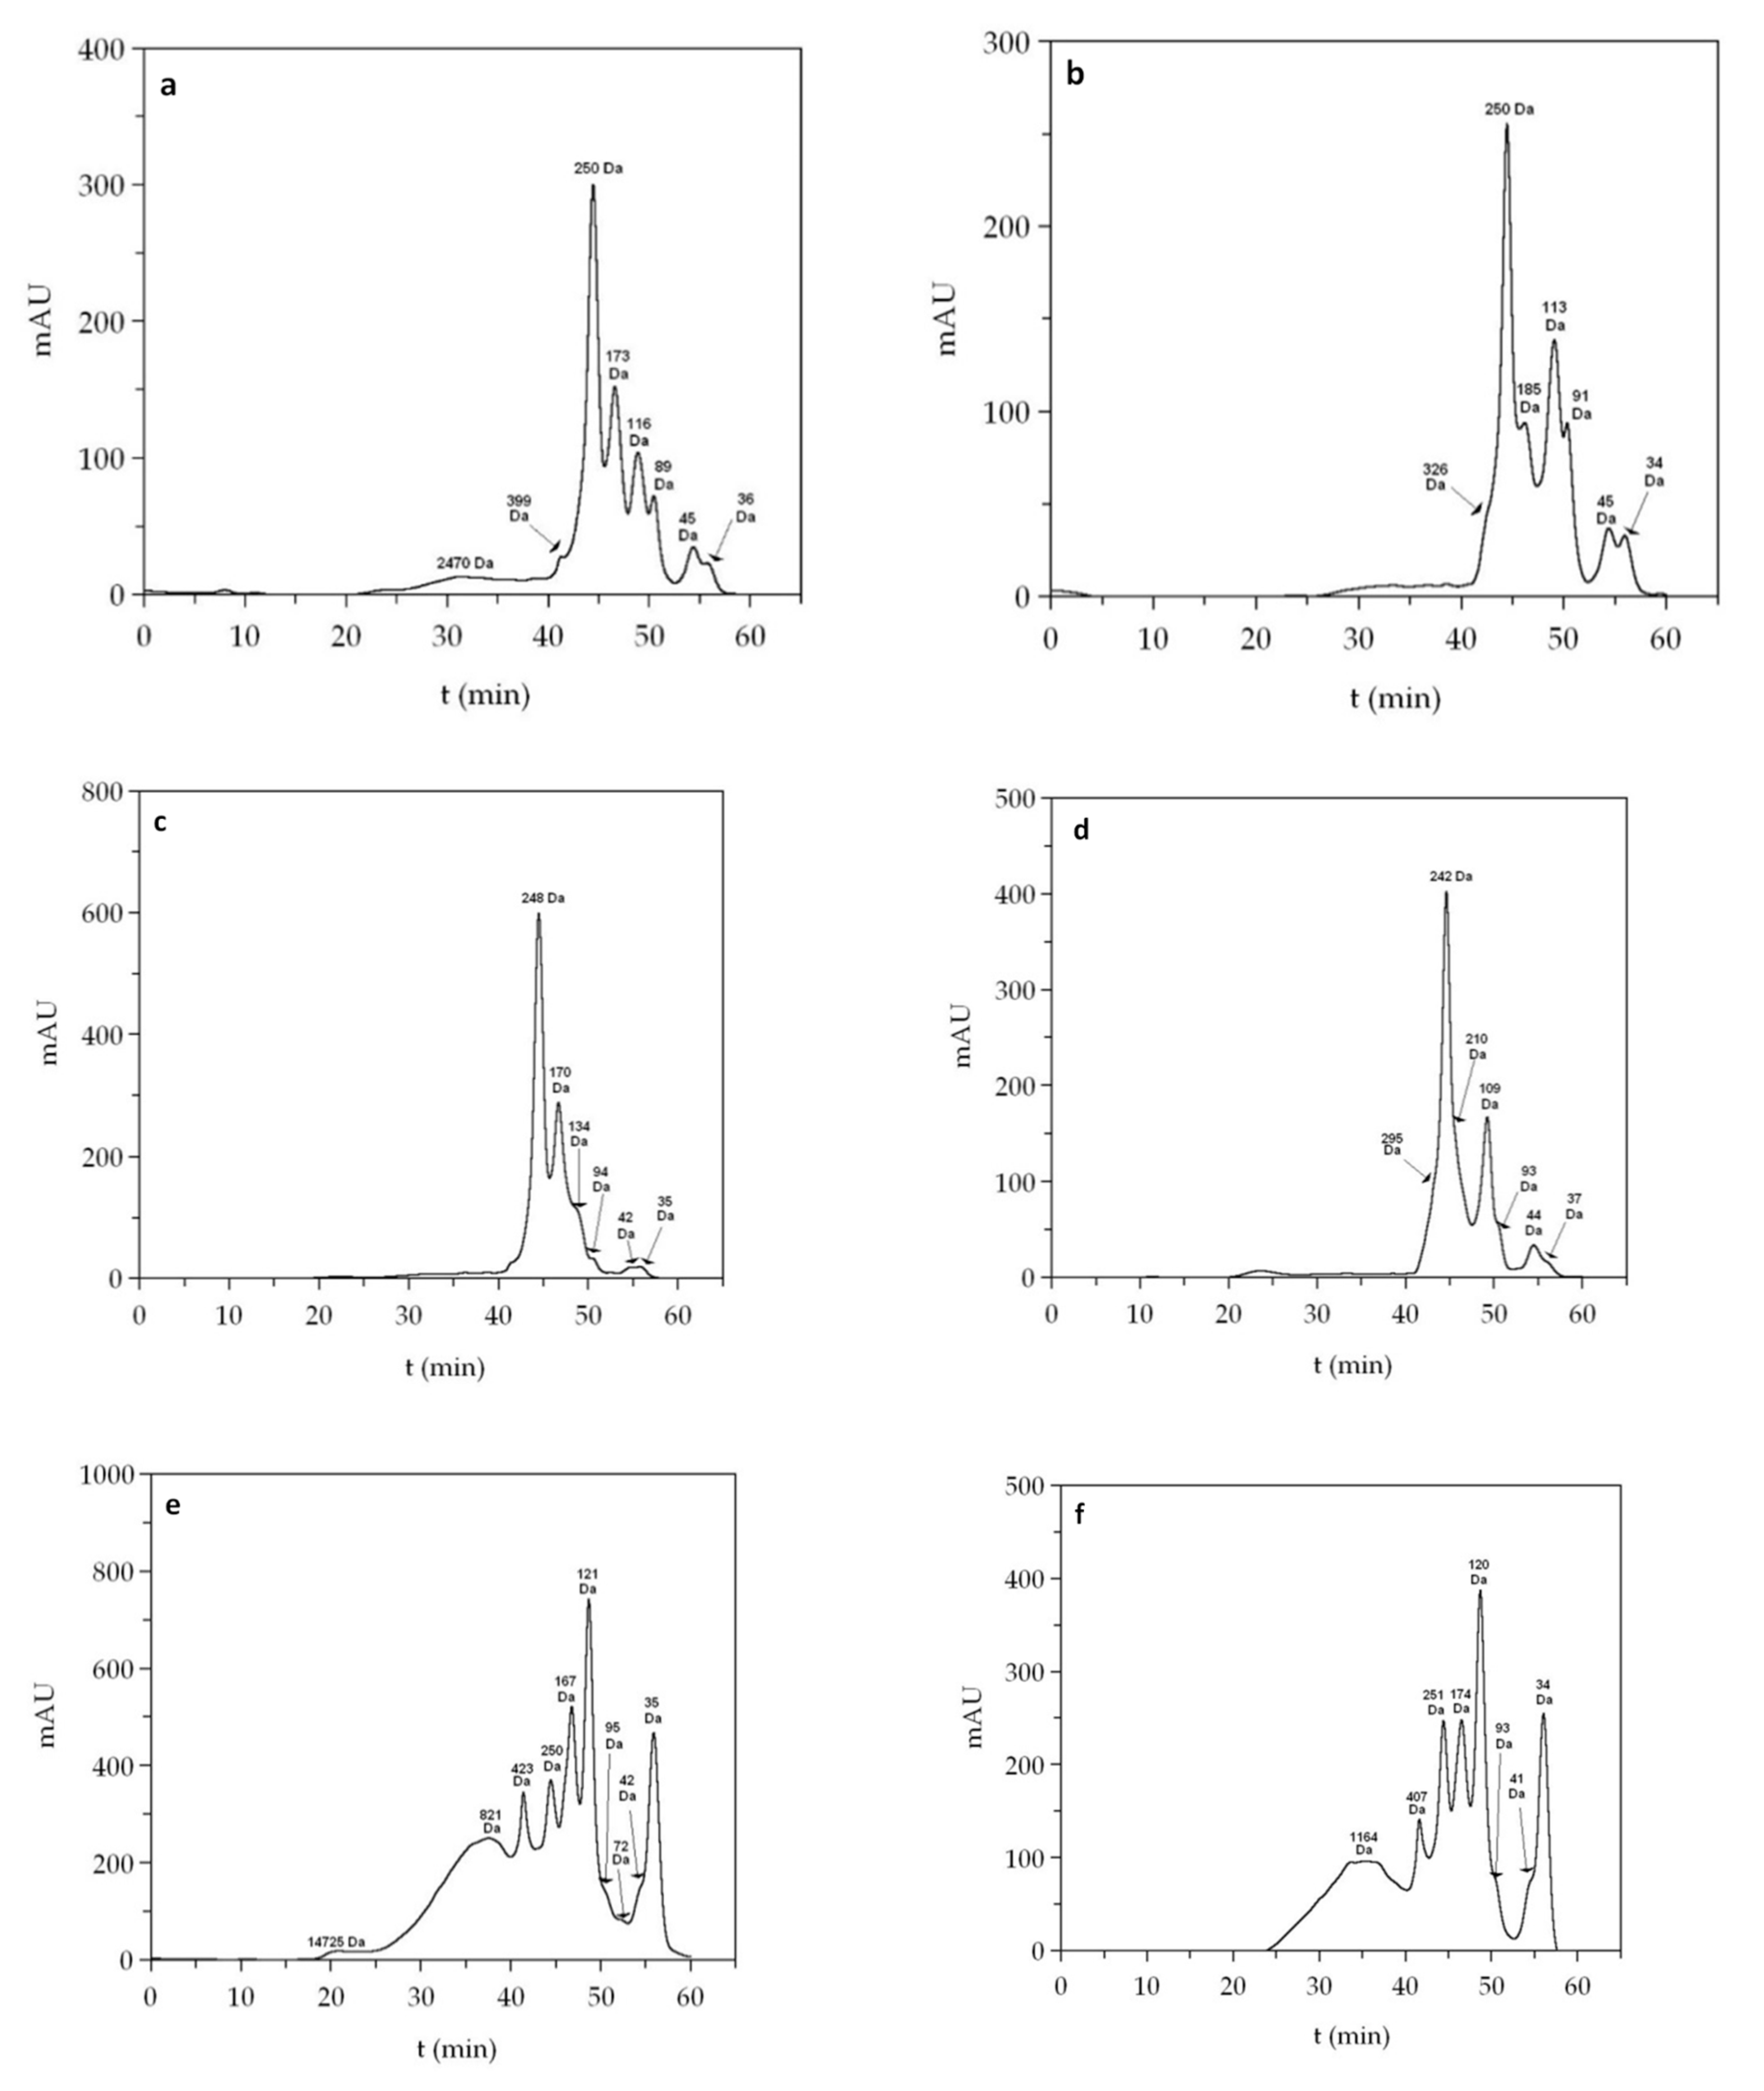
| FPH | Mn (Da) | Mw (Da) | PDI | 0–0.2 kDa | 0.2–1 kDa | 1–3 kDa | >3 kDa |
|---|---|---|---|---|---|---|---|
| Sb_He | 832 | 1894 | 2.276 | 27.5 | 24.6 | 35.4 | 12.5 |
| Sb_FT | 1060 | 1494 | 1.409 | 18.5 | 23.7 | 51.2 | 6.6 |
| Sb_Vis | 790 | 1936 | 2.450 | 28.5 | 33.9 | 28.3 | 9.3 |
| Sbass_He | 1040 | 1787 | 1.718 | 24.7 | 17.9 | 45.9 | 11.5 |
| Sbass_FT | 802 | 1381 | 1.722 | 17.6 | 38.8 | 36.2 | 7.4 |
| Sbass_Vis | 1065 | 2023 | 1.900 | 26.3 | 11.3 | 50.2 | 12.2 |
| ANTIOXIDANT | ANTIHYPERTENSIVE | ||||
|---|---|---|---|---|---|
| FPH | DPPH (%) | ABTS (μg BHT/mL) | Crocin (μg Trolox/mL) | IACE (%) | IC50 (μg protein/mL) |
| Sb_He | 43.2 ± 2.2 | 11.12 ± 0.98 | 6.12 ± 0.34 | 43.1 ± 3.2 | 1034.5 ± 145.4 |
| Sb_FT | 52.4 ± 2.5 | 15.09 ± 1.78 | 7.39 ± 0.67 | 48.2 ± 2.9 | 793.2 ± 127.1 |
| Sb_Vis | 37.4 ± 1.5 | 9.84 ± 0.45 | 4.98 ± 1.59 | 37.0 ± 3.4 | 1245.8 ± 76.3 |
| Sbass_He | 45.0 ± 3.2 | 11.89 ± 0.46 | 5.78 ± 0.73 | 40.5 ± 1.5 | 989.2 ± 68.0 |
| Sbass_FT | 53.9 ± 1.5 | 14.46 ± 1.43 | 6.88 ± 0.82 | 50.2 ± 2.5 | 801.3 ± 56.4 |
| Sbass_Vis | 41.1 ± 1.8 | 10.76 ± 0.75 | 5.15 ± 0.91 | 33.8 ± 5.4 | 1398.3 ± 89.6 |
Publisher’s Note: MDPI stays neutral with regard to jurisdictional claims in published maps and institutional affiliations. |
© 2020 by the authors. Licensee MDPI, Basel, Switzerland. This article is an open access article distributed under the terms and conditions of the Creative Commons Attribution (CC BY) license (http://creativecommons.org/licenses/by/4.0/).
Share and Cite
Valcarcel, J.; Sanz, N.; Vázquez, J.A. Optimization of the Enzymatic Protein Hydrolysis of By-Products from Seabream (Sparus aurata) and Seabass (Dicentrarchus labrax), Chemical and Functional Characterization. Foods 2020, 9, 1503. https://doi.org/10.3390/foods9101503
Valcarcel J, Sanz N, Vázquez JA. Optimization of the Enzymatic Protein Hydrolysis of By-Products from Seabream (Sparus aurata) and Seabass (Dicentrarchus labrax), Chemical and Functional Characterization. Foods. 2020; 9(10):1503. https://doi.org/10.3390/foods9101503
Chicago/Turabian StyleValcarcel, Jesus, Noelia Sanz, and José Antonio Vázquez. 2020. "Optimization of the Enzymatic Protein Hydrolysis of By-Products from Seabream (Sparus aurata) and Seabass (Dicentrarchus labrax), Chemical and Functional Characterization" Foods 9, no. 10: 1503. https://doi.org/10.3390/foods9101503
APA StyleValcarcel, J., Sanz, N., & Vázquez, J. A. (2020). Optimization of the Enzymatic Protein Hydrolysis of By-Products from Seabream (Sparus aurata) and Seabass (Dicentrarchus labrax), Chemical and Functional Characterization. Foods, 9(10), 1503. https://doi.org/10.3390/foods9101503