Vitamin D Intake in a Population-Based Sample of Young Polish Women, Its Major Sources and the Possibility of Meeting the Recommendations


Abstract
1. Introduction
2. Materials and Methods
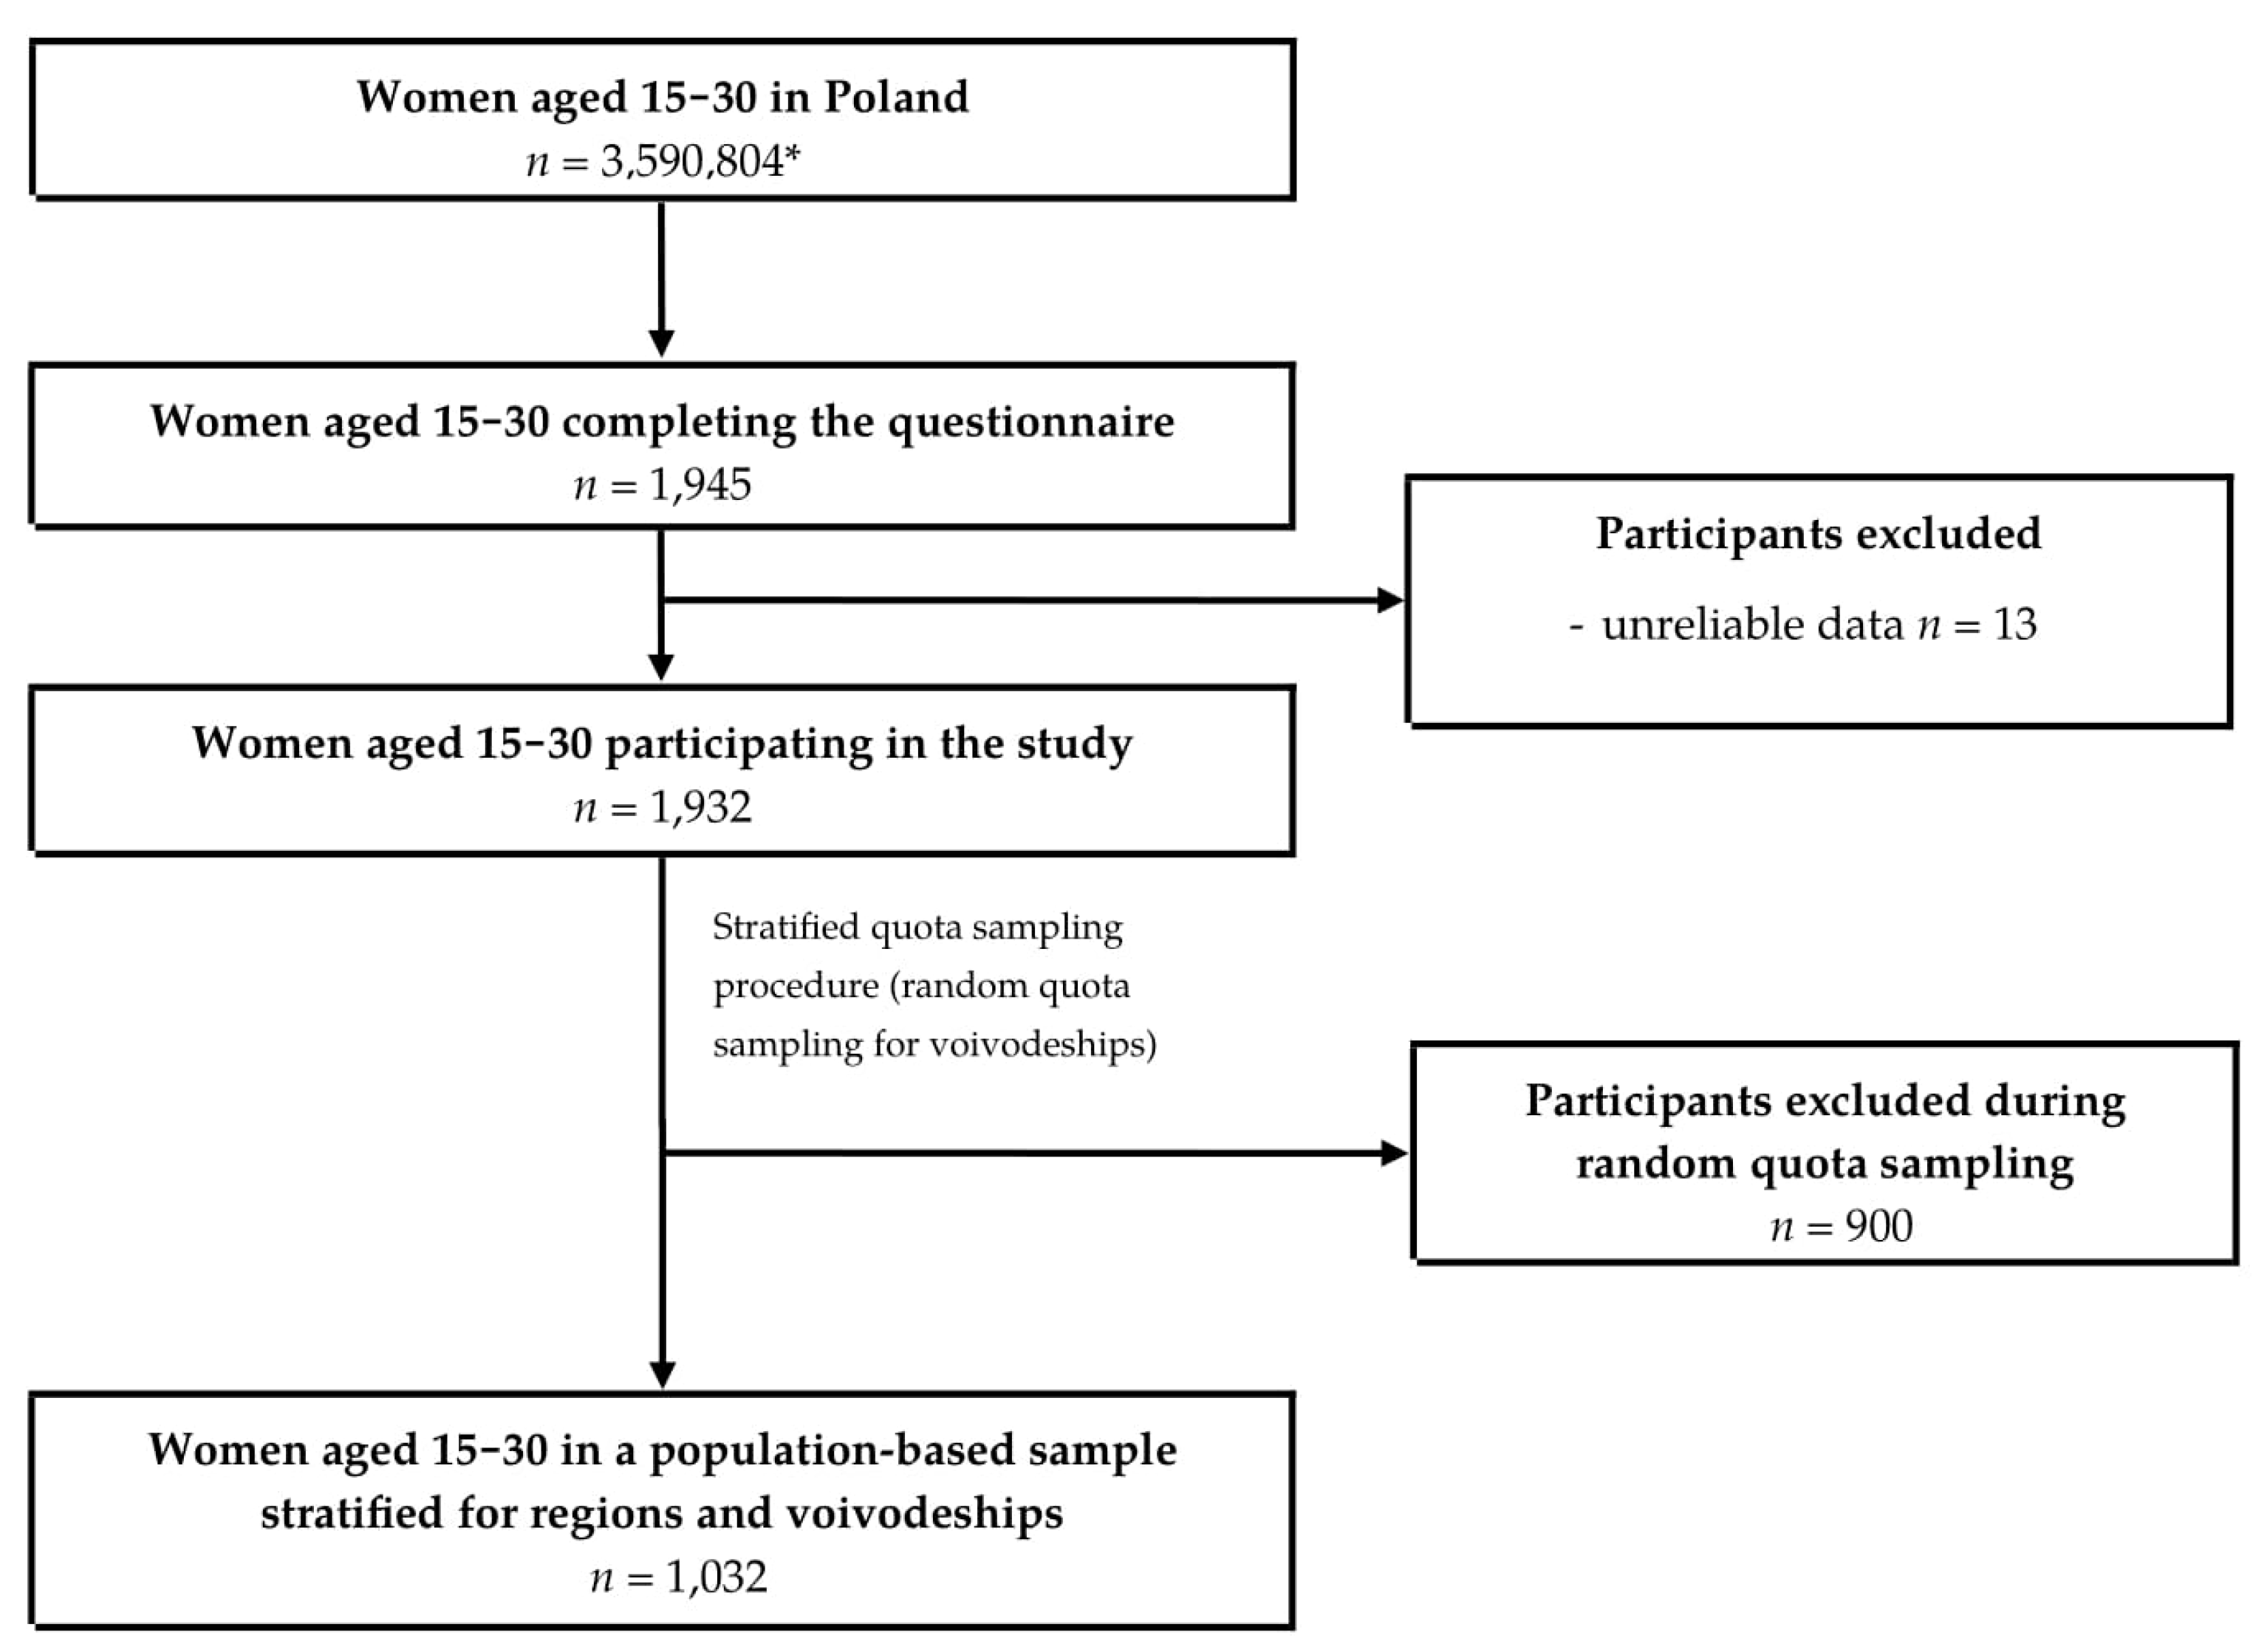
2.1. Study Group
2.2. Data Gathering
2.3. Statistical Analysis
3. Results
4. Discussion
5. Conclusions
Author Contributions
Funding
Conflicts of Interest
References
- Lips, P.; van Schoor, N.M. The effect of vitamin D on bone and osteoporosis. Best Pr. Res. Clin. Endocrinol. Metab. 2011, 25, 585–591. [Google Scholar] [CrossRef]
- Bischoff-Ferrari, H.A.; Willett, W.C.; Wong, J.B.; Giovannucci, E.; Dietrich, T.; Dawson-Hughes, B. Fracture Prevention with vitamin D supplementation: A meta-analysis of randomized controlled trials. JAMA 2005, 293, 2257–2264. [Google Scholar] [CrossRef] [PubMed]
- Bischoff-Ferrari, H.A.; Dawson-Hughes, B.; Staehelin, H.B.; Orav, J.E.; Stuck, A.E.; Theiler, R.; Wong, J.B.; Egli, A.; Kiel, D.P.; Henschkowski, J. Fall prevention with supplemental and active forms of vitamin D: A meta-analysis of randomised controlled trials. BMJ 2009, 339. [Google Scholar] [CrossRef] [PubMed]
- Yao, P.; Bennett, D.; Mafham, M.; Lin, X.; Chen, Z.; Armitage, J.; Clarke, R. Vitamin D and calcium for the prevention of fracture: A systematic review and meta-analysis. JAMA Netw. Open 2019, 2. [Google Scholar] [CrossRef]
- Bolland, M.J.; Grey, A.; Avenell, A. Effects of vitamin D supplementation on musculoskeletal health: A systematic review, meta-analysis, and trial sequential analysis. Lancet Diabetes Endocrinol. 2018, 6, 847–858. [Google Scholar] [CrossRef]
- Christakos, S.; Dhawan, P.; Verstuyf, A.; Verlinden, L.; Carmeliet, G. Vitamin D: Metabolism, molecular mechanism of action, and pleiotropic effects. Physiol. Rev. 2016, 96, 365–408. [Google Scholar] [CrossRef]
- Parker, J.; Hashmi, O.; Dutton, D.; Mavrodaris, A.; Stranges, S.; Kandala, N.B.; Clarke, A.; Franco, O.H. Levels of vitamin D and cardiometabolic disorders: Systematic review and meta-analysis. Maturitas 2010, 65, 225–236. [Google Scholar] [CrossRef]
- Estébanez, N.; Gómez-Acebo, I.; Palazuelos, C.; Llorca, J.; Dierssen-Sotos, T. Vitamin D exposure and risk of breast cancer: A meta-analysis. Sci. Rep. 2018, 8, 9039. [Google Scholar] [CrossRef]
- Wang, J.; Lv, S.; Chen, G.; Gao, C.; He, J.; Zhong, H.; Xu, Y. Meta-analysis of the association between vitamin D and autoimmune thyroid disease. Nutrients 2015, 7, 2485–2498. [Google Scholar] [CrossRef]
- Anglin, R.E.S.; Samaan, Z.; Walter, S.D.; McDonald, S.D. Vitamin D deficiency and depression in adults: Systematic review and meta-analysis. Br. J. Psychiatry 2013, 202, 100–107. [Google Scholar] [CrossRef]
- Balion, C.; Griffith, L.E.; Strifler, L.; Henderson, M.; Patterson, C.; Heckman, G.; Llewellyn, D.J.; Raina, P. Vitamin D, cognition, and dementia. Neurology 2012, 79, 1397–1405. [Google Scholar] [CrossRef] [PubMed]
- Zhou, Z.; Zhou, R.; Zhang, Z.; Li, K. The association between vitamin D status, vitamin D supplementation, sunlight exposure, and Parkinson’s disease: A systematic review and meta-analysis. Med. Sci. Monit. 2019, 25, 666–674. [Google Scholar] [CrossRef]
- Khoshbakht, Y.; Bidaki, R.; Salehi-Abargouei, A. Vitamin D status and Attention Deficit Hyperactivity Disorder: A systematic review and meta-analysis of observational studies. Adv. Nutr. 2018, 9, 9–20. [Google Scholar] [CrossRef] [PubMed]
- Aibana, O.; Huang, C.C.; Aboud, S.; Arnedo-Pena, A.; Becerra, M.C.; Bellido-Blasco, J.B.; Bhosale, R.; Calderon, R.; Chiang, S.; Contreras, C.; et al. Vitamin D status and risk of incident tuberculosis disease: A nested case-control study, systematic review, and individual-participant data meta-analysis. PLoS Med. 2019, 16. [Google Scholar] [CrossRef]
- Dou, D.; Yang, B.; Gan, H.; Xie, D.; Lei, H.; Ye, N. Vitamin D supplementation for the improvement of vascular function in patients with chronic kidney disease: A meta-analysis of randomized controlled trials. Int. Urol. Nephrol. 2019, 51, 851–858. [Google Scholar] [CrossRef]
- Atteritano, M.; Mirarchi, L.; Venanzi-Rullo, E.; Santoro, D.; Iaria, C.; Catalano, A.; Lasco, A.; Arcoraci, V.; Lo Gullo, A.; Bitto, A.; et al. Vitamin D status and the relationship with bone fragility fractures in HIV-infected patients: A case control study. Int. J. Mol. Sci. 2018, 19, 119. [Google Scholar] [CrossRef]
- Kandula, P.; Dobre, M.; Schold, J.D.; Schreiber, M.J.; Mehrotra, R.; Navaneethan, S.D. Vitamin D supplementation in chronic kidney disease: A systematic review and meta-analysis of observational studies and randomized controlled trials. Clin. J. Am. Soc. Nephrol. 2011, 6, 50–62. [Google Scholar] [CrossRef]
- Martineau, A.R.; Jolliffe, D.A.; Hooper, R.L.; Greenberg, L.; Aloia, J.F.; Bergman, P.; Dubnov-Raz, G.; Esposito, S.; Ganmaa, D.; Ginde, A.A.; et al. Vitamin D supplementation to prevent acute respiratory tract infections: Systematic review and meta-analysis of individual participant data. BMJ 2017, 356, i6583. [Google Scholar] [CrossRef]
- Gorham, E.D.; Garland, C.F.; Garland, F.C.; Grant, W.B.; Mohr, S.B.; Lipkin, M.; Newmark, H.L.; Giovannucci, E.; Wei, M.; Holick, M.F. Optimal vitamin D status for colorectal cancer prevention: A quantitative meta analysis. Am. J. Prev. Med. 2007, 32, 210–216. [Google Scholar] [CrossRef]
- Zhang, Y.; Fang, F.; Tang, J.; Jia, L.; Feng, Y.; Xu, P.; Faramand, A. Association between vitamin D supplementation and mortality: Systematic review and meta-analysis. BMJ 2019, 366. [Google Scholar] [CrossRef] [PubMed]
- Australian Government, National Health and Medical Research Council. Vitamin D—Nutrient Reference Values. Available online: https://www.nrv.gov.au/nutrients/vitamin-d (accessed on 11 July 2020).
- SACN Vitamin D and Health Report. Available online: https://www.gov.uk/government/publications/sacn-vitamin-d-and-health-report (accessed on 11 July 2020).
- Nordiska Ministerrådet. Nordic Nutrition Recommendations 2012. Part 3: Vitamins A, D, E, K, Thiamin, Riboflavin, Niacin, Vitamin B6, Folate, Vitamin B12, Biotin, Pantothenic Acid and Vitamin C; Nordisk Ministerråd: Copenhagen, Denmark, 2014; ISBN 978-92-893-2679-7.
- French Agency for Food, Environment and Occupational Health & Safety: Vitamin D. Available online: https://www.anses.fr/en/content/vitamin-d (accessed on 14 July 2020).
- Jarosz, M.; Rychlik, E.; Stoś, K.; Wierzejska, R.; Wojtasik, A.; Charzewska, J.; Mojska, H.; Szponar, L.; Sajór, I.; Kłosiewicz-Latoszek, L.; et al. Normy Żywienia dla Populacji Polski; Polish National Food and Nutrition Institute: Warsaw, Poland, 2017; ISBN 978-83-86060-89-4. (In Polish)
- Reference Values—DACH-Referenzwerte—Schweizerische Gesellschaft für Ernährung. Available online: http://www.sge-ssn.ch/grundlagen/lebensmittel-und-naehrstoffe/naehrstoffempfehlungen/dachreferenzwerte/ (accessed on 14 July 2020). (In German).
- Institute of Medicine (US) Committee. Dietary Reference Intakes for Calcium and Vitamin D.; Ross, A.C., Taylor, C.L., Yaktine, A.L., Del Valle, H.B., Eds.; The National Academies Collection: Reports Funded by National Institutes of Health; National Academies Press (US): Washington, DC, USA, 2011. [Google Scholar]
- EFSA Panel on Dietetic Products, Nutrition and Allergies (NDA). Dietary reference values for vitamin D. EFSA J. 2016, 14, e4547. [Google Scholar] [CrossRef]
- Calvo, M.S.; Whiting, S.J.; Barton, C.N. Vitamin D intake: A global perspective of current status. J. Nutr. 2005, 135, 310–316. [Google Scholar] [CrossRef] [PubMed]
- Jayaratne, N.; Hughes, M.C.B.; Ibiebele, T.I.; van den Akker, S.; van der Pols, J.C. Vitamin D intake in Australian adults and the modeled effects of milk and breakfast cereal fortification. Nutrition 2013, 29, 1048–1053. [Google Scholar] [CrossRef] [PubMed]
- Spiro, A.; Buttriss, J.L. Vitamin D: An overview of vitamin D status and intake in Europe. Nutr. Bull. 2014, 39, 322–350. [Google Scholar] [CrossRef] [PubMed]
- Freisling, H.; Fahey, M.T.; Moskal, A.; Ocké, M.C.; Ferrari, P.; Jenab, M.; Norat, T.; Naska, A.; Welch, A.A.; Navarro, C.; et al. Region-specific nutrient intake patterns exhibit a geographical gradient within and between European countries. J. Nutr. 2010, 140, 1280–1286. [Google Scholar] [CrossRef] [PubMed]
- Flynn, A.; Hirvonen, T.; Mensink, G.B. Intake of selected nutrients from foods, from fortification and from supplements in various European countries. Food Nutr. Res. 2009, 12. [Google Scholar] [CrossRef]
- International Osteoporosis Foundation. Facts and Statistics. Available online: https://www.iofbonehealth.org/facts-statistics (accessed on 24 August 2020).
- Bailey, R.L.; Dodd, K.W.; Goldman, J.A.; Gahche, J.J.; Dwyer, J.T.; Moshfegh, A.J.; Sempos, C.T.; Picciano, M.F. Estimation of total usual calcium and vitamin D intakes in the United States. J. Nutr. 2010, 140, 817–822. [Google Scholar] [CrossRef] [PubMed]
- Benjamin, R.M. Bone health: Preventing osteoporosis. J. Am. Diet. Assoc. 2010, 110. [Google Scholar] [CrossRef]
- Cardwell, G.; Bornman, J.F.; James, A.P.; Black, L.J. A review of mushrooms as a potential source of dietary vitamin D. Nutrients 2018, 10, 1498. [Google Scholar] [CrossRef]
- Schmid, A.; Walther, B. Natural vitamin D content in animal products. Adv. Nutr. 2013, 4, 453–462. [Google Scholar] [CrossRef]
- Welch, A.A.; Lund, E.; Amiano, P.; Dorronsoro, M.; Brustad, M.; Kumle, M.; Rodriguez, M.; Lasheras, C.; Janzon, L.; Jansson, J.; et al. Variability of fish consumption within the 10 European countries participating in the European Investigation into Cancer and Nutrition (EPIC) study. Public Health Nutr. 2002, 5, 1273–1285. [Google Scholar] [CrossRef]
- Elmadfa, I. European nutrition and health report 2009. Forum Nutr. 2009, 62, 1–405. [Google Scholar] [PubMed]
- Ponder, A.; Włodarek, D.; Krusiec, J. Evaluation of nutrition in women who attend fitness classes. Pol. J. Sport Med. 2016, 32, 231–239. [Google Scholar] [CrossRef][Green Version]
- Gil, M.; Glodek, E.; Rudy, M. Evaluation of the dietary intake of vitamins and minerals in the daily food rations by the students of the Rzeszów University. Rocz. Państw. Zakł. Hig. 2012, 63, 441–446. [Google Scholar] [PubMed]
- Valsta, L.M.; Kaartinen, N.E.; Tapanainen, H.; Männistö, S.; Sääksjärvi, K. Ravitsemus Suomessa FinRavinto 2017—Tutkimus: Nutrition in Finland The National FINDIET 2017 Survey. Available online: /paper/Ravitsemus-Suomessa-FinRavinto-2017-tutkimus-%3A-in-Valsta-Kaartinen/f9530364fcdab51654324dd765a7b6f1bf6b6828 (accessed on 28 July 2020).
- Livingstone, K.M.; Celis-Morales, C.; Navas-Carretero, S.; San-Cristobal, R.; O’Donovan, C.B.; Forster, H.; Woolhead, C.; Marsaux, C.F.M.; Macready, A.L.; Fallaize, R.; et al. Profile of European adults interested in internet-based personalised nutrition: The Food4Me study. Eur. J. Nutr. 2016, 55, 759–769. [Google Scholar] [CrossRef] [PubMed]
- Manios, Y.; Moschonis, G.; Lambrinou, C.P.; Mavrogianni, C.; Tsirigoti, L.; Hoeller, U.; Roos, F.F.; Bendik, I.; Eggersdorfer, M.; Celis-Morales, C.; et al. Associations of vitamin D status with dietary intakes and physical activity levels among adults from seven European countries: The Food4Me study. Eur. J. Nutr. 2018, 57, 1357–1368. [Google Scholar] [CrossRef]
- Statistics Poland: Wyniki Badań Bieżących—Baza Demografia. Available online: http://demografia.stat.gov.pl/bazademografia/Tables.aspx (accessed on 19 July 2020). (In Polish)
- Głąbska, D.; Guzek, D.; Sidor, P.; Włodarek, D. Vitamin D dietary intake questionnaire validation conducted among young Polish women. Nutrients 2016, 8, 36. [Google Scholar] [CrossRef] [PubMed]
- Głąbska, D.; Uroić, V.; Guzek, D.; Pavić, E.; Bival, S.; Jaworska, K.; Giljević, Z.; Lange, E. The possibility of applying the Vitamin D Brief Food Frequency Questionnaire as a tool for a country with no vitamin D data in food composition tables. Nutrients 2018, 10, 1278. [Google Scholar] [CrossRef]
- Utri, Z.; Głąbska, D. Salmon intake intervention in the vulnerable group of young Polish women to maintain vitamin D status during the autumn season. Sustainability 2020, 12, 2829. [Google Scholar] [CrossRef]
- Wrzosek, M.; Woźniak, J.; Kozioł-Kaczorek, D.; Włodarek, D. The assessment of the supply of calcium and vitamin D in the diet of women regularly practicing sport. J. Osteoporos. 2019, 1. [Google Scholar] [CrossRef]
- National Cancer Institute/National Institutes of Health (NCI/NIH). Register of NCI-Developed Short Diet Assessment Instruments. Available online: https://epi.grants.cancer.gov/diet/shortreg/instruments/ (accessed on 27 July 2020).
- Jarosz, M.; Traczyk, I.; Stoś, K.; Charzewska, J.; Rychlik, E.; Kunachowicz, H.; Szostak, W.B.; Wojtasik, A.; Szponar, A.; Mojska, H.; et al. Normy Żywienia dla Populacji Polskiej—Nowelizacja; Polish National Food and Nutrition Institute: Warsaw, Poland, 2012; ISBN 978-83-86060-83-2. (In Polish)
- Hinkle, D.E.; Wiersma, W.; Jurs, S.G. Applied Statistics for the Behavioral Sciences; Houghton Mifflin: Boston, MA, USA, 2003. [Google Scholar]
- Ejsmont, J.; Zegan, M.; Michota-Katulska, E. Influence of vitamin D, B6, calcium and magnesium intake on premenstrual symptoms incidence. Prob. Hig. Epidemiol. 2014, 95, 765–771. [Google Scholar] [CrossRef]
- Kamińska, S.; Pikala, M.; Dziankowska-Zaborszczyk, E.; Bielecki, W.; Rębowska, E.; Kozakiewicz, K.; Nadrowski, P.; Drygas, W.; Kwaśniewska, M. Vitamin D–dietary intake, supplementation and metabolic status of Polish adults. Int. J. Occup. Med. Environ. Health 2020, 33, 107–118. [Google Scholar] [CrossRef] [PubMed]
- Seidler, T.; Szczuko, M. Nutrition mode evaluation among University of Agriculture students in Szczecin in 2006. Part I. Consumption of selected nutrients and nourishment state. Rocz. Państw. Zakł. Hig. 2009, 60, 59–64. [Google Scholar] [PubMed]
- Szczuko, M.; Seidler, T. Nutrition mode and nourishment status of WUT students in Szczecin as compared to different academical centers in Poland. Rocz. Państw. Zakł. Hig. 2010, 61, 295–306. [Google Scholar]
- Socha, K.; Borawska, M.H.; Markiewicz, R.; Charkiewicz, W.J. Ocena sposobu odżywiania studentek wyższej szkoły kosmetologii i ochrony zdrowia w Białymstoku. Bromat. Chem. Toksykol. 2009, 3, 704–708. [Google Scholar]
- Carter, R.L.; Sharbaugh, C.O.; Stapell, C.A. Reliability and validity of the 24-hour recall. J. Am. Diet. Assoc. 1981, 79, 542–547. [Google Scholar]
- Kunachowicz, H.; Przygoda, B.; Nadolna, I.; Iwanow, K. Tabele Składu i Wartości Odżywczej Żywności [Polish Food Composition Tables]; Wydawnictwo Lekarskie PZWL: Warsaw, Poland, 2017. (In Polish) [Google Scholar]
- Skop-Lewandowska, A.; Małek, A.; Gmur, M.; Kolarzyk, E. Mode of nutrition and popularity of dietary supplements and food supplements among young people attending fitness clubs. Probl. Hig. Epidemiol. 2013, 94, 786–793. [Google Scholar]
- Łagowska, K.; Woźniewicz, M.; Jeszka, J. Comparison of eating habits among students with admitted sex and level of physical activity. Rocz. Państw. Zakł. Hig. 2011, 62, 335–342. [Google Scholar]
- Holick, M.F.; Chen, T.C. Vitamin D deficiency: A worldwide problem with health consequences. Am. J. Clin. Nutr. 2008, 87, 1080S–1086S. [Google Scholar] [CrossRef]
- Holick, M.F. Deficiency of sunlight and vitamin D. BMJ 2008, 336, 1318–1319. [Google Scholar] [CrossRef]
- Lichthammer, A.; Nagy, B.; Orbán, C.; Tóth, T.; Csajbók, R.; Molnár, S.; Tátrai-Németh, K.; Bálint, M.V. A comparative study of eating habits, calcium and vitamin D intakes in the population of Central-Eastern European countries. New Med. 2015, 19, 66–70. [Google Scholar] [CrossRef]
- Pietinen, P.; Paturi, M.; Reinivuo, H.; Tapanainen, H.; Valsta, L.M. FINDIET 2007 Survey: Energy and nutrient intakes. Public Health Nutr. 2010, 13, 920–924. [Google Scholar] [CrossRef] [PubMed]
- Helldán, A.; Raulio, S.; Kosola, M.; Tapanainen, H.; Ovaskainen, M.L.; Virtanen, S. Finravinto 2012—Tutkimus—The National FINDIET 2012 Survey; National Institute for Health and Welfare: Helsinki, Finland, 2013.
- Amcoff, E.; Edberg, A.; Barbieri, H.E.; Lindroos, A.K.; Nälsén, C.; Pearson, M.; Lemming, E.W. Riksmaten—Vuxna 2010–2011 Livsmedels—Och Näringsintag Bland Vuxna i Sverige; Livsmedelsverket: Uppsala, Sweden, 2012. (In Swedish)
- Van der Meer, I.M.; Boeke, A.J.P.; Lips, P.; Grootjans-Geerts, I.; Wuister, J.D.; Devillé, W.L.J.M.; Wielders, J.P.M.; Bouter, L.M.; Middelkoop, B.J.C. Fatty fish and supplements are the greatest modifiable contributors to the serum 25-hydroxyvitamin D concentration in a multiethnic population. Clin. Endocrinol. Oxf. 2008, 68, 466–472. [Google Scholar] [CrossRef]
- Statistics Poland. Hausehold Budget Survey in 2017. Available online: https://stat.gov.pl/en/topics/living-conditions/living-conditions/household-budget-survey-in-2017,2,12.html (accessed on 30 July 2020).
- Szymandera-Buszka, K.; Waszkowiak, K.; Woźniak, P. The estimation of consumption of food products being iodine sources among women of the Wielkopolska region. Probl. Hig. Epidemiol. 2011, 92, 73–76. [Google Scholar]
- Hryszko, K. Rynek Ryb [Fish market] Nr 29/2018. Available online: https://www.ierigz.waw.pl/publikacje/analizy-rynkowe/rynek-ryb/23234,3,3,0,nr-29-2018-rynek-ryb.html (accessed on 30 July 2020). (In Polish).
- The MSC Fisheries Standard—Marine Stewardship Council. Available online: https://www.msc.org/standards-and-certification/fisheries-standard (accessed on 16 September 2020).
- Carpenter, G.; Heisse, C. Landing the blame: Overfishing in the Baltic Sea 2020. Available online: https://www.researchgate.net/publication/337745749_Landing_the_blame_Overfishing_in_the_Baltic_Sea_2020 (accessed on 16 September 2020).
- Thomas, F.; Jamin, E.; Wietzerbin, K.; Guérin, R.; Lees, M.; Morvan, E.; Isabelle, B.; Derrien, S.; Moreno-Rojas, J.; Serra, F.; et al. Determination of origin of Atlantic salmon (Salmo salar): The use of multiprobe and multielement isotopic analyses in combination with fatty acid composition to assess wild or farmed origin. J. Agric. Food Chem. 2008, 56, 989–997. [Google Scholar] [CrossRef]


| Region | Number (%) of Participants | Number (%) of Polish Women Aged 15–30 Living in Each Region * | Voivodeship (within Region) | Number (%) of Participants | Number (%) of Polish Women Aged 15–30 Living in Each Voivodeship * |
|---|---|---|---|---|---|
| Central | 200 (19.4) | 699,529 (19.5) | Łódź | 60 (5.8) | 219,282 (6.1) |
| Masovian | 140 (13.6) | 480,247 (13.4) | |||
| Southern | 200 (19.4) | 733,949 (20.4) | Lesser Poland | 80 (7.8) | 335,660 (9.3) |
| Silesian | 120 (11.6) | 398,289 (11.1) | |||
| Eastern | 192 (18.6) | 661,160 (18.4) | Lublin | 52 (5.0) | 207,901 (5.8) |
| Subcarpathian | 60 (5.8) | 218,962 (6.1) | |||
| Podlaskie | 40 (3.9) | 116,917 (3.3) | |||
| Holy Cross | 40 (3.9) | 117,380 (3.3) | |||
| North- Western | 175 (17.0) | 584,007 (16.3) | Lubusz | 35 (3.4) | 94,611 (2.6) |
| Greater Poland | 90 (8.7) | 333,275 (9.3) | |||
| West Pomeranian | 50 (4.8) | 156,121 (4.3) | |||
| South- Western | 100 (9.7) | 348,193 (9.7) | Lower Silesian | 70 (6.8) | 256,906 (7.2) |
| Opole | 30 (2.9) | 91,287 (2.5) | |||
| Northern | 165 (16.0) | 563,966 (15.7) | Kuyavian-Pomeranian | 60 (5.8) | 200,291 (5.6) |
| Pomeranian | 65 (6.3) | 222,551 (6.2) | |||
| Warmian-Masurian | 40 (3.9) | 141,124 (3.9) | |||
| p ** | 0.9665 | p ** | 0.7654 | ||
| Vitamin D Source | Mean ± SD (µg) | Median (Min–Max) (µg) |
|---|---|---|
| Total intake from food | 3.85 ± 2.96 | 3.09 * (0.00–24.52) |
| Salmon, rainbow trout, herring, eel | 0.51 ± 1.07 | 0.26 * (0.00–12.75) |
| Halibut, mackerel, brook trout, sole, tuna | 0.10 ± 0.24 | 0.06 * (0.00–4.17) |
| Cod, flounder, plaice, pollock, hake | 0.02 ± 0.05 | 0.00 * (0.00–0.83) |
| Herring, sardine and tuna products | 0.59 ± 0.91 | 0.41 * (0.00–12.36) |
| Other fish products | 0.02 ± 0.04 | 0.00 * (0.00–0.47) |
| Dairy products | 0.51 ± 0.44 | 0.40 * (0.00–4.12) |
| Eggs | 0.83 ± 1.04 | 0.50 * (0.00–11.50) |
| Meat and meat products | 0.64 ± 0.64 | 0.49 * (0.00–5.37) |
| Cereals | 0.17 ± 0.18 | 0.13 * (0.00–2.21) |
| Fats | 0.47 ± 1.12 | 0.09 * (0.00–13.60) |
| Fish Product Group | Mean ± SD (Servings/Month) | Median (Min–Max) (Servings/Month) |
|---|---|---|
| Salmon, rainbow trout, herring, eel | 1.97 ± 4.17 | 1.00 * (0.00–50.00) |
| Halibut, mackerel, brook trout, sole, tuna | 1.19 ± 3.06 | 1.00 * (0.00–50.00) |
| Cod, flounder, plaice, pollock, hake | 1.19 ± 3.53 | 0.00 * (0.00–50.00) |
| Herring, sardine and tuna products | 1.43 ± 2.22 | 1.00 * (0.00–30.00) |
| Other fish products | 0.58 ± 1.19 | 0.00 * (0.00–15.00) |
| Vitamin D Source | p | R |
|---|---|---|
| Salmon, rainbow trout, herring, eel | <0.0001 | 0.4914 |
| Halibut, mackerel, brook trout, sole, tuna | <0.0001 | 0.3641 |
| Cod, flounder, plaice, pollock, hake | <0.0001 | 0.2023 |
| Herring, sardine and tuna products | <0.0001 | 0.5314 |
| Other fish products | <0.0001 | 0.3007 |
| Dairy products | <0.0001 | 0.4877 |
| Eggs | <0.0001 | 0.5989 |
| Meat and meat products | <0.0001 | 0.4587 |
| Cereals | <0.0001 | 0.3146 |
| Fats | <0.0001 | 0.3918 |
| Food Group | p | R |
|---|---|---|
| Salmon, rainbow trout, herring, eel | <0.0001 | 0.4790 |
| Halibut, mackerel, brook trout, sole, tuna | <0.0001 | 0.3694 |
| Cod, flounder, plaice, pollock, hake | <0.0001 | 0.2083 |
| Herring, sardine and tuna products | <0.0001 | 0.5314 |
| Other fish products | <0.0001 | 0.3007 |
| Fish Species | Predominantly Choosing Specific Fish Species | Mean ± SD (µg) | Median (Min–Max) (µg) | Correlation between Vitamin D Intake from Fish and Total Dietary Intake | p for Sub-Group Comparison | ||
|---|---|---|---|---|---|---|---|
| p | R | Vitamin D from Fish | Total Dietary Vitamin D | ||||
| Salmon | Choosing (n = 591) | 4.21 ± 3.07 | 3.31 * (0.52–24.52) | <0.0001 | 0.6839 | <0.0001 | <0.0001 |
| Not choosing (n = 441) | 3.37 ± 2.73 | 2.65 * (0.00–19.94) | <0.0001 | 0.6305 | |||
| Rainbow trout | Choosing (n = 183) | 4.65 ± 3.26 | 3.59 * (0.52–19.37) | <0.0001 | 0.7157 | <0.0001 | <0.0001 |
| Not choosing (n = 849) | 3.68 ± 2.86 | 2.90 * (0.00–24.52) | <0.0001 | 0.6603 | |||
| Herring | Choosing (n = 493) | 4.56 ± 3.18 | 3.76 * (0.12–24.52) | <0.0001 | 0.6791 | <0.0001 | <0.0001 |
| Not choosing (n = 539) | 3.20 ± 2.57 | 2.55 * (0.00–16.06) | <0.0001 | 0.5870 | |||
| Eel | Choosing (n = 8) | 4.36 ± 4.37 | 3.14 * (1.47–14.81) | 0.6514 | −0.1905 | 0.1733 | 0.9416 |
| Not choosing (n = 1024) | 3.85 ± 2.94 | 3.09 * (0.00–24.52) | <0.0001 | 0.6821 | |||
| Predominantly Choosing Specific Fish Species as a Predictor | Odds Ratio | 95% Confidence Interval | Wald Stat | p-Value | |
|---|---|---|---|---|---|
| Model developed for the level of 5 µg | Salmon | 1.5793 | 1.1478–2.1730 | 7.7413 | 0.0050 |
| Rainbow trout | 1.5851 | 1.0942–2.2962 | 5.8315 | 0.0148 | |
| Herring | 2.5356 | 1.8544–3.4670 | 33.3889 | <0.0001 | |
| Eel | 0.4797 | 0.0580–3.9655 | 0.4567 | 0.4954 | |
| Model developed for the level of 10 µg | Salmon | 1.3765 | 0.7495–2.5278 | 1.0615 | 0.3029 |
| Rainbow trout | 1.6671 | 0.8599–3.2317 | 2.2898 | 0.1302 | |
| Herring | 1.9413 | 1.0696–3.5235 | 4.7570 | 0.0292 | |
| Eel | 2.8019 | 0.3307–23.7382 | 0.8931 | 0.3446 | |
Publisher’s Note: MDPI stays neutral with regard to jurisdictional claims in published maps and institutional affiliations. |
© 2020 by the authors. Licensee MDPI, Basel, Switzerland. This article is an open access article distributed under the terms and conditions of the Creative Commons Attribution (CC BY) license (http://creativecommons.org/licenses/by/4.0/).
Share and Cite
Utri, Z.; Głąbska, D. Vitamin D Intake in a Population-Based Sample of Young Polish Women, Its Major Sources and the Possibility of Meeting the Recommendations. Foods 2020, 9, 1482. https://doi.org/10.3390/foods9101482
Utri Z, Głąbska D. Vitamin D Intake in a Population-Based Sample of Young Polish Women, Its Major Sources and the Possibility of Meeting the Recommendations. Foods. 2020; 9(10):1482. https://doi.org/10.3390/foods9101482
Chicago/Turabian StyleUtri, Zofia, and Dominika Głąbska. 2020. "Vitamin D Intake in a Population-Based Sample of Young Polish Women, Its Major Sources and the Possibility of Meeting the Recommendations" Foods 9, no. 10: 1482. https://doi.org/10.3390/foods9101482
APA StyleUtri, Z., & Głąbska, D. (2020). Vitamin D Intake in a Population-Based Sample of Young Polish Women, Its Major Sources and the Possibility of Meeting the Recommendations. Foods, 9(10), 1482. https://doi.org/10.3390/foods9101482