Quality Retention of Fresh Tuna Stored Using Supercooling Technology

 ,
,  ,
, 
Abstract
1. Introduction
2. Materials and Methods
2.1. Sample Preparation
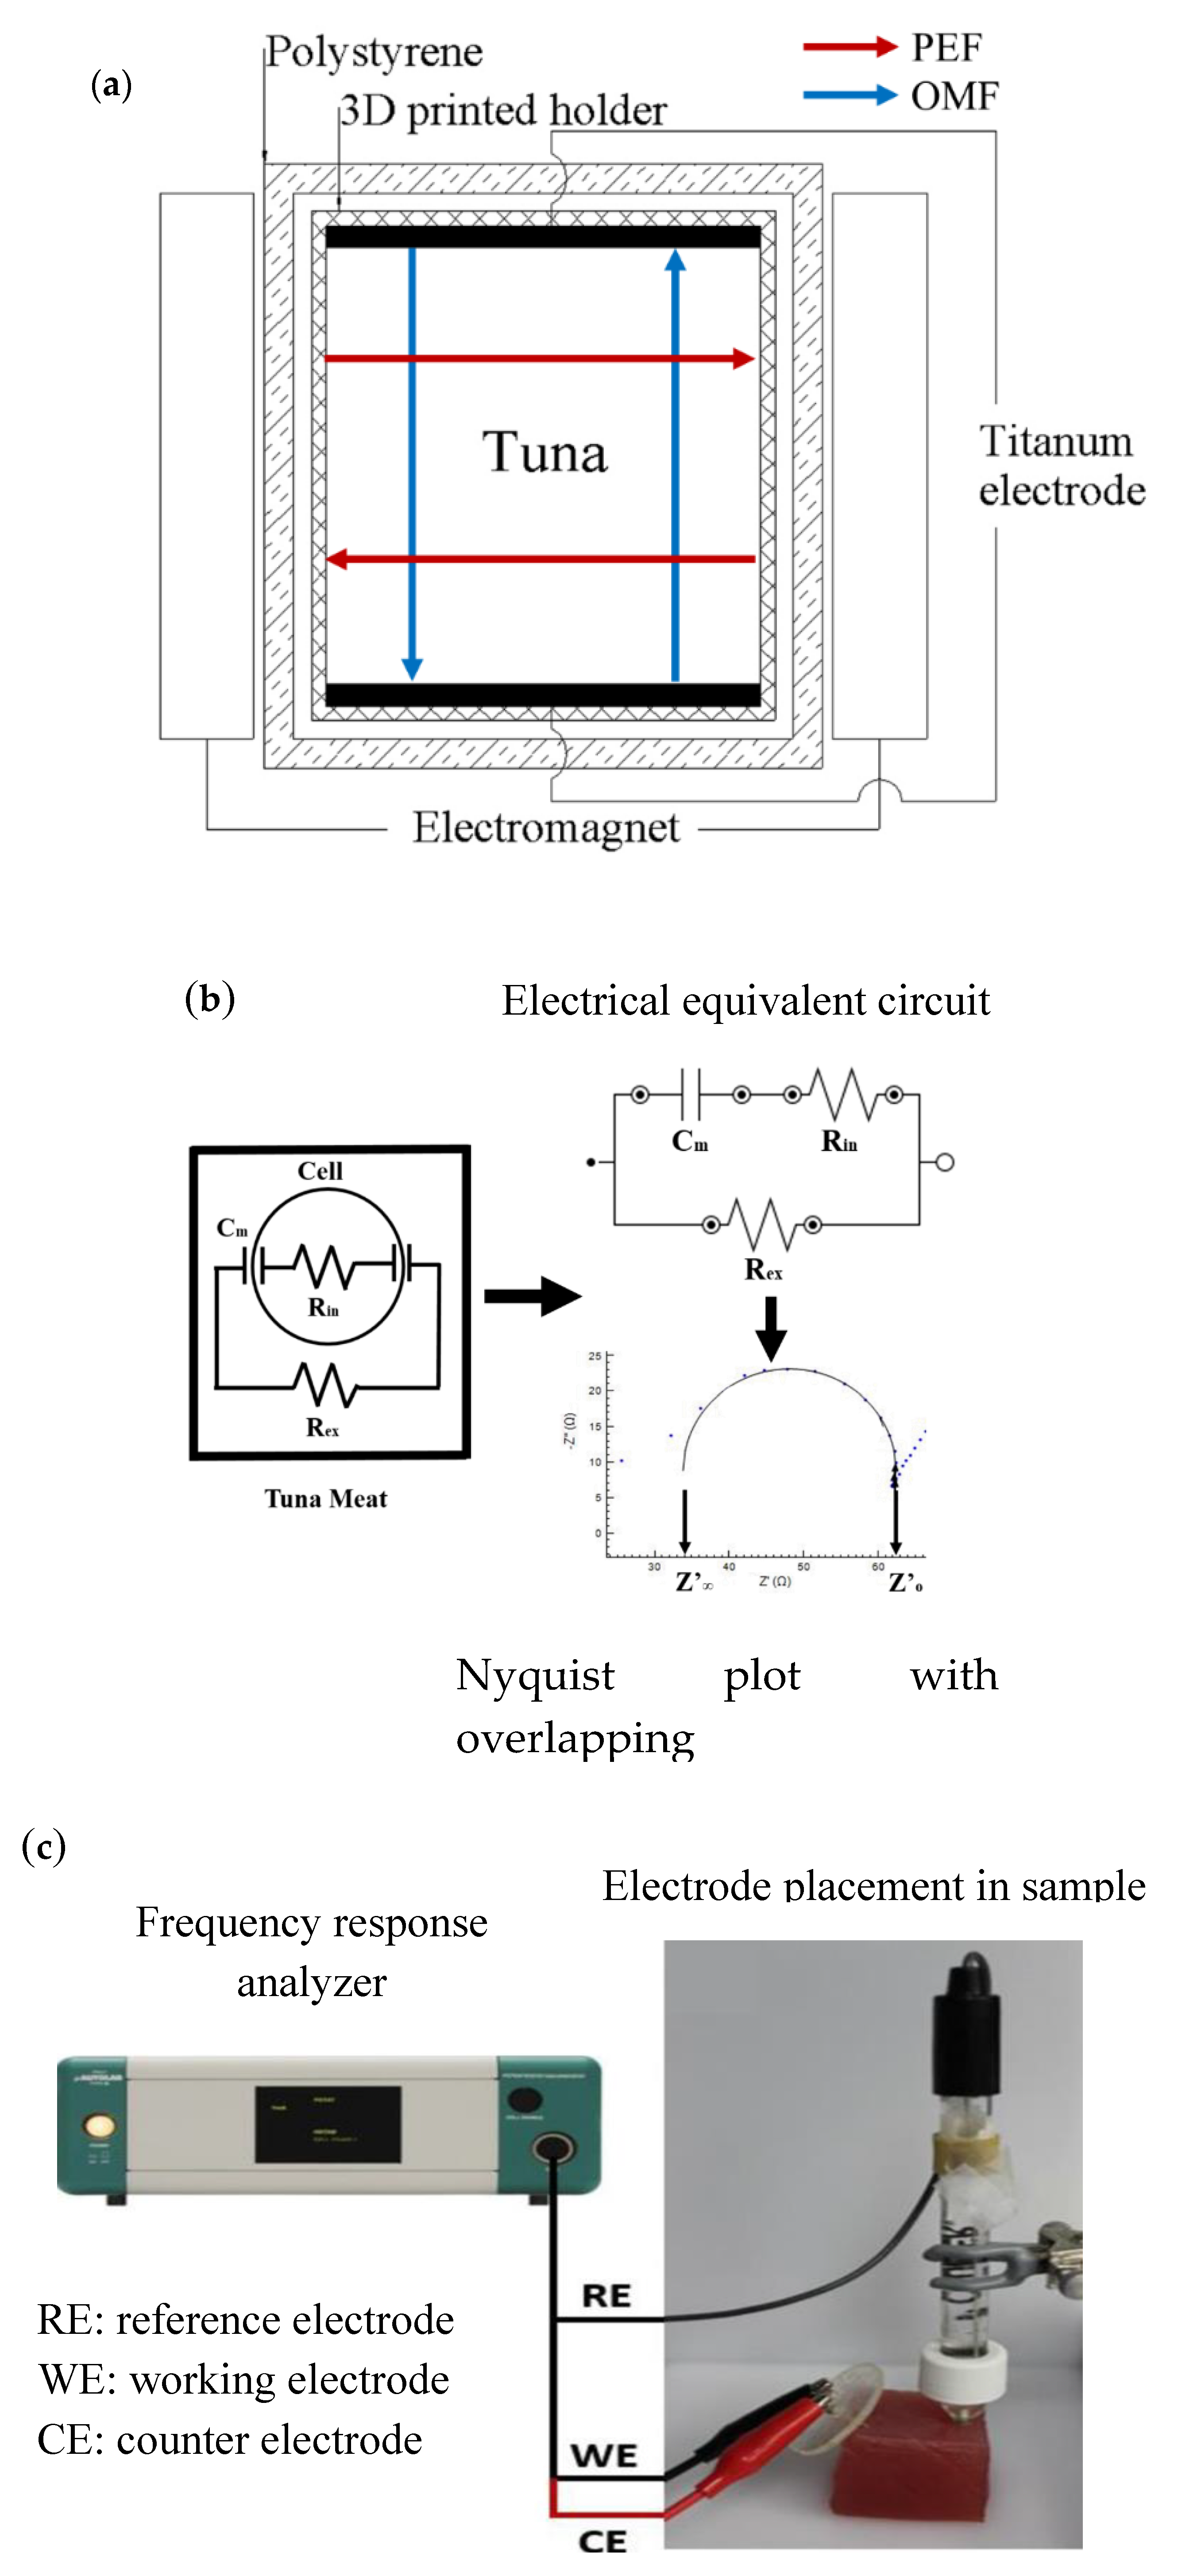
2.2. PEF and OMF Supercooling Treatment
2.3. Electrochemical Impedance Spectroscopy (EIS)
2.4. Drip Loss
2.5. Microstructure Analysis
2.6. ATP-Related Compounds and K-Value
2.7. Statistical Analysis
3. Results and Discussion
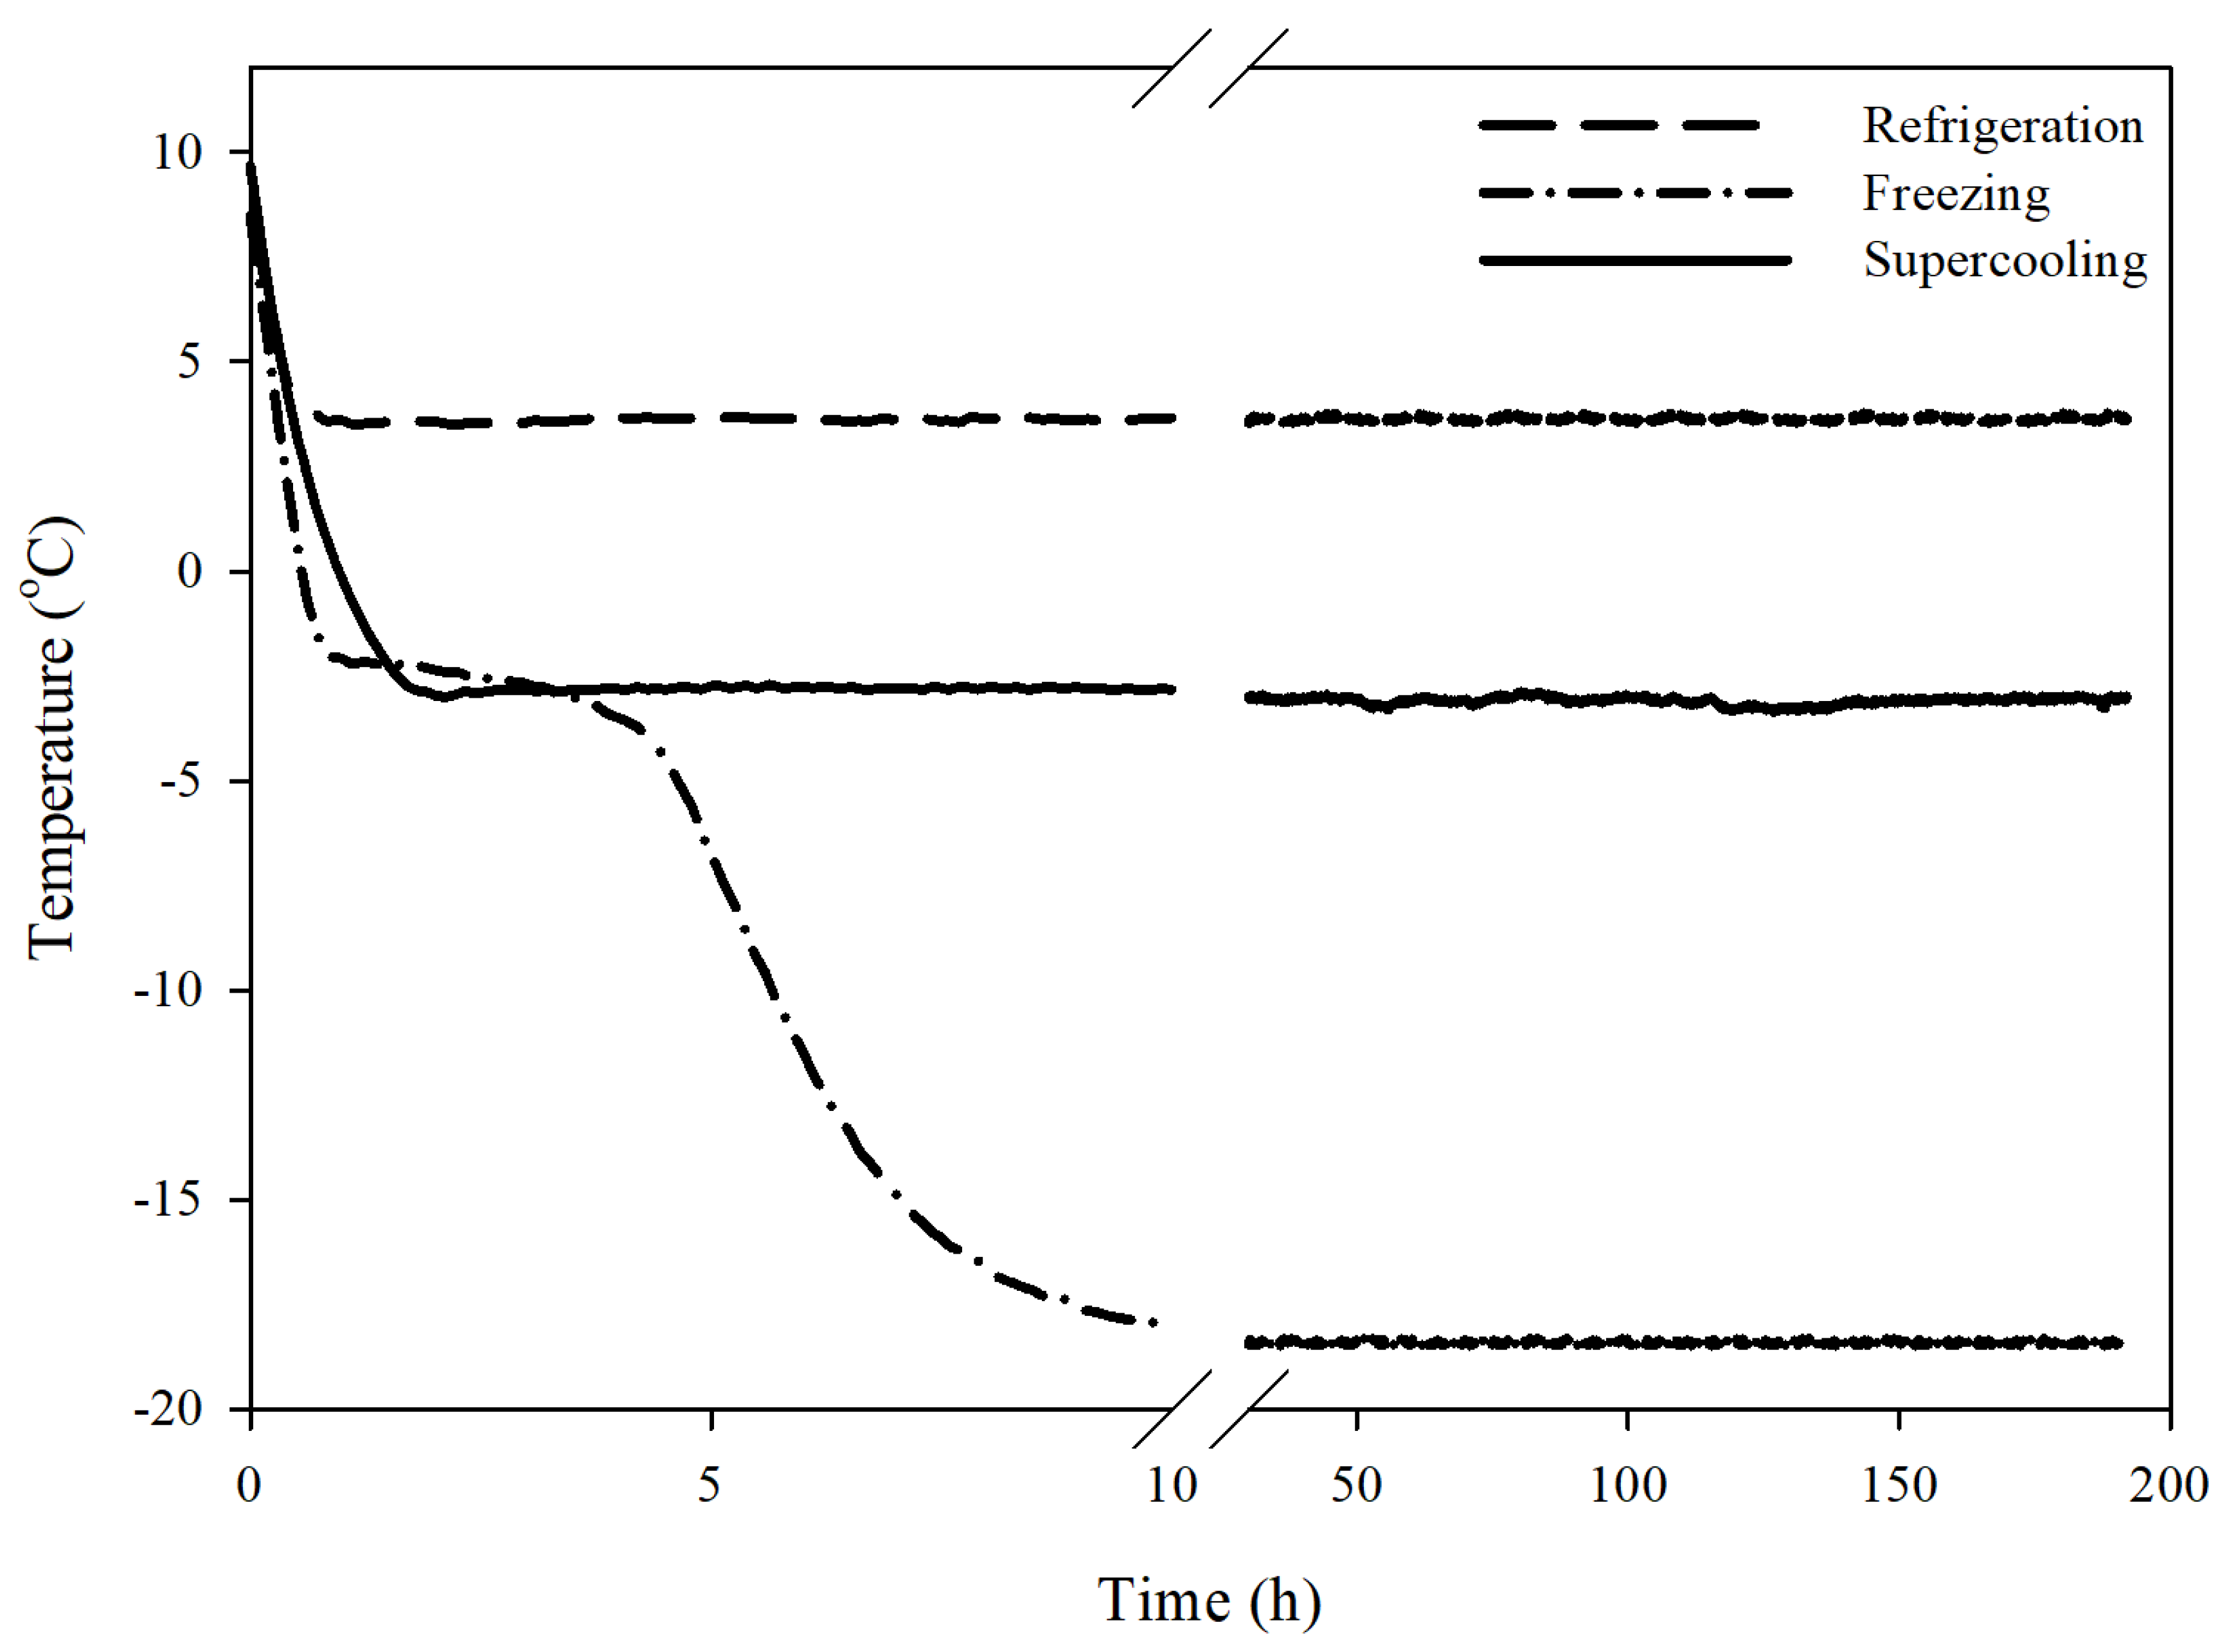
3.1. PEF and OMF Treatment for the Extension of Supercooling within Tuna
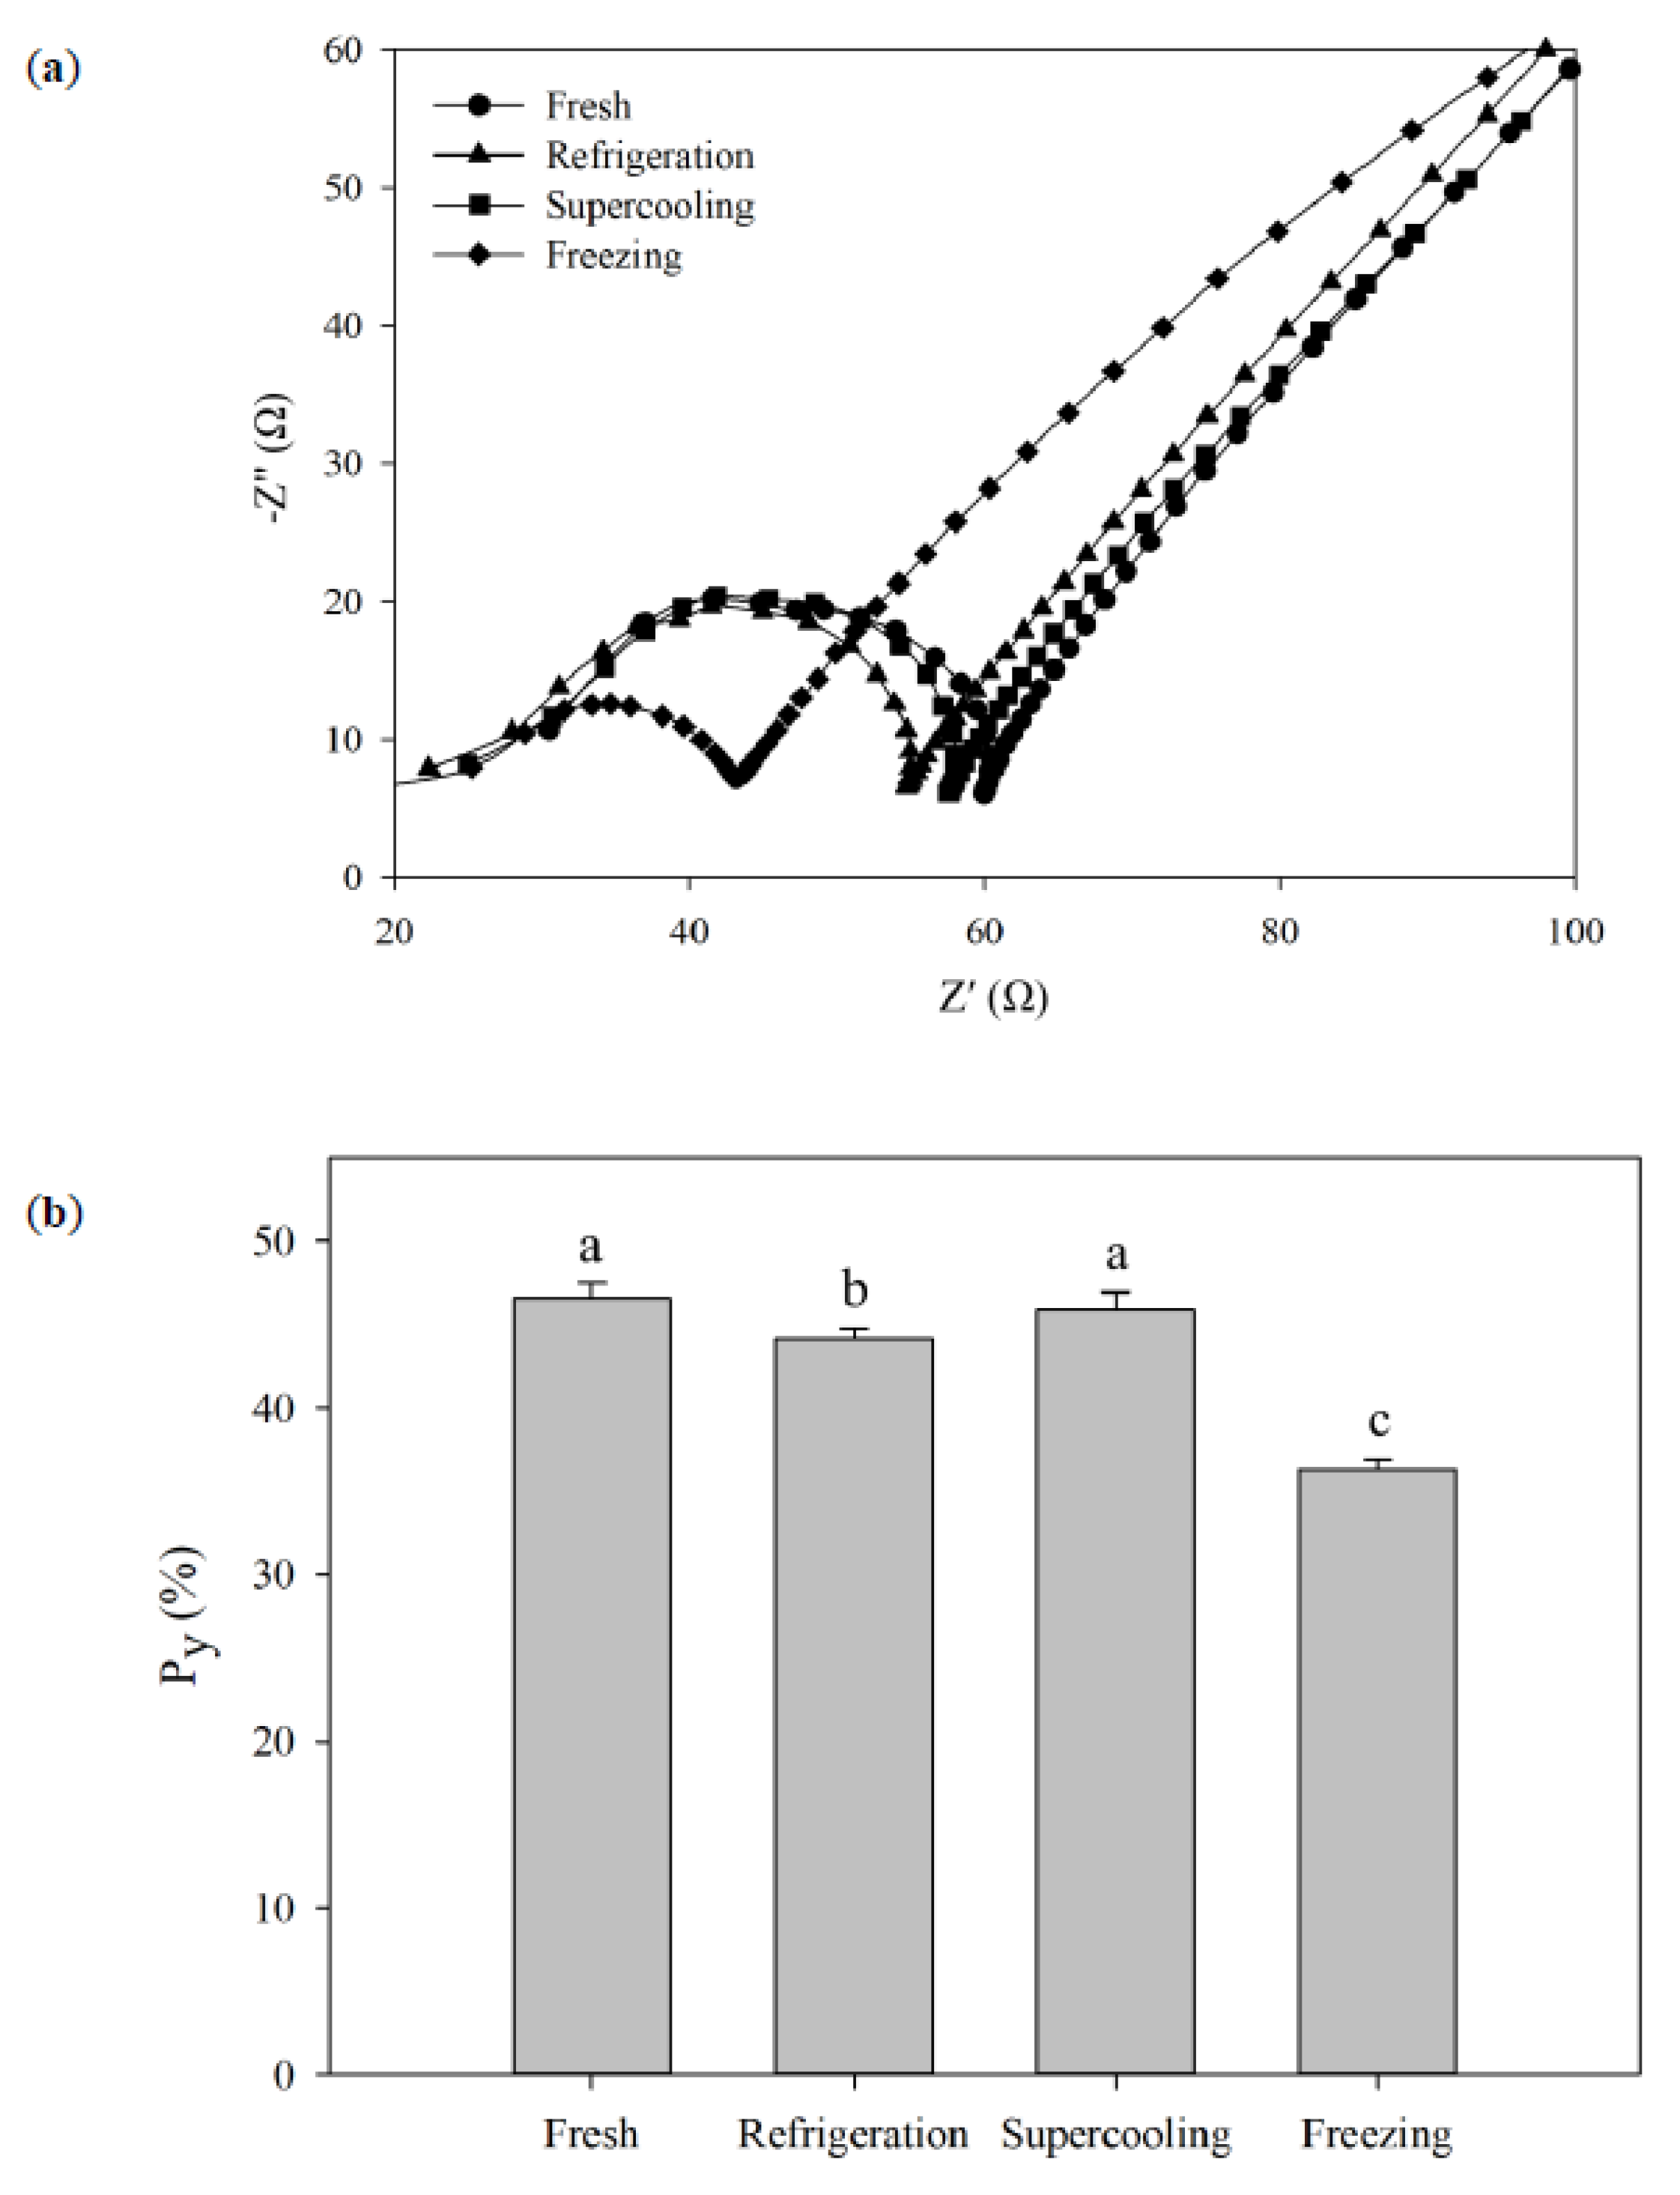
3.2. Electrochemical Impedance Spectroscopy (EIS) Analysis
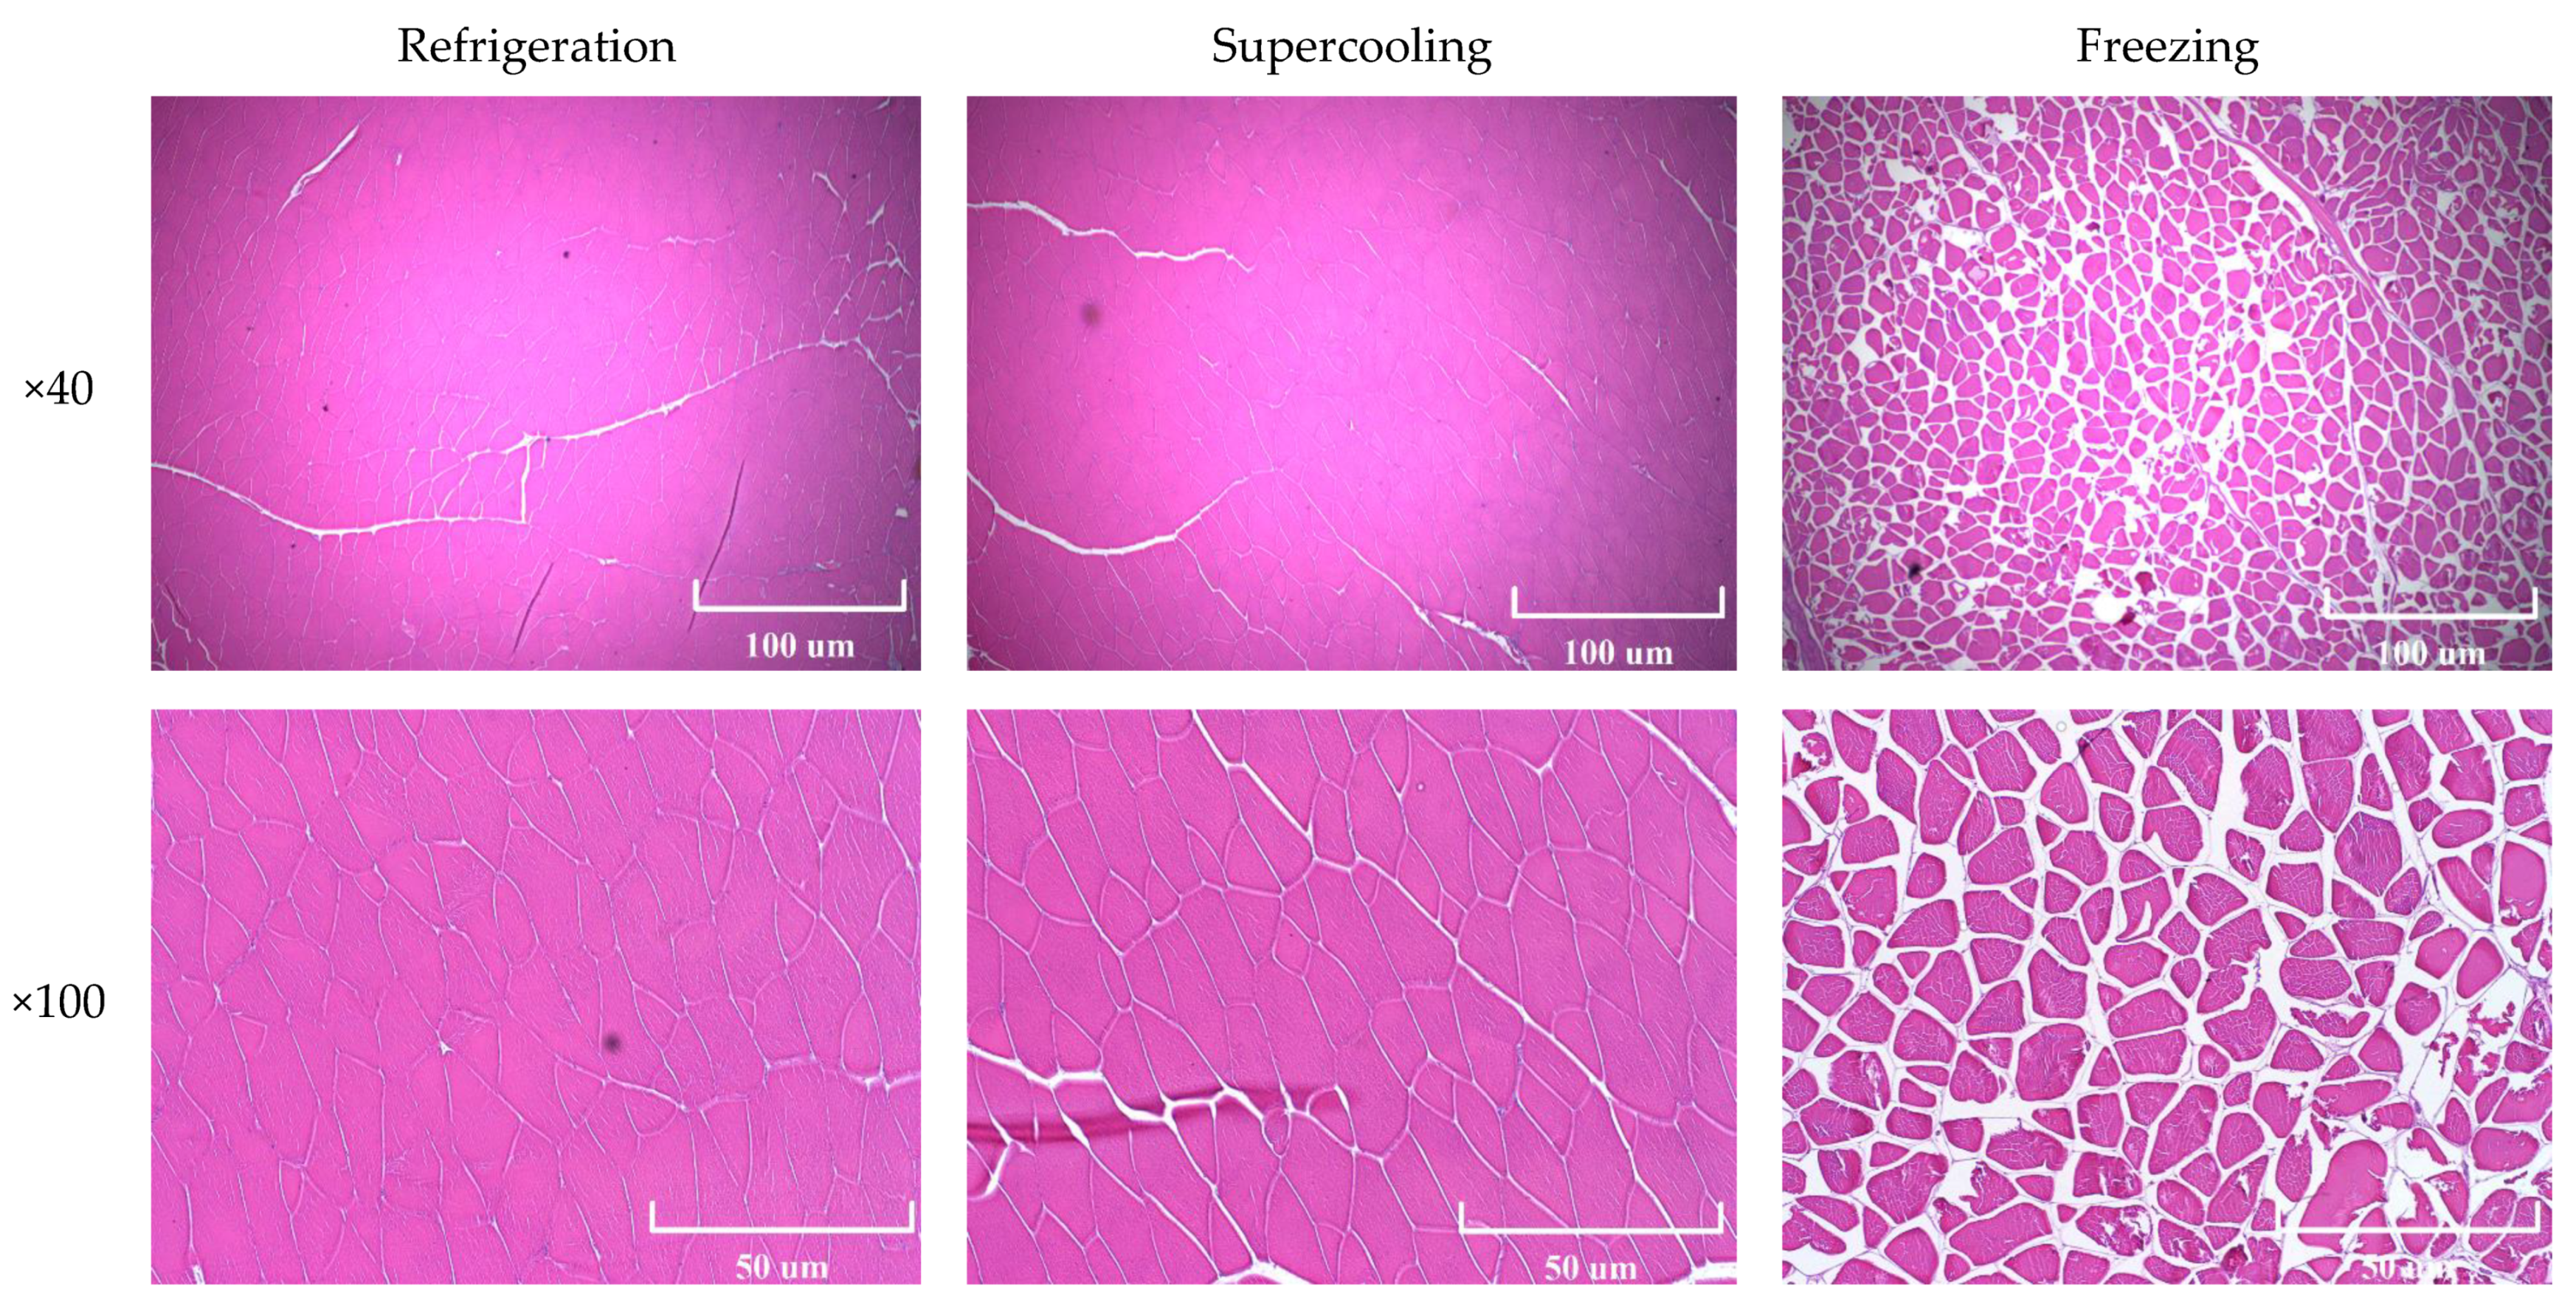
3.3. Microstructure Analysis
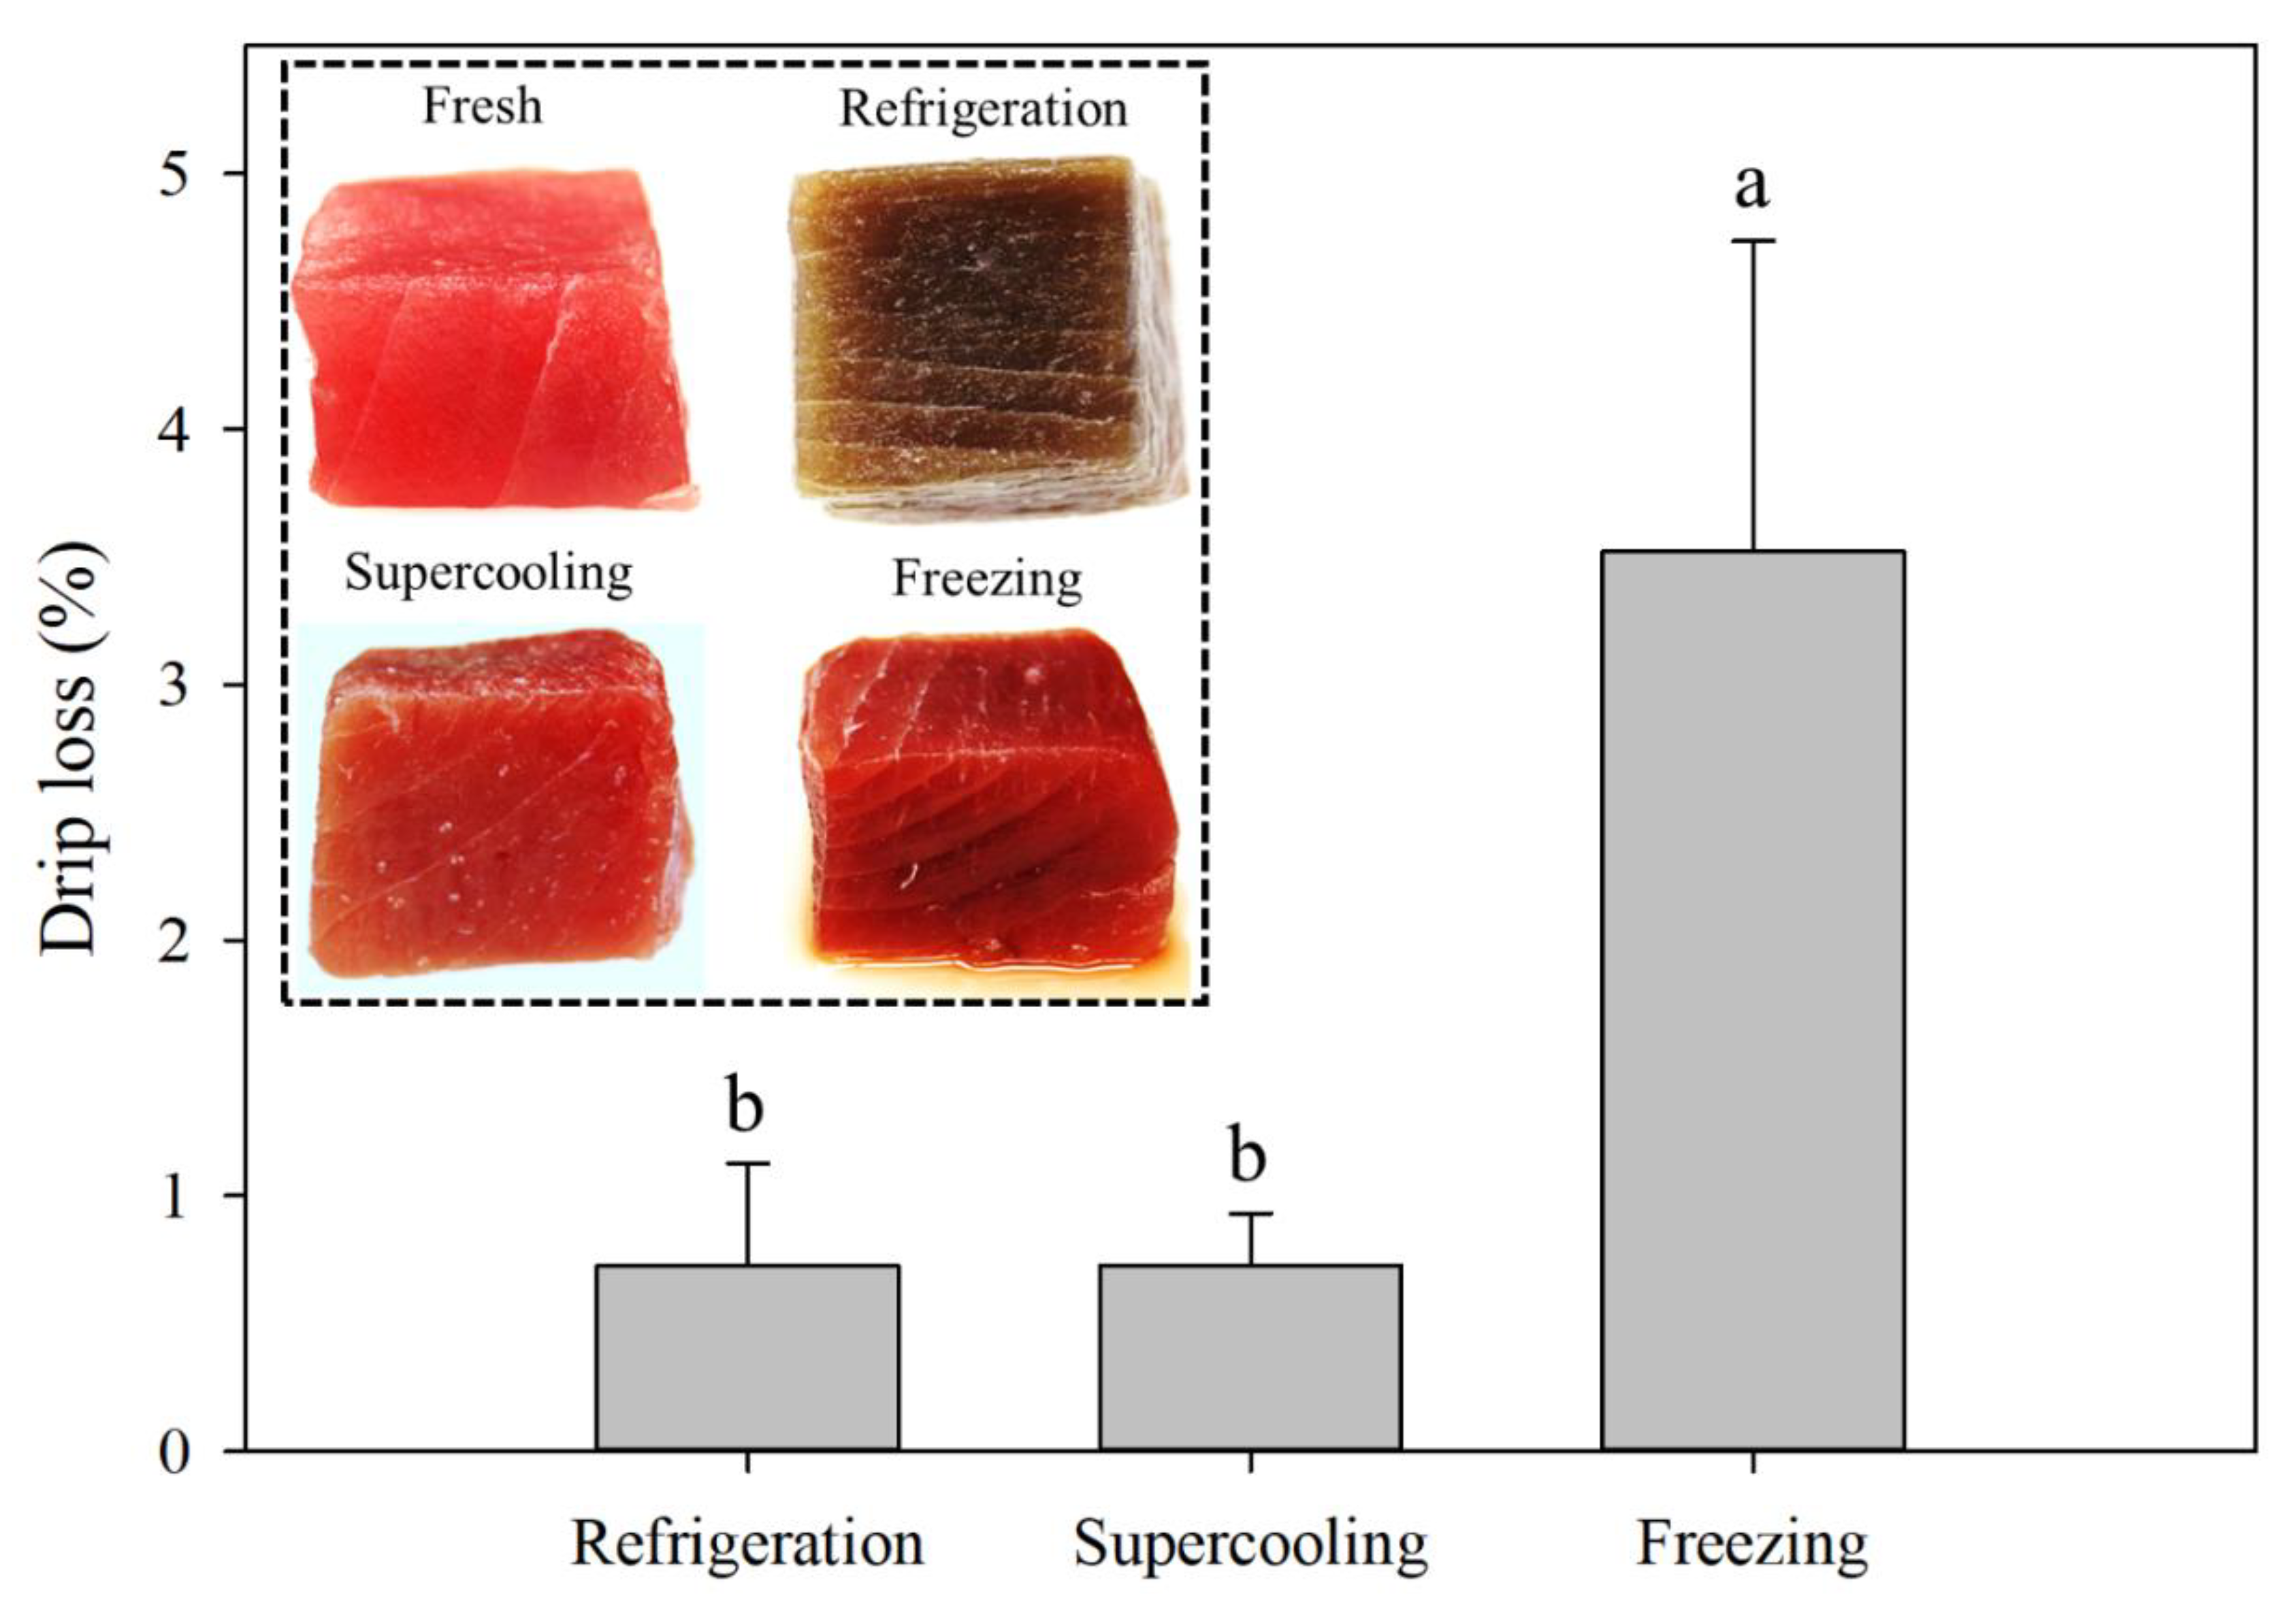
3.4. Drip Loss
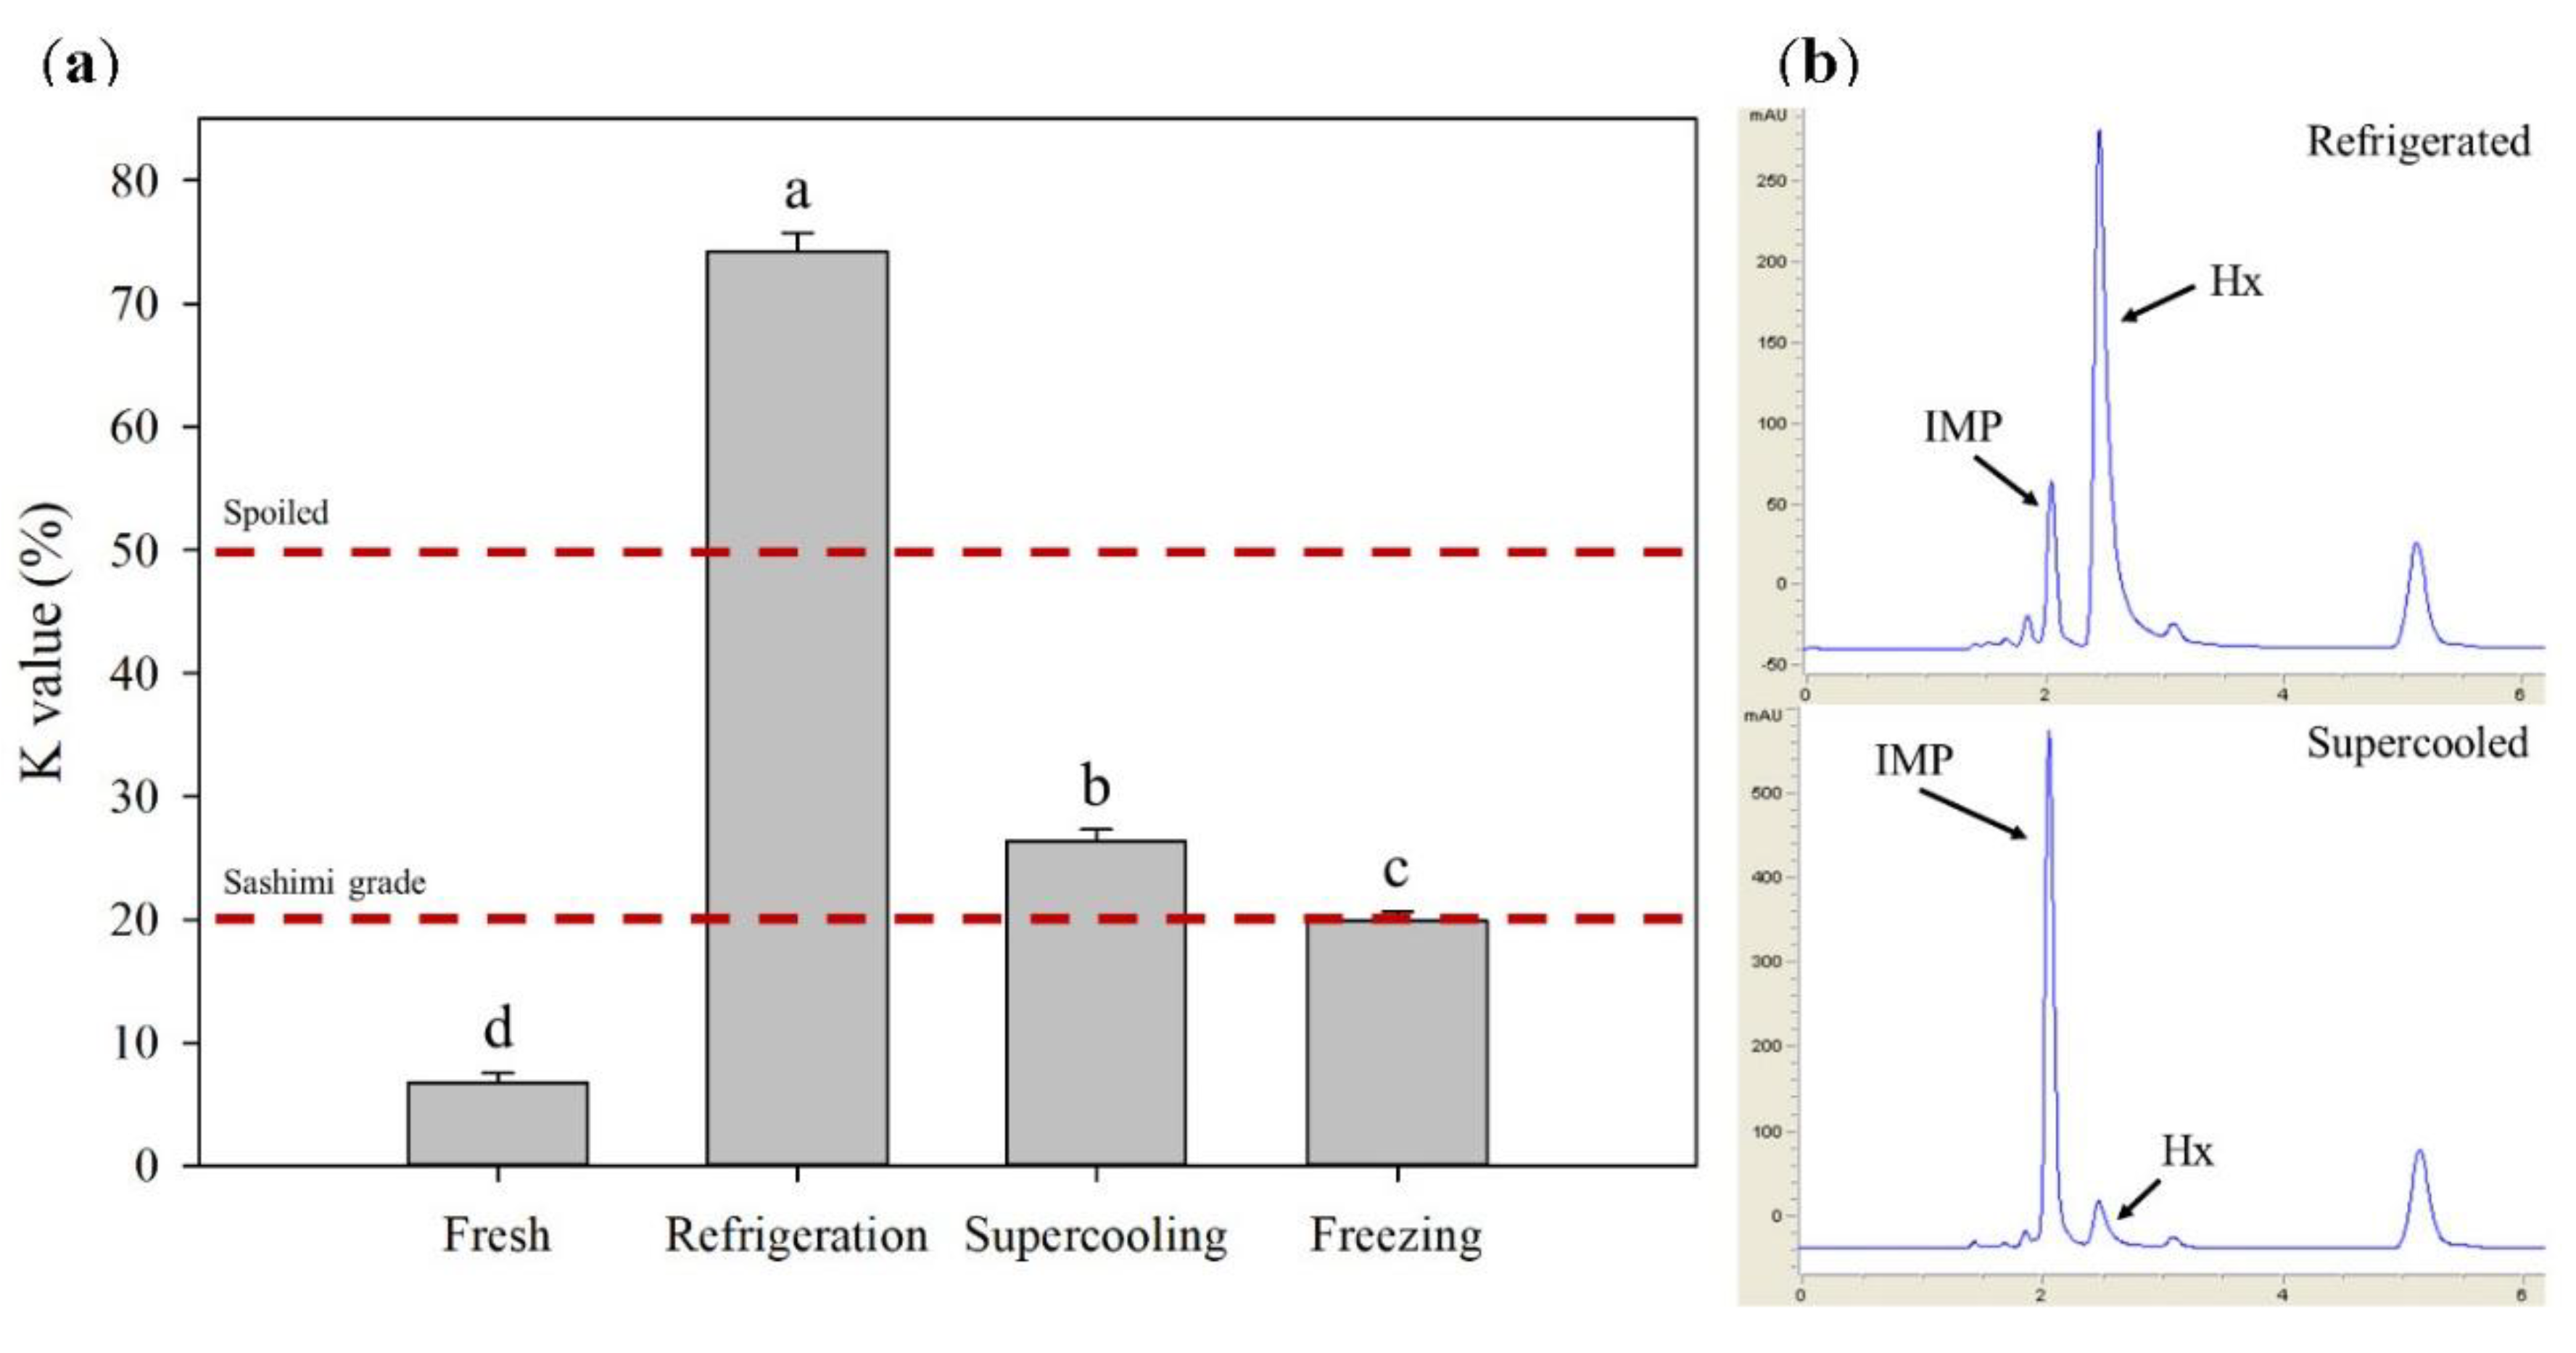
3.5. K-Value
4. Conclusions
Author Contributions
Funding
Conflicts of Interest
References
- Potter, N.N.; Hotchkiss, J.H. Food Science; Springer US: New York, NY, USA, 1998; p. 165. [Google Scholar]
- Evans, J.A. Frozen Food Science and Technology; Blackwell Publishing: Oxford, UK, 2009; pp. 1–3. [Google Scholar]
- Shafel, T.; Lee, S.H.; Jun, S. Food Preservation Technology at Subzero Temperatures: A Review. J. Biosyst. Eng. 2015, 40, 261–270. [Google Scholar] [CrossRef]
- Fukuma, Y.; Yamane, A.; Itoh, T.; Tsukamasa, Y.; Ando, M. Application of supercooling to long-term storage of fish meat. Fish. Sci. 2012, 78, 451–461. [Google Scholar] [CrossRef]
- James, C.; Seignemartin, V.; James, S.J. The freezing and supercooling of garlic (Allium sativum L.). Int. J. Refrig. 2009, 32, 253–260. [Google Scholar] [CrossRef]
- Kang, T.; You, Y.; Jun, S. Supercooling preservation technology in food and biological samples: A review focused on electric and magnetic field applications. Food Sci. Biotechnol. 2020, 1–19. [Google Scholar] [CrossRef] [PubMed]
- Mok, J.H.; Her, J.-Y.; Kang, T.; Hoptowit, R.; Jun, S. Effects of pulsed electric field (PEF) and oscillating magnetic field (OMF) combination technology on the extension of supercooling for chicken breasts. J. Food Eng. 2017, 196, 27–35. [Google Scholar] [CrossRef]
- Chang, B.-Y.; Park, S.-M. Electrochemical impedance spectroscopy. Annu. Rev. Anal. Chem. 2010, 3, 207–229. [Google Scholar] [CrossRef] [PubMed]
- Pliquett, U. Bioimpedance: A review for food processing. Food Eng. Rev. 2010, 2, 74–94. [Google Scholar] [CrossRef]
- Fuentes, A.; Masot, R.; Fernández-Segovia, I.; Ruiz-Rico, M.; Alcañiz, M.; Barat, J.M. Differentiation between fresh and frozen-thawed sea bream (Sparus aurata) using impedance spectroscopy techniques. Innov. Food Sci. Emerg. Technol. 2013, 19, 210–217. [Google Scholar] [CrossRef]
- Ballin, N.Z.; Lametsch, R. Analytical methods for authentication of fresh vs. thawed meat—A review. Meat Sci. 2008, 80, 151–158. [Google Scholar] [CrossRef]
- Damez, J.-L.; Clerjon, S.; Abouelkaram, S.; Lepetit, J. Dielectric behavior of beef meat in the 1–1500kHz range: Simulation with the Fricke/Cole–Cole model. Meat Sci. 2007, 77, 512–519. [Google Scholar] [CrossRef]
- Pliquett, U.; Altmann, M.; Pliquett, F.; Schöberlein, L. Py—A parameter for meat quality. Meat Sci. 2003, 65, 1429–1437. [Google Scholar] [CrossRef]
- Ryder, J.M. Determination of adenosine triphosphate and its breakdown products in fish muscle by high-performance liquid chromatography. J. Agric. Food Chem. 1985, 33, 678–680. [Google Scholar] [CrossRef]
- Cheng, J.H.; Sun, D.W.; Pu, H.; Zhu, Z. Development of hyperspectral imaging coupled with chemometric analysis to monitor K value for evaluation of chemical spoilage in fish fillets. Food Chem. 2015, 185, 245–253. [Google Scholar] [CrossRef] [PubMed]
- Dalvi-Isfahan, M.; Hamdami, N.; Xanthakis, E.; Le-Bail, A. Review on the control of ice nucleation by ultrasound waves, electric and magnetic fields. J. Food Eng. 2017, 195, 222–234. [Google Scholar] [CrossRef]
- Pang, X.-F.; Deng, B. The changes of macroscopic features and microscopic structures of water under influence of magnetic field. Phys. B Condens. Matter 2008, 403, 3571–3577. [Google Scholar] [CrossRef]
- Mok, J.H.; Choi, W.; Park, S.H.; Lee, S.H.; Jun, S. Emerging pulsed electric field (PEF) and static magnetic field (SMF) combination technology for food freezing. Int. J. Refrig. 2015, 50, 137–145. [Google Scholar] [CrossRef]
- Niu, J.; Lee, J.Y. A new approach for the determination of fish freshness by electrochemical impedance spectroscopy. J. Food Sci. 2000, 65, 780–785. [Google Scholar] [CrossRef]
- Fernández-Segovia, I.; Fuentes, A.; Aliño, M.; Masot, R.; Alcañiz, M.; Barat, J.M. Detection of frozen-thawed salmon (Salmo salar) by a rapid low-cost method. J. Food Eng. 2012, 113, 210–216. [Google Scholar] [CrossRef]
- Zhang, L.; Shen, H.; Luo, Y. Study on the electric conduction properties of fresh and frozen-thawed grass carp (Ctenopharyngodon idellus) and tilapia (Oreochromis niloticus). Int. J. Food Sci. Technol. 2010, 45, 2560–2564. [Google Scholar] [CrossRef]
- Sun, Q.; Zhao, X.; Zhang, C.; Xia, X.; Sun, F.; Kong, B. Ultrasound-assisted immersion freezing accelerates the freezing process and improves the quality of common carp (Cyprinus carpio) at different power levels. LWT 2019, 108, 106–112. [Google Scholar] [CrossRef]
- Garthwaite, G.A. Fish Processing Technology; Blackie Academic & Professional: New York, NY, USA, 2012; pp. 123–126. [Google Scholar]
- Hamidi, N.; Tsuruta, T. Improvement of freezing quality of food by pre-dehydration with microwave-vacuum drying. In Proceedings of the Heat Transfer Summer Conference, Vancouver, BC, Canada, 8–12 July 2007; Volume 42762, pp. 71–76. [Google Scholar] [CrossRef]
- Ben-gigirey, B.; De Sousa, J.M.V.B.; Villa, T.G.; Barros-velazquez, J. Chemical changes and visual appearance of albacore tuna as related to frozen storage. J. Food Sci. 1999, 64, 20–24. [Google Scholar] [CrossRef]
- Guizani, N.; Al-Busaidy, M.A.; Al-Belushi, I.M.; Mothershaw, A.; Rahman, M.S. The effect of storage temperature on histamine production and the freshness of yellowfin tuna (Thunnus albacares). Food Res. Int. 2005, 38, 215–222. [Google Scholar] [CrossRef]
- Agustini, T.W.; Suzuki, T.; Hagiwara, T.; Ishizaki, S.; Tanaka, M.; Takai, R. Change of K value and water state of yellowfin tuna Thunnus albacares meat stored in a wide temperature range (20 C to-84 C). Fish. Sci. 2001, 67, 306–313. [Google Scholar] [CrossRef]
- Veciana-Nogués, M.T.; Mariné-Font, A.; Vidal-Carou, M.C. Biogenic amines as hygienic quality indicators of tuna. Relationships with microbial counts, ATP-related compounds, volatile amines, and organoleptic changes. J. Agric. Food Chem. 1997, 45, 2036–2041. [Google Scholar] [CrossRef]
- Hong, H.; Regenstein, J.M.; Luo, Y. The importance of ATP-related compounds for the freshness and flavor of post-mortem fish and shellfish muscle: A review. Crit. Rev. Food Sci. Nutr. 2017, 57, 1787–1798. [Google Scholar] [CrossRef] [PubMed]


© 2020 by the authors. Licensee MDPI, Basel, Switzerland. This article is an open access article distributed under the terms and conditions of the Creative Commons Attribution (CC BY) license (http://creativecommons.org/licenses/by/4.0/).
Share and Cite
Kang, T.; Shafel, T.; Lee, D.; Lee, C.J.; Lee, S.H.; Jun, S. Quality Retention of Fresh Tuna Stored Using Supercooling Technology. Foods 2020, 9, 1356. https://doi.org/10.3390/foods9101356
Kang T, Shafel T, Lee D, Lee CJ, Lee SH, Jun S. Quality Retention of Fresh Tuna Stored Using Supercooling Technology. Foods. 2020; 9(10):1356. https://doi.org/10.3390/foods9101356
Chicago/Turabian StyleKang, Taiyoung, Timothy Shafel, Dongyoung Lee, Chang Joo Lee, Seung Hyun Lee, and Soojin Jun. 2020. "Quality Retention of Fresh Tuna Stored Using Supercooling Technology" Foods 9, no. 10: 1356. https://doi.org/10.3390/foods9101356
APA StyleKang, T., Shafel, T., Lee, D., Lee, C. J., Lee, S. H., & Jun, S. (2020). Quality Retention of Fresh Tuna Stored Using Supercooling Technology. Foods, 9(10), 1356. https://doi.org/10.3390/foods9101356