Lactic Acid Bacteria and Yeast Inocula Modulate the Volatile Profile of Spanish-Style Green Table Olive Fermentations


 , and
, and 
Abstract
:1. Introduction
2. Materials and Methods
2.1. Olive Fermentations
2.2. Experimental Design
2.3. Control Points of Fermentations
2.4. Olive Brines’ Sequential Extraction and GC-MS Analysis
2.5. Statistical Analyses
3. Results
3.1. Fermentation Process
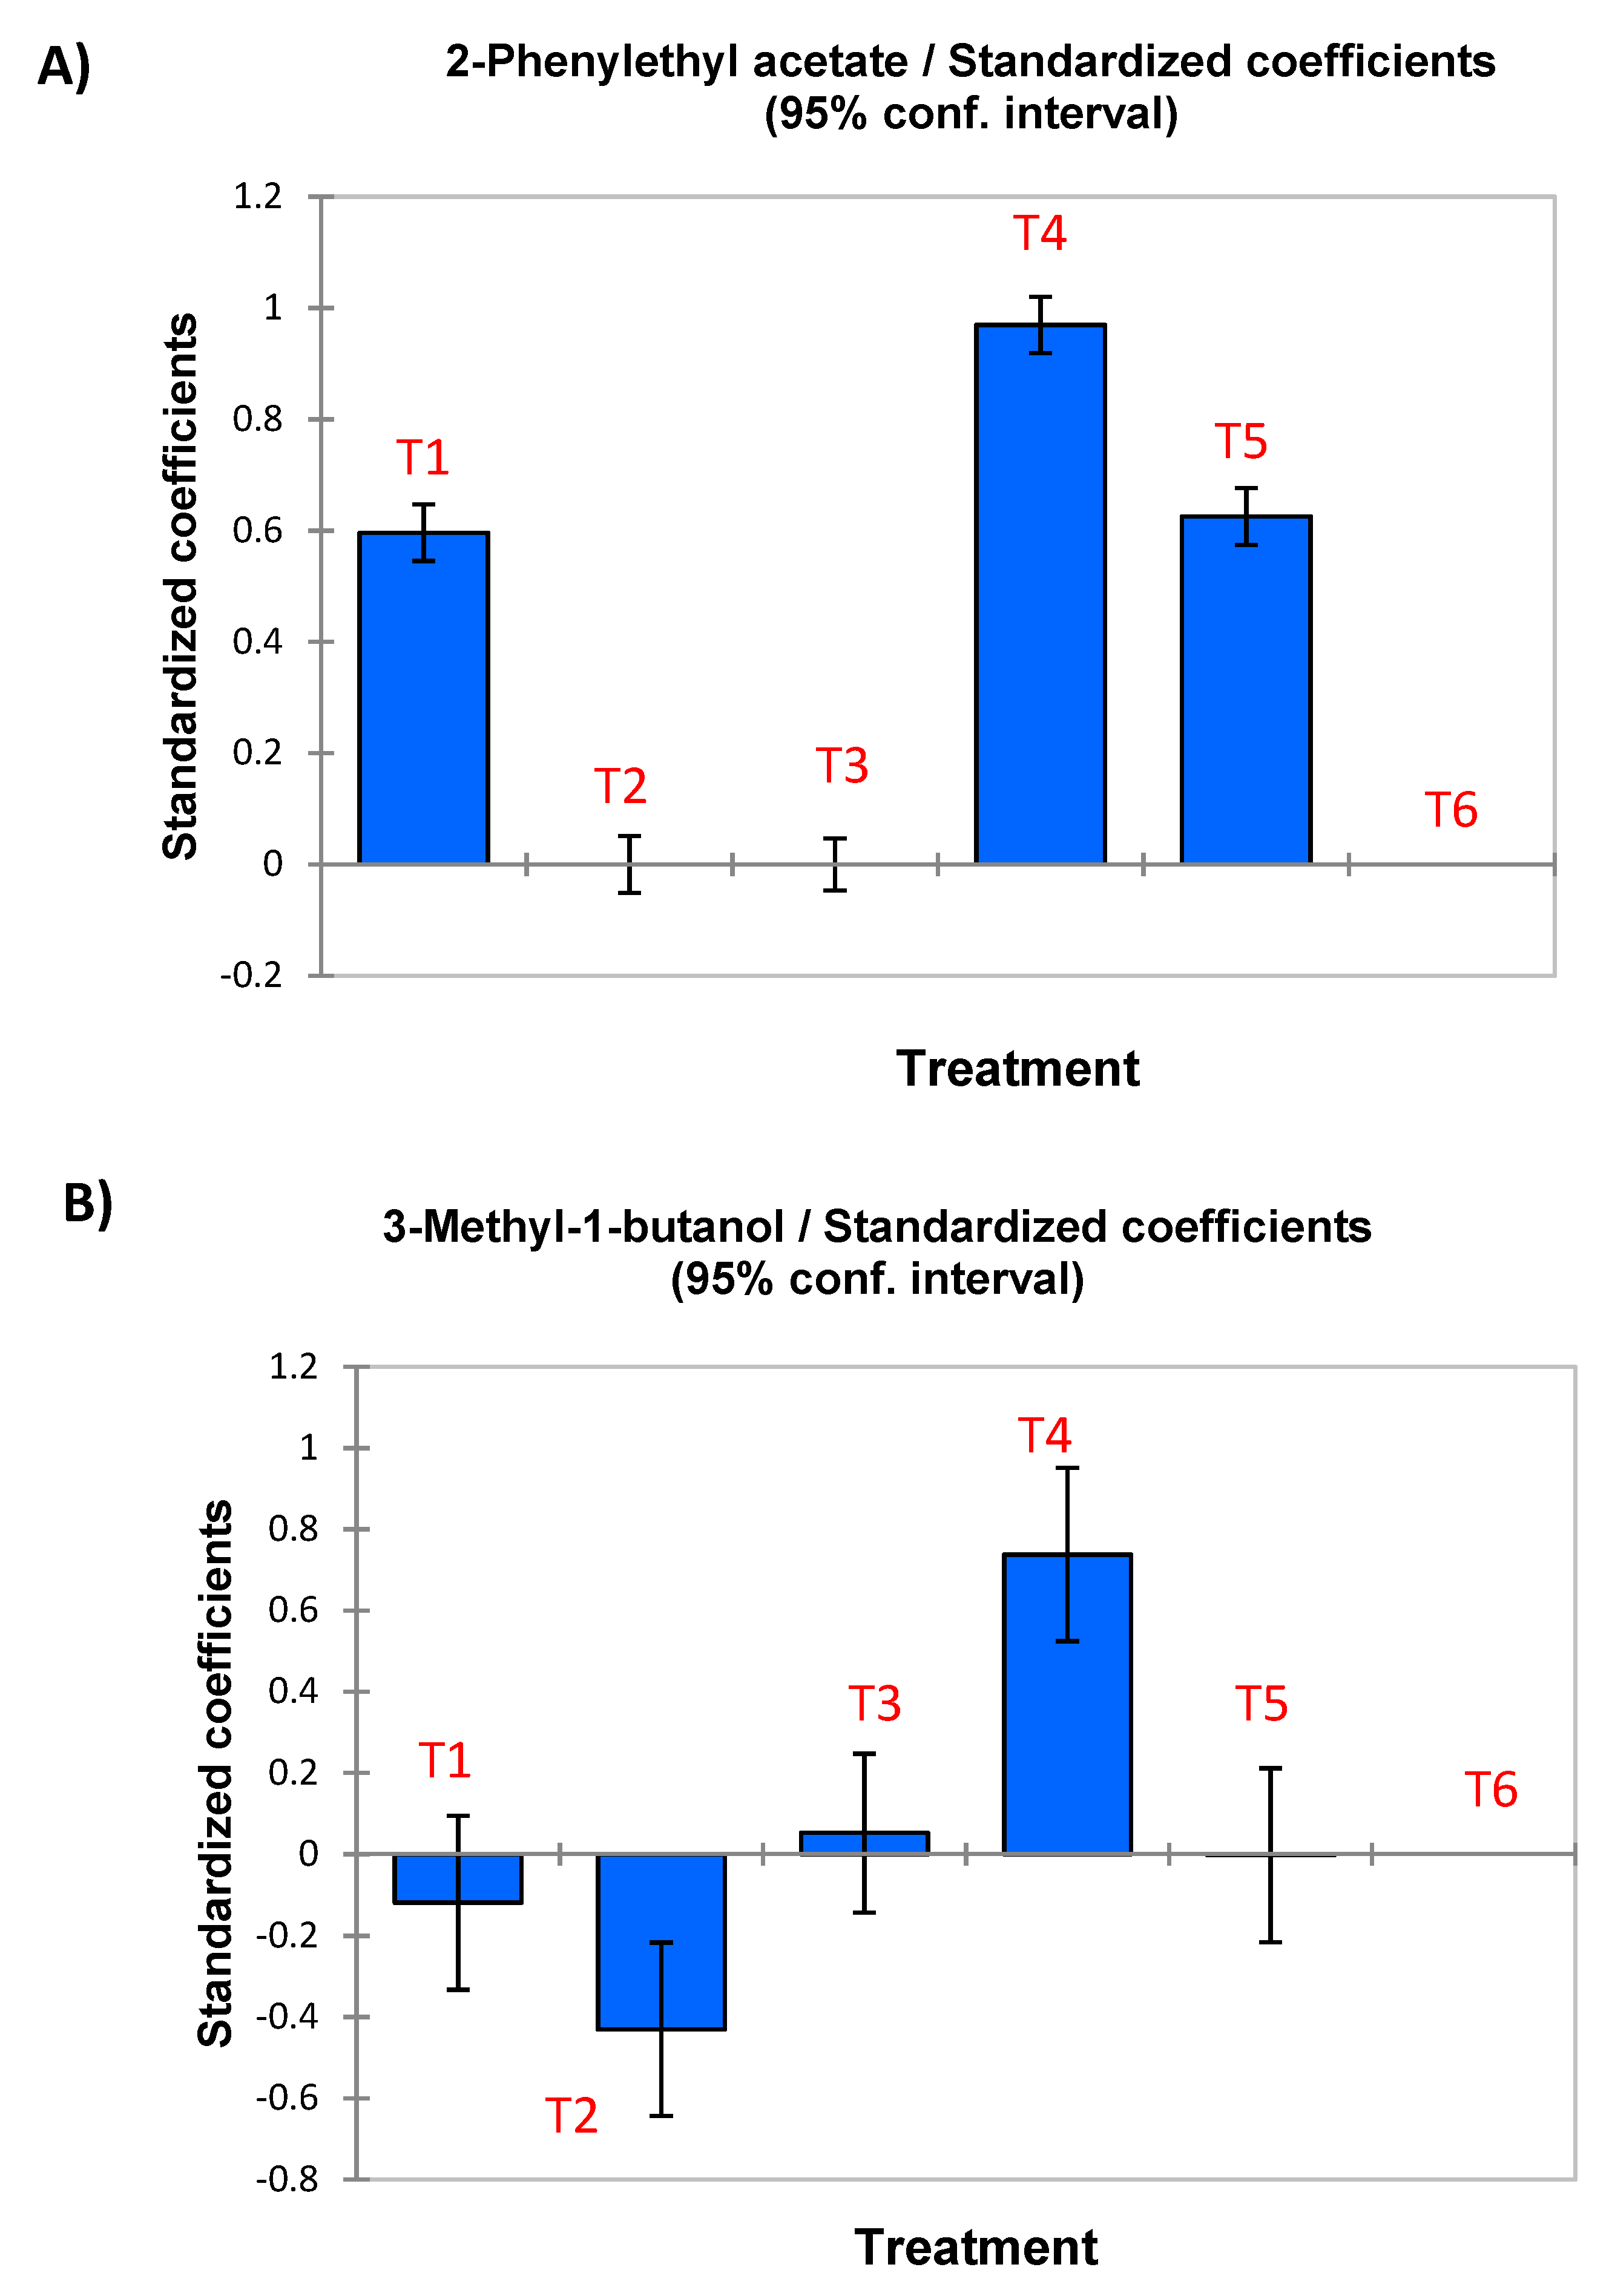
3.2. ANOVA Analysis
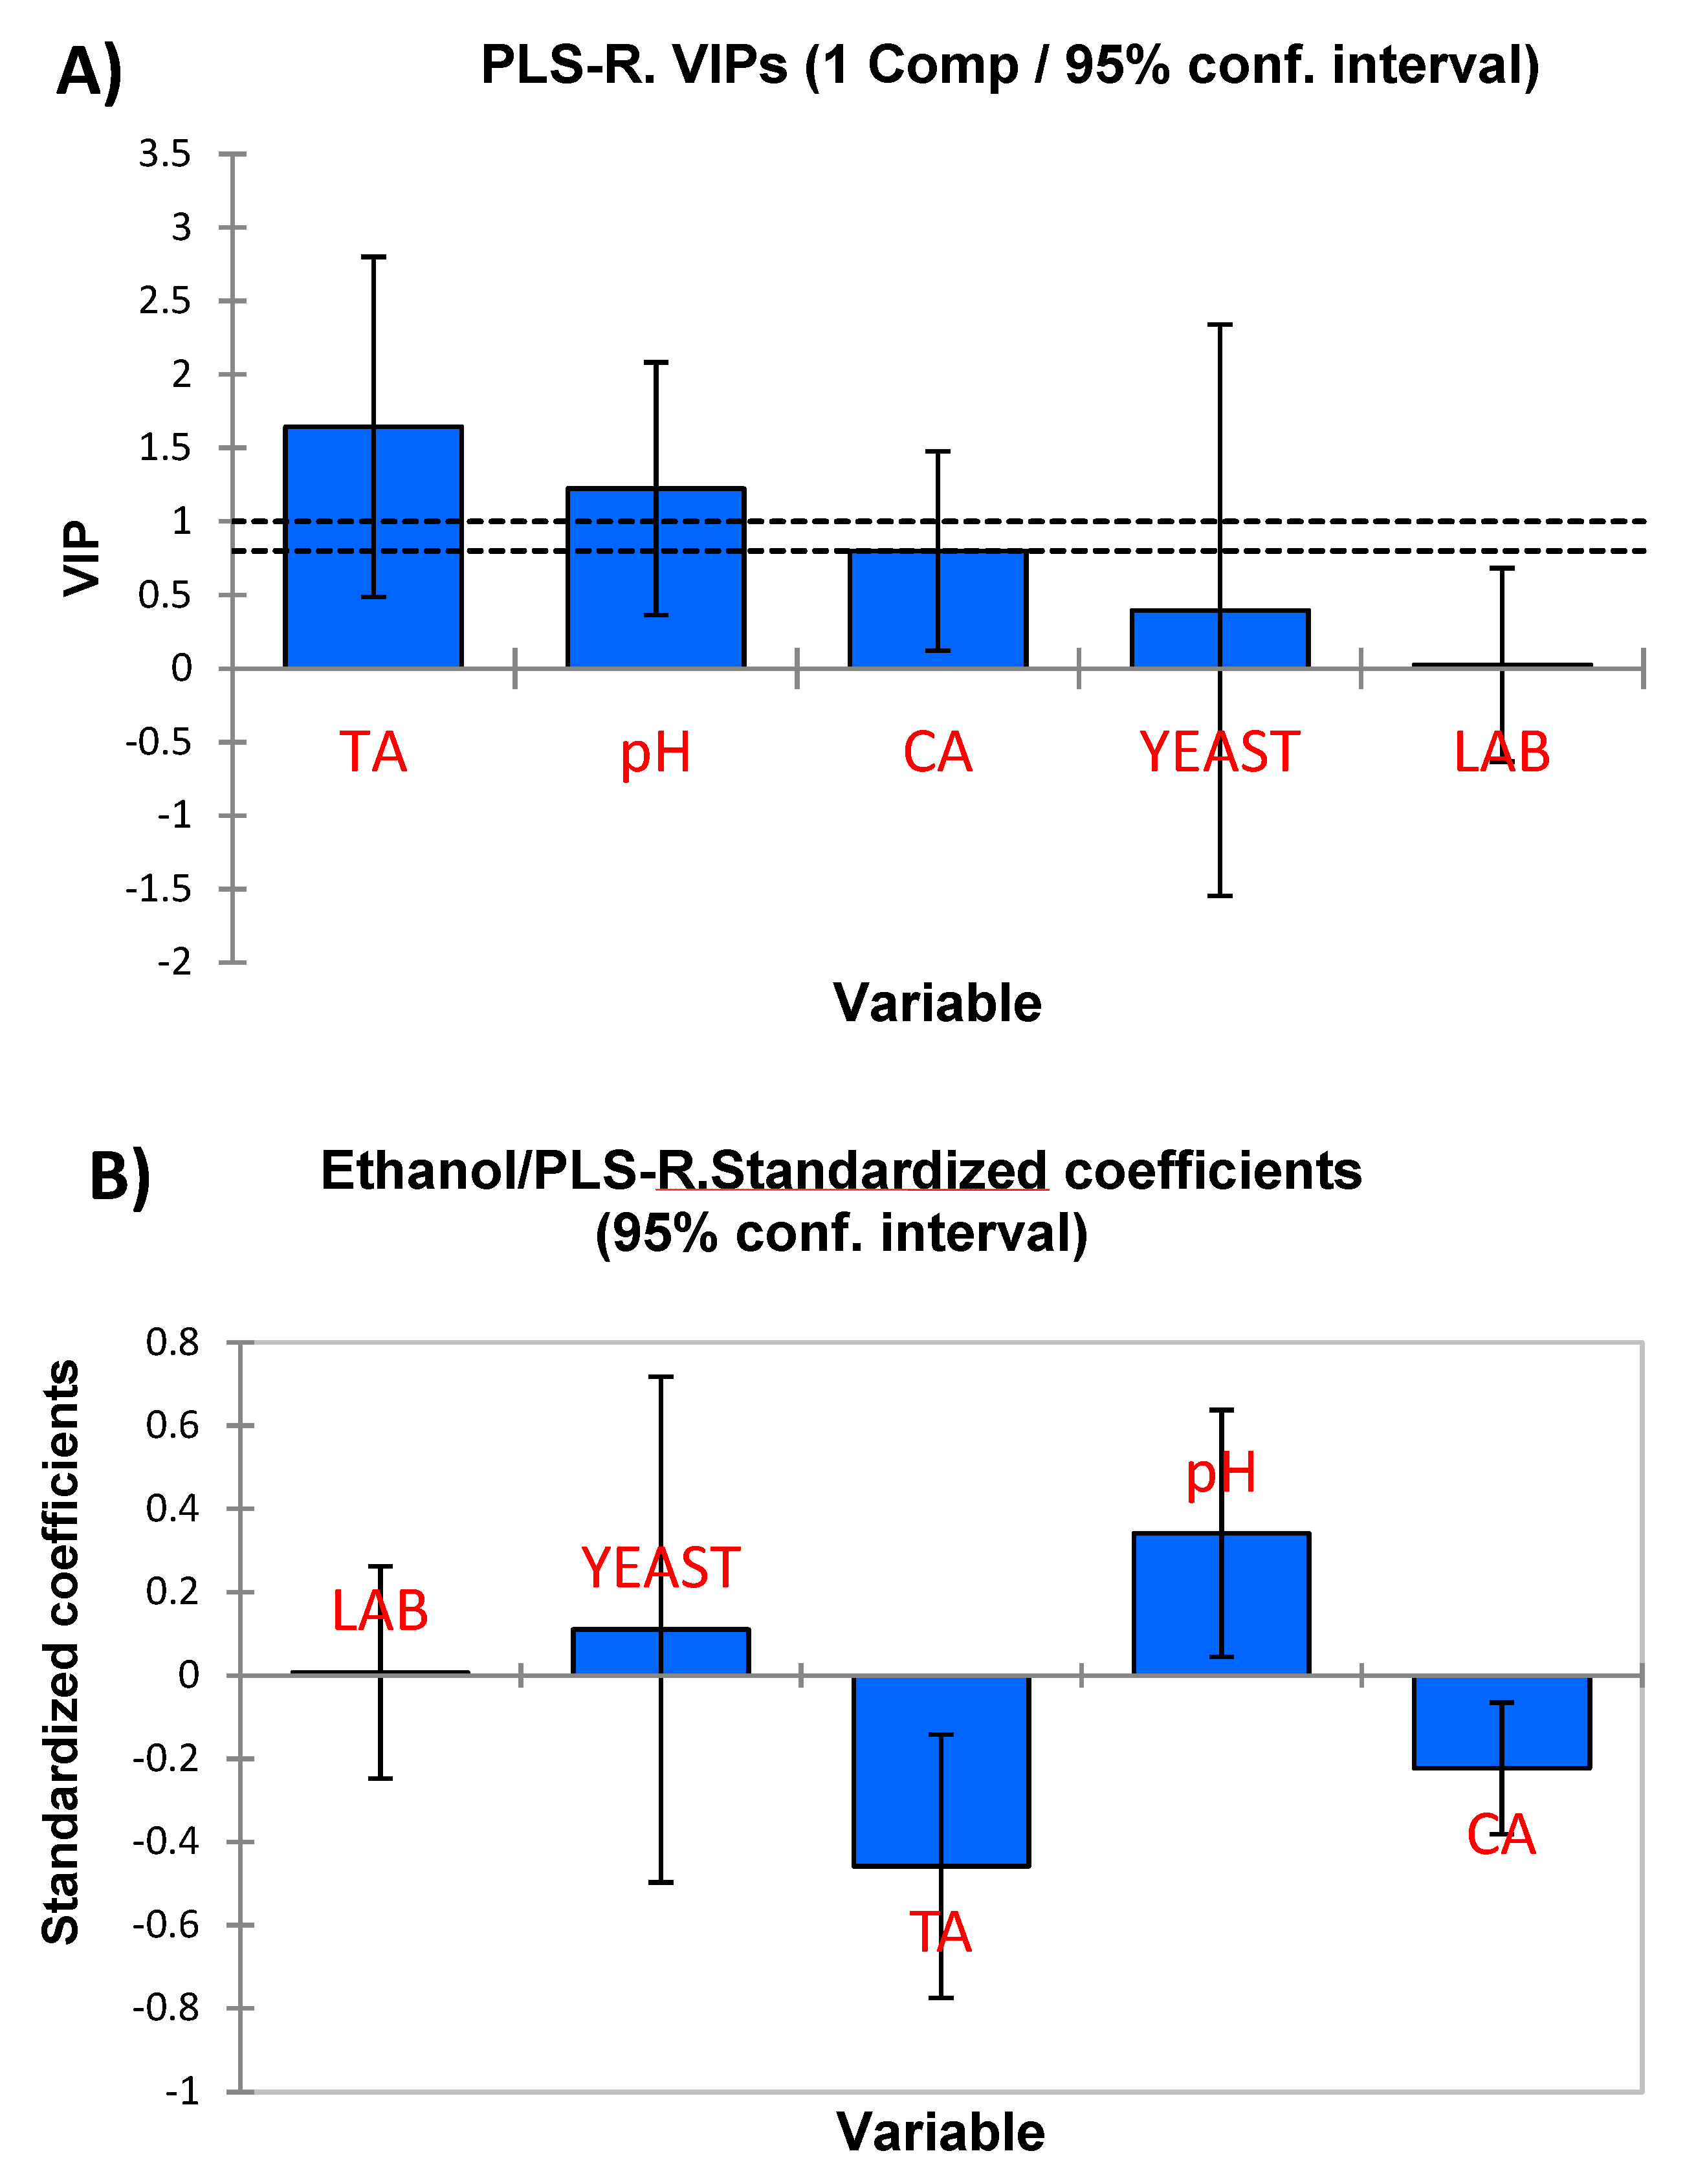
3.3. PLS Analysis
3.4. Biplots Analysis
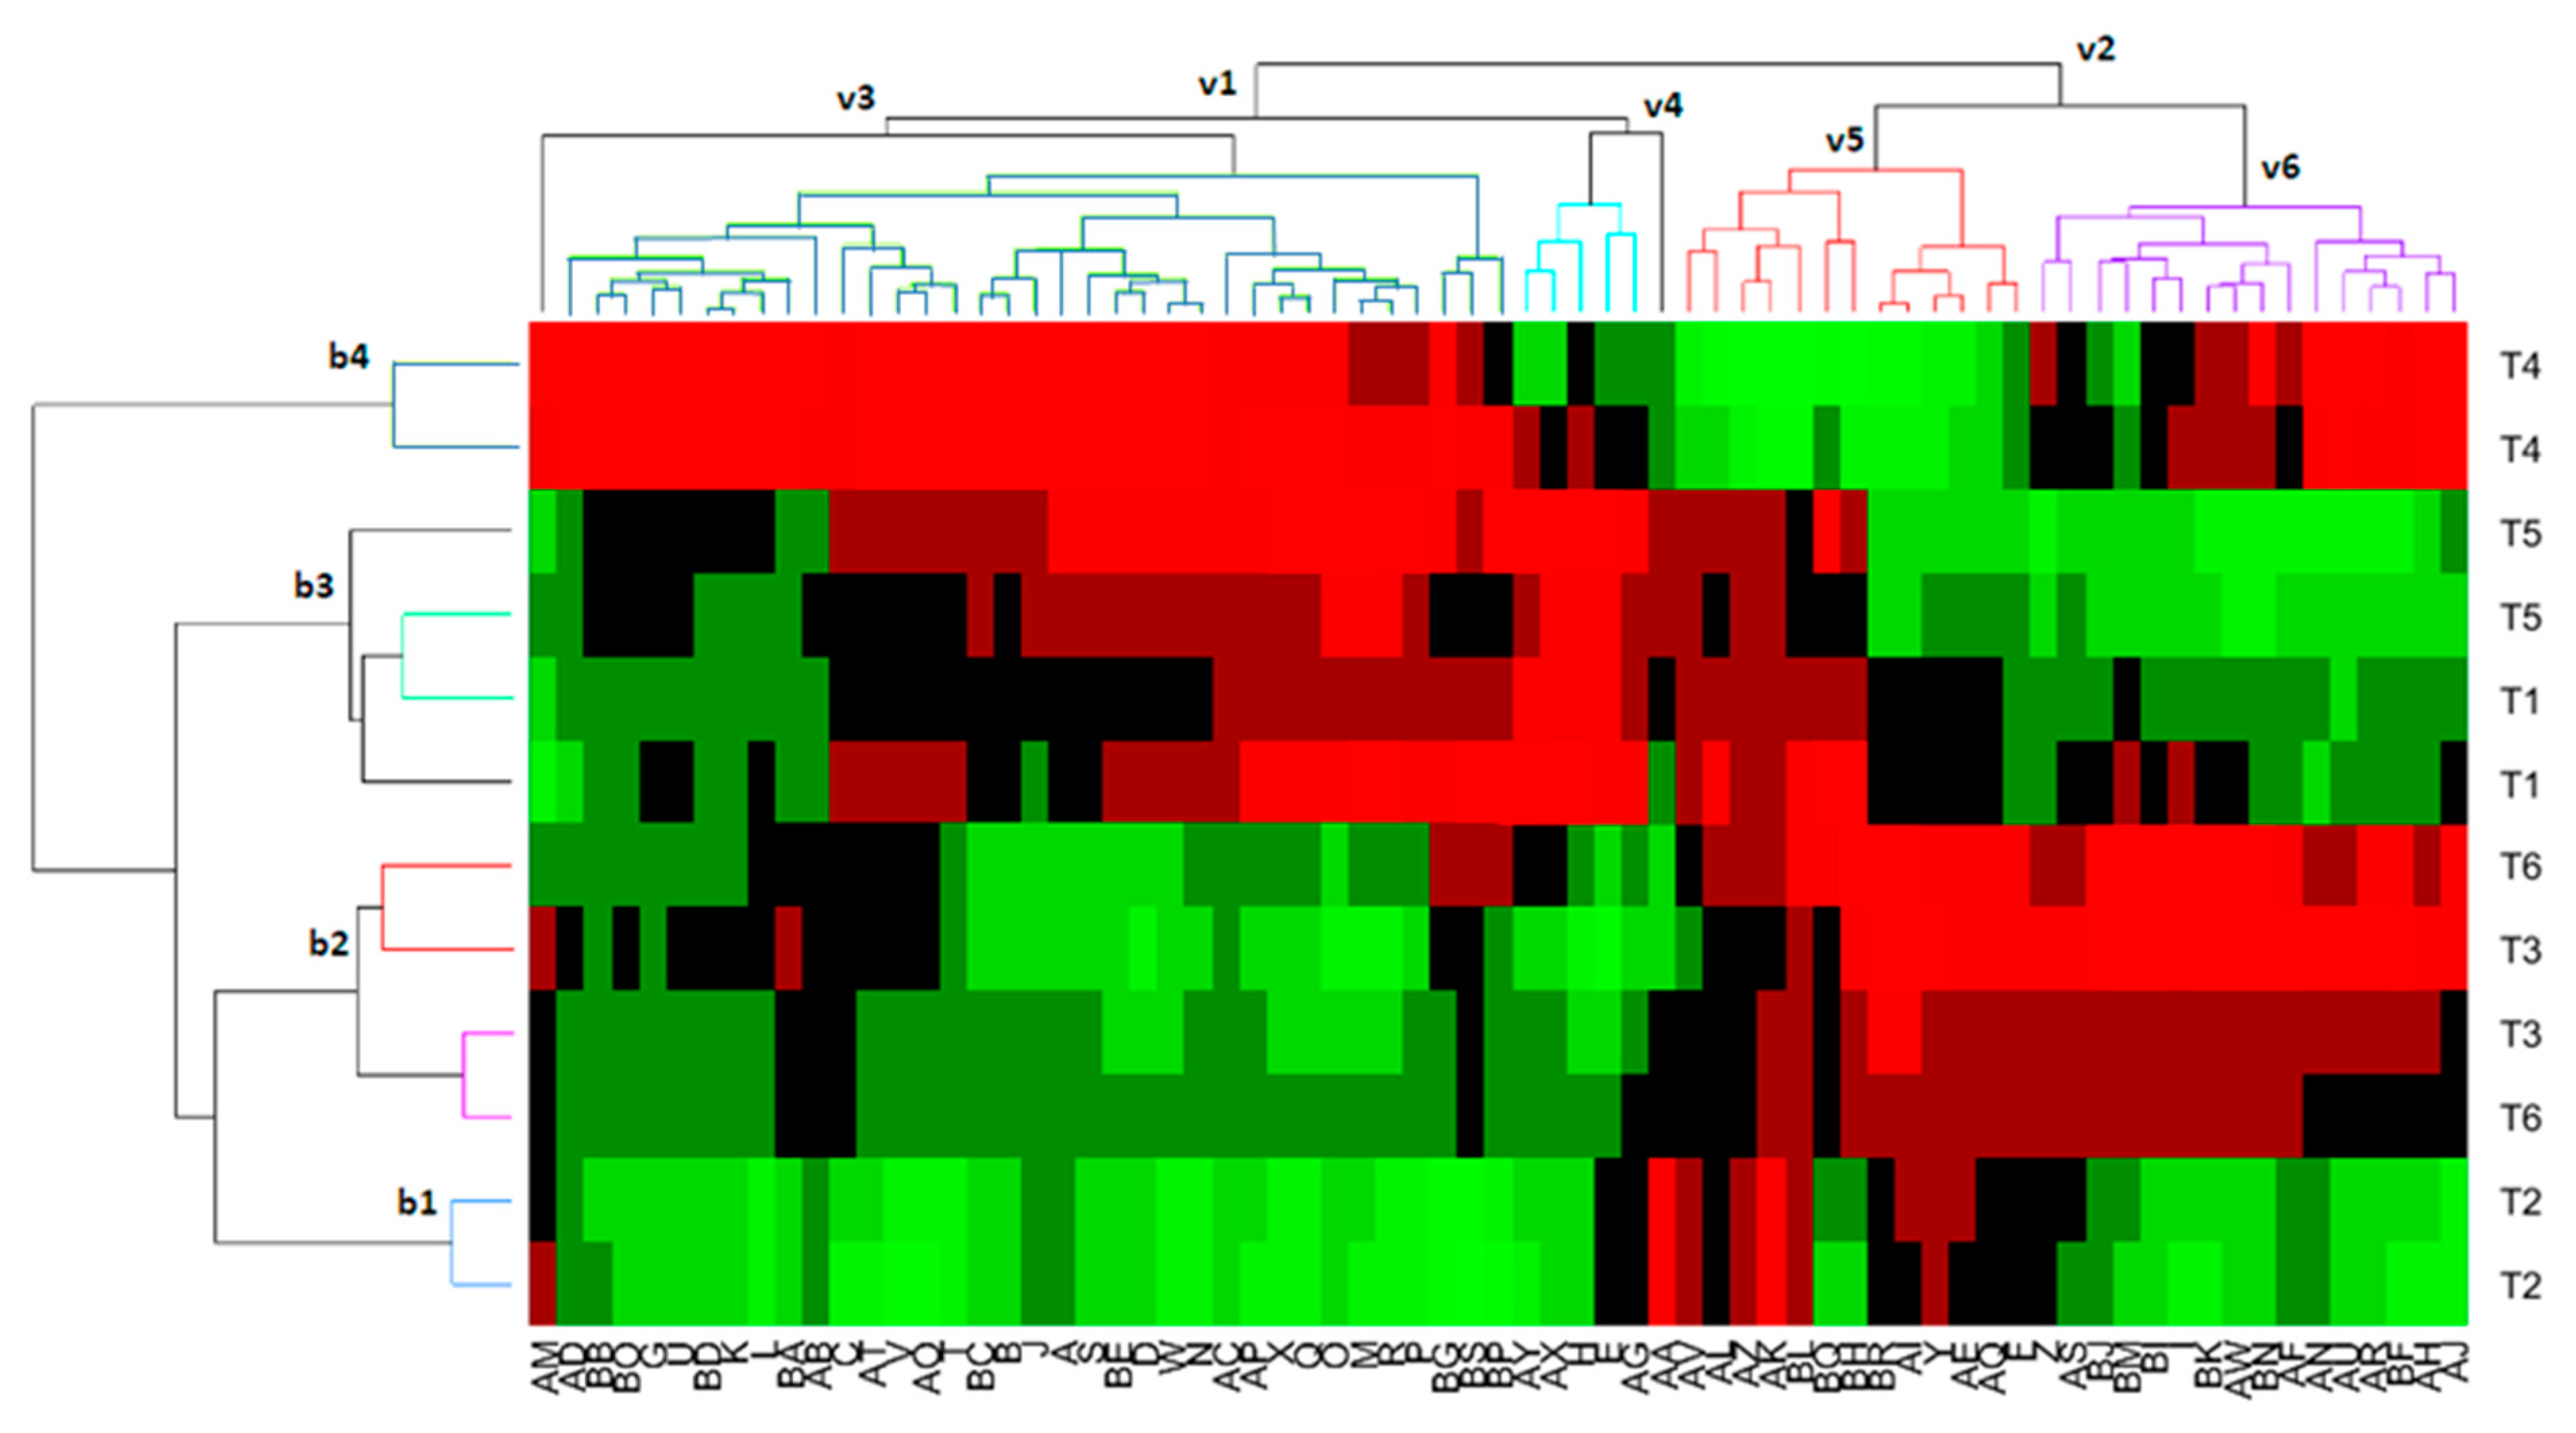
3.5. Biclustering Analysis
4. Discussion
5. Conclusions
Supplementary Materials
Author Contributions
Funding
Acknowledgments
Conflicts of Interest
References
- International Olive Oil Council (IOC). World Table Olive Figures. 2019. Available online: http://www.internationaloliveoil.org/estaticos/view/132-world-table-olive-figures (accessed on 24 July 2019).
- Garrido-Fernández, A.; Fernández-Díez, M.J.; Adams, R.M. Table Olives Production and Processing; Chapman & Hall: London, UK, 1997. [Google Scholar]
- Hurtado, A.; Requant, C.; Bordons, A.; Rozes, N. Lactic acid bacteria from fermented olives. Food Microbiol. 2012, 31, 1–8. [Google Scholar] [CrossRef] [PubMed]
- Arroyo-Lopez, F.N.; Romero-Gil, V.; Bautista-Gallego, J.; Rodriguez-Gomez, F.; Jimenez-Diaz, R.; Garcia-Garcia, P.; Querol, A.; Garrido-Fernandez, A. Yeasts in table olive processing: Desirable or spoilage microorganisms? Int. J. Food Microbiol. 2012, 160, 42–49. [Google Scholar] [CrossRef] [PubMed]
- Arroyo-López, F.N.; Bautista-Gallego, J.; Domínguez-Manzano, J.; Romero-Gil, V.; Rodríguez-Gómez, F.; García-García, P.; Garrido-Fernández, A.; Jiménez-Díaz, R. Formation of lactic acid bacteria-yeasts communities on the olive surface during Spanish-style Manzanilla fermentations. Food Microbiol. 2012, 32, 295–301. [Google Scholar]
- Benítez-Cabello, A.; Romero-Gil, V.; Rodríguez-Gómez, F.; Garrido-Fernández, A.; Jiménez-Díaz, R.; Arroyo-López, F.N. Evaluation and identification of poly-microbial biofilms on natural green Gordal table olives. Antonie Van Leeuwenhoek 2015, 108, 597–610. [Google Scholar] [CrossRef] [PubMed] [Green Version]
- Benítez-Cabello, A.; Calero-Delgado, B.; Rodríguez-Gómez, F.; Garrido-Fernández, A.; Jiménez-Díaz, R.; Arroyo-López, F.N. Biodiversity and multifunctional features of lactic acid bacteria isolated from table olive biofilms. Front. Microbiol. 2019, 10, 836. [Google Scholar] [CrossRef] [PubMed]
- Grounta, A.; Panagou, E.Z. Mono and dual species biofilm formation between Lactobacillus pentosus and Pichia membranifaciens on the surface of black olives under different sterile brine conditions. Ann. Microbiol. 2014, 64, 1757–1767. [Google Scholar] [CrossRef]
- Behera, S.S.; Ray, R.C.; Zdolec, N. Lactobacillus plantarum with functional properties: An approach to increase safety and shelf-life of fermented foods. BioMed Res. Int. 2018. [Google Scholar] [CrossRef]
- Sabatini, N.; Marsilio, V. Volatile compounds in table olives (Olea Europaea, L., Nocellara del Belice cultivar). Food Chem. 2008, 107, 1522–1528. [Google Scholar] [CrossRef]
- López-López, A.; Sánchez, H.; Cortés-Delgado, A.; de Castro, A.; Montaño, A. Relating sensory analysis with SPME-GC-MS data for Spanish-style green table olive aroma profiling. LWT Food Sci. Technol. 2018, 89, 725–734. [Google Scholar] [CrossRef] [Green Version]
- De Angelis, M.; Campanella, D.; Cosmai, L.; Summo, C.; Rizzello, C.G.; Caponio, F. Microbiota and metabolome of un-started and started Greek-type fermentation of Bella di Cerignola table olives. Food Microbiol. 2015, 52, 18–30. [Google Scholar] [CrossRef]
- Tufariello, M.; Durante, M.; Ramires, F.; Grieco, F.; Tommasi, L.; Perbellini, E.; Falco, V.; Tasioula-Margari, M.; Logrieco, A.F.; Mita, G.; et al. New process for production of fermented black table olives using selected autochthonous microbial resources. Front. Microbiol. 2015, 6, 1007. [Google Scholar] [CrossRef] [PubMed] [Green Version]
- De Castro, A.; Sánchez, A.H.; Cortés-Delgado, A.; López-López, A.; Montaño, A. Effect of Spanish-style processing steps and inoculation with Lactobacillus pentosus starter culture on the volatile composition of cv. Manzanilla green olives. Food Chem. 2019, 271, 543–549. [Google Scholar] [CrossRef] [PubMed]
- De Castro, A.; Sánchez, A.; López-López, A.; Cortés-Delgado, A.; Medina, E.; Montaño, A. Microbiota and metabolite profiling of spoiled Spanish-style green table olives. Metabolites 2018, 8, 73. [Google Scholar] [CrossRef] [PubMed]
- Pino, A.; Vaccalluzzo, A.; Solieri, L.; Romeo, F.; Todaro, A.; Caggia, C.; Arroyo-López, F.N.; Bautista-Gallego, J.; Randazzo, C. Effect of sequential inoculum of beta-glucosidase positive and probiotic strains on brine fermentation to obtain low salt Sicilian table olives. Front. Microbiol. 2019, 10, 174. [Google Scholar] [CrossRef] [PubMed]
- Ubeda, C.; Callejón, R.M.; Troncoso, A.M.; Peña-Neira, A.; Morales, M.L. Volatile profile characterisation of Chilean sparkling wines produced by traditional and Charmat methods via sequential stir bar sorptive extraction. Food Chem. 2016, 207, 261–271. [Google Scholar] [CrossRef] [PubMed]
- Vicente Villalón, J.L. MULTIPLOT. A Package for Multivariate Analysis Using Biplots; Departamento de Estadística, Universidad de Salamanca: Salamanca, Spain, 2016; Available online: http://biplot.usal.es/ClassicalBiplot/index.htlm (accessed on 24 July 2019).
- Panagou, E.Z.; Tassou, C.C. Changes in volatile compounds and related biochemical profile during controlled fermentation of cv. Conservolea green olives. Food Microbiol. 2006, 23, 738–746. [Google Scholar] [CrossRef] [PubMed]
- Cosmai, L.; Campanella, D.; De Angelis, M.; Summo, C.; Paradiso, V.M.; Pasqualone, A.; Caponio, F. Use of starter cultures for table olives fermentation as possibility to improve the quality of thermally stabilized olive-based paste. LWT Food Sci. Technol. 2018, 90, 381–388. [Google Scholar] [CrossRef]
- Bonatsou, S.; Tassou, C.C.; Panagou, E.Z.; Nychas, G.J.E. Table olive fermentation using starter cultures with multifunctional potential. Microorganisms 2017, 5, 30. [Google Scholar] [CrossRef] [PubMed]
- Sabatini, N.; Perri, E.; Marsilio, V. An investigation on molecular partition of aroma compounds in fruit matrix and brine medium of fermented table olives. Innov. Food Sci. Emerg. Technol. 2009, 10, 621–626. [Google Scholar] [CrossRef]
- Viana, F.; Gil, J.V.; Genoves, S.; Valles, S.; Manzanares, P. Rational selection of non-Saccharomyces wine yeasts for mixed starters based on ester formation and enological traits. Food Microbiol. 2008, 25, 778–785. [Google Scholar] [CrossRef]
- Cavin, J.F.; Andioc, V.; Etievant, P.; Diviès, C. Ability to wine lactic acid bacteria to metabolize phenol carboxylic acids. Am. J. Enol. Vitic. 1993, 44, 76–80. [Google Scholar]
- Couto, J.A.; Campos, F.M.; Figueiredo, A.R.; Hogg, T.A. Ability of lactic acid bacteria to produce volatile phenols. Am. J. Enol. Viticul. 2006, 57, 166–171. [Google Scholar]
- Randazzo, C.L.; Todaro, A.; Pino, A.; Pitino, I.; Corona, O.; Caggia, C. Microbiota and metabolome during controlled and spontaneous fermentation of Nocellara Etnea table olives. Food Microbiol. 2017, 65, 136–148. [Google Scholar] [CrossRef] [PubMed]


| Treatment | Inoculum Strain | Inoculum Imposition | TA-I * (%) | TA-F (%) | pH-I | pH-F | CA-I ** (Eq/L) | CA-F (Eq/L) | Salt-I (%) | Salt-F (%) | LAB-F (Log10 cfu/mL) | Yeasts-F (Log10 cfu/mL) | Enterobacteriaceae-F (Log10 cfu/mL) |
|---|---|---|---|---|---|---|---|---|---|---|---|---|---|
| T1 | LPG1 | 100%-LPG1 | 0.14 (±0.06) a | 0.77 (±0.03) a | 6.29 (±0.06) a | 4.06 (±0.11) a | 0.15 (±0.00) a | 0.17 (±0.02) a | 6.67 (±0.02) a | 7.60 (±0.25) a | 5.97 (±0.02) a | 5.95 (±0.08) a | Nd |
| T2 | Lp13 | 100%-Lp13 | 0.09 (±0.01) a | 0.79 (±0.00) a | 6.31 (±0.11) a | 4.18 (±0.00) a,b | 0.15 (±0.00) a | 0.15 (0.00) a | 6.44 (±0.37) a | 7.30 (±0.09) a | 5.98 (±0.25) a | 5.93 (±0.10) a | Nd |
| T3 | Lpl15 | 100%-Lpl15 | 0.18 (±0.11) a | 0.78 (±0.04) a | 6.19 (±0.16) a | 4.21 (±0.02) a,b | 0.15 (±0.01) a | 0.16 (±0.01) a | 6.61 (±0.02) a | 7.21 (±0.03) a | 6.22 (±0.06) a | 6.11 (±0.04) a | Nd |
| T4 | Y12 | 100%-Lp13 | 0.10 (±0.00) a | 0.58 (±0.05) b | 6.29 (±0.00) a | 4.38 (±0.09) b | 0.15 (±0.00) a | 0.14 (±0.00) a | 6.62 (±0.06) a | 7.80 (±0.10) a | 6.23 (±0.01) a | 6.01 (±0.17) a | Nd |
| T5 | Y12+Lp13+LPG1+Lpl15 | 100%-Lp13 | 0.11 (±0.01) a | 0.76 (±0.03) a | 6.33 (±0.02) b | 4.13 (±0.01) a,b | 0.15 (±0.01) a | 0.15 (±0.01) a | 6.77 (±0.09) a | 7.50 (±0.17) a | 6.15 (±0.08) a | 6.04 (±0.06) a | Nd |
| T6 | Control | 100%-Lp13 | 0.12 (±0.06) a | 0.81 (±0.01) a | 6.22 (±0.05) a | 4.18 (±0.06) a,b | 0.12 (±0.06) a | 0.15 (±0.00) a | 6.63 (±0.15) a | 7.43 (±0.31) a | 6.94 (±0.07) b | 5.92 (±0.04) a | Nd |
| Contributor (ANOVA) and Sign (Standaridised Coefficient) | PLS-R Analysis. Significant Coefficients | |||||||||
|---|---|---|---|---|---|---|---|---|---|---|
| Compound | Code | T1 | T2 | T3 | T4 | T5 | Pooled SD | TA * | pH | CA ** |
| Methyl acetate | A | - | - | - | 0.710 | 0.703 | 0.155 | −0.351 (±0.092) | - | −0.171 (±0.046) |
| Ethyl acetate | B | - | - | - | 0.957 | 0.470 | 0.053 | −0.464 (±0.199) | 0.345 (±0.114) | −0.226 (±0.104) |
| cis-3-Hexenyl acetate | C | - | −0.542 | - | - | - | 0.226 | −0.187 (±0.061) | - | −0.091 (±0.028) |
| 2-Phenylethyl acetate | D | 0.596 | - | - | 0.970 | 0.625 | 0.024 | - | - | - |
| 3-Methylbutanoic acid | E | - | - | - | - | 0.725 | 0.185 | - | - | - |
| Methanol | F | −0.341 | - | 0.771 | −0.242 | - | 0.112 | - | - | - |
| Ethanol | G | - | - | - | 0.750 | - | 0.147 | −0.459 (±0.144) | 0.341 (±0.135) | −0.223 (±0.072) |
| 2-Butanol | H | 0.688 | - | - | 0.377 | 0.764 | 0.132 | - | - | - |
| 2-Methyl-1-propanol | I | - | −0.819 | - | - | −0.819 | 0.152 | - | - | - |
| 1-Butanol | J | 0.501 | 0.413 | 0.351 | 1.208 | 0.753 | 0.048 | - | 0.308 (±0.103) | - |
| 2-Methyl-1-butanol | K | - | −0.346 | - | 0.798 | - | 0.090 | - | 0.348 (±0.118) | −0.227 (±107) |
| 3-Methyl-1-butanol | L | - | −0.430 | - | 0.738 | - | 0.101 | −0.449 (±0.179) | 0.334 (±0.121) | −0.219 (±0.088) |
| 3-Methyl-3-buten-1-ol | M | 0.684 | −0.200 | - | 0.587 | 0.650 | 0.079 | - | - | - |
| 1-Pentanol | N | - | - | - | 0.816 | 0.436 | 0.123 | −0.351 (±0.159) | - | −0.171 (±0.069) |
| cis-2-Penten-1-ol | O | 0.774 | - | - | 0.760 | 0.765 | 0.046 | - | - | - |
| 2-Methyl-2-buten-1-ol | P | 0.613 | - | - | 0.631 | 0.502 | 0.160 | - | - | - |
| 1-Hexanol | Q | 0.399 | - | - | 0.637 | 0.539 | 0.146 | - | - | - |
| cis-3-Hexen-1-ol | R | 0.564 | −0.301 | - | 0.464 | 0.604 | 0.108 | - | - | - |
| 2-Methyl-3-hexanol | S | 0.611 | - | - | 0.881 | 0.389 | 0.142 | - | - | - |
| 1-Heptanol | T | - | −0.428 | - | 0.744 | - | 0.117 | −0.394 (±0.160) | +0.293 (±0.126) | −0.192 (±0.071) |
| 6-Hepten-1-ol | U | - | - | - | 0.749 | - | 0.165 | −0.421 (±0.164) | +0.313 (±0.133) | −0.205 (±0.081) |
| cis-5-Octen-1-ol | V | - | −0.385 | - | 0.615 | - | 0.178 | −0.376 (±0.132) | +0.280 (±0.120) | −0.183 (±0.062) |
| Benzyl alcohol | W | 0.283 | −0.282 | - | 0.788 | 0.433 | 0.090 | - | +0.237 (±0.099) | - |
| 2-Phenylethanol | X | 0.558 | −0.339 | −0.122 | 0.665 | 0.466 | 0.038 | - | - | - |
| 2-Ethenyl-2-butenal | Y | - | - | 0.370 | −0.412 | −0.412 | 0.147 | - | −0.221 (±0.064) | - |
| Isoxylaldehyde | Z | - | - | 0.670 | - | - | 0.212 | - | - | - |
| Dimethyl Sulfoxide | AA | - | - | - | - | - | 0.212 | - | - | - |
| β-Damascenone | AB | −0.667 | - | - | - | - | 0.201 | −0.348 (±0.147) | - | −0.169 (±0.068) |
| Ethyl lactate | AC | - | - | - | 0.470 | - | 0.191 | - | - | −0.111 (±0.045) |
| Ethyl 5,6-dimethylnicotinate | AD | - | - | 0.129 | 0.981 | - | 0.045 | - | +0.369 (±0.122) | - |
| Unknown ester (m/z 88) | AE | −0.732 | - | - | −0.767 | - | 0.178 | - | - | - |
| Furfuryl methyl ether | AF | - | −0.349 | - | - | −1.031 | 0.103 | - | - | - |
| Acetoin | AG | −0.358 | - | −0.328 | −0.319 | 0.567 | 0.143 | - | - | - |
| 6-Methyl-3,5-heptadien-2-one | AH | - | - | 0.363 | 0.495 | - | 0.183 | −0.344 (±0.120) | +0.256 (±0.084) | −0.167 (±0.066) |
| Purpurocatecho | AI | -0.151 | −0.251 | - | −0.887 | −0.887 | 0.065 | - | -0.259 (±0.077) | - |
| Iridomyrmecine | AJ | - | −0.496 | - | 0.324 | −0.688 | 0.118 | - | - | - |
| Methyl lactate | AK | - | - | - | −0.864 | - | 0.132 | - | -0.328 (±0.108) | - |
| Methyl hydrocinnamate | AL | - | - | - | −0.673 | - | 0.217 | - | - | - |
| Methyl 4(methylamino)benzoate | AM | - | - | - | 0.786 | - | 0.136 | −0.373 (±0.142) | +0.278 (±0.108) | −0.182 (±0.076) |
| 3-Ethylpyridine | AN | −0.457 | - | - | - | −0.526 | 0.182 | - | - | - |
| 4-Methylguaiacol | AO | 0.347 | −0.483 | - | 0.662 | - | 0.100 | - | - | - |
| 4-Ethylguiacol | AP | 0.705 | −0.263 | −0.196 | 0.608 | 0.216 | 0.067 | - | - | - |
| 4-Ethylphenol | AP | - | - | 0.632 | −0.407 | - | 0.149 | - | - | - |
| Isovanillic acid | AR | −0.239 | −0.551 | - | 0.260 | −0.739 | 0.111 | - | +0.184 (±0.081) | - |
| Coumaran | AS | −1.093 | −0.898 | −0.571 | −7.460 | −0.903 | 0.109 | - | - | - |
| 5-tert-Butylpyrogallol | AT | - | −0.610 | −0.455 | 0.781 | −0.371 | 0.097 | - | - | - |
| Methoxyeugenol | AU | −0.247 | −0.430 | - | 0.366 | −0.723 | 0.105 | - | +0.220 (±0.092) | - |
| Vainillin | AV | - | - | −0.692 | −0.799 | −0.529 | 0.187 | +0.320 (±0.075) | - | +0.156 (±0.036) |
| α-Isophorone | AW | −0.481 | −0.584 | - | - | −0.513 | 0.200 | - | - | - |
| α-Terpineol | AX | - | - | - | - | 0.572 | 0.198 | - | - | - |
| Geraniol | AY | 0.712 | −0.297 | - | - | 0.546 | 0.127 | - | - | - |
| Unknown A (m/z 71-59) | AZ | - | - | - | - | −0.627 | 0.187 | - | - | - |
| Unknown B (m/z 123-138-96) | BA | - | −0.402 | - | 0.590 | - | 0.167 | - | +0.279 (±0.107) | - |
| Unknown C (m/z 83-112-97) | BB | 0.270 | - | - | 0.974 | - | 0.098 | - | +0.300 (±0.137) | - |
| Unknown D (m/z 55-93-108) | BC | 0.151 | - | - | 1.005 | 0.506 | 0.037 | - | +0.329 (±0.116) | - |
| Unknown E (m/z 111-198) | BD | - | −0.326 | - | 0.808 | - | 0.125 | - | +0.309 (±0.115) | - |
| Unknown F (m/z 95-154-110) | BE | 0.261 | - | - | 0.940 | 0.665 | 0.085 | −0.376 (±0.159) | −0.183 (±0.072) | - |
| Unknown G (m/z 138) | BF | −0.463 | −0.664 | - | - | −0.716 | 0.153 | -0.250 (±0.106) | −0.121 (±0.051) | - |
| Unknown H (m/z 113-81-153) | BG | 0.548 | −0.457 | - | 0.518 | - | 0.127 | - | - | - |
| Unknown I (m/z 99-139-67-81) | BH | - | −0.413 | - | −0.807 | - | 0.179 | - | −0.296 (±0.129) | - |
| Unknown K (m/z 93-79) | BI | - | −0.414 | 0.289 | - | −0.754 | 0.123 | - | - | - |
| Unknown L (m/z 222-43-85-177) | BJ | −0.822 | −0.612 | - | −0.576 | −0.776 | 0.218 | - | - | - |
| Unknown M (m/z 138-120) | BK | −0.629 | −0.799 | - | - | −0.710 | 0.186 | - | - | - |
| Unknown N (m/z 151-43) | BL | - | - | - | −0.894 | - | 0.157 | - | −0.344 (±0.113) | - |
| Unknown O (m/z 95-110-138) | BM | −0.704 | −0.859 | - | −0.721 | −0.370 | 0.195 | - | - | - |
| Unknown P (m/z 138) | BN | −0.669 | −0.644 | - | - | −0.694 | 0.172 | - | - | - |
| Unknown Q (m/z 102-55-69) | BO | −0.208 | −0.194 | - | 0.866 | 0.235 | 0.059 | −0.497 (±0.185) | +0.70 (±0.130) | −0.242 (±0.097) |
| Unknown S (m/z 167-121) | BP | 0.364 | −0.613 | - | - | - | 0.157 | - | - | - |
| Unknown T (m/z 70-55-82) | BQ | - | - | - | −0.590 | - | 0.217 | - | −0.245 (±0.065) | - |
| Unknown U (m/z 119-159-192) | BR | −0.457 | - | - | −0.928 | −0.528 | 0.181 | - | - | - |
| Unknown W (m/z 121-136-161) | BS | - | −0.761 | - | - | - | 0.193 | - | - | - |
© 2019 by the authors. Licensee MDPI, Basel, Switzerland. This article is an open access article distributed under the terms and conditions of the Creative Commons Attribution (CC BY) license (http://creativecommons.org/licenses/by/4.0/).
Share and Cite
Benítez-Cabello, A.; Rodríguez-Gómez, F.; Morales, M.L.; Garrido-Fernández, A.; Jiménez-Díaz, R.; Arroyo-López, F.N. Lactic Acid Bacteria and Yeast Inocula Modulate the Volatile Profile of Spanish-Style Green Table Olive Fermentations. Foods 2019, 8, 280. https://doi.org/10.3390/foods8080280
Benítez-Cabello A, Rodríguez-Gómez F, Morales ML, Garrido-Fernández A, Jiménez-Díaz R, Arroyo-López FN. Lactic Acid Bacteria and Yeast Inocula Modulate the Volatile Profile of Spanish-Style Green Table Olive Fermentations. Foods. 2019; 8(8):280. https://doi.org/10.3390/foods8080280
Chicago/Turabian StyleBenítez-Cabello, Antonio, Francisco Rodríguez-Gómez, M. Lourdes Morales, Antonio Garrido-Fernández, Rufino Jiménez-Díaz, and Francisco Noé Arroyo-López. 2019. "Lactic Acid Bacteria and Yeast Inocula Modulate the Volatile Profile of Spanish-Style Green Table Olive Fermentations" Foods 8, no. 8: 280. https://doi.org/10.3390/foods8080280
APA StyleBenítez-Cabello, A., Rodríguez-Gómez, F., Morales, M. L., Garrido-Fernández, A., Jiménez-Díaz, R., & Arroyo-López, F. N. (2019). Lactic Acid Bacteria and Yeast Inocula Modulate the Volatile Profile of Spanish-Style Green Table Olive Fermentations. Foods, 8(8), 280. https://doi.org/10.3390/foods8080280