Article

Effect of Bean-Derived Soluble Dietary Fibers on Macrophage Function In Vitro

by
Ana M. Magallanes López
1,
Mark Williamson
2,
Senay Simsek
1,3 and
Estelle Leclerc
4,*
1
Department of Plant Sciences, North Dakota State University, Fargo, ND 58105, USA
2
School of Medicine and Health Sciences, University of North Dakota, Grand Forks, ND 58202, USA
3
Whistler Center for Carbohydrate Research, Department of Food Sciences, Purdue University, West Lafayette, IN 47907, USA
4
Department of Pharmaceutical Sciences, North Dakota State University, Fargo, ND 58105, USA
*
Author to whom correspondence should be addressed.
Foods 2026, 15(9), 1471; https://doi.org/10.3390/foods15091471
Submission received: 24 February 2026 / Revised: 1 April 2026 / Accepted: 10 April 2026 / Published: 23 April 2026
(This article belongs to the Section Food Nutrition)

Abstract

Studies have shown that dietary fibers have many health benefits. Soluble dietary fibers (SDF) extracted from wheat, corn, rice, or several herbaceous plants have been shown to have either pro- or anti-inflammatory effects depending on the mode of preparation of the fibers, the fibers’ structures and the biological or cellular context. However, much less is known regarding the immunomodulatory properties of dry bean-derived SDF. The goal of this study was to fill this gap in knowledge. Using RAW 264.7 macrophages, we show that dry bean-derived SDF stimulated the production of nitric oxide (NO), tumor necrosis factor (TNF) α, interleukin (IL)-1β and IL-6. We show that these changes were partly dependent on toll-like receptor TLR-4 signaling. More importantly, we observed that the levels of NO, TNF-α, IL-1β and IL-6 were significantly lower when the SDF were extracted from heat-processed bean flour. Overall, our results demonstrate that dry bean-derived SDF-rich fractions modulate macrophage activation in vitro, promoting a pro-inflammatory response that is partially mediated by TLR-4 signaling.

1. Introduction

Dietary fiber (DF) originates from cereals, legumes, fruits, nuts, seaweed or vegetables and is a collective term to describe carbohydrate polymers that are neither absorbed nor hydrolyzed in the small intestine and are nearly or completely fermented in the colon [1,2,3]. Dietary fiber is divided into two groups: insoluble dietary fiber (IDF), which includes lignin, cellulose and hemicellulose, and soluble dietary fiber (SDF), which includes pectin, gums, mucilages, and inulin-type fructans [4].
In recent years, dietary fibers from plants have been recognized for their many health benefits [5,6]. They improve digestion through their laxative effects by increasing fecal bulking, softening, frequency and regularity [7]. They also have beneficial effects on the cardiovascular system by reducing the risks of coronary heart disease [8,9], hypertension and stroke [10,11], diabetes and obesity [11,12,13].
The role of plant-derived dietary fiber on the function of the immune system has also been explored, and there is currently consensus that dietary fiber has immunomodulatory effects [14,15,16,17]. It was found that dietary fiber could have either pro- or anti-inflammatory effects, depending on the source of the fiber, the modes of preparation and structures and the biological or cellular context [17,18,19,20]. For example, rice bran-derived arabinoxylans showed pro-inflammatory effects by enhancing natural killer (NK) cell activity and dendritic cell maturation when injected in mice [21,22]. Similarly, polysaccharides derived from Platycodon grandiflorum, a flowering perennial plant, were shown to induce the maturation of dendritic cells and the concurrent increase in IL-2, tumor necrosis factor (TNF) α, interleukin (IL)-1β, IL-6, IL-10 and interferon (INF)-β [23]. Increases in the levels of pro-inflammatory cytokines were also observed in murine macrophages stimulated by polysaccharides isolated from Tinospora cordifolia [24]. In a different study, Li et al. also showed that wheat-derived arabinoxylan extracts could stimulate the nitric oxide (NO) production by U937 monocytes to levels similar to those produced after stimulation with lipopolysaccharides (LPSs) [20].
As mentioned above, many studies have investigated the immunomodulatory effects of SDF from wheat, corn, rice, and several herbaceous plants. However, the health benefits of dry bean-derived SDF have been relatively underexplored. The recent study of Wu et al. compared the biological functions of ten traditional legumes and showed that, in their experimental conditions, all SDF presented potential antioxidant and antiglycation effects, as well as stimulated the production of NO, TNF-α and IL-6 from RAW macrophages [25]. Our present study further demonstrates the activation of RAW macrophages by dry bean-derived SDF. We show that the treatment of RAW cells with SDF extracted from dry bean flour resulted in increased production of NO, TNF-α, IL-6, and IL-1β. Notably, using an inhibitor of TLR-4, we showed that the increased levels of NO and of the pro-inflammatory cytokines were in part dependent on the TLR-4 signaling pathway. In addition, we observed that heat processing the dry bean flour prior to extracting the SDF resulted in reduced levels of both NO and pro-inflammatory cytokines produced by the RAW macrophages.

2. Materials and Methods

2.1. Materials

The RAW 264.7 murine macrophage cell line was purchased from the American Type Culture Collection (ATCC) (Manassas, VA, USA). Dulbecco’s Modified Eagle’s Medium (DMEM) (ATCC®. 30-2002) and Fetal Bovine Serum (FBS) (ATCC®. 30-2020) were purchased from ATCC. Trypsin (0.25%) EDTA (1×) (VWR, 02-0154-0100) was purchased from VWR (Solon, OH, USA). LPS from E. coli, Serotype O111:B4 (1 mg/mL, ALX-581-012-L002) was obtained from Enzo Life Sciences (Farmingdale, NY, USA). Tak-242 (TLR 4 signaling inhibitor, A3850) was purchased from APExBIO (Houston, TX, USA). Genscript ToxinSensor™ Chromogenic limulus amebocyte lysate (LAL) Endotoxin Assay Kit (L00350) was purchased from Genscript (Piscataway, NJ, USA). The mouse TNF-α Quantikine ELISA kit (MTA00B), mouse IL-6 Quantikine ELISA kit (M6000B), and mouse IL-1β Quantikine ELISA kit (MLB00C) were purchased from R&D Systems, Inc. (Minneapolis, MN, USA). The Griess Reagent System (G2930) was obtained from Promega Co. (Madison, WI, USA). The PureLink RNA Mini Kit (12183018A) was obtained from Invitrogen (Waltham, MA, USA). The First Strand cDNA Synthesis (Quick Protocol) (M0253) components were purchased from New England BioLabs Inc. (Ipswich, MA, USA). The Brilliant II SYBR® Green QRT-PCR Master Mix with Low ROX was obtained from Agilent Technologies (Santa Clara, CA, USA).

2.2. Production of SDF Fractions

Two varieties of dry beans, Monterrey (pinto bean) and Eclipse (black bean), were used in the study. Both varieties were grown in North Dakota (ND). Monterrey is a high-yielding variety resistant to common bean diseases, while Eclipse was the first black bean variety released by the ND Agricultural Experiment Station; both are agriculturally relevant and were chosen to represent compositional diversity between pinto and black bean types. Before further processing, the beans were first cleaned by removing foreign material and damaged seeds. The flour used for the SDF extraction came from non-dehulled beans to analyze the bean components of the whole seed.
The SDF fractions were prepared from the flours by the enzymatic-gravimetric procedure according to Feng et al. with slight modifications [26]. Briefly, the flour samples underwent stepwise enzymatic hydrolysis of α-amylase, protease, and amyloglucosidase. After filtration, the hydrolyzate filtrates were collected and concentrated to about one-tenth in a vacuum rotary evaporation system. The SDF fractions were obtained by ethanol precipitation followed by freeze-dry processing [27]. Six different batches of SDF were prepared from cooked Pinto/Monterrey bean flour, six from cooked Black/Eclipse bean flour, six from raw Pinto/Monterrey bean flour, and six from raw Black/Eclipse bean flour.

2.3. Determination of Endotoxin Level in SDF Samples

In this study, it was essential to ensure that the dietary fiber preparation was not contaminated by endotoxins. For this reason, the level of endotoxin in each 500 µg/mL SDF sample was determined, prior to performing the cell-based assays, using the ToxinSensorTM Chromogenic LAL Endotoxin Assay according to the manufacturer’s instructions. The experiment was performed using technical duplicates.

2.4. Determination of Immunomodulatory Properties of SDF Samples

The RAW 264.7 murine macrophage cell line was chosen because it has been used extensively to evaluate the immunomodulatory effects of plant-derived extracts [18,24,28,29,30,31,32,33]. RAW 264.7 cells have high plasticity and can be polarized into either the pro-inflammatory M1 type or the anti-inflammatory M2 type, depending on the stimulants. M1 type macrophages typically produce NO, pro-inflammatory cytokines including TNF-α, IL-1β and IL-6 [34]. For all these reasons, this cell line was appropriate to study the immunomodulatory effects of dry bean-derived SDF. RAW 264.7 cells, referred to as RAW cells, were grown in DMEM supplemented with 10% FBS and 1% penicillin-streptomycin solution (hereafter referred to as complete media) at 37 °C under a humidified atmosphere of 95% air and 5% CO2. The cells were cultured in complete media until they reached 90% confluency. Trypan blue (Mediatech, Inc., Manassas, VA, USA) staining (0.4% (w/v) was performed to assess the viability of cells at times of cell seeding. Cells were counted using a hemocytometer. RAW cells were seeded at 3 × 10⁵ cells per well in the presence of 600 mL complete media, in 24-well plates. After attachment, the cells were treated with SDF (500 µg/mL). This concentration was chosen based on our previous studies using wheat-derived SDF and initial testing [18]. Untreated cells were used as negative controls. Cells treated with 1 µg/mL LPS were used as positive controls. To block TLR-4 signaling, when indicated, cells were treated with 10 µM Tak-242 prior to being treated with the SDF. Because Tak-242 was prepared in DMSO, an additional negative control (0.1% DMSO) was used.

2.5. Determination of TNF-α, IL-6 and IL-1β by ELISA

TNF-α, IL-6 and IL-1β levels were measured from cell culture supernatants using ELISA kits following the manufacturer’s instructions. The supernatants from SDF-stimulated cells were diluted 10 times prior to measuring the TNF-α and IL-6 levels by ELISA. The level of each cytokine was measured using technical duplicates.

2.6. Nitric Oxide (NO) Determination

RAW cells were seeded at 1 × 10⁵ cells per well in 96-well plates in complete media and treated for 24 h as indicated: SDF (500 µg/mL), LPS (1 µg/mL) and Tak-242 (10 µM). After treatment, 50 µL of extracellular media was collected from each well and transferred to a new 96-well plate to carry out the Griess reaction, according to the manufacturer’s instructions. NO is a short-lived free radical that is very difficult to detect in cells; one method to estimate NO levels is to determine the levels of nitrites, which are the oxidation products of NO [35]. A standard curve generated with known concentrations of nitrites was used to estimate the concentrations of nitrites in the extracellular media. The experiment was performed using technical duplicates.

2.7. Quantitative Reverse Transcriptase Real-Time Polymerase Chain Reaction (qRT-PCR)

The treated cells were detached using a cell scraper and washed with cold PBS. Total RNAs were isolated using the PureLink® RNA Mini Kit (Invitrogen) according to the manufacturer’s instructions. The RNA was reverse-transcribed into cDNAs using the M0277 Reverse Transcription kit (New England BioLabs Inc.). The qRT-PCR reactions were set up using 5 ng cDNA per reaction, using the SYBR® Green QRT-PCR Master Mix with Low ROX (Agilent Technologies, USA) and the primers described in Table 1
The PCR reaction was performed as follows: 95 °C for 10 min; 40 cycles consisting of 95 °C for 30 s, 60 °C for 1 min, and 72 °C for 1 min; a melting step consisting of 95 °C for 1 min, 55 °C for 30 s, and 95 °C for 30 s was added at the end of the cycles. ΔCt values were calculated using β-actin as the housekeeping gene. The fold of change was calculated as 2Δ(ΔCt). The experiment was performed using technical duplicates.

2.8. Metabolic Activity Assay

RAW cells were seeded at 10,000 cells per well in 96-well plates in complete media and incubated for 24 h to allow for attachment. Six technical replicates were used for each condition. The experiment was repeated twice. Cells were further incubated for 24 h after the addition of either 500 μg/mL (final concentration) SDF or complete media. Changes in metabolic activity were then assessed by adding 1/10 volume 0.1 mg/mL of the metabolic dye Alamar Blue (AB) in each well [36]. After 6 h incubation, the fluorescence emission intensity of AB was measured at 590 nm (Ex: 540 nm). The fluorescence values from SDF-treated cells were compared to the fluorescence values of cells incubated with media only. The baseline fluorescence of the media was only subtracted from each fluorescence value before comparison.

2.9. Statistical Analysis

Six independent SDF preparations (biological replicates) were generated from cooked Pinto (Monterrey) bean flour, cooked Black (Eclipse) bean flour, raw Pinto (Monterrey) bean flour, and raw Black (Eclipse) bean flour. Each experiment was performed using these independent preparations. ELISA and NO assays were conducted in triplicate wells, and qPCR analyses were performed in technical duplicates. For the qPCR experiment, the SDF samples were named C1 to C6 and R1 to R6, or 101 to 124 (see Table A1 for details). In the graphs, mean values were plotted with standard deviations. ANOVA, followed by a Scheffe post hoc test, was used to calculate statistical differences between groups. These differences were indicated in the graphs with the presence of an asterisk (*) as follows: * p < 0.05; ** p < 0.01; *** p < 0.001. When indicated, Pearson’s correlation coefficients (R and p-value) were calculated using R (version 4.4.2; R Core Team, 2024). Correlation strengths were described as very strong (R > 0.8), strong (0.6 < R < 0.79) or moderate (0.4 < R < 0.59).

3. Results

3.1. Endotoxin Contents in SDF Samples

Endotoxin is a frequent contaminant in biological preparations and possesses macrophage-stimulating properties [33]. Therefore, each SDF sample was evaluated for its level of endotoxin using the chromogenic LAL assay, which is the gold standard for measuring endotoxins in biological samples [37]. The level of endotoxin in the SDF samples ranged from 0.08 to 0.12 ng/mL (Appendix A Table A1). It was previously reported that at least 0.5 ng/mL endotoxin was needed to induce in vitro cytokine production in macrophages and dendritic cells [38,39]. The levels of endotoxins in our SDF samples were below this concentration and were therefore not considered to significantly contribute to the observed increases in cytokines or NO levels in our biological assays.

3.2. SDF Stimulates the Production of NO by Macrophages in Part Through the Activation of the TLR-4 Signaling Pathway

We initially compared the levels of NO, TNF-α, IL-6 and IL-1β from RAW cells stimulated with Pinto/Monterrey SDF or Black/Eclipse SDF, but we did not observe statistically significant differences in NO or cytokine levels between the two varieties of bean. However, we observed differences in NO or cytokine levels between the SDF extracted from cooked or raw bean flours. For these reasons, for the rest of the study, the “cooked SDF” samples include those from Pinto/Monterrey and Black/Eclipse SDF. Similarly, the “raw SDF” samples include those from Pinto/Monterrey and Black/Eclipse SDF.
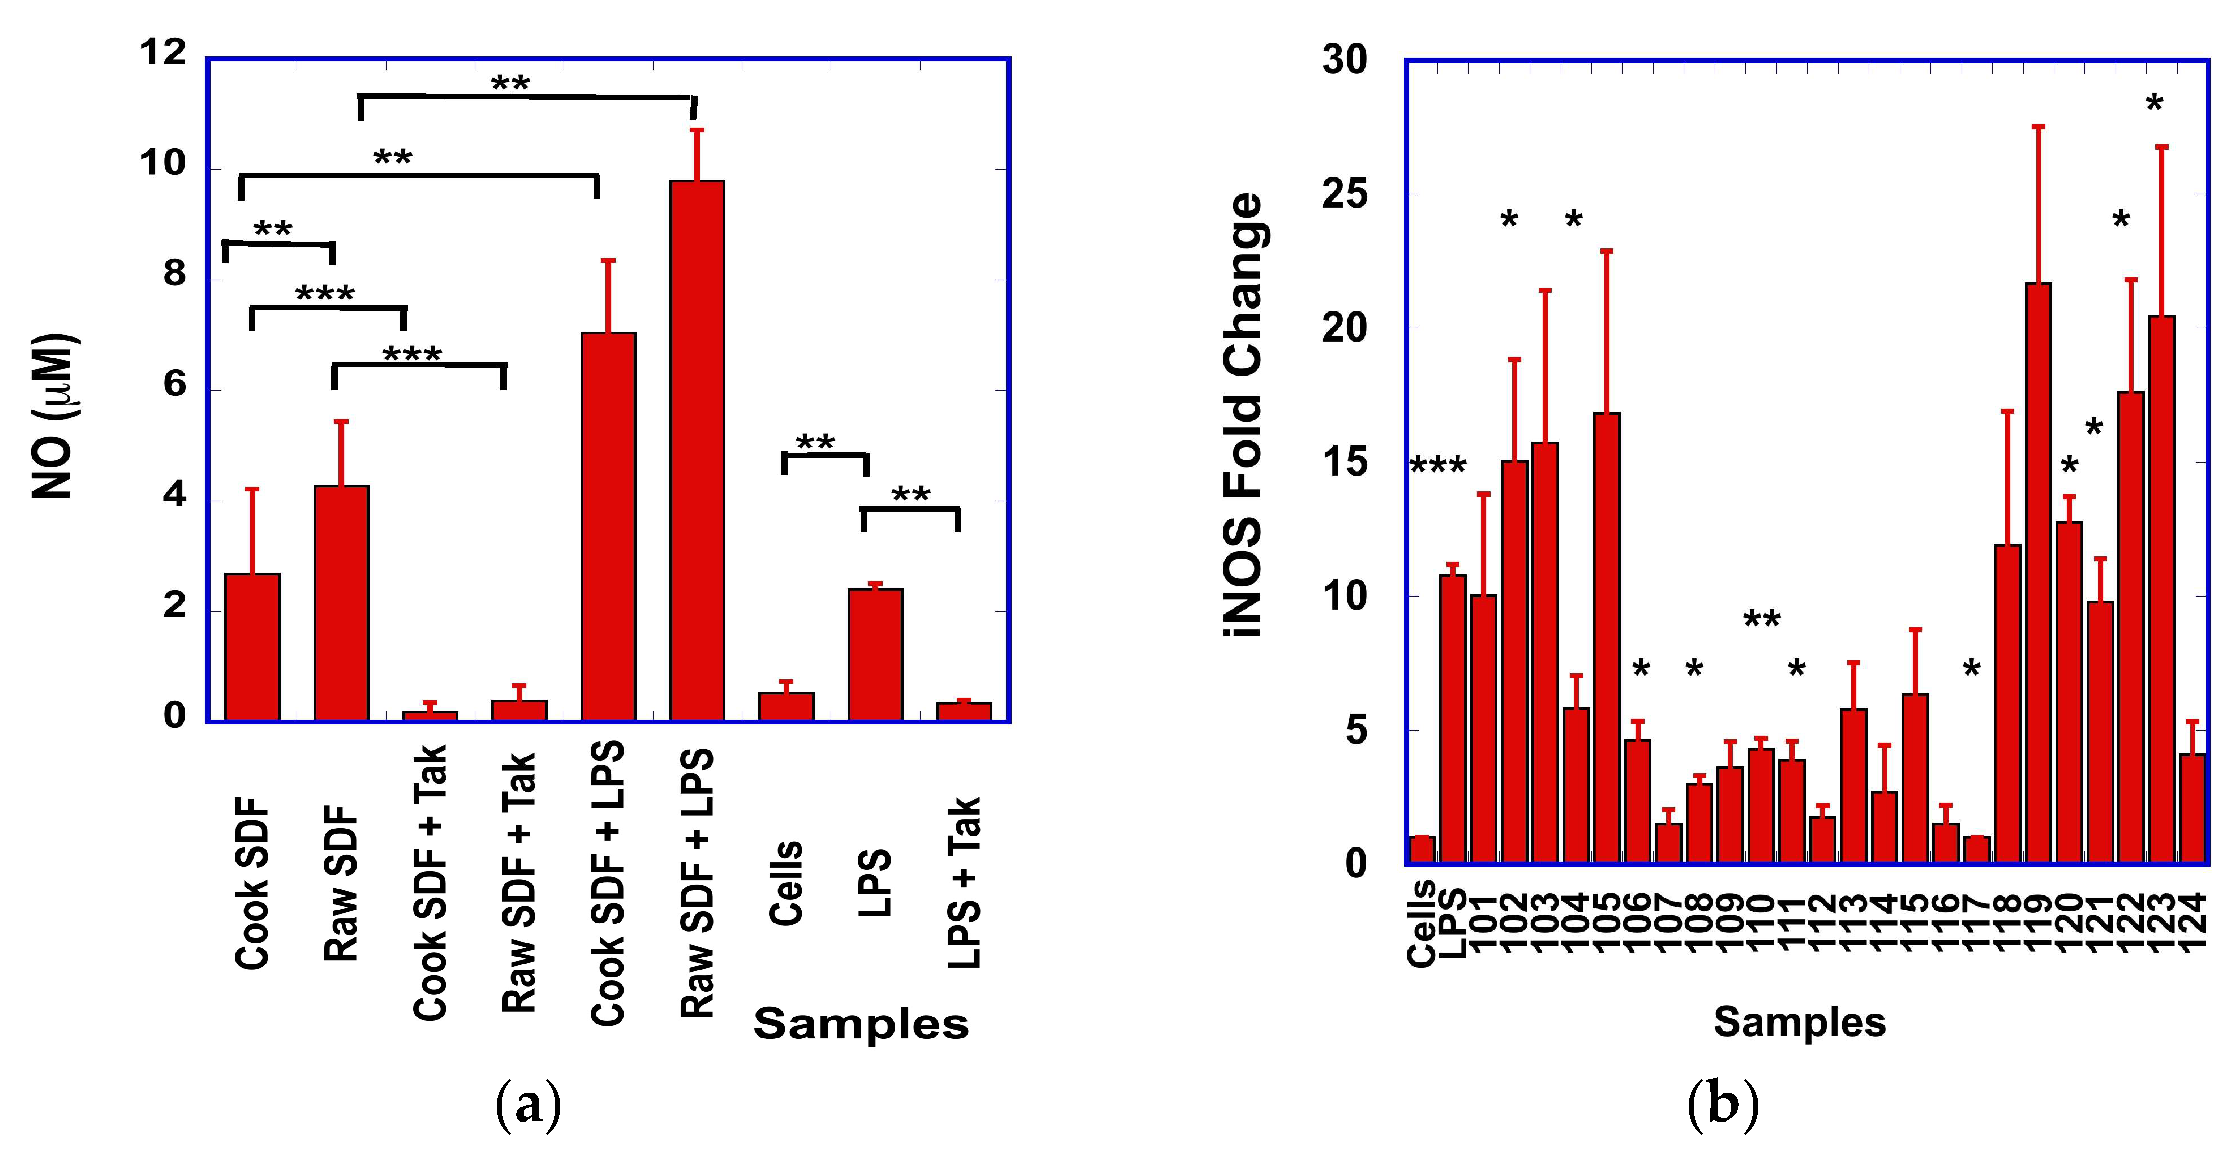
In our first set of experiments, we investigated whether the SDF could stimulate the production of NO by macrophages. Macrophage cell stimulation with LPS resulted in a statistically significant (p = 0.006) increase in NO levels (2.0 μM ± 0.03 μM) when compared to unstimulated cells (0.5 μM +/− 0.19 μM) (Figure 1a). Both raw and cooked SDF stimulated the production of NO when compared to unstimulated cells; NO levels were statistically lower (2.68 μM +/− 1.53 μM) from cooked SDF than from raw SDF (4.27 μM +/− 1.16 μM) (p = 0.009) (Figure 1a). Details on the effects of the different SDF on the production of NO by macrophages are presented in Appendix A (Figure A2).
Macrophages possess surface pattern recognition receptors (PRRs) that detect and bind to specific ligands known as pathogen-associated molecular patterns (PAMPs) or damage-associated molecular patterns (DAMPs); the activation of PRRs by PAMPs or DAMPs results in the upregulation and expression of inflammatory enzymes and cytokines [40]. Among PRRs, TLR-4 was found to mediate the activation of macrophages by polysaccharides [41]. When the macrophages were pre-incubated with the Tak-242 small molecule TLR-4 inhibitor [42] prior to stimulation with the SDF samples, we observed that NO production was statistically significantly reduced for both raw and cooked SDF samples (Figure 1a). These results suggest that the SDF triggers the production of NO from macrophages in part through the activation of the TLR-4 signaling pathway.
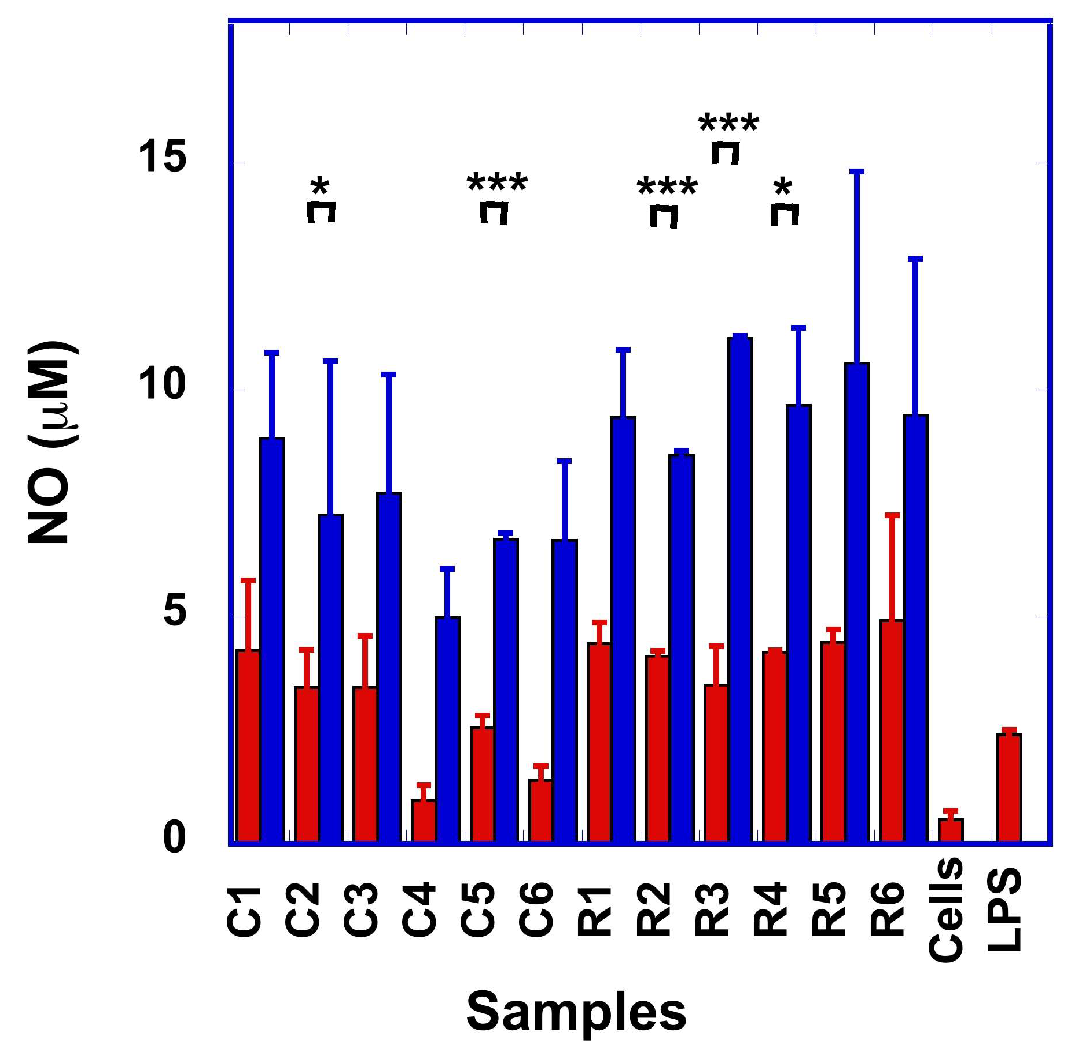
Because LPS stimulates the production of NO through the activation of TLR-4, we next investigated whether pre-incubation of the macrophages with LPS would affect the production of NO by the SDF. To our surprise, we observed that the NO levels were further increased when the macrophages were stimulated with SDF in the presence of LPS (Figure 1a and Appendix A, Figure A1). Overall, the levels of NO produced by LPS and SDF-stimulated macrophages were statistically significantly higher (p = 0.002) for raw SDF than for cooked SDF (Figure 1a). A strong positive Pearson correlation (R = 0.68; p = 0.002) was observed between the levels of NO produced by SDF in non-LPS-stimulated macrophages and in LPS-stimulated macrophages. In addition, we observed that, when considering all raw and all cocked SDF, the NO levels resulting from the stimulation with both SDF and LPS (7.04 μM +/− 1.31 μM for LPS and cooked SDF, and 9.79 μM +/− 0.092 μM for LPS and raw SDF) were higher than the sum of the NO levels obtained from the stimulation with SDF alone (2.68 μM +/− 1.53 μM for cooked SDF and 4.27 μM +/− 1.16 μM for raw SDF) and LPS alone (2.0 μM +/− 0.03 μM), suggesting a synergistic effect between SDF and LPS for the production of NO by macrophages (Figure 1a).
We next investigated if the NO levels generated from macrophages stimulated with SDF correlated with the levels of inducible (iNOS) mRNA. Stimulation of macrophages with LPS resulted in about a 10-fold increase in iNOS mRNA when compared with unstimulated cells (p < 0.001) (Figure 1b). Overall, the effects of the SDF on the levels of iNOS mRNA varied among SDF, with statistically significant (p < 0.05 to p < 0.01) differences observed with the cooked SDF samples 102, 104,106, 108, 110, 111, and raw SDF samples 120, 121, 122 and 123, when compared to unstimulated cells (Figure 1b). We performed a Pearson’s correlation analysis between the levels of NO produced by SDF-stimulated cells and the iNOS mRNA levels and observed a strong correlation (R = 0.71, p < 0.001), suggesting that SDF stimulates the production of NO through the upregulation of iNOS in macrophages.

3.3. SDF Stimulates the Production of TNF-α, IL-6 and IL-1β by Macrophages in Part Through the Activation of the TLR-4 Signaling Pathway

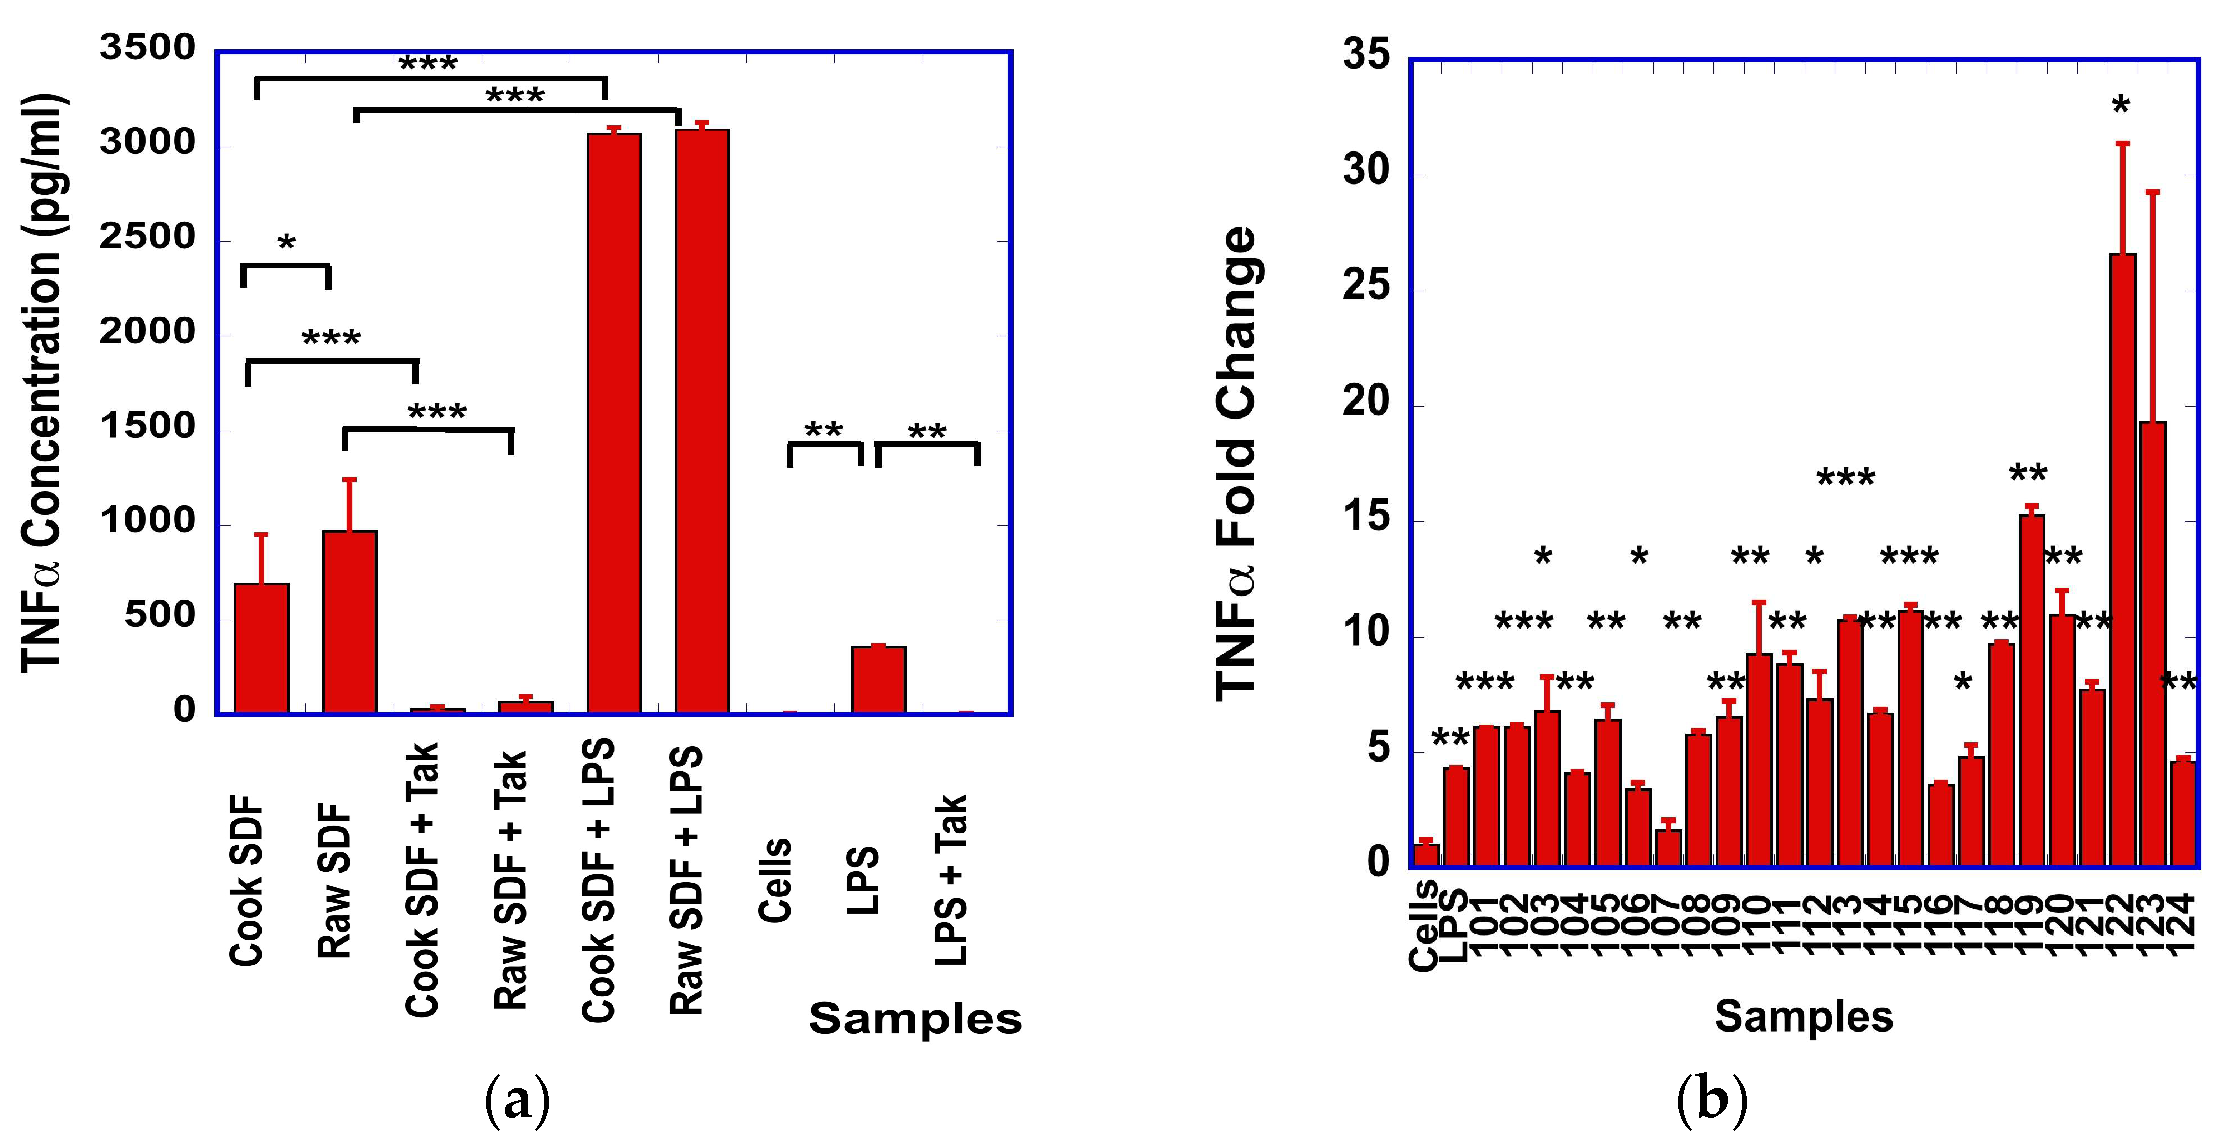
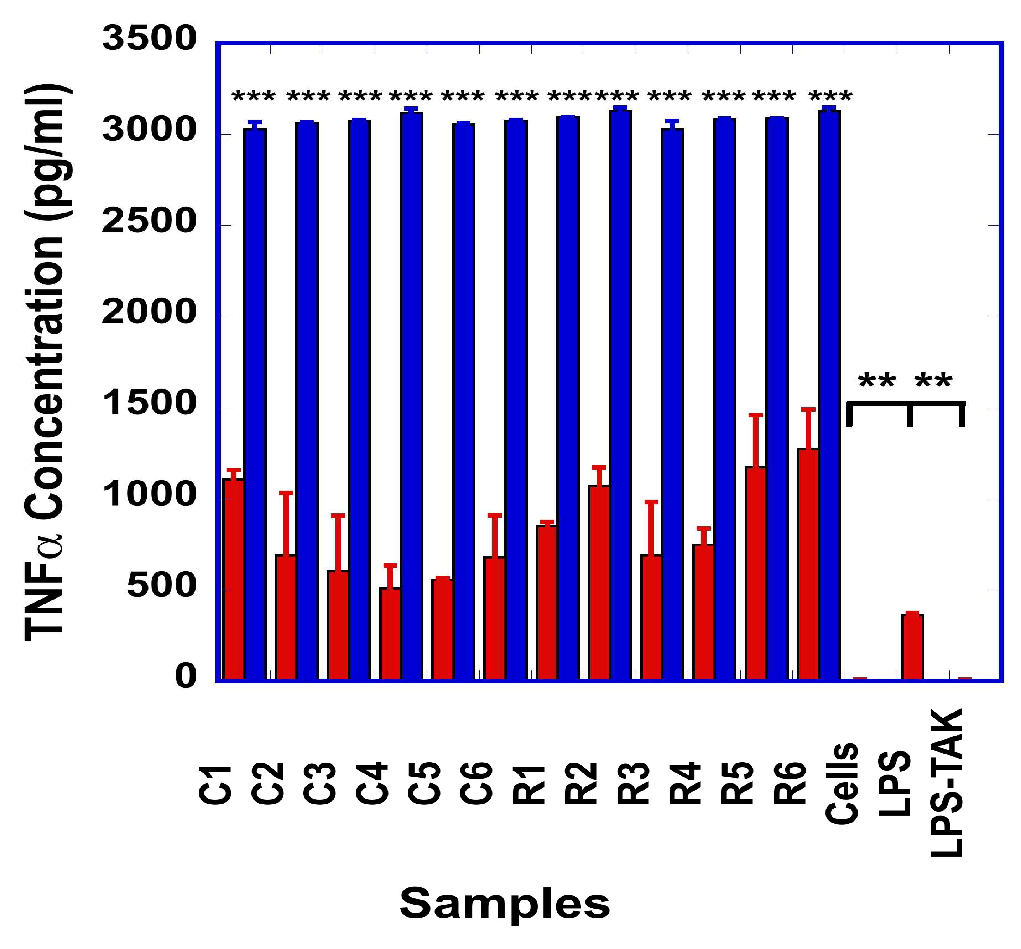
We observed statistically higher levels of TNF-α in the supernatants of SDF-stimulated cells than in unstimulated cells (Figure 2a), with more than 100-fold difference in TNF-α levels between samples (Appendix A Figure A2). For seven of the SDF samples (C1, C2, R1, R2, R4, R5 and R6), we noted that the levels of TNF-α were statistically significantly higher than those generated by the cells stimulated by LPS alone (362 pg/mL +/− 10 pg/mL) (Appendix A Figure A2). The levels of TNF-α generated from cooked SDF samples were statistically significantly higher than from raw SDF (Figure 2a). Pre-incubation of the cells with Tak-242 resulted in a reduction in TNF-α production by the cells (Figure 2a), suggesting that the TLR-4 signaling pathway is involved in part in the generation of TNF-α from SDF-stimulated cells. When pre-incubating the RAW cells with LPS prior to the stimulation with SDF, we observed a 3-to-6-fold statistically significant higher level of TNF-α (Figure 2a) when compared to the cells treated with SDF alone, suggesting a synergistic effect between LPS and SDF in the macrophages.
The quantitative PCR analysis revealed large differences in TNF-α transcript levels, ranging from 1-fold to 25-fold, between the different SDF samples. Statistically significant differences between SDF-stimulated cells and unstimulated cells were observed in all but two SDF samples (Figure 2b). In addition, Pearson’s correlation analysis between the TNF-α levels, obtained by ELISA, and the mRNA fold changes showed a statistically significant moderate correlation (R = 0.58, p = 0.003).
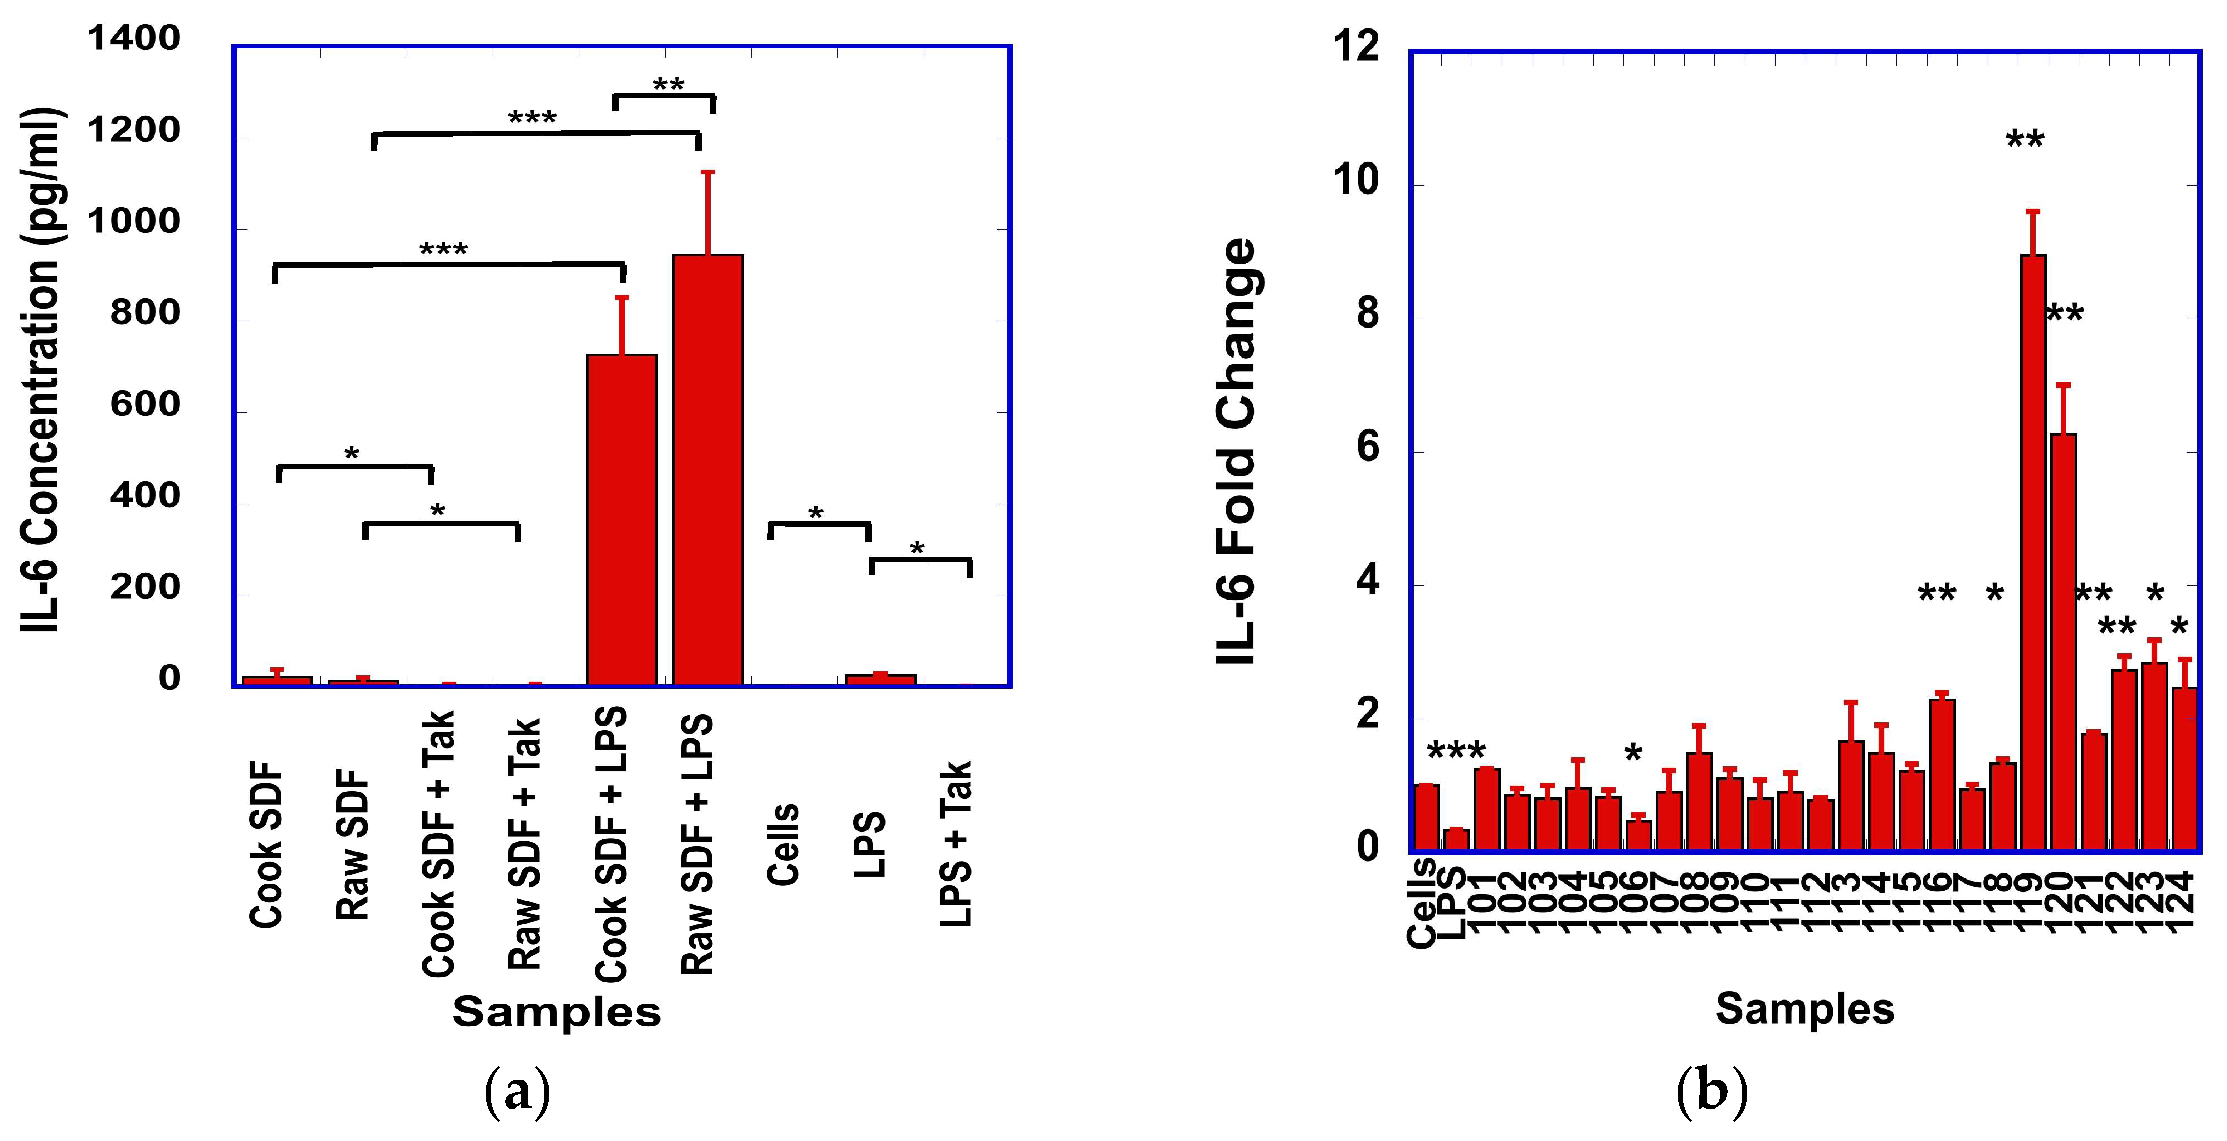
Stimulation of the macrophages with the bean SDF also resulted in increased IL-6 (Figure 3a). No difference in IL-6 levels was observed between RAW cells stimulated with cooked and raw SDF. However, after pre-stimulation with LPS, the IL-6 levels generated from raw SDF were higher than those generated from cooked SDF (Figure 3a).
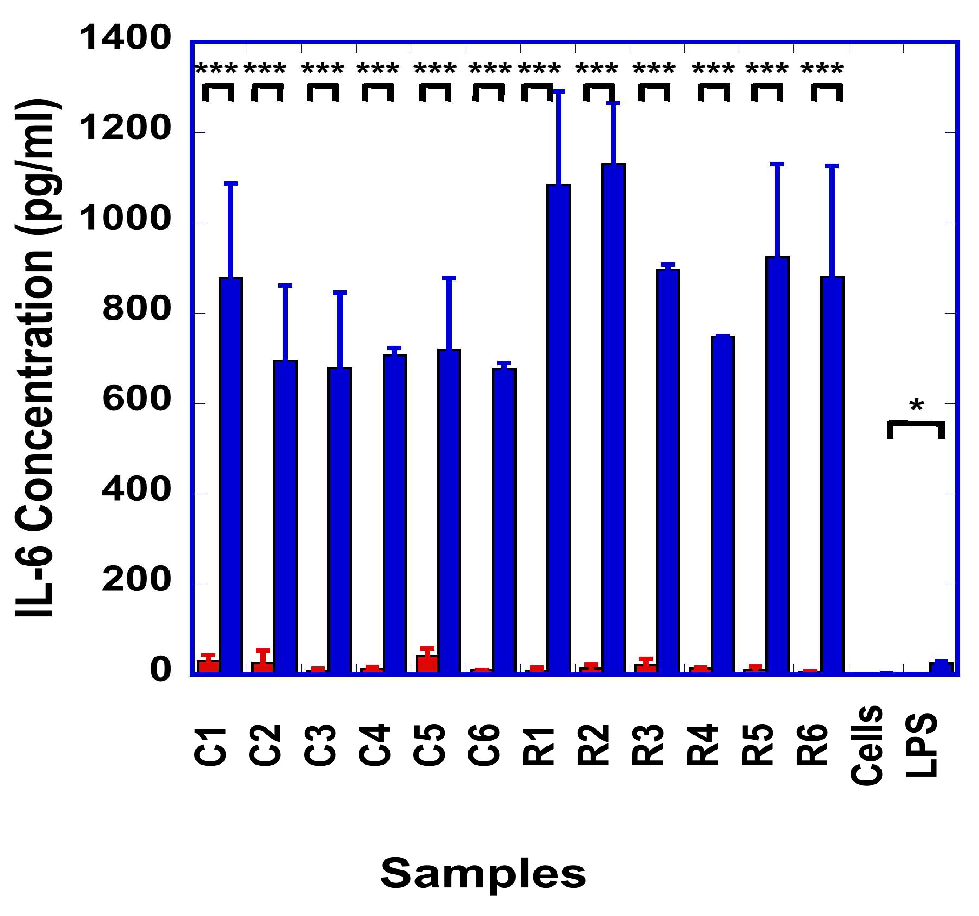
For example, the macrophages produced from 17-fold (observed with C5) up to 145-fold (observed with R6) statistically significantly higher levels of IL-6, in the presence of LPS and SDF, than when stimulated with SDF alone, suggesting a very strong synergistic effect between the SDF and LPS (Appendix A Figure A3). After pre-treatment with Tak-242, the levels of IL-6 produced from SDF-treated cells significantly decreased, suggesting a role of the TLR-4 signaling pathway in the production of IL-6 (Figure 3a).
IL-6 transcript levels were found to increase with the stimulation from one cooked (106) and eight different raw samples (116, 118, 119, 120, 121, 122, 123 and 124) (Figure 3b). However, surprisingly, no statistically significant correlation (R = 0.17, p = 0.420) was observed between the transcript and protein levels of IL-6.
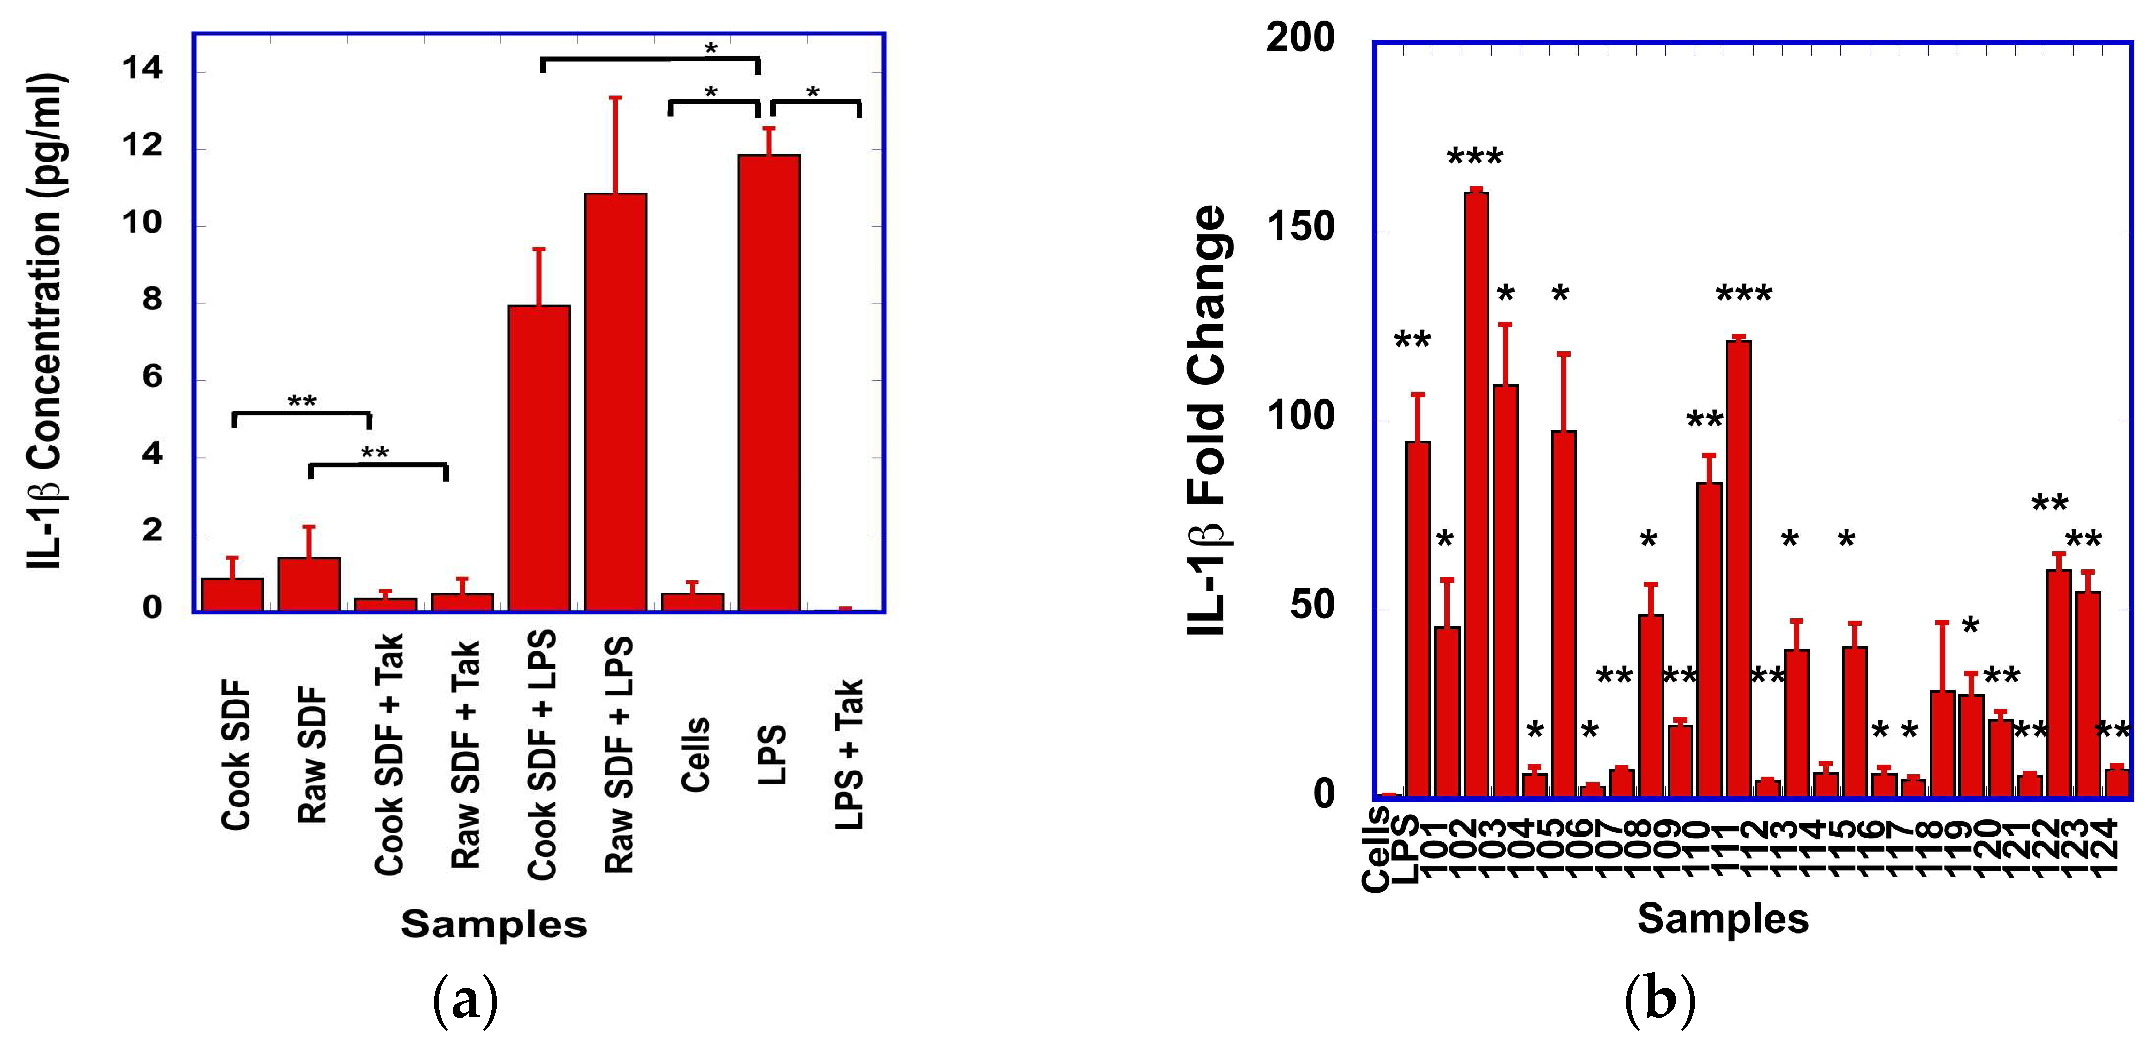
The effect of SDF on the production of IL-1β by macrophages was variable among SDF, without statistically significant differences when compared to unstimulated cells. In general, SDF stimulation resulted from lower levels of IL-1β than the stimulation with LPS (Figure 4a). However, the levels of IL-1β from SDF-stimulated cells were reduced when cells were pre-treated with Tak-242, for both cooked and raw SDF (Figure 4a).
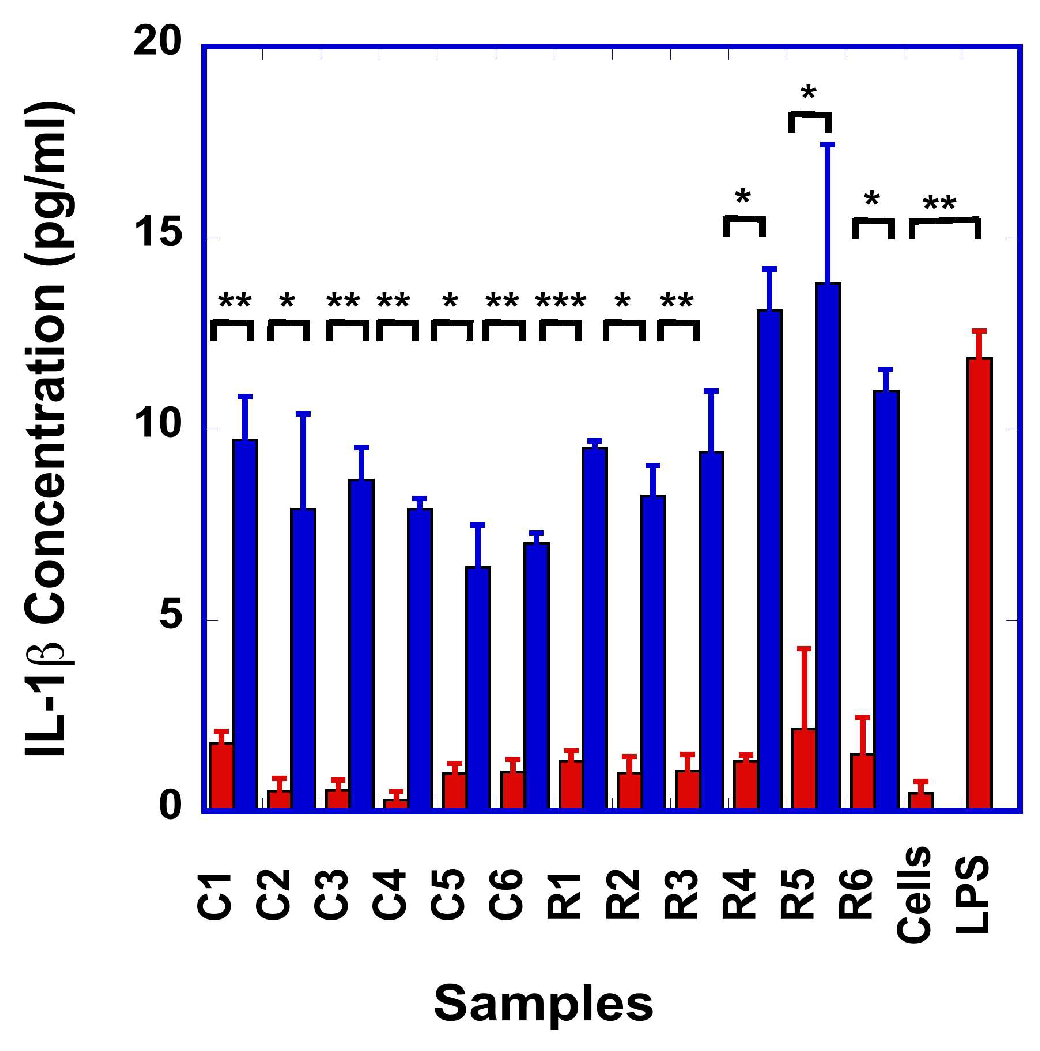
Pre-incubation of the cells with LPS resulted in large increases in IL-1β for both cooked and raw SDF (Figure 4a). However, these levels were lower than those generated from cells stimulated with LPS alone (Figure 4a and Appendix A Figure A4).
At the transcript level, all but two SDF samples showed statistically significant increases in IL-1β when compared to unstimulated cells (Figure 4b). Levels of IL-1β transcripts from SDF-stimulated cells were higher than from unstimulated cells but generally lower than from LPS-stimulated cells. For half the SDF samples, the levels of IL-1β transcripts were increased by more than 40-fold compared to those from unstimulated cells (Figure 4b). Interestingly, these large differences in IL-1β transcript levels were not observed at the protein level, where only about 2-fold changes in IL-1β were observed among SDF. In line with this observation, no Pearson correlation was observed between the transcript and the protein levels of IL-1β.
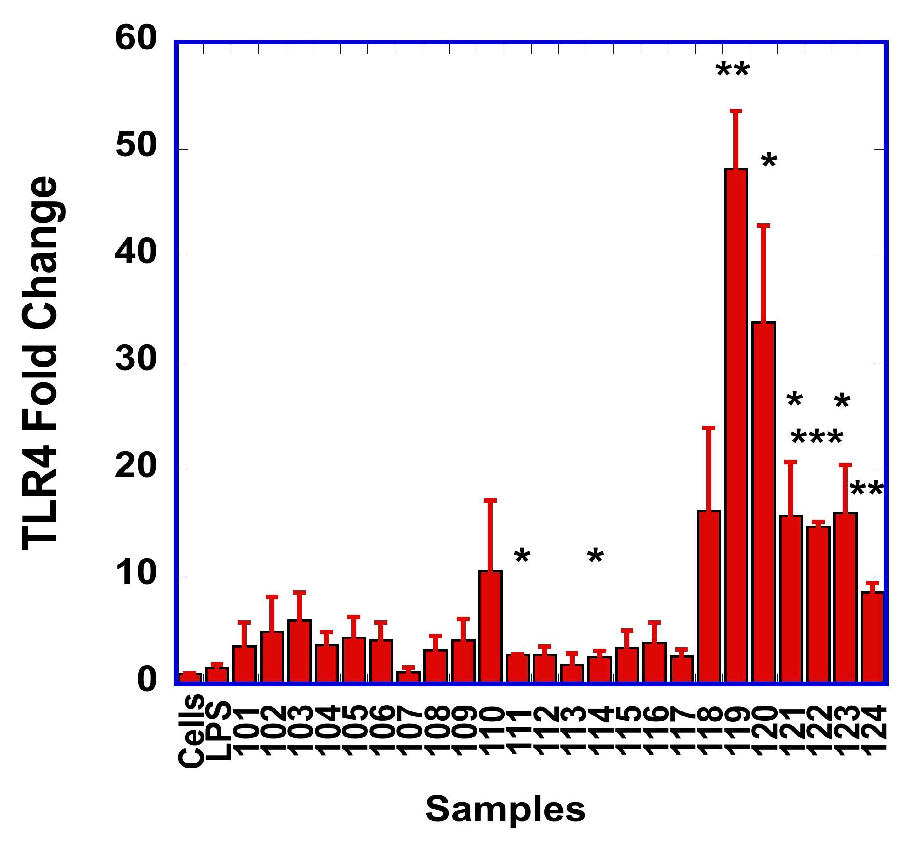
After observing that the TLR-4 signaling pathway was involved in the production of NO and of the pro-inflammatory cytokines TNF-α, IL-6 and IL-1β, we investigated if the stimulation of the macrophages with the SDF resulted in changes in TLR-4 transcript levels (Figure 5). We observed statistically significant increases in TLR-4 transcripts with one cooked (111) sample and seven raw (114, 119, 120, 121, 122, 123 and 124) samples.
Pearson’s correlation analysis between TNF-α and TLR-4 transcripts revealed a moderate correlation (R = 0.51, p = 0.011), suggesting a link between TNF-α generated from the cells and the upregulation of TLR-4.

4. Discussion

Many studies have reported that plant-derived polysaccharides promote the production of pro-inflammatory cytokines by macrophages. Examples of plants include the herbaceous vine Tinosporia cordifolia, elderberries (Sambucus nigra L.), an orchidaceae plant (Dendrobium huoshanense) and the black nightshade plant (Solanum nigrum) [32,43,44]. In these studies, the plant-derived polysaccharides stimulated the macrophages through their interaction with TLR-4 [32,43,44].
We observed that dry bean-derived SDF has similar immunomodulatory effects to other plant-derived polysaccharides. In our experimental conditions, we showed that the SDF prepared from dry beans stimulated the production of NO (Figure 1a), as well as the expression of TNF-α (Figure 2a), IL-1β (Figure 4a) and IL-6 (Figure 3a) by the RAW macrophages. A strong correlation was found between the transcript levels of iNOS and NO levels, suggesting that iNOS was involved in the production of NO.
When evaluating Pearson correlations between the protein and transcript levels of the three examined cytokines, we only observed a strong Pearson correlation between the protein and transcript levels for TNF-α; no statistically significant correlations were found between the protein and transcript levels of IL-1β and IL-6. This discrepancy could be the result of complex post-transcriptional mechanisms regulating the stability of IL-1β and IL-6 transcripts. Indeed, both IL-6 and IL-1β transcripts are unstable, and their transcription is tightly regulated to prevent excessive inflammation [45,46]. Additional mechanisms could involve differences in inflammasome activity or protein degradation [47]. For instance, it was shown that in dendritic cells, IL-6 signaling results in auto-inhibition of IL-6 synthesis, in order to prevent excessive production of IL-6 by cells [48]. Similarly, complex mechanisms regulate the secretion of IL-1β. When synthesized in cells, IL-1β is produced in the form of a precursor protein or pro-IL-1β, which is converted into active IL-1β through a proteolytic cleavage performed by intracellular NLR family pyrin domain-containing 3 (NLRP3)/Apoptosis-associated Speck-like protein containing a CARD (ASC)/caspase-1 inflammasomes in the presence of activating signals [49,50]. In the absence of these activating signals, pro-IL-1β is not converted into the active IL-1β, and might either remain unprocessed intracellularly or be degraded following ubiquitination [51,52]. These complex mechanisms might explain the absence of a positive correlation between the levels of transcript and of secreted protein for these two cytokines (IL-1β and IL-6). Additional experiments would be necessary to determine these mechanisms.
We showed in our study that the synthesis of NO and the production of the pro-inflammatory cytokines (TNF-α, IL-1β and IL-6) by the RAW macrophages were strongly reduced by Tak-242, a small molecule inhibitor of TLR-4. This suggests that the pro-inflammatory effects of the SDF are mediated in part by the TLR-4 signaling pathway. Interestingly, we also observed that 8 out of the 24 SDF stimulated the transcription of TLR-4; one cooked SDF (#111) and seven raw SDF (#114, #119, #120, #121, #122, #123, and #124). The strong Pearson correlation between the transcript levels of TLR-4 and TNF-α further supports the role of TLR-4 in mediating the pro-inflammatory effects of the SDF. Studies have shown that alginate-derived guluronate oligosaccharides also stimulated the transcription and expression of TLR-4, which is in line with our observations [53]. However, we acknowledge that other pattern recognition receptors, such as TLR-2 and Dectin-1, could be involved in the pro-inflammatory response from the RAW macrophages. Indeed, polysaccharides extracted from Acanthopanax senticosus were shown to activate TLR-2 [54].
As it was previously reported that plant-derived polysaccharides could bind to and compete with LPS for binding to TLR-4 [54,55], we anticipated that the addition of SDF to LPS-stimulated macrophages would result in a decreased production of NO and pro-inflammatory cytokines. However, we observed a synergistic pro-inflammatory effect between LPS and SDF. Interestingly, Ferwerda et al. recently reported that bacterial β-glucans and LPS could synergistically activate TLR-4. In addition, these authors showed that when bound to β-glucans, Dectin 1 could also synergize with both TLR-4 and TLR-2 [56]. Further studies using neutralizing antibodies against TLR-4, TLR-2, as well as Dectin-1 could be performed to elucidate the pro-inflammatory signaling pathways activated by the SDF. Additional studies using RAW cells lacking these pattern recognition receptors could further inform on these signaling pathways.
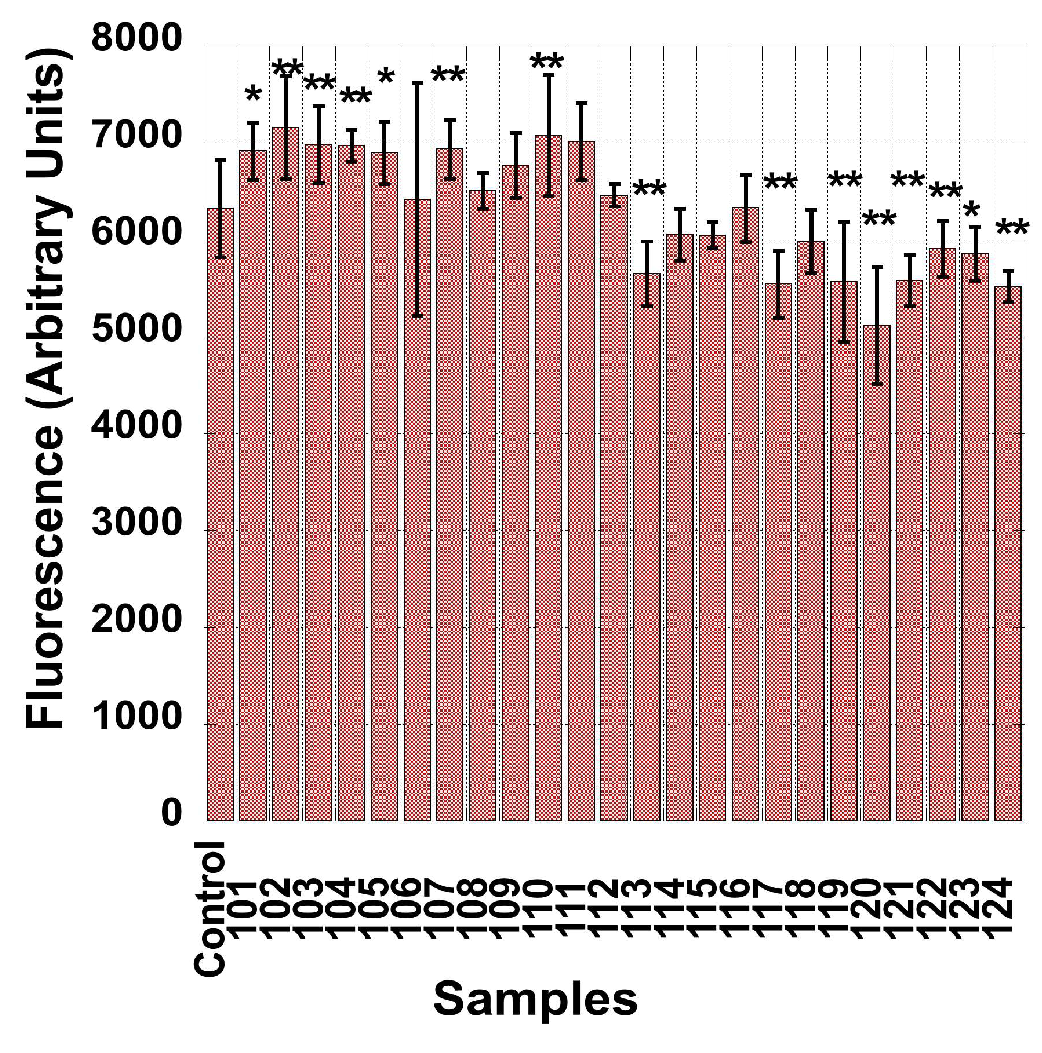
One of the goals of our study was to determine if the process of cooking the dry bean flour had some effect on the immunomodulatory properties of the SDF. We observed statistically significantly higher levels of NO and TNF-α in RAW macrophages stimulated with raw SDF than with cooked SDF (Figure 1a and Figure 2a). These effects were not observed for the expression of IL-1β and IL-6. We also observed higher macrophage metabolic activity with cooked SDF than with raw SDF (Figure A5). All but three types of SDF derived from cooked flour show a moderate (up to 12%) increase in metabolic activity at 500 µg/mL compared to control cells. Similarly, all but three types of SDF derived from raw flour showed moderately lower (up to 19% lower) metabolic activity than untreated cells. Our data suggest that cooking dry bean flour could alter the immunomodulatory properties of SDF extracted from the flour.
The chemical and physical properties of the SDF extracted from the raw and cooked dry bean were characterized in a previously published manuscript [33]. The extracts contained pectin-rich polysaccharides (mainly arabinose- and galacturonic acid-based structures), hemicelluloses (xyloglucans, xylans), and raffinose family oligosaccharides (RFOs). Molecular weight analysis of the dry bean-derived SDF revealed two fractions, a high-molecular-weight (HMW) component (≈4800–5000 kDa) dominated by stable pectin polymers and a low-molecular-weight (LMW) component (<3000 kDa) comprising shorter pectins and RFOs. Cooking reduced the LMW fraction, consistent with RFO depolymerization.
The observed differences between raw and cooked SDF-rich fractions suggest that thermal processing alters structural features that influence macrophage activation. Cooking is known to disrupt plant cell wall architecture, increasing the solubility and extractability of polysaccharides such as pectins and hemicelluloses. This enhanced extractability may improve the accessibility of bioactive components to immune cells. In addition, thermal processing can modify the molecular-weight distribution and conformation of polysaccharides, potentially generating fractions with greater biological activity. Changes in branching patterns or the exposure of functional groups, such as uronic acids and neutral sugar side chains, may enhance interactions with pattern recognition receptors, including TLR-4. Furthermore, cooking may alter the association between dietary fiber and phenolic compounds, either by releasing bound phenolics or modifying fiber–phenolic complexes, which could contribute to the observed immunomodulatory effects. Together, these structural and compositional changes provide a plausible explanation for the greater macrophage activation induced by cooked SDF-rich fractions compared to raw counterparts. Future experiments would include examining in detail the effect of heat-processing on the structural characteristics of dry bean-derived SDF and their possible correlation with immune modulatory functions.
When comparing the immunomodulatory functions of dry bean extracts, it is important to consider the protein levels of the biological samples. For example, when prepared as protein hydrolyzates and not SDF, dry bean extracts from Phaseolus vulgaris L. were shown to inhibit LPS-induced NO production in RAW 264.7 macrophages in a dose-dependent manner [30,57]. Similar observations were reported by López-Barrios et al. [57]. In the study of López-Barrios et al., the levels of NO produced from LPS-stimulated macrophages were found to be further reduced following enzymatic digestion of the protein hydrolyzates, suggesting that smaller peptides were more biologically active than larger peptides [57].
Protein hydrolyzates derived from dry beans typically contain 70% protein or peptide [58]. In our study, the SDF samples contained only between 13.8% and 21.3% residual protein [27]. Cooking significantly increased sugar content while reducing residual protein, likely due to enhanced proteolysis. The level of protein or peptide content in SDF samples could thus modulate the balance between anti- and pro-inflammatory effects in macrophages. It is also noteworthy that the cited studies above [30,57] did not utilize whole-grain flour to prepare the protein hydrolyzates, as the beans were dehulled. Bean hulls are the part of the seed with the highest fiber content, so it can be assumed that their protein hydrolyzate fractions did not contain fibers that may elicit the results we have described.
The presence of phenolic compounds in the dry bean extracts could also influence the experimental outcomes. In one study, dry bean phenolic-rich extracts were shown to have anti-inflammatory properties by reducing the levels of NO and iNOS, TNF-α, IL-1β and IL-6 transcripts, in LPS-stimulated RAW macrophages [29]. In another study, phenolic extracts obtained from the seed coats (hulls) of dry beans were also shown to have anti-inflammatory properties by inhibiting cyclooxygenases (COX) 1 and 2, as well as lipoxygenase (LOX) [59]. Similar anti-inflammatory effects with inhibition of COX and LOX enzymes have been reported with phenolic extracts from faba beans (Vicia faba L.) [60]. These data further suggest that the presence of phenolic compounds in SDF samples might also affect the inflammatory response in macrophages. The SDF samples used in our study may contain certain levels of phenols, such as flavonoids, kaempferol 3-0 glucoside, hydroxycinnamic acid derivatives or anthocyanins, since the whole grain flours from which the SDF samples were extracted contained these compounds [27]. These co-extracted components could independently influence macrophage activation and represent a key limitation of our study, as they could have interfered with the outcomes by counteracting the pro-inflammatory effects. Therefore, in future studies, quantification and characterization of the phenolic compounds in the SDF samples should be conducted to fully determine their impact.

5. Conclusions

In summary, this study demonstrates that SDF-rich fractions derived from dry beans modulate macrophage activity in vitro, promoting a pro-inflammatory response characterized by increased production of nitric oxide and cytokines. The observed effects were partially attenuated by TLR-4 inhibition, suggesting involvement of this signaling pathway, although additional mechanisms may also contribute.
Importantly, the SDF-rich fractions used in this study are heterogeneous and contain residual non-fiber components, such as proteins and phenolic compounds, which may have influenced the observed responses. Furthermore, as this work was conducted in RAW 264.7 macrophages, the findings are limited to an in vitro model and may not directly translate to physiological conditions.
Future studies should focus on the use of more refined fractions, evaluating their mechanisms of action, and determining their physiological relevance in more complex biological systems to better understand the immunomodulatory potential of bean-derived components.

Author Contributions

Conceptualization, S.S., A.M.M.L. and E.L.; methodology, S.S., A.M.M.L. and E.L.; software, A.M.M.L., M.W. and E.L.; validation, S.S., A.M.M.L. and E.L.; formal analysis, S.S., A.M.M.L. and E.L.; investigation, A.M.M.L.; resources, S.S. and E.L.; data curation, S.S., A.M.M.L. and E.L.; writing—original draft preparation, S.S., A.M.M.L. and E.L.; writing—review and editing, S.S., A.M.M.L., M.W. and E.L.; visualization, A.M.M.L. and E.L.; supervision, S.S. and E.L.; project administration, S.S.; funding acquisition, S.S. and E.L. All authors have read and agreed to the published version of the manuscript.

Funding

Part of the research reported in this publication was supported by TRANSCEND (the National Institute of General Medical Sciences of the National Institutes of Health under Project Number 1P20GM155890-01), the College of Health and Human Sciences at NDSU, and the NIH-NIGMS Award number U54GM128729.

Institutional Review Board Statement

Not applicable.

Informed Consent Statement

Not applicable.

Data Availability Statement

The original contributions presented in this study are included in the article. Further inquiries can be directed to the corresponding author.

Conflicts of Interest

The authors declare no conflicts of interest.

Abbreviations

SDFSoluble dietary fiber
NONitric oxide
TNFTumor necrosis factor
ILInterleukin
TLRToll-like receptor
DFDietary fiber
IDFInsoluble dietary fiber
NKNatural killer
INFInterferon
LPSLipopolysaccharide
AXHArabinoxylan hydrolyzate
FBSFetal bovine serum
LALLimulus amebocyte lysate
DMEMDulbecco’s modified Eagle’s medium
NDNorth Dakota
qRT-PCRQuantitative reverse transcriptase real-time polymerase chain reaction
ABAlamar Blue
iNOSInducible nitric oxide synthase
PRRPattern recognition receptor
PAMP Pathogen-associated molecular pattern
DAMPDamage-associated molecular pattern
NLRP3NLR family pyrin domain-containing 3
ASCApoptosis-associated Speck-like protein containing a CARD
RFOsRaffinose family oligosaccharides
HMWHigh molecular weight
LMWLow molecular weight
COXCycloxygenase
LOXLipoxygenase

Appendix A

Table A1. Details of the SDF samples used in the study. The endotoxin level (ng/mL) was measured in each of the samples. Six independent SDF samples were prepared from cooked Pinto/Monterrey flour and are identified as C1.1 to C3.2, or 101 to 106. Six independent SDF samples were prepared from cooked Black/Eclipse flour and are identified as C4.1 to C6.2, or 107 to 112. Six independent SDF samples were prepared from raw Pinto/Monterrey flour and are identified as R1.1 to R3.2, or 113 to 118. Six independent SDF samples were prepared from RAW Black/Eclipse flour and are identified as R4.1 to R6.2, or 118 to 124.
Sample NumberType/VarietyGrowth LocationProcessEndotoxin Level (ng/mL)
C1.1 101Pinto/MonterreyHattonCooked0.120
C1.2102Pinto/MonterreyHattonCooked0.122
C2.1103Pinto/MonterreyProsperCooked0.121
C2.2104Pinto/MonterreyProsperCooked0.119
C3.1105Pinto/MonterreyForest RiverCooked0.109
C3.2106Pinto/MonterreyForest RiverCooked0.121
C4.1107Black/EclipseHattonCooked0.120
C4.2108Black/EclipseHattonCooked0.122
C5.1109Black/EclipseProsperCooked0.119
C5.2110Black/EclipseProsperCooked0.117
C6.1111Black/EclipseForest RiverCooked0.120
C6.2112Black/EclipseForest RiverCooked0.109
R1.1113Pinto/MonterreyHattonRaw0.120
R1.2114Pinto/MonterreyHattonRaw0.121
R2.1115Pinto/MonterreyProsperRaw0.105
R2.2116Pinto/MonterreyProsperRaw0.118
R3.1117Pinto/MonterreyForest RiverRaw0.101
R3.2118Pinto/MonterreyForest RiverRaw0.103
R 4.1119Black/EclipseHattonRaw0.09
R4.2120Black/EclipseHattonRaw0.08
R5.1121Black/EclipseProsperRaw0.120
R5.2122Black/EclipseProsperRaw0.120
R6.1123Black/EclipseForest RiverRaw0.115
R6.2124Black/EclipseForest RiverRaw0.102
Figure A1. Comparison of the NO levels produced from macrophages stimulated with raw (R1–R6) or cooked (C1–C6) SDF, before (red bars) or after (blue bars) pre-stimulation with LPS. The statistical comparisons between the levels of NO generated from SDF-stimulated cells in the presence and absence of pre-stimulation with LPS are indicated. For SDF nomenclature, see Appendix A, Table A1 * p < 0.05; *** p < 0.001.
Foods 15 01471 g0a1
Figure A2. Comparison of TNF-α levels produced from macrophages stimulated with raw (R1–R6) or cooked (C1–C6) SDF, before (red bars) or after (blue bars) pre-stimulation with LPS. For SDF nomenclature, see Appendix A, Table A1. Statistical differences are indicated when observed. ** p < 0.01; *** p < 0.001.
Foods 15 01471 g0a2
Figure A3. Comparison of IL-6 levels produced from macrophages stimulated with raw (R1–R6) or cooked (C1–C6) SDF, before (red bars) or after (blue bars) stimulation with LPS. For SDF nomenclature, see Appendix A, Table A1. Statistical differences are indicated when observed. * p < 0.05; *** p < 0.001.
Foods 15 01471 g0a3
Figure A4. Comparison of IL-1β levels produced from macrophages stimulated with raw (R1–R6) or cooked (C1–C6) SDF, before (red bars) or after (blue bars) stimulation with LPS. For SDF nomenclature, see Appendix A, Table A1. Statistical differences are indicated when observed. * p < 0.05; ** p < 0.01; *** p < 0.001.
Foods 15 01471 g0a4
Figure A5. Changes in metabolic activity of RAW cells after 24h incubation with 500 μg/mL SDF. Control represents cells incubated with complete media only. For SDF nomenclature, see Appendix A, Table A1. * Indicates the statistical difference between control cells and cells incubated with SDF. * p < 0.05; ** p < 0.01.
Foods 15 01471 g0a5

References

  1. Jones, J.M. CODEX-aligned dietary fiber definitions help to bridge the ‘fiber gap’. Nutr. J. 2014, 13, 34. [Google Scholar] [CrossRef] [PubMed]
  2. Williams, B.A.; Mikkelsen, D.; Flanagan, B.M.; Gidley, M.J. “Dietary fibre”: Moving beyond the “soluble/insoluble” classification for monogastric nutrition, with an emphasis on humans and pigs. J. Anim. Sci. Biotechnol. 2019, 10, 45. [Google Scholar] [CrossRef] [PubMed]
  3. Bader Ul Ain, H.; Saeed, F.; Ahmed, A.; Asif Khan, M.; Niaz, B.; Tufail, T. Improving the physicochemical properties of partially enhanced soluble dietary fiber through innovative techniques: A coherent review. J. Food Process. Preserv. 2019, 43, e13917. [Google Scholar] [CrossRef]
  4. Dhingra, D.; Michael, M.; Rajput, H.; Patil, R.T. Dietary fibre in foods: A review. J. Food Sci. Technol. 2012, 49, 255–266. [Google Scholar] [CrossRef]
  5. Barber, T.M.; Kabisch, S.; Pfeiffer, A.F.H.; Weickert, M.O. The Health Benefits of Dietary Fibre. Nutrients 2020, 12, 3209. [Google Scholar] [CrossRef]
  6. Anderson, J.W.; Baird, P.; Davis, R.H., Jr.; Ferreri, S.; Knudtson, M.; Koraym, A.; Waters, V.; Williams, C.L. Health benefits of dietary fiber. Nutr. Rev. 2009, 67, 188–205. [Google Scholar] [CrossRef]
  7. DeVries, J.W.; Camire, M.E.; Cho, S.; Craig, S.; Gordon, D.; Jones, J.M.; Li, B.; Lineback, D.; Prosky, L.; Tungland, B.C. The definition of dietary fiber. Cereal Foods World 2001, 46, 112–129. [Google Scholar]
  8. Soliman, G.A. Dietary Fiber, Atherosclerosis, and Cardiovascular Disease. Nutrients 2019, 11, 1155. [Google Scholar] [CrossRef]
  9. Fu, L.; Zhang, G.; Qian, S.; Zhang, Q.; Tan, M. Associations between dietary fiber intake and cardiovascular risk factors: An umbrella review of meta-analyses of randomized controlled trials. Front. Nutr. 2022, 9, 972399. [Google Scholar] [CrossRef]
  10. Tejani, V.N.; Dhillon, S.S.; Damarlapally, N.; Usman, N.U.B.; Winson, T.; Basu Roy, P.; Panjiyar, B.K. The Relationship Between Dietary Fiber Intake and Blood Pressure Worldwide: A Systematic Review. Cureus 2023, 15, e46116. [Google Scholar] [CrossRef]
  11. Li, D.B.; Hao, Q.Q.; Hu, H.L. The relationship between dietary fibre and stroke: A meta-analysis. J. Stroke Cerebrovasc. Dis. 2023, 32, 107144. [Google Scholar] [CrossRef] [PubMed]
  12. Dayib, M.; Larson, J.; Slavin, J. Dietary fibers reduce obesity-related disorders: Mechanisms of action. Curr. Opin. Clin. Nutr. Metab. Care 2020, 23, 445–450. [Google Scholar] [CrossRef] [PubMed]
  13. McRae, M.P. Dietary Fiber Is Beneficial for the Prevention of Cardiovascular Disease: An Umbrella Review of Meta-analyses. J. Chiropr. Med. 2017, 16, 289–299. [Google Scholar] [CrossRef] [PubMed]
  14. Schley, P.D.; Field, C.J. The immune-enhancing effects of dietary fibres and prebiotics. Br. J. Nutr. 2002, 87, S221–S230. [Google Scholar] [CrossRef]
  15. Cohen, Y.; Elinav, E. Dietary fibers & immunity-more than meets the eye. Cell Res. 2023, 33, 411–412. [Google Scholar] [CrossRef]
  16. Qi, X.J.; Li, Y.L.; Fang, C.S.; Jia, Y.Y.; Chen, M.C.; Chen, X.Q.; Jia, J. The associations between dietary fibers intake and systemic immune and inflammatory biomarkers, a multi-cycle study of NHANES 2015-2020. Front. Nutr. 2023, 10, 1216445. [Google Scholar] [CrossRef]
  17. Shen, Y.; Zhao, H.; Wang, X.; Wu, S.; Wang, Y.; Wang, C.; Zhang, Y.; Zhao, H. Unraveling the web of defense: The crucial role of polysaccharides in immunity. Front. Immunol. 2024, 15, 1406213. [Google Scholar] [CrossRef]
  18. Mendis, M.; Leclerc, E.; Simsek, S. Arabinoxylan hydrolyzates as immunomodulators in lipopolysaccharide-induced RAW264.7 macrophages. Food Funct. 2016, 7, 3039–3045. [Google Scholar] [CrossRef]
  19. Mendis, M.; Leclerc, E.; Reuhs, B.L.; Simsek, S. Structure driven immunomodulatory properties of xylo-/arabinoxylo-oligosaccharides and arabinoxylans in RAW264.7 macrophages. Bioact. Carbohydr. Diet. Fibre 2019, 17, 100177–100182. [Google Scholar] [CrossRef]
  20. Li, W.L.; Zhang, S.Y.; Smith, C. The molecular structure features-immune stimulatory activity of arabinoxylans derived from the pentosan fraction of wheat flour. J. Cereal Sci. 2015, 62, 81–86. [Google Scholar] [CrossRef]
  21. Ghoneum, M.; Abedi, S. Enhancement of natural killer cell activity of aged mice by modified arabinoxylan rice bran (MGN-3/Biobran). J. Pharm. Pharmacol. 2004, 56, 1581–1588. [Google Scholar] [CrossRef]
  22. Cholujova, D.; Jakubikova, J.; Sedlak, J. BioBran-augmented maturation of human monocyte-derived dendritic cells. Neoplasma 2009, 56, 89–95. [Google Scholar] [CrossRef] [PubMed]
  23. Park, M.J.; Ryu, H.S.; Kim, J.S.; Lee, H.K.; Kang, J.S.; Yun, J.; Kim, S.Y.; Lee, M.K.; Hong, J.T.; Kim, Y.; et al. Platycodon grandiflorum polysaccharide induces dendritic cell maturation via TLR4 signaling. Food Chem. Toxicol. 2014, 72, 212–220. [Google Scholar] [CrossRef] [PubMed]
  24. Gupta, P.K.; Rajan, M.G.R.; Kulkarni, S. Activation of murine macrophages by G1-4A, a polysaccharide from Tinospora cordifolia, in TLR4/MyD88 dependent manner. Int. Immunopharmacol. 2017, 50, 168–177. [Google Scholar] [CrossRef] [PubMed]
  25. Wu, D.; Wan, J.; Li, W.; Li, J.; Guo, W.; Zheng, X.; Gan, R.Y.; Hu, Y.; Zou, L. Comparison of Soluble Dietary Fibers Extracted from Ten Traditional Legumes: Physicochemical Properties and Biological Functions. Foods 2023, 12, 2352. [Google Scholar] [CrossRef]
  26. Feng, Z.; Dou, W.; Alaxi, S.; Niu, Y.; Yu, L. Modified soluble dietary fiber from black bean coats with its rheological and bile acid binding properties. Food Hydrocoll. 2017, 62, 94–101. [Google Scholar] [CrossRef]
  27. Magallanes Lopez, A.M.; Campanella, O.H.; Simsek, S. Effects of cooking and market classes on nutritional and anti-oxidant properties of dry bean flours and soluble dietary fiber-rich fractions. Bioact. Carbohydr. Diet. Fibre 2024, 32, 100454. [Google Scholar] [CrossRef]
  28. Taciak, B.; Bialasek, M.; Braniewska, A.; Sas, Z.; Sawicka, P.; Kiraga, L.; Rygiel, T.; Krol, M. Evaluation of phenotypic and functional stability of RAW 264.7 cell line through serial passages. PLoS ONE 2018, 13, e0198943. [Google Scholar] [CrossRef]
  29. García-Lafuente, A.; Moro, C.; Manchón, N.; Gonzalo-Ruiz, A.; Villares, A.; Guillamón, E.; Rostagno, M.; Mateo-Vivaracho, L. In vitro anti-inflammatory activity of phenolic rich extracts from white and red common beans. Food Chem. 2014, 161, 216–223. [Google Scholar] [CrossRef]
  30. Oseguera-Toledo, M.E.; de Mejia, E.G.; Dia, V.P.; Amaya-Llano, S.L. Common bean (Phaseolus vulgaris L.) hydrolysates inhibit inflammation in LPS-induced macrophages through suppression of NF-kappaB pathways. Food Chem. 2011, 127, 1175–1185. [Google Scholar] [CrossRef]
  31. Tang, C.; Sun, J.; Zhou, B.; Jin, C.; Liu, J.; Gou, Y.; Chen, H.; Kan, J.; Qian, C.; Zhang, N. Immunomodulatory effects of polysaccharides from purple sweet potato on lipopolysaccharide treated RAW 264.7 macrophages. J. Food Biochem. 2018, 42, e12535. [Google Scholar] [CrossRef]
  32. Razali, F.N.; Ismail, A.; Abidin, N.Z.; Shuib, A.S. Stimulatory effects of polysaccharide fraction from Solanum nigrum on RAW 264.7 murine macrophage cells. PLoS ONE 2014, 9, e108988. [Google Scholar] [CrossRef] [PubMed]
  33. Schepetkin, I.A.; Quinn, M.T. Botanical polysaccharides: Macrophage immunomodulation and therapeutic potential. Int. Immunopharmacol. 2006, 6, 317–333. [Google Scholar] [CrossRef] [PubMed]
  34. Locati, M.; Curtale, G.; Mantovani, A. Diversity, Mechanisms, and Significance of Macrophage Plasticity. Annu. Rev. Pathol. Mech. Dis. 2020, 15, 123–147. [Google Scholar] [CrossRef]
  35. Piknova, B.; Park, J.W.; Cassel, K.S.; Gilliard, C.N.; Schechter, A.N. Measuring Nitrite and Nitrate, Metabolites in the Nitric Oxide Pathway, in Biological Materials using the Chemiluminescence Method. J. Vis. Exp. JoVE 2016, 118, 54879. [Google Scholar] [CrossRef]
  36. Rampersad, S.N. Multiple applications of Alamar Blue as an indicator of metabolic function and cellular health in cell viability bioassays. Sensors 2012, 12, 12347–12360. [Google Scholar] [CrossRef]
  37. Piehler, M.; Roeder, R.; Blessing, S.; Reich, J. Comparison of LAL and rFC Assays-Participation in a Proficiency Test Program between 2014 and 2019. Microorganisms 2020, 8, 418. [Google Scholar] [CrossRef]
  38. Corning. Endotoxins and Cell Culture. corning.com. 2022. Available online: https://www.corning.com/catalog/cls/documents/application-notes/TC-305.pdf (accessed on 15 January 2026).
  39. Tynan, G.A.; McNaughton, A.; Jarnicki, A.; Tsuji, T.; Lavelle, E.C. Polymyxin B Inadequately Quenches the Effects of Contaminating Lipopolysaccharide on Murine Dendritic Cells. PLoS ONE 2012, 7, e37261. [Google Scholar] [CrossRef]
  40. Ferreira, S.S.; Passos, C.P.; Madureira, P.; Vilanova, M.; Coimbra, M.A. Structure–function relationships of immunostimulatory polysaccharides: A review. Carbohydr. Polym. 2015, 132, 378–396. [Google Scholar] [CrossRef]
  41. Zhang, X.; Qi, C.; Guo, Y.; Zhou, W.; Zhang, Y. Toll-like receptor 4-related immunostimulatory polysaccharides: Primary structure, activity relationships, and possible interaction models. Carbohydr. Polym. 2016, 149, 186–206. [Google Scholar] [CrossRef]
  42. Matsunaga, N.; Tsuchimori, N.; Matsumoto, T.; Ii, M. TAK-242 (resatorvid), a small-molecule inhibitor of Toll-like receptor (TLR) 4 signaling, binds selectively to TLR4 and interferes with interactions between TLR4 and its adaptor molecules. Mol. Pharmacol. 2011, 79, 34–41. [Google Scholar] [CrossRef] [PubMed]
  43. Gupta, P.K.; Chakraborty, P.; Kumar, S.; Singh, P.K.; Rajan, M.G.R.; Sainis, K.B.; Kulkarni, S. G1-4A, a Polysaccharide from Tinospora cordifolia Inhibits the Survival of Mycobacterium tuberculosis by Modulating Host Immune Responses in TLR4 Dependent Manner. PLoS ONE 2016, 11, e0154725. [Google Scholar] [CrossRef] [PubMed]
  44. Ho, G.T.T.; Ahmed, A.; Zou, Y.-F.; Aslaksen, T.; Wangensteen, H.; Barsett, H. Structure–activity relationship of immunomodulating pectins from elderberries. Carbohydr. Polym. 2015, 125, 314–322. [Google Scholar] [CrossRef] [PubMed]
  45. Luo, Y.; Zheng, S.G. Hall of fame among pro-inflammatory cytokines: Interleukin-6 gene and its transcriptional regulation mechanisms. Front. Immunol. 2016, 7, 604. [Google Scholar] [CrossRef]
  46. Sirenko, O.; Bocker, U.; Morris, J.S.; Haskill, J.S.; Watson, J.M. IL-1 beta transcript stability in monocytes is linked to cytoskeletal reorganization and the availability of mRNA degradation factors. Immunol. Cell Biol. 2002, 80, 328–339. [Google Scholar] [CrossRef]
  47. Pandey, A.; Shen, C.; Feng, S.; Man, S.M. Cell biology of inflammasome activation. Trends Cell Biol. 2021, 31, 924–939. [Google Scholar] [CrossRef]
  48. Verboogen, D.R.J.; Revelo, N.H.; Ter Beest, M.; van den Bogaart, G. Interleukin-6 secretion is limited by self-signaling in endosomes. J. Mol. Cell Biol. 2019, 11, 144–157. [Google Scholar] [CrossRef]
  49. Schroder, K.; Tschopp, J. The inflammasomes. Cell 2010, 140, 821–832. [Google Scholar] [CrossRef]
  50. Swanson, K.V.; Deng, M.; Ting, J.P. The NLRP3 inflammasome: Molecular activation and regulation to therapeutics. Nat. Rev. Immunol. 2019, 19, 477–489. [Google Scholar] [CrossRef]
  51. Ainscough, J.S.; Frank Gerberick, G.; Zahedi-Nejad, M.; Lopez-Castejon, G.; Brough, D.; Kimber, I.; Dearman, R.J. Dendritic cell IL-1alpha and IL-1beta are polyubiquitinated and degraded by the proteasome. J. Biol. Chem. 2014, 289, 35582–35592. [Google Scholar] [CrossRef]
  52. Duong, B.H.; Onizawa, M.; Oses-Prieto, J.A.; Advincula, R.; Burlingame, A.; Malynn, B.A.; Ma, A. A20 restricts ubiquitination of pro-interleukin-1beta protein complexes and suppresses NLRP3 inflammasome activity. Immunity 2015, 42, 55–67. [Google Scholar] [CrossRef] [PubMed]
  53. Fang, W.; Bi, D.; Zheng, R.; Cai, N.; Xu, H.; Zhou, R.; Lu, J.; Wan, M.; Xu, X. Identification and activation of TLR4-mediated signalling pathways by alginate-derived guluronate oligosaccharide in RAW264.7 macrophages. Sci. Rep. 2017, 7, 1663. [Google Scholar] [CrossRef] [PubMed]
  54. Han, S.B.; Yoon, Y.D.; Ahn, H.J.; Lee, H.S.; Lee, C.W.; Yoon, W.K.; Park, S.K.; Kim, H.M. Toll-like receptor-mediated activation of B cells and macrophages by polysaccharide isolated from cell culture of Acanthopanax senticosus. Int. Immunopharmacol. 2003, 3, 1301–1312. [Google Scholar] [CrossRef] [PubMed]
  55. Ando, I.; Tsukumo, Y.; Wakabayashi, T.; Akashi, S.; Miyake, K.; Kataoka, T.; Nagai, K. Safflower polysaccharides activate the transcription factor NF-κB via Toll-like receptor 4 and induce cytokine production by macrophages. Int. Immunopharmacol. 2002, 2, 1155–1162. [Google Scholar] [CrossRef]
  56. Ferwerda, G.; Meyer-Wentrup, F.; Kullberg, B.J.; Netea, M.G.; Adema, G.J. Dectin-1 synergizes with TLR2 and TLR4 for cytokine production in human primary monocytes and macrophages. Cell Microbiol. 2008, 10, 2058–2066. [Google Scholar] [CrossRef]
  57. López-Barrios, L.; Antunes-Ricardo, M.; Gutiérrez-Uribe, J.A. Changes in antioxidant and antiinflammatory activity of black bean (Phaseolus vulgaris L.) protein isolates due to germination and enzymatic digestion. Food Chem. 2016, 203, 417–424. [Google Scholar] [CrossRef]
  58. Kusumah, S.H.; Andoyo, R.; Rialita, T. Protein isolation techniques of beans using different methods: A review. IOP Conf. Ser. Earth Environ. Sci. 2020, 443, 012053. [Google Scholar] [CrossRef]
  59. Oomah, B.D.; Corbé, A.; Balasubramanian, P. Antioxidant and anti-Inflammatory activities of bean (Phaseolus vulgaris L.) hulls. J. Agric. Food Chem. 2010, 58, 8225–8230. [Google Scholar] [CrossRef]
  60. Boudjou, S.; Oomah, B.D.; Zaidi, F.; Hosseinian, F. Phenolics content and antioxidant and anti-inflammatory activities of legume fractions. Food Chem. 2013, 138, 1543–1550. [Google Scholar] [CrossRef]
Figure 1. (a) Comparison of the NO levels produced from macrophages stimulated with raw or cooked SDF, with or without pre-stimulation with LPS, and in the presence or absence of the TLR-4 inhibitor Tak-242. Statistically significant differences in NO levels between different treatment groups are indicated by *: * p < 0.05; ** p < 0.01; *** p < 0.001. (b) Relative fold of changes in iNOS transcripts from unstimulated cells (Cells), cells stimulated with LPS (LPS), or cells stimulated with different raw (samples 101 to 112) or cooked (samples 113 to 124) SDF. For details on SDF nomenclature, see Appendix A Table A1. Statistically significant differences in mRNA levels between unstimulated cells and SDF-stimulated cells are indicated with *: * p < 0.05; ** p < 0.01; *** p < 0.001.
Foods 15 01471 g001
Figure 2. (a) Comparison of the TNF-α levels produced from cells stimulated with raw or cooked SDF, alone or in the presence of Tak-242, or after pre-stimulation with LPS. Statistically significant differences between treatment groups are indicated by *. (b) Relative fold of changes in TNF-α transcripts from unstimulated cells (Cells) or cells stimulated with LPS (LPS) or the different cooked (samples 101 to 112) or raw (samples 113 to 124) SDF. For SDF nomenclature, see Appendix A Table A1. Statistically significant differences in transcript levels between unstimulated and SDF-stimulated cells are indicated with *: * p < 0.05; ** p < 0.01; *** p < 0.001.
Foods 15 01471 g002
Figure 3. (a) Comparison of the IL-6 levels produced from cells stimulated with raw or cooked SDF, alone or in the presence of Tak-242, or after pre-stimulation with LPS. Statistically significant differences between treatment groups are indicated by *. (b) Relative fold of changes in IL-6 transcripts from unstimulated cells (Cells) or cells stimulated with LPS (LPS) or the different cooked (samples 101 to 112) or raw (samples 113 to 124) SDF. For SDF nomenclature, see Appendix A Table A1. Statistically significant differences in transcript levels between unstimulated and SDF-stimulated cells are indicated with *: * p < 0.05; ** p < 0.01; *** p < 0.001.
Foods 15 01471 g003
Figure 4. (a) Comparison of the IL-1β levels produced from cells stimulated with raw or cooked SDF, alone or in the presence of Tak-242, or after pre-stimulation with LPS. Statistically significant differences between treatment groups are indicated by *. (b) Relative fold of changes in IL-1β transcripts from unstimulated cells (Cells) or cells stimulated with LPS (LPS) or the different cooked (samples 101 to 112) or raw (samples 113 to 124) SDF. For SDF nomenclature, see Appendix A Table A1. Statistically significant differences in transcript levels between unstimulated and SDF-stimulated cells are indicated with *: * p < 0.05; ** p < 0.01; *** p < 0.001.
Foods 15 01471 g004
Figure 5. Relative fold of changes in TLR-4 transcripts from unstimulated cells (Cells) or cells stimulated with LPS (LPS), or the different cooked (samples 101 to 112) or raw (samples 113 to 124) SDF. For SDF nomenclature, see Appendix A Table A1. Statistically significant differences in transcript levels between unstimulated and SDF-stimulated cells are indicated with *: * p < 0.05; ** p < 0.01; *** p < 0.001.
Foods 15 01471 g005
Table 1. Primer sequences used in the study.
GenePrimer DirectionSequence 5′-3′
β actinForwardCATGTACGTTGCTATCCAGGC
β actinReverseCTCCTTAATGTCACGCACGAT
TNF-αForwardGACGTGGAACTGGCAGAAGAG
TNF-αReverseTTGGTGGTTTGTGAGTGTGAG
IL-1βForwardGAAATGCCACCTTTTGACAGTG
IL-1βReverseTGGATGCTCTCATCAGGACAG
IL-6ForwardCCAAGAGGTGAGTGCTTCCC
IL-6ReverseCTGTTGTTCAGACTCTCTCCCT
iNOSForwardGTTCTCAGCCCAACAATACAAGA
iNOSReverseGTGGACGGGTCGATGTCAC
TLR-4ForwardATATTGACAGGAAACCCCATCCA
TLR-4ReverseTAGAACCCGCAAGTCTGTGC
Disclaimer/Publisher’s Note: The statements, opinions and data contained in all publications are solely those of the individual author(s) and contributor(s) and not of MDPI and/or the editor(s). MDPI and/or the editor(s) disclaim responsibility for any injury to people or property resulting from any ideas, methods, instructions or products referred to in the content.