A Systematic Review of Imaging Techniques for the Botanical and Geographical Classification of Coffee
 , , , , ,
  and
and 
Abstract
1. Introduction
2. Systematic Methodology
2.1. Information Sources and Selection Criteria
2.2. Risk of Bias Assessment
2.3. Focus Questions
- Q1.
- What has been achieved with the use of digital images in the authentication and discrimination of species, varieties, and geographical indications in coffee?
- Q2.
- What extracted features contributed more to the authentication and discrimination of species, varieties, and geographical indications in coffee?
- Q3.
- What chemometric approaches are used to authenticate coffee from digital image data?
- Q4.
- What has been achieved with the use of hyperspectral and multispectral images in the authentication and discrimination of species, varieties, and geographical indications in coffee?
- Q5.
- How has the spatial information of hyperspectral and multispectral data been applied to the authentication and discrimination of species, varieties, and geographical indications in coffee?
- Q6.
- What are the chemometric approaches used to authenticate and discriminate coffee from the hyper/multispectral data?
3. Results
3.1. Search Results and Frequency of Research Publications
3.2. Digital Imaging in Species, Variety, or Geographic Indication Authentication
3.2.1. Sample Characteristics for Coffee Authentication Using Digital Imaging
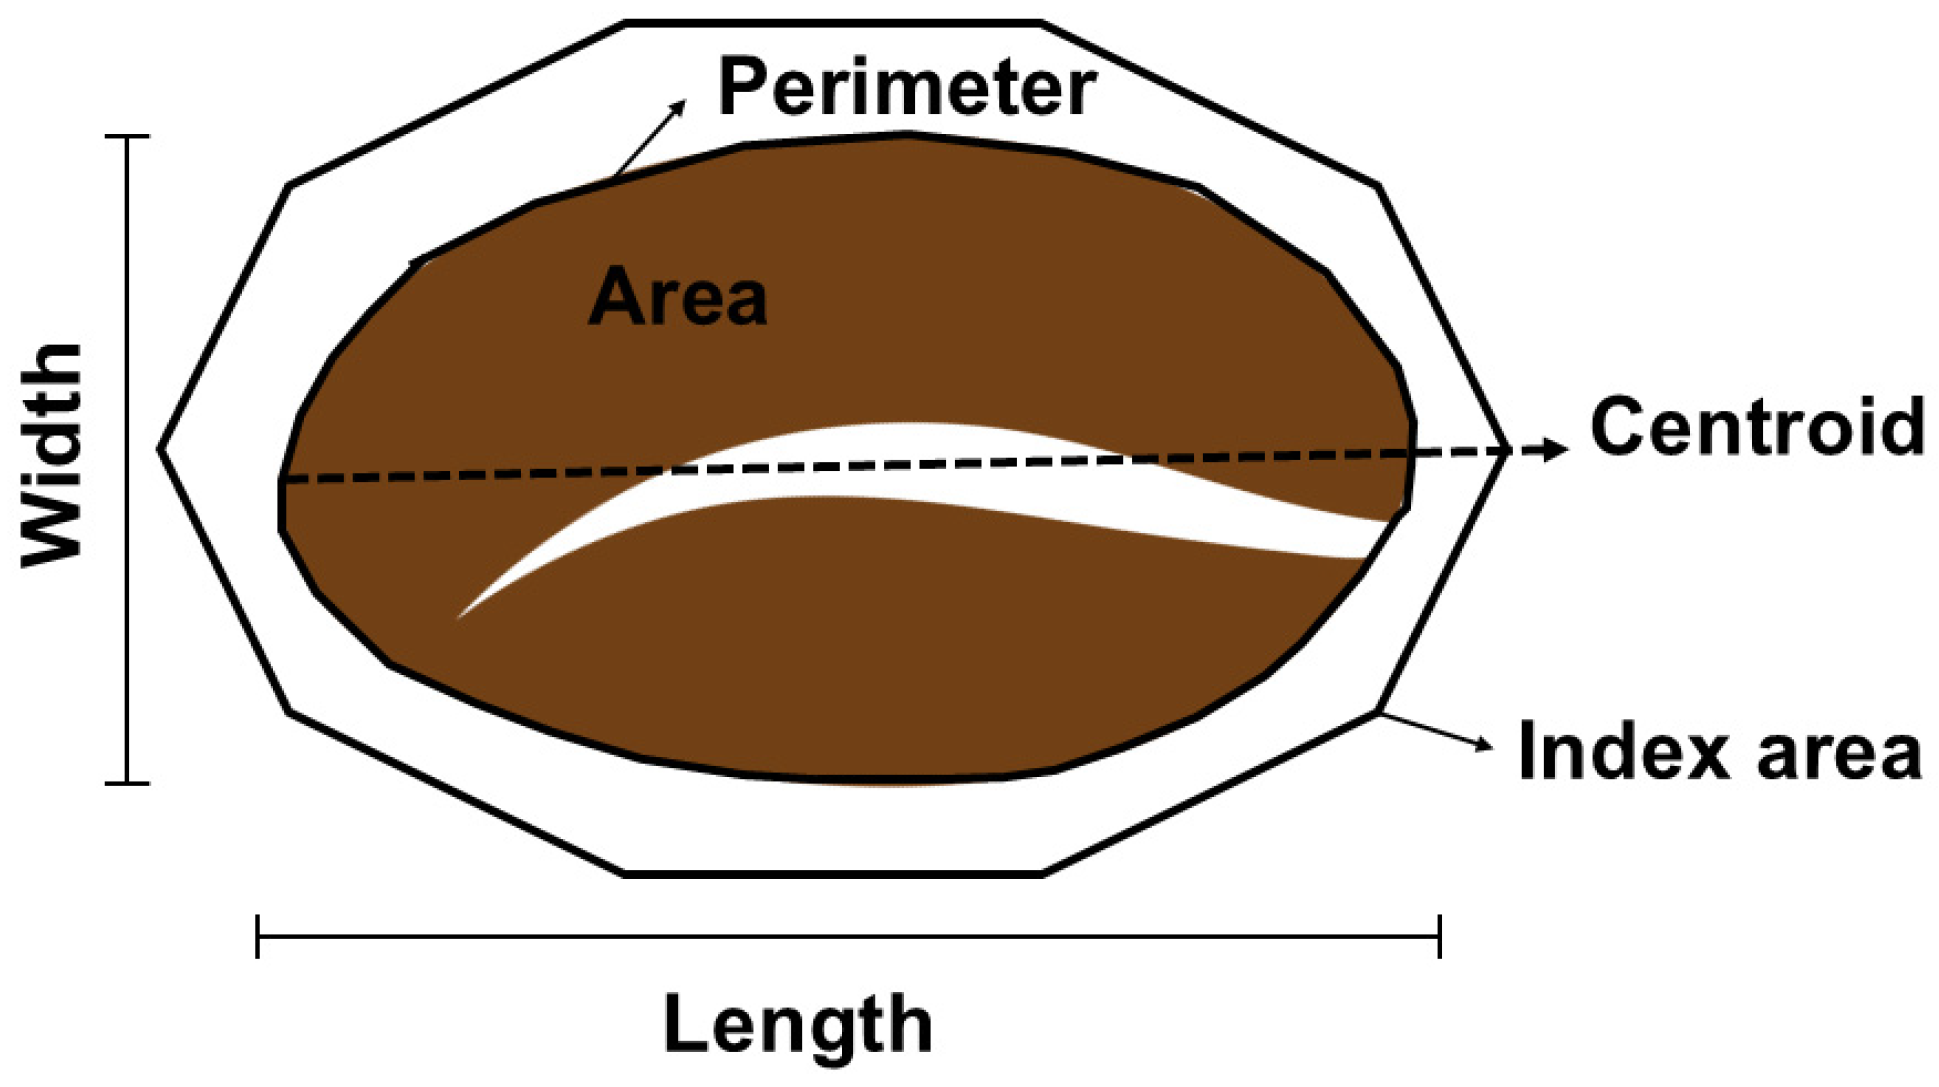
3.2.2. Color and Shape Features Extraction
3.2.3. Classification Approaches and Metrics for Evaluating and Validation
Sampling of the Reviewed Studies
Model Performances
3.3. Multispectral and Hyperspectral Imaging in Authentication of Species, Variety or Geographic Indication
3.3.1. Sample Characteristics for Coffee Authentication Using HSI and MSI

| Species | Variety | Bean Condition | Physical Form | Geographical Origin | Ref. |
|---|---|---|---|---|---|
| C. arabica, C. canephora (Robusta) | Not specified | Green | Whole | 8 different regions (not specified) | [101] |
| C. arabica, C. canephora (Robusta) | Not specified | Green | Whole | Various (not specified) | [102] |
| C. arabica, C. canephora (Robusta) | Not specified | Green | Whole | Various (not specified) | [103] |
| C. arabica, C. canephora (Robusta) | Not specified | Green, Roasted | Whole | Brazil, Colombia, Costa Rica, Ethiopia, India, Mexico, Honduras, Kenya, Nicaragua, Uganda, Rwanda, Vietnam | [104] |
| C. arabica, C. canephora (Robusta) | Not specified | Roasted | Whole | India, Brazil, Peru, Colombia, Mexico, Thailand, Ethiopia, Uganda, Kenya, Vietnam, Indonesia | [105] |
| C. arabica | Not specified | Green | Whole | Alta Mogiana (Minas Gerais, Brazil), Alta Mogiana (São Paulo, Brazil) | [106] |
| C. arabica | Not specified | Green | Whole | Gedio (Ethiopia), Guji (Ethiopia), Maywal (Kenya), Huehuetenango (Guatemala), Kiajibbi (Kenya), Yara (Kenya), West Valley (Costa Rica), Tarrazú (Costa Rica), Santa Maria de Dota (Costa Rica), El Progreso (Honduras), Guatemala (Guatemala), Oaxaca (Mexico), Puebla (Mexico), Estado de Mexico (Mexico), Estelí (Nicaragua), Matagalpa (Nicaragua), Nueva Segovia (Nicaragua), Antioquia (Colombia), Huila (Colombia), Nariño (Colombia), Cusco (Peru), Pasco (Peru). | [107] |
| C. arabica, C. canephora (Robusta) | Typica Arabica, Catimor Arabica, Fushan Robusta, Xinglong Robusta | Roasted | Whole | Yunnan and Hainan provinces (China) | [108] |
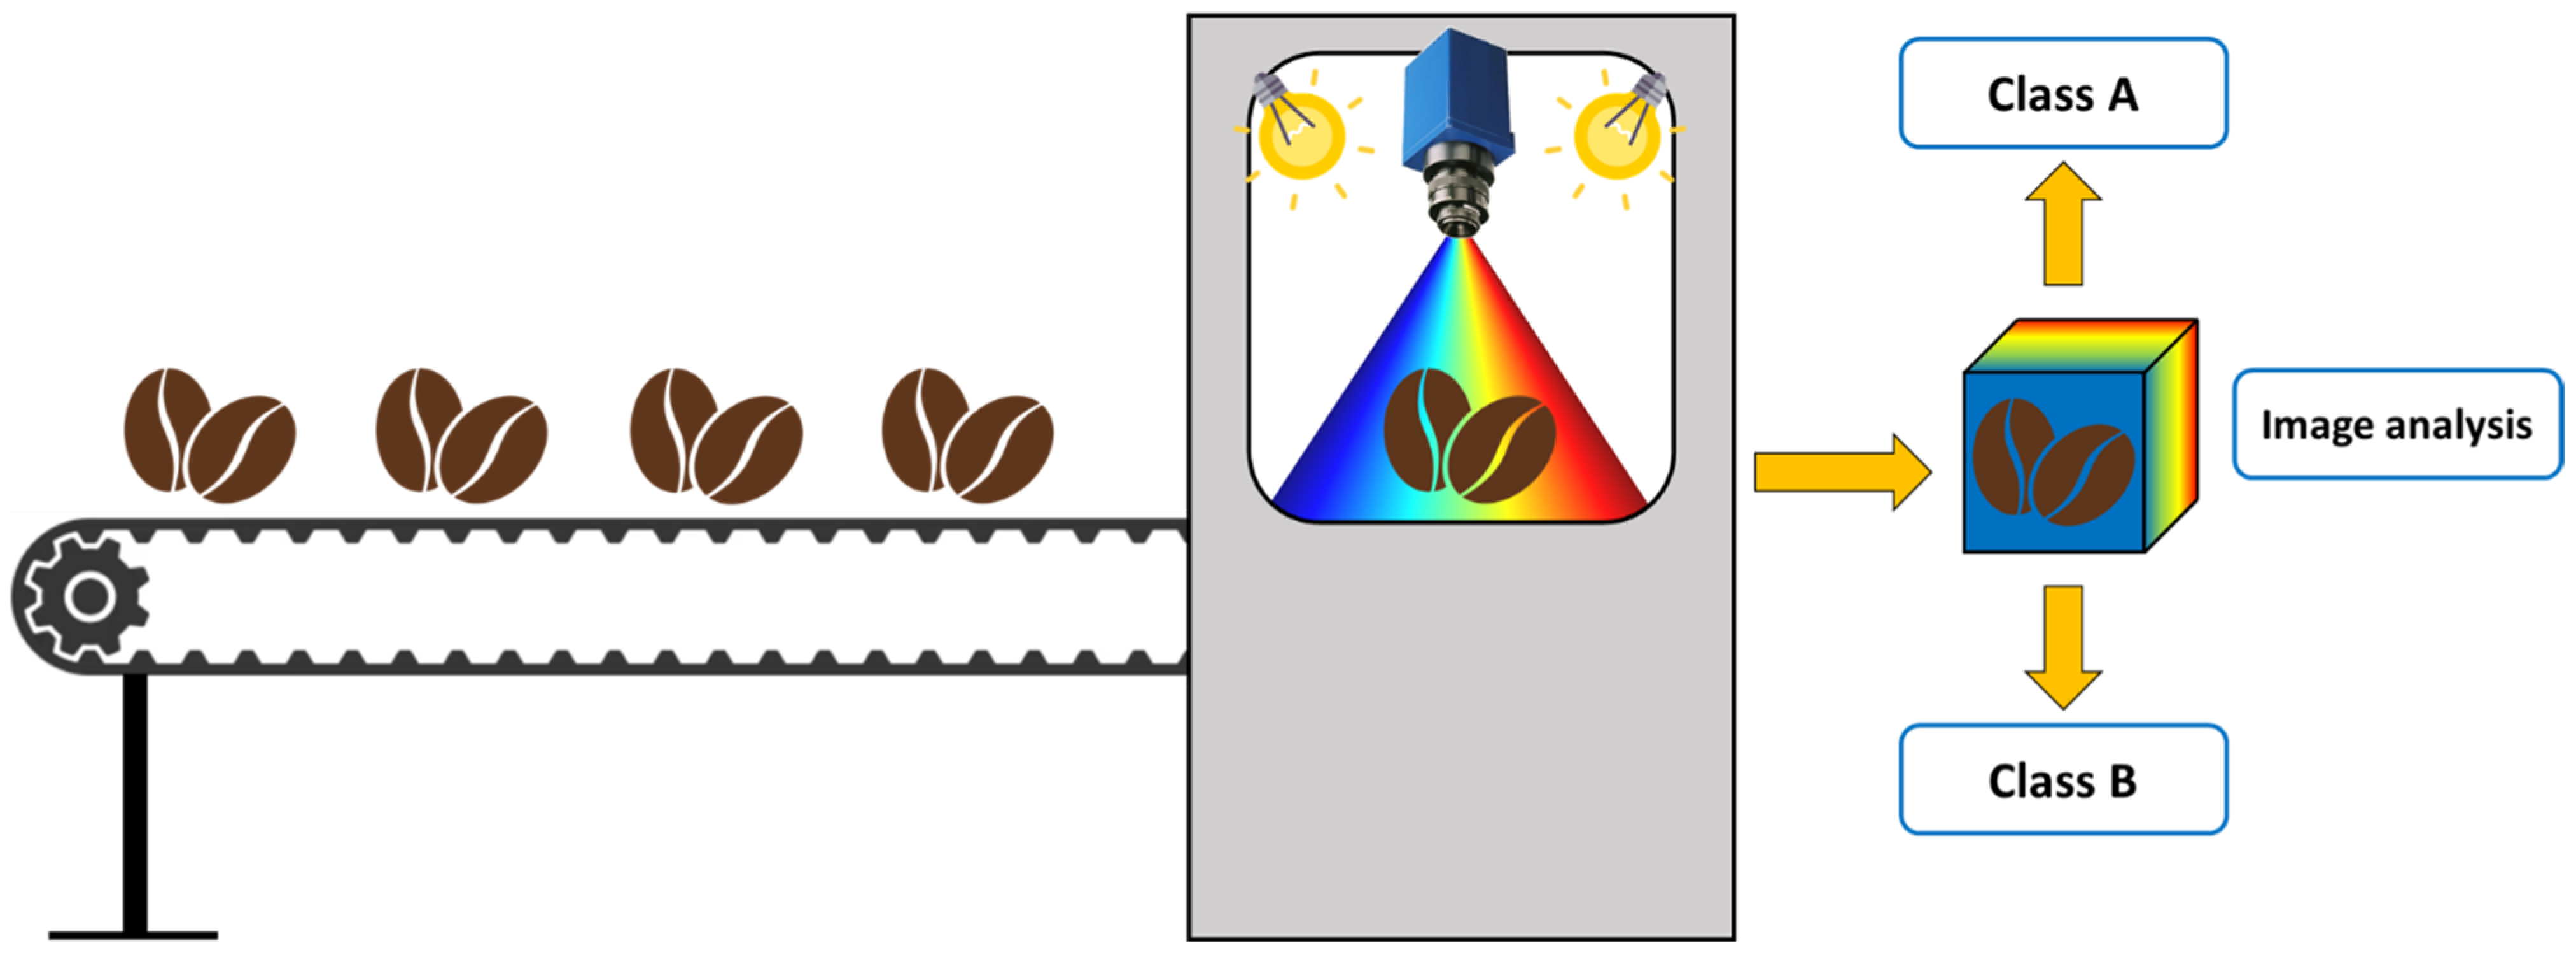
3.3.2. Spectral and Spatial Information
3.3.3. Classification Approaches and Metrics for Evaluating and Validation
| Number of Samples | Classification Task | Level of Image Analysis | Classification Algorithm | Model Optimization | External Validation | Model Performance | Ref. |
|---|---|---|---|---|---|---|---|
| 31 samples (14 Arabica, 17 Robusta). | Classification of green coffee beans based on species and processing method (not relevant to this review) | Image-level | PLS-DA | CV: contiguous blocks with 17 deletion groups. Model dimensionality optimized by minimizing RMSECV | Test set of 83 HSI (corresponding to 7 samples). Models applied to each HSI AS, SSH, and CSH, and data obtained by low-level and mid-level data fusion | NER in prediction of test set: CSH 100.0%; mid-level data fusion (block-scaling) 100.0% | [101] |
| 33 samples (15 Arabica, 18 Robusta). | Classification of green coffee beans based on species | Image-level and pixel-level |
|
|
|
| [102] |
| 33 samples (15 Arabica, 18 Robusta). | Classification of green coffee beans based on species | Image-level and pixel-level |
| CV by contiguous blocks with 4 deletion groups. Model dimensionality and number of non-zero variables for each sLV optimized by minimizing classification error in CV |
|
| [103] |
| 27 batches (20 Arabica, 7 Robusta). | Classification of green and roasted coffee beans based on species | Object-level (bean-level) |
| CV with 10 random groups. For SVM, gamma and C values were optimized by grid search | Not clearly described | QDA (% of correct classification):
| [104] |
| 35 samples (21 Arabica, 14 Robusta). | Classification of roasted coffee beans based on species | Image-level | OPLS-DA | CV with 7 groups | Test set of 58 MSI. Models applied to each MSI average spectral, morphological, and color features | 100% accuracy in the prediction of the test set | [105] |
| 16 samples (10 specialty, 6 traditional). | Classification of green coffee beans into specialty and traditional | Object-level (bean-level) | SVM; Random Forest; XGBoost; CatBoost | CV with 5 groups on 10% of the data (randomly split from the whole dataset) | Test set with 10% of the data (randomly split from the whole dataset). Models applied to reflectance and autofluorescence data of the test set | Accuracy in prediction of test set: SVM: 96% | [106] |
| 24 samples (across 3 continents, 8 countries, 22 regions). | Classification of green coffee beans based on geographical origin at the continental, country, and regional levels | Object-level (each object represents half of the super-pixels of each image) |
| CV with 10 groups and 10 repeats. For PLS-DA, model dimensionality is optimized using RMSEC and RMSECV. For SVM, gamma and C values were optimized using the highest performance in CV. For RF, maximum depth of each tree, number of trees and number of predictor features per node/split tuned through out-of-bag error rates | Test set with 20% of data. Models applied to the test set spectra (each corresponding to the average of the mean spectra of 25 super-pixels) | Best accuracy values in prediction of test set:
| [107] |
| 1200 beans (300 per variety) | Classification of roasted coffee beans based on variety | Object-level (bean-level) and pixel-level | SVM | CV performed (not described) | Test set of 8 HSI (corresponding to 2 for each variety).
|
| [108] |
4. Conclusions
Supplementary Materials
Author Contributions
Funding
Institutional Review Board Statement
Informed Consent Statement
Data Availability Statement
Conflicts of Interest
References
- Coffee|USDA Foreign Agricultural Service. Available online: https://www.fas.usda.gov/data/production/commodity/0711100 (accessed on 27 March 2025).
- Mutz, Y.S.; do Rosario, D.; Silva, L.R.G.; Galvan, D.; Stefano, J.S.; Janegitz, B.C.; Weitz, D.A.; Bernardes, P.C.; Conte-Junior, C.A. Lab-Made 3D Printed Electrochemical Sensors Coupled with Chemometrics for Brazilian Coffee Authentication. Food Chem. 2023, 403, 134411. [Google Scholar] [CrossRef] [Scilit]
- Janne Carvalho Ferreira, L.; de Souza Gomes, M.; Maciel de Oliveira, L.; Diniz Santos, L. Coffee Fermentation Process: A Review. Food Res. Int. 2023, 169, 112793. [Google Scholar] [CrossRef] [Scilit] [PubMed]
- Crescenzi, R.; De Filippis, F.; Giua, M.; Vaquero-Piñeiro, C. Geographical Indications and Local Development: The Strength of Territorial Embeddedness. Reg. Stud. 2022, 56, 381–393. [Google Scholar] [CrossRef] [Scilit]
- Tessaro, L.; da Silva Mutz, Y.; de Oliveira Souza, N.; de Bem, M.M.; de Carvalho Alves, A.P.; Silva, C.A.; Nunes, C.A. Bioactive Compounds as Biomarkers for Authenticating Coffees with Protected Designation of Origin from Southeastern Brazil. Food Chem. 2025, 496, 146852. [Google Scholar] [CrossRef] [Scilit]
- Cheng, B.; Furtado, A.; Smyth, H.E.; Henry, R.J. Influence of Genotype and Environment on Coffee Quality. Trends Food Sci. Technol. 2016, 57, 20–30. [Google Scholar] [CrossRef] [Scilit]
- Waliyansyah, R.R.; Hasbullah, U.H.A. Comparison of Tree Method, Support Vector Machine, Naive Bayes, and Logistic Regression on Coffee Bean Image. Emit. Int. J. Eng. Technol. 2021, 9, 126–136. [Google Scholar] [CrossRef] [Scilit]
- Diaz-De-Cerio, E.; Guerra-Hernandez, E.; Garcia-Estepa, R.; Garcia-Villanova, B.; Verardo, V. Analytical Approaches in Coffee Quality Control. In Caffeinated and Cocoa Based Beverages: Volume 8. The Science of Beverages; Woodhead Publishing: Cambridge, UK, 2019; pp. 285–336. [Google Scholar] [CrossRef] [Scilit]
- Feng, Y.Z.; Sun, D.W. Application of Hyperspectral Imaging in Food Safety Inspection and Control: A Review. Crit. Rev. Food Sci. Nutr. 2012, 52, 1039–1058. [Google Scholar] [CrossRef] [Scilit]
- Zheng, R.; Kamruzzaman, M. Applications of Hyperspectral Imaging in the Coffee Industry: Current Research and Future Outlook. Appl. Spectrosc. Rev. 2024, 59, 1061–1085. [Google Scholar] [CrossRef] [Scilit]
- Yako, M. Hyperspectral Imaging: History and Prospects. Opt. Rev. 2025, 32, 830–842. [Google Scholar] [CrossRef] [Scilit]
- Patron, E.C.P.; Zegarra, M.A.G.; Elias, J.D. A Historical Approach to Understanding Differentiation of RYB vs RGB. J. Vis. Art Des. 2024, 16, 81–108. [Google Scholar] [CrossRef] [Scilit]
- Caporaso, N.; Whitworth, M.B.; Fisk, I.D. Prediction of Coffee Aroma from Single Roasted Coffee Beans by Hyperspectral Imaging. Food Chem. 2022, 371, 131159. [Google Scholar] [CrossRef] [Scilit]
- Elmasry, G.; Mandour, N.; Al-Rejaie, S.; Belin, E.; Rousseau, D. Recent Applications of Multispectral Imaging in Seed Phenotyping and Quality Monitoring—An Overview. Sensors 2019, 19, 1090. [Google Scholar] [CrossRef] [Scilit] [PubMed]
- Septiarini, A.; Hamdani, H.; Sela, E.I.; Hidayat, N.; Afuan, L. Analysis of Shape Features by Applying Gain Ratio and Machine Learning for Coffee Bean Classification. Coffee Sci. 2024, 19, e192206. [Google Scholar] [CrossRef] [Scilit]
- Candeias, D.N.C.; Silva, K.M.; Bezerra, L.P.; Fernandes, D.D.d.S.; Diniz, P.H.G.D. Hierarchical Authentication of the Geographical Origin of Instant Coffee Using Digital Image-Based Fingerprints and Chemometrics. Food Chem. 2025, 483, 144278. [Google Scholar] [CrossRef] [Scilit]
- Baqueta, M.R.; Postigo, M.P.; Alves, E.A.; de Moraes Neto, V.F.; Valderrama, P.; Pallone, J.A.L.; Diniz, P.H.G.D. Authentication of Indigenous Brazilian Specialty Canephora Coffees Using Image Analysis. Food Res. Int. 2024, 196, 115133. [Google Scholar] [CrossRef] [Scilit] [PubMed]
- Gredilla, A.; Fdez-Ortiz de Vallejuelo, S.; Elejoste, N.; de Diego, A.; Madariaga, J.M. Non-Destructive Spectroscopy Combined with Chemometrics as a Tool for Green Chemical Analysis of Environmental Samples: A Review. TrAC Trends Anal. Chem. 2016, 76, 30–39. [Google Scholar] [CrossRef] [Scilit]
- Ballesteros-Vivas, D.; Socas-Rodríguez, B.; Mendiola, J.A.; Ibáñez, E.; Cifuentes, A. Green Food Analysis: Current Trends and Perspectives. Curr. Opin. Green Sustain. Chem. 2021, 31, 100522. [Google Scholar] [CrossRef] [Scilit]
- Page, M.J.; McKenzie, J.E.; Bossuyt, P.M.; Boutron, I.; Hoffmann, T.C.; Mulrow, C.D.; Shamseer, L.; Tetzlaff, J.M.; Akl, E.A.; Brennan, S.E.; et al. The PRISMA 2020 Statement: An Updated Guideline for Reporting Systematic Reviews. Int. J. Surg. 2021, 88, 105906. [Google Scholar] [CrossRef]
- Bhargava, A.; Bansal, A. Fruits and Vegetables Quality Evaluation Using Computer Vision: A Review. J. King Saud Univ.—Comput. Inf. Sci. 2021, 33, 243–257. [Google Scholar] [CrossRef] [Scilit]
- de Araújo Gomes, A.; Diniz, P.H.G.D.; de Sousa Fernandes, D.D.; Ríos-Reina, R.; Azcarate, S.M.; Špánik, I. Digital Image-Based Chemometrics for Food Analysis: A Practical Tutorial and Roadmap. Food Chem. 2025, 486, 144531. [Google Scholar] [CrossRef] [Scilit]
- Patel, K.K.; Kar, A.; Jha, S.N.; Khan, M.A. Machine Vision System: A Tool for Quality Inspection of Food and Agricultural Products. J. Food Sci. Technol. 2011, 49, 123–141. [Google Scholar] [CrossRef] [Scilit] [PubMed]
- Brosnan, T.; Sun, D.W. Improving Quality Inspection of Food Products by Computer Vision—A Review. J. Food Eng. 2004, 61, 3–16. [Google Scholar] [CrossRef] [Scilit]
- Liu, X.; Li, N.; Huang, Y.; Lin, X.; Ren, Z. A Comprehensive Review on Acquisition of Phenotypic Information of Prunoideae Fruits: Image Technology. Front. Plant Sci. 2023, 13, 1084847. [Google Scholar] [CrossRef] [Scilit]
- Kirsch, R.A. SEAC and the Start of Image Processing at the National Bureau of Standards. IEEE Ann. Hist. Comput. 1998, 20, 7–13. [Google Scholar] [CrossRef] [Scilit]
- Ageh, O.M.; Hashim, N.; Shamsudin, R.; Che Man, H.; Mohd Ali, M.; Onwude, D.I.; Dasore, A. Optical Imaging for Food Grain Quality Evaluation—Recent Advances and Future Perspectives. Int. J. Agric. Sustain. 2025, 23, 2569166. [Google Scholar] [CrossRef] [Scilit]
- Izza, M.N.; Kusuma, G.P. Image Classification of Green Arabica Coffee Using Transformer-Based Architecture. Int. J. Eng. Trends Technol. 2024, 72, 304–314. [Google Scholar] [CrossRef] [Scilit]
- Olika, L.D.; Amberber, D.D. Classical Image Based Classification of Coffee Beans on Their Botanical Origins in Tongo and Wambara, Benishangul Gumuz, Ethiopia. Sci. J. Circuits Syst. Signal Process. 2020, 9, 42–48. [Google Scholar] [CrossRef] [Scilit]
- Ren, Z.; Zeng, J.; Yang, Z.; Tang, H.; Wang, J.; Jiang, L.; Feng, W. Digital Image Analysis for Contact and Shape Recognition of Coffee Particles in Grinding. Powder Technol. 2024, 440, 119717. [Google Scholar] [CrossRef] [Scilit]
- Przybył, K.; Gawrysiak-Witulska, M.; Bielska, P.; Rusinek, R.; Gancarz, M.; Dobrzański, B.; Siger, A. Application of Machine Learning to Assess the Quality of Food Products—Case Study: Coffee Bean. Appl. Sci. 2023, 13, 10786. [Google Scholar] [CrossRef] [Scilit]
- Gonçalves Dias Diniz, P.H. Chemometrics-Assisted Color Histogram-Based Analytical Systems. J. Chemom. 2020, 34, e3242. [Google Scholar] [CrossRef] [Scilit]
- Alhasson, H.F.; Alharbi, S.S. Classification of Saudi Coffee Beans Using a Mobile Application Leveraging Squeeze Vision Transformer Technology. Neural Comput. Appl. 2025, 37, 8629–8649. [Google Scholar] [CrossRef] [Scilit]
- Cuaya-Simbro, G.; Hernandez-Vera, I.; Ruiz, E.; Gutierrez-Fragoso, K. Automatic Tariff Classification System Using Deep Learning. Int. J. Adv. Comput. Sci. Appl. 2022, 13, 904–911. [Google Scholar] [CrossRef] [Scilit]
- Molla, Y.K.; Mitiku, E.A. CNN-HOG Based Hybrid Feature Mining for Classification of Coffee Bean Varieties Using Image Processing. Multimed. Tools Appl. 2025, 84, 749–764. [Google Scholar] [CrossRef] [Scilit]
- Widyaningtyas, S.; Arwani, M.; Sucipto; Hendrawan, Y. Improving the Accuracy of Green Bean Palm Civet Coffee Purity Classification Using Wrapper Feature Selection. Coffee Sci. 2025, 20, e202277. [Google Scholar] [CrossRef] [Scilit]
- Alves, R.C.; Casal, S.; Alves, M.R.; Oliveira, M.B. Discrimination between Arabica and Robusta Coffee Species on the Basis of Their Tocopherol Profiles. Food Chem. 2009, 114, 295–299. [Google Scholar] [CrossRef] [Scilit]
- Anderson, K.A.; Smith, B.W. Chemical Profiling to Differentiate Geographic Growing Origins of Coffee. J. Agric. Food Chem. 2002, 50, 2068–2075. [Google Scholar] [CrossRef] [Scilit]
- Mendonça, J.C.F.; Franca, A.S.; Oliveira, L.S. Physical Characterization of Non-Defective and Defective Arabica and Robusta Coffees before and after Roasting. J. Food Eng. 2009, 92, 474–479. [Google Scholar] [CrossRef] [Scilit]
- Vignoli, J.A.; Viegas, M.C.; Bassoli, D.G.; Benassi, M.d.T. Roasting Process Affects Differently the Bioactive Compounds and the Antioxidant Activity of Arabica and Robusta Coffees. Food Res. Int. 2014, 61, 279–285. [Google Scholar] [CrossRef] [Scilit]
- Souto, U.T.d.C.P.; Barbosa, M.F.; Dantas, H.V.; de Pontes, A.S.; Lyra, W.d.S.; Diniz, P.H.G.D.; de Araújo, M.C.U.; da Silva, E.C. Screening for Coffee Adulteration Using Digital Images and SPA-LDA. Food Anal. Methods 2014, 8, 1515–1521. [Google Scholar] [CrossRef] [Scilit]
- Williams, S.D.; Barkla, B.J.; Rose, T.J.; Liu, L. Does Coffee Have Terroir and How Should It Be Assessed? Foods 2022, 11, 1907. [Google Scholar] [CrossRef] [Scilit]
- Darmajana, D.A.; Hidayat, D.D.; Indriati, A.; Sagita, D.; Rahayuningtyas, A.; Sudaryanto, A. Comparative Study of Changes in Physical, Mechanical, and Colour Properties Between Arabica and Robusta Coffee Beans Prior to and After Roasting. AIP Conf. Proc. 2022, 2493, 040008. [Google Scholar] [CrossRef] [Scilit]
- Ligar, B.W. Computer Vision for Identifying and Classifying Green Coffee Beans: A Review. J. CoreIT J. Has. Penelit. Ilmu Komput. Teknol. Inf. 2022, 8, 11–18. [Google Scholar] [CrossRef] [Scilit]
- Kucheryavskiy, S. A New Approach for Discrimination of Objects on Hyperspectral Images. Chemom. Intell. Lab. Syst. 2013, 120, 126–135. [Google Scholar] [CrossRef] [Scilit]
- Hallur, S.; Gavade, A. Image Feature Extraction Techniques: A Comprehensive Review. Frankl. Open 2025, 12, 100366. [Google Scholar] [CrossRef] [Scilit]
- Zeiler, M.D.; Fergus, R. Visualizing and Understanding Convolutional Networks. In Computer Vision—ECCV 2014; Fleet, D., Pajdla, T., Schiele, B., Tuytelaars, T., Eds.; Springer: Cham, Switzerland, 2014; Volume 8689, pp. 818–833. [Google Scholar] [CrossRef] [Scilit]
- Zhao, X.; Wang, L.; Zhang, Y.; Han, X.; Deveci, M.; Parmar, M. A Review of Convolutional Neural Networks in Computer Vision. Artif. Intell. Rev. 2024, 57, 99. [Google Scholar] [CrossRef] [Scilit]
- Klikarová, J.; Česlová, L. Targeted and Non-Targeted HPLC Analysis of Coffee-Based Products as Effective Tools for Evaluating the Coffee Authenticity. Molecules 2022, 27, 7419. [Google Scholar] [CrossRef] [Scilit]
- Wang, X.; Lim, L.T.; Fu, Y. Review of Analytical Methods to Detect Adulteration in Coffee. J. AOAC Int. 2020, 103, 295–305. [Google Scholar] [CrossRef] [Scilit]
- Barbin, D.F.; Felicio, A.L.d.S.M.; Sun, D.W.; Nixdorf, S.L.; Hirooka, E.Y. Application of Infrared Spectral Techniques on Quality and Compositional Attributes of Coffee: An Overview. Food Res. Int. 2014, 61, 23–32. [Google Scholar] [CrossRef] [Scilit]
- Cocchi, M.; Biancolillo, A.; Marini, F. Chemometric Methods for Classification and Feature Selection. Compr. Anal. Chem. 2018, 82, 265–299. [Google Scholar] [CrossRef] [Scilit]
- Esbensen, K.H.; Geladi, P. Principles of Proper Validation: Use and Abuse of Re-Sampling for Validation. J. Chemom. 2010, 24, 168–187. [Google Scholar] [CrossRef] [Scilit]
- Rodionova, O.Y.; Oliveri, P.; Malegori, C.; Pomerantsev, A.L. Chemometrics as an Efficient Tool for Food Authentication: Golden Pillars for Building Reliable Models. Trends Food Sci. Technol. 2024, 147, 104429. [Google Scholar] [CrossRef] [Scilit]
- Nunes, C.A.; Alvarenga, V.O.; de Souza Sant’Ana, A.; Santos, J.S.; Granato, D. The Use of Statistical Software in Food Science and Technology: Advantages, Limitations and Misuses. Food Res. Int. 2015, 75, 270–280. [Google Scholar] [CrossRef] [Scilit]
- Shorten, C.; Khoshgoftaar, T.M. A Survey on Image Data Augmentation for Deep Learning. J. Big Data 2019, 6, 60. [Google Scholar] [CrossRef] [Scilit]
- Khalifa, N.E.; Loey, M.; Mirjalili, S. A Comprehensive Survey of Recent Trends in Deep Learning for Digital Images Augmentation. Artif. Intell. Rev. 2021, 55, 2351–2377. [Google Scholar] [CrossRef] [Scilit]
- Han, S.; Wang, H. Application of Deep Learning Technology in Monitoring Plant Attribute Changes. Sustainability 2025, 17, 7602. [Google Scholar] [CrossRef] [Scilit]
- Ubbens, J.; Cieslak, M.; Prusinkiewicz, P.; Stavness, I. The Use of Plant Models in Deep Learning: An Application to Leaf Counting in Rosette Plants. Plant Methods 2018, 14, 6. [Google Scholar] [CrossRef] [Scilit]
- Fernando, D.; Madja, A.R.A.; Hastuti, A.A.M.B.; Santosa, D.; Rohman, A. Trending Analytical Methods in Assessing Coffee Authentication: An Overview of Reviews and Bibliometric Analysis. J. Food Meas. Charact. 2025, 19, 9319–9353. [Google Scholar] [CrossRef] [Scilit]
- Perez, M.; Domínguez-López, I.; López-Yerena, A.; Vallverdú Queralt, A. Current Strategies to Guarantee the Authenticity of Coffee. Crit. Rev. Food Sci. Nutr. 2023, 63, 539–554. [Google Scholar] [CrossRef] [Scilit]
- de Carvalho Couto, C.; Corrêa de Souza Coelho, C.; Moraes Oliveira, E.M.; Casal, S.; Freitas-Silva, O. Adulteration in Roasted Coffee: A Comprehensive Systematic Review of Analytical Detection Approaches. Int. J. Food Prop. 2023, 26, 231–258. [Google Scholar] [CrossRef] [Scilit]
- Rodionova, O.Y.; Titova, A.V.; Pomerantsev, A.L. Discriminant Analysis Is an Inappropriate Method of Authentication. TrAC Trends Anal. Chem. 2016, 78, 17–22. [Google Scholar] [CrossRef] [Scilit]
- Oliveri, P.; Downey, G. Multivariate Class Modeling for the Verification of Food-Authenticity Claims. TrAC Trends Anal. Chem. 2012, 35, 74–86. [Google Scholar] [CrossRef] [Scilit]
- Bevilacqua, M.; Bucci, R.; Magrì, A.D.; Magrì, A.L.; Nescatelli, R.; Marini, F. Classification and Class-Modelling. Data Handl. Sci. Technol. 2013, 28, 171–233. [Google Scholar] [CrossRef] [Scilit]
- Simoncelli, E.P.; Olshausen, B.A. Natural Image Statistics and Neural Representation. Annu. Rev. Neurosci. 2001, 24, 1193–1216. [Google Scholar] [CrossRef] [Scilit]
- Simonyan, K.; Zisserman, A. Very Deep Convolutional Networks for Large-Scale Image Recognition. In Proceedings of the 3rd International Conference on Learning Representations, ICLR 2015—Conference Track Proceedings, San Diego, CA, USA, 7–9 May 2015. [Google Scholar]
- He, K.; Zhang, X.; Ren, S.; Sun, J. Deep Residual Learning for Image Recognition. In Proceedings of the IEEE Conference on Computer Vision and Pattern Recognition (CVPR) 2016, Las Vegas, NV, USA, 27–30 June 2016; pp. 770–778. [Google Scholar]
- Lecun, Y.; Bengio, Y.; Hinton, G. Deep Learning. Nature 2015, 521, 436–444. [Google Scholar] [CrossRef] [Scilit]
- Amigo, J.M. Hyperspectral and Multispectral Imaging: Setting the Scene. Data Handl. Sci. Technol. 2019, 32, 3–16. [Google Scholar] [CrossRef] [Scilit]
- Qin, J.; Chao, K.; Kim, M.S.; Lu, R.; Burks, T.F. Hyperspectral and Multispectral Imaging for Evaluating Food Safety and Quality. J. Food Eng. 2013, 118, 157–171. [Google Scholar] [CrossRef] [Scilit]
- Goetz, A.F.H.; Rowan, L.C.; Kingston, M.J. Mineral Identification from Orbit: Initial Results from the Shuttle Multispectral Infrared Radiometer. Science 1982, 218, 1020–1024. [Google Scholar] [CrossRef] [Scilit]
- Vane, G.; Goetz, A.F.H.; Wellman, J.B. Airborne Imaging Spectrometer: A New Tool for Remote Sensing. IEEE Trans. Geosci. Remote Sens. 1983, GE-22, 546–549. [Google Scholar] [CrossRef]
- Kandpal, L.M.; Tewari, J.; Gopinathan, N.; Boulas, P.; Cho, B.K. In-Process Control Assay of Pharmaceutical Microtablets Using Hyperspectral Imaging Coupled with Multivariate Analysis. Anal. Chem. 2016, 88, 11055–11061. [Google Scholar] [CrossRef] [Scilit]
- Ortega, S.; Fabelo, H.; Iakovidis, D.K.; Koulaouzidis, A.; Callico, G.M. Use of Hyperspectral/Multispectral Imaging in Gastroenterology. Shedding Some–Different–Light into the Dark. J. Clin. Med. 2019, 8, 36. [Google Scholar] [CrossRef] [Scilit]
- Mariotti, K.d.C.; Ortiz, R.S.; Ferrão, M.F. Hyperspectral Imaging in Forensic Science: An Overview of Major Application Areas. Sci. Justice 2023, 63, 387–395. [Google Scholar] [CrossRef] [Scilit]
- Zapata, F.; López-López, M.; Amigo, J.M.; García-Ruiz, C. Multi-Spectral Imaging for the Estimation of Shooting Distances. Forensic Sci. Int. 2018, 282, 80–85. [Google Scholar] [CrossRef] [Scilit]
- Del Pozo, S.; Rodríguez-Gonzálvez, P.; Sánchez-Aparicio, L.J.; Muñoz-Nieto, A.; Hernández-López, D.; Felipe-García, B.; González-Aguilera, D. Multispectral Imaging in Cultural Heritage Conservation. Int. Arch. Photogramm. Remote Sens. Spat. Inf. Sci. 2017, XLII-2-W5, 155–162. [Google Scholar] [CrossRef] [Scilit]
- Picollo, M.; Cucci, C.; Casini, A.; Stefani, L. Hyper-Spectral Imaging Technique in the Cultural Heritage Field: New Possible Scenarios. Sensors 2020, 20, 2843. [Google Scholar] [CrossRef] [Scilit]
- Palmieri, R.; Gasbarrone, R.; Fiore, L. Hyperspectral Imaging for Sustainable Waste Recycling. Sustainability 2023, 15, 7752. [Google Scholar] [CrossRef] [Scilit]
- Shiddiq, M.; Arief, D.S.; Zulfansyah; Fatimah, K.; Wahyudi, D.; Mahmudah, D.A.; Putri, D.K.E.; Husein, I.R.; Ningsih, S.A. Plastic and Organic Waste Identification Using Multispectral Imaging. Mater. Today Proc. 2023, 87, 338–344. [Google Scholar] [CrossRef] [Scilit]
- Cheng, J.H.; Sun, D.W. Hyperspectral Imaging as an Effective Tool for Quality Analysis and Control of Fish and Other Seafoods: Current Research and Potential Applications. Trends Food Sci. Technol. 2014, 37, 78–91. [Google Scholar] [CrossRef] [Scilit]
- Feng, C.H.; Makino, Y.; Oshita, S.; García Martín, J.F. Hyperspectral Imaging and Multispectral Imaging as the Novel Techniques for Detecting Defects in Raw and Processed Meat Products: Current State-of-the-Art Research Advances. Food Control 2018, 84, 165–176. [Google Scholar] [CrossRef] [Scilit]
- Boelt, B.; Shrestha, S.; Salimi, Z.; Jorgensen, J.R.; Nicolaisen, M.; Carstensen, J.M. Multispectral Imaging—A New Tool in Seed Quality Assessment? Seed Sci. Res. 2018, 28, 222–228. [Google Scholar] [CrossRef] [Scilit]
- Ravikanth, L.; Singh, C.B.; Jayas, D.S.; White, N.D.G. Classification of Contaminants from Wheat Using Near-Infrared Hyperspectral Imaging. Biosyst. Eng. 2015, 135, 73–86. [Google Scholar] [CrossRef] [Scilit]
- Gaikwad, S.; Tidke, S. Multi-Spectral Imaging for Fruits and Vegetables. Int. J. Adv. Comput. Sci. Appl. 2022, 13, 743–760. [Google Scholar] [CrossRef] [Scilit]
- Lorente, D.; Aleixos, N.; Gómez-Sanchis, J.; Cubero, S.; García-Navarrete, O.L.; Blasco, J. Recent Advances and Applications of Hyperspectral Imaging for Fruit and Vegetable Quality Assessment. Food Bioprocess Technol. 2011, 5, 1121–1142. [Google Scholar] [CrossRef] [Scilit]
- Ferrari, V.; Calvini, R.; Menozzi, C.; Ulrici, A.; Bragolusi, M.; Piro, R.; Tata, A.; Suman, M.; Foca, G. Addressing Adulteration Challenges of Dried Oregano Leaves by NIR HyperSpectral Imaging. Chemom. Intell. Lab. Syst. 2024, 249, 105133. [Google Scholar] [CrossRef] [Scilit]
- Oliveira, M.M.; Cruz-Tirado, J.P.; Barbin, D.F. Nontargeted Analytical Methods as a Powerful Tool for the Authentication of Spices and Herbs: A Review. Compr. Rev. Food Sci. Food Saf. 2019, 18, 670–689. [Google Scholar] [CrossRef] [Scilit]
- Baiano, A. Applications of Hyperspectral Imaging for Quality Assessment of Liquid Based and Semi-Liquid Food Products: A Review. J. Food Eng. 2017, 214, 10–15. [Google Scholar] [CrossRef] [Scilit]
- Nogueira Martins, R.; de Assis de Carvalho Pinto, F.; Marçal de Queiroz, D.; Sárvio Magalhães Valente, D.; Tadeu Fim Rosas, J.; Fagundes Portes, M.; Sânzio Aguiar Cerqueira, E. Digital Mapping of Coffee Ripeness Using UAV-Based Multispectral Imagery. Comput. Electron. Agric. 2023, 204, 107499. [Google Scholar] [CrossRef] [Scilit]
- Castro, W.; Oblitas, J.; Maicelo, J.; Avila-George, H. Evaluation of Expert Systems Techniques for Classifying Different Stages of Coffee Rust Infection in Hyperspectral Images. Int. J. Comput. Intell. Syst. 2018, 11, 86–100. [Google Scholar] [CrossRef] [Scilit]
- Soares, A.d.S.; Vieira, B.S.; Bezerra, T.A.; Martins, G.D.; Siquieroli, A.C.S. Early Detection of Coffee Leaf Rust Caused by Hemileia Vastatrix Using Multispectral Images. Agronomy 2022, 12, 2911. [Google Scholar] [CrossRef] [Scilit]
- Chen, S.Y.; Chiu, M.F.; Zou, X.W. Real-Time Defect Inspection of Green Coffee Beans Using NIR Snapshot Hyperspectral Imaging. Comput. Electron. Agric. 2022, 197, 106970. [Google Scholar] [CrossRef] [Scilit]
- Oliveri, P.; Malegori, C.; Casale, M.; Tartacca, E.; Salvatori, G. An Innovative Multivariate Strategy for HSI-NIR Images to Automatically Detect Defects in Green Coffee. Talanta 2019, 199, 270–276. [Google Scholar] [CrossRef] [Scilit]
- Caporaso, N.; Whitworth, M.B.; Grebby, S.; Fisk, I.D. Non-Destructive Analysis of Sucrose, Caffeine and Trigonelline on Single Green Coffee Beans by Hyperspectral Imaging. Food Res. Int. 2018, 106, 193–203. [Google Scholar] [CrossRef] [Scilit]
- Zhang, C.; Jiang, H.; Liu, F.; He, Y. Application of Near-Infrared Hyperspectral Imaging with Variable Selection Methods to Determine and Visualize Caffeine Content of Coffee Beans. Food Bioprocess Technol. 2016, 10, 213–221. [Google Scholar] [CrossRef] [Scilit]
- Chu, B.; Yu, K.; Zhao, Y.; He, Y. Development of Noninvasive Classification Methods for Different Roasting Degrees of Coffee Beans Using Hyperspectral Imaging. Sensors 2018, 18, 1259. [Google Scholar] [CrossRef] [Scilit]
- Forchetti, D.A.P.; Poppi, R.J. Detection and Quantification of Adulterants in Roasted and Ground Coffee by NIR Hyperspectral Imaging and Multivariate Curve Resolution. Food Anal. Methods 2019, 13, 44–49. [Google Scholar] [CrossRef] [Scilit]
- Sahachairungrueng, W.; Meechan, C.; Veerachat, N.; Thompson, A.K.; Teerachaichayut, S. Assessing the Levels of Robusta and Arabica in Roasted Ground Coffee Using NIR Hyperspectral Imaging and FTIR Spectroscopy. Foods 2022, 11, 3122. [Google Scholar] [CrossRef] [Scilit]
- Calvini, R.; Foca, G.; Ulrici, A. Data Dimensionality Reduction and Data Fusion for Fast Characterization of Green Coffee Samples Using Hyperspectral Sensors. Anal. Bioanal. Chem. 2016, 408, 7351–7366. [Google Scholar] [CrossRef] [Scilit]
- Calvini, R.; Ulrici, A.; Amigo, J.M. Practical Comparison of Sparse Methods for Classification of Arabica and Robusta Coffee Species Using near Infrared Hyperspectral Imaging. Chemom. Intell. Lab. Syst. 2015, 146, 503–511. [Google Scholar] [CrossRef] [Scilit]
- Calvini, R.; Amigo, J.M.; Ulrici, A. Transferring Results from NIR-Hyperspectral to NIR-Multispectral Imaging Systems: A Filter-Based Simulation Applied to the Classification of Arabica and Robusta Green Coffee. Anal. Chim. Acta 2017, 967, 33–41. [Google Scholar] [CrossRef] [Scilit]
- Caporaso, N.; Whitworth, M.B.; Grebby, S.; Fisk, I.D. Rapid Prediction of Single Green Coffee Bean Moisture and Lipid Content by Hyperspectral Imaging. J. Food Eng. 2018, 227, 18–29. [Google Scholar] [CrossRef] [Scilit]
- Mihailova, A.; Liebisch, B.; Islam, M.D.; Carstensen, J.M.; Cannavan, A.; Kelly, S.D. The Use of Multispectral Imaging for the Discrimination of Arabica and Robusta Coffee Beans. Food Chem. X 2022, 14, 100325. [Google Scholar] [CrossRef] [Scilit]
- Gomes, W.P.C.; Gonçalves, L.; da Silva, C.B.; Melchert, W.R. Application of Multispectral Imaging Combined with Machine Learning Models to Discriminate Special and Traditional Green Coffee. Comput. Electron. Agric. 2022, 198, 107097. [Google Scholar] [CrossRef] [Scilit]
- Sim, J.; Dixit, Y.; Mcgoverin, C.; Oey, I.; Frew, R.; Reis, M.M.; Kebede, B. Machine Learning-Driven Hyperspectral Imaging for Non-Destructive Origin Verification of Green Coffee Beans Across Continents, Countries, and Regions. Food Control 2024, 156, 110159. [Google Scholar] [CrossRef] [Scilit]
- Zhang, C.; Liu, F.; He, Y. Identification of Coffee Bean Varieties Using Hyperspectral Imaging: Influence of Preprocessing Methods and Pixel-Wise Spectra Analysis. Sci. Rep. 2018, 8, 2166. [Google Scholar] [CrossRef] [Scilit]
- Amigo, J.M.; Grassi, S. Configuration of Hyperspectral and Multispectral Imaging Systems. Data Handl. Sci. Technol. 2019, 32, 17–34. [Google Scholar] [CrossRef] [Scilit]
- Ding, Y.; Zeng, R.; Jiang, H.; Guan, X.; Jiang, Q.; Song, Z. Classification of Tea Quality Grades Based on Hyperspectral Imaging Spatial Information and Optimization Models. J. Food Meas. Charact. 2024, 18, 9098–9112. [Google Scholar] [CrossRef] [Scilit]
- Huang, M.; He, C.; Zhu, Q.; Qin, J. Maize Seed Variety Classification Using the Integration of Spectral and Image Features Combined with Feature Transformation Based on Hyperspectral Imaging. Appl. Sci. 2016, 6, 183. [Google Scholar] [CrossRef] [Scilit]
- Wang, L.; Liu, D.; Pu, H.; Sun, D.W.; Gao, W.; Xiong, Z. Use of Hyperspectral Imaging to Discriminate the Variety and Quality of Rice. Food Anal. Methods 2014, 8, 515–523. [Google Scholar] [CrossRef] [Scilit]
- Ballabio, D.; Consonni, V. Classification Tools in Chemistry. Part 1: Linear Models. PLS-DA. Anal. Methods 2013, 5, 3790–3798. [Google Scholar] [CrossRef] [Scilit]
- Brereton, R.G.; Lloyd, G.R. Support Vector Machines for Classification and Regression. Analyst 2010, 135, 230–267. [Google Scholar] [CrossRef] [Scilit]
- Bylesjö, M.; Rantalainen, M.; Cloarec, O.; Nicholson, J.K.; Holmes, E.; Trygg, J. OPLS Discriminant Analysis: Combining the Strengths of PLS-DA and SIMCA Classification. J. Chemom. 2006, 20, 341–351. [Google Scholar] [CrossRef] [Scilit]


| Species | Variety | Bean Condition | Physical Form | Geographical Origin | Equipment | Ref. |
|---|---|---|---|---|---|---|
| C. arabica | Harari, Khawlani, Nabari, Laqamt, and Bariah | Roasted and green | Whole | Saudi Arabia | Smartphone iPhone 14 | [33] |
| C. canephora (Robusta) | Amazonian Robusta | Roasted | Ground | Rondonia, Brazil | Smartphone Redmi Note 11 | [17] |
| -C. canephora (Robusta) -C. arabica | Not specified | Roasted | Powdered (instant coffee) | -South Bahia and Espirito Santo, Brazil -undeclared provenance | Scanner HP Deskjet 2540 | [16] |
| -C. arabica -C. canephora (Robusta) -C. liberica | Not specified Robusta Excelsa | Roasted and green | Whole | Not specified | Not specified | [34] |
| C. arabica | Harrar, Jimma, Limu, Sidama, Wellega | Green | Whole | Ethiopia | Not specified | [35] |
| -C. arabica -C. canephora (Robusta) -C. liberica | Not specified Robusta Excelsa | Roasted | Whole | Indonesia | Smartphone (Sony a6000) | [15] |
| -C. canephora (Robusta) -C. arabica | Not specified | Green | Whole | Indonesia | Andromax A mobile camera | [7] |
| C. arabica | Logan and regular | Green | Whole | Indonesia | Nikon Coolpix A10 camera | [36] |
| Resolution and the Selected Area (pixel) | Illumination Setup | Shape Features | Color Coordinate | Color and Texture Features | Image Pre-Treatment | Raw Image Processing | Ref. |
|---|---|---|---|---|---|---|---|
| 12 MP 265 × 265 | LED lightbox and sunlight | None | Grayscale | RGB features automatically extracted by CNN | Crop and flip | Grayscale conversion, background removal, binarization, hole filling, noise removal (bwareaopen) | [33] |
| 50 MP 8165 × 6124 | Studio black box with white LED strips (6500 K) | None | RGB | Average RGB histograms | None | Select ROI and acquisition of the RGB histogram | [17] |
| 600 dpi 250 × 250 | Not Specified | None | Grayscale, RGB, HSV | Grayscale, RGB, HSV, and (Grayscale + RGB + HSV) | Crop | Select ROI and acquisition of the RGB histogram | [16] |
| N.S. 150 × 150 | Not Specified | Shape features automatically extracted by CNN | RGB | RGB features automatically extracted by CNN | Not Specified | Not Specified | [34] |
| 12 MP + 5 MP Dual rear camera 360 × 360 | Not Specified | Shape features automatically extracted by CNN, HOG, and CNN + HOG | RGB and Grayscale | Color features automatically extracted by CNN, HOG, and CNN + HOG | Thresholding and K-means algorithms for image segmentation. | Image resizing, filtering, contrast enhancement, noise removal, grayscale conversion, and segmentation | [35] |
| 12 MP 640 × 480 | Studio minibox with LED | Area, perimeter, length, width, equivalent diameter, aspect ratio, ratio of the equivalent ellipse axis, eccentricity, compactness, the Heywood circularity factor, extent, solidity, and arc | Grayscale | none | Resized the original images from 6000 × 3376 to 640 × 480 pixels | Select ROI and gray-scaling, and histogram equalization of images, and “Gain ratio” | [15] |
| 3.5 MP 1000 × 1000 | Not Specified | None | Grayscale | Energy, Correlation, Homogeneity, Contrast | Crop | Grayscale | [7] |
| 16 MP 1343 × 1349 | Consistent lighting conditions via constant fluorescent | None | Gray, HSL, HSV, and L*a*b* | Blue_Mean, Hue_Entropy, Gray_Inverse, S_HSL_Correlation, and Green_Cluster. | Crop | None | [36] |
| Number of Samples/Images | Classification Task | Classification Algorithm | Cross-Validation | Model Optimization | External Validation | Model Performance | Ref. |
|---|---|---|---|---|---|---|---|
| N.S./12,310 (four different roast levels of five C. arabica varieties: Harari: 2529, Bariah: 2902, Khowlani: 2346, Legamti: 2015, Nabari: 2518) | Classify the 5 varieties among 4 roasting levels | CNN (SqueezeNet) and Vision Transformer enhancement | K-fold CV with k = 6, maximization of model’s accuracy, recall, precision, and F1 scores | A validation dataset composed of 20% of the images for hyperparameter training, minimizing validation loss | A test set validation of 10% of the dataset images | Overall accuracy 78%; 78% recall, 77% precision, 76% F1 score | [33] |
| 300 samples (100 indigenous Amazonian C. canephora, 100 C. canephora, conilon, and 100 adulterated coffees (one image per sample) | Authentication of indigenous C. canephora against C. canephora, conilon and adulterated indigenous coffee | DD-SIMCA | Procrustes cross-validation and optimizing the sensitivity of cross-validation and test models | - | Prediction of the 200 external samples (100 C. canephora, conilon, 100 adulterated indigenous C. canephora) | Sensitivity: 98%; Specificity against C. canephora, conilon: 95%; Specificity against adulterated indigenous C. canephora: 95% | [17] |
| 90 samples (30 C. canephora from Southern Bahia, 30 C. canephora from Espirito Santo, 30 coffees of undeclared provenance) /3 images per sample | Authentication of Southern Bahia C. canephora against Espirito Santo C. canephora/discrimination between Espirito Santo and undeclared provenance samples | DD-SIMCA and PLS-DA | for DD-SIMCA: maximization of TP rate/for PLS-DA: LOO-CV and minimization of RMSECV | - | Test set composed of 33% of the dataset selected by Kennard Stone algorithm | For DD-SIMCA, 100% sensitivity; 100% efficiency/for PLS-DA, 100% accuracy | [16] |
| N.S./200 images (four species, 50 images per class) | Classification of four different coffee species | CNN (basic architecture) | 10-fold CV with 20% of the data in the deletion groups | Adam optimizer used to minimize the loss function | No external validation informed | Overall: 84% accuracy 86% precision, 84.1% recall and 84.1% F1-Score | [34] |
| N.S./600 images augmented to 1200. From five C. arabica varieties (240 of each): Harar, Jimma, Limu, Sidama, Wellega | Classification of the 5 varieties | Deep learning models for feature extraction and SVM | Not clearly described | Not clearly described | A test set of 20% of the dataset was separated | SVM: 97.5% accuracy | [35] |
| N.S./400 images in total. From four species (Arabica, Excelsa, Liberica, Robusta), 100 images of each | Discrimination between the four coffee species | Naïve Bayes, ANN, SVM, C.45 and decision tree | 10-fold CV | Not clearly described | No external validation informed | For cross-validation set: decision tree; Precision: 99.5%; Recall 99.5%; Accuracy 99.5% | [15] |
| N.S./58 images (29 from C. arabica and 29 from C. canephora) | Discrimination between C. arabica and C. canephora coffees | SVM, Decision tree, Logistic Regression, Naive Bayes | 10-fold CV | Not clearly described | No external validation informed | For the cross-validation: SVM F1: 98.3%; Precision: 98.3%; Recall: 98.3% | [7] |
| N.S./528 images among 4 purity levels | Discriminate purity levels of Palm Civet Coffee | K-NN, Random forest, and SVM | 5-fold CV for K-NN | Manually assaying several parameters to find the optimal classification accuracy | The test set composed of randomly selected 30% of the data. | Using a Random Forest with Grey Wolf Optimizer: Accuracy 98.10% | [36] |
| Number of Images | Instrumental Technique | Illumination Setup | Spatial Resolution (pixels) | Spectral Range (nm) | Number of Wavelengths | Extracted/Selected Features | Raw Data Processing | Data Pretreatment | Ref. |
|---|---|---|---|---|---|---|---|---|---|
| 370 | HSI line scan | Integrating cylinder + halogen lamps | 320 × 256 | 955–1700 | 150 |
| Conversion into reflectance values, internal calibration to reduce variability over time, and background removal |
| [101] |
| 396 | HSI line scan | Not specified | 320 × 256 | 955–1700 | 150 |
| Conversion into reflectance values, internal calibration to reduce variability over time, and background removal | SNV + first derivative + mean centering | [102] |
| 396 | HSI line scan | Not specified | 320 × 256 | 955–1700 | 150, then MSI simulation with 4 selected wavelengths: 1150 nm, 1200 nm, 1250 nm, 1400 nm |
| Conversion into reflectance values, internal calibration to reduce variability over time, and background removal | Autoscaling | [103] |
| Not specified | HSI line scan | Two 500 W incandescent lamps | 320 × 256 | 980–2500 | 256 |
| Bad pixels and spikes removal, segmentation to select each bean | Several pretreatments tested: SNV, first and second derivative, MSC, detrending, normalization | [104] |
| 175 | MSI plane scan | Strobed LEDs at 19 wavelengths | 2992 × 2992 | 365–970 | 19 wavelengths: 365, 405, 430, 450, 470, 490, 515, 540, 570, 590, 630, 645, 660, 690, 780, 850, 880, 940, 970 nm |
|
| SNV + autoscaling | [105] |
| Not specified | MSI plane scan | Strobed LEDs at 19 wavelengths | 2192 × 2192 |
|
|
|
| Autoscaling | [106] |
| 72 | HSI line scan | 150 W tungsten halogen lamp | 320 for each line | 700–1700 | 235 before removing wavelengths from 550 nm to 700 nm |
| Conversion into reflectance values, background removal, division of each image into 50 super-pixels | Several row-wise pretreatments tested (MSC, SNV, first and second derivative, smoothing) + mean centering | [107] |
| 24 | HSI line scan | Two 150 W tungsten halogen lamps | 320 × 256 | 874–1734 nm | 172 |
| Conversion into reflectance values and background removal |
| [108] |
Disclaimer/Publisher’s Note: The statements, opinions and data contained in all publications are solely those of the individual author(s) and contributor(s) and not of MDPI and/or the editor(s). MDPI and/or the editor(s) disclaim responsibility for any injury to people or property resulting from any ideas, methods, instructions or products referred to in the content. |
© 2026 by the authors. Licensee MDPI, Basel, Switzerland. This article is an open access article distributed under the terms and conditions of the Creative Commons Attribution (CC BY) license.
Share and Cite
Tessaro, L.; Mutz, Y.d.S.; Orsolini, D.; Calvini, R.; Souza, N.d.O.; Silva, G.M.; Ulrici, A.; Nunes, C.A. A Systematic Review of Imaging Techniques for the Botanical and Geographical Classification of Coffee. Foods 2026, 15, 821. https://doi.org/10.3390/foods15050821
Tessaro L, Mutz YdS, Orsolini D, Calvini R, Souza NdO, Silva GM, Ulrici A, Nunes CA. A Systematic Review of Imaging Techniques for the Botanical and Geographical Classification of Coffee. Foods. 2026; 15(5):821. https://doi.org/10.3390/foods15050821
Chicago/Turabian StyleTessaro, Leticia, Yhan da Silva Mutz, Davide Orsolini, Rosalba Calvini, Natália de Oliveira Souza, Giulia Mitestainer Silva, Alessandro Ulrici, and Cleiton Antônio Nunes. 2026. "A Systematic Review of Imaging Techniques for the Botanical and Geographical Classification of Coffee" Foods 15, no. 5: 821. https://doi.org/10.3390/foods15050821
APA StyleTessaro, L., Mutz, Y. d. S., Orsolini, D., Calvini, R., Souza, N. d. O., Silva, G. M., Ulrici, A., & Nunes, C. A. (2026). A Systematic Review of Imaging Techniques for the Botanical and Geographical Classification of Coffee. Foods, 15(5), 821. https://doi.org/10.3390/foods15050821